
|
|||||
|
 | |
| |
| |
| |
| |
| |
|
Gene: ALKBH4 |
Gene summary for ALKBH4 |
| Gene information | Species | Human | Gene symbol | ALKBH4 | Gene ID | 54784 |
| Gene name | alkB homolog 4, lysine demethylase | |
| Gene Alias | ABH4 | |
| Cytomap | 7q22.1 | |
| Gene Type | protein-coding | GO ID | GO:0000910 | UniProtAcc | Q9NXW9 |
Top |
Malignant transformation analysis |
| Identification of the aberrant gene expression in precancerous and cancerous lesions by comparing the gene expression of stem-like cells in diseased tissues with normal stem cells |
| Entrez ID | Symbol | Replicates | Species | Organ | Tissue | Adj P-value | Log2FC | Malignancy |
| 54784 | ALKBH4 | P24T-E | Human | Esophagus | ESCC | 3.60e-13 | 2.43e-01 | 0.1287 |
| 54784 | ALKBH4 | P26T-E | Human | Esophagus | ESCC | 4.29e-31 | 4.54e-01 | 0.1276 |
| 54784 | ALKBH4 | P27T-E | Human | Esophagus | ESCC | 6.01e-25 | 5.28e-01 | 0.1055 |
| 54784 | ALKBH4 | P28T-E | Human | Esophagus | ESCC | 3.95e-30 | 4.96e-01 | 0.1149 |
| 54784 | ALKBH4 | P30T-E | Human | Esophagus | ESCC | 7.36e-10 | 3.77e-01 | 0.137 |
| 54784 | ALKBH4 | P31T-E | Human | Esophagus | ESCC | 2.29e-27 | 3.95e-01 | 0.1251 |
| 54784 | ALKBH4 | P32T-E | Human | Esophagus | ESCC | 1.59e-30 | 5.01e-01 | 0.1666 |
| 54784 | ALKBH4 | P36T-E | Human | Esophagus | ESCC | 5.79e-10 | 3.31e-01 | 0.1187 |
| 54784 | ALKBH4 | P37T-E | Human | Esophagus | ESCC | 6.45e-10 | 2.46e-01 | 0.1371 |
| 54784 | ALKBH4 | P38T-E | Human | Esophagus | ESCC | 4.01e-05 | 2.76e-01 | 0.127 |
| 54784 | ALKBH4 | P39T-E | Human | Esophagus | ESCC | 9.44e-07 | 1.53e-01 | 0.0894 |
| 54784 | ALKBH4 | P42T-E | Human | Esophagus | ESCC | 2.47e-17 | 4.42e-01 | 0.1175 |
| 54784 | ALKBH4 | P44T-E | Human | Esophagus | ESCC | 7.20e-03 | 1.23e-01 | 0.1096 |
| 54784 | ALKBH4 | P47T-E | Human | Esophagus | ESCC | 9.56e-08 | 1.59e-01 | 0.1067 |
| 54784 | ALKBH4 | P48T-E | Human | Esophagus | ESCC | 9.21e-09 | 1.87e-01 | 0.0959 |
| 54784 | ALKBH4 | P49T-E | Human | Esophagus | ESCC | 1.91e-08 | 6.58e-01 | 0.1768 |
| 54784 | ALKBH4 | P52T-E | Human | Esophagus | ESCC | 7.52e-23 | 3.61e-01 | 0.1555 |
| 54784 | ALKBH4 | P54T-E | Human | Esophagus | ESCC | 1.71e-14 | 3.68e-01 | 0.0975 |
| 54784 | ALKBH4 | P56T-E | Human | Esophagus | ESCC | 9.07e-11 | 9.58e-01 | 0.1613 |
| 54784 | ALKBH4 | P57T-E | Human | Esophagus | ESCC | 1.88e-11 | 2.07e-01 | 0.0926 |
| Page: 1 2 3 4 |
| Tissue | Expression Dynamics | Abbreviation |
| Esophagus | 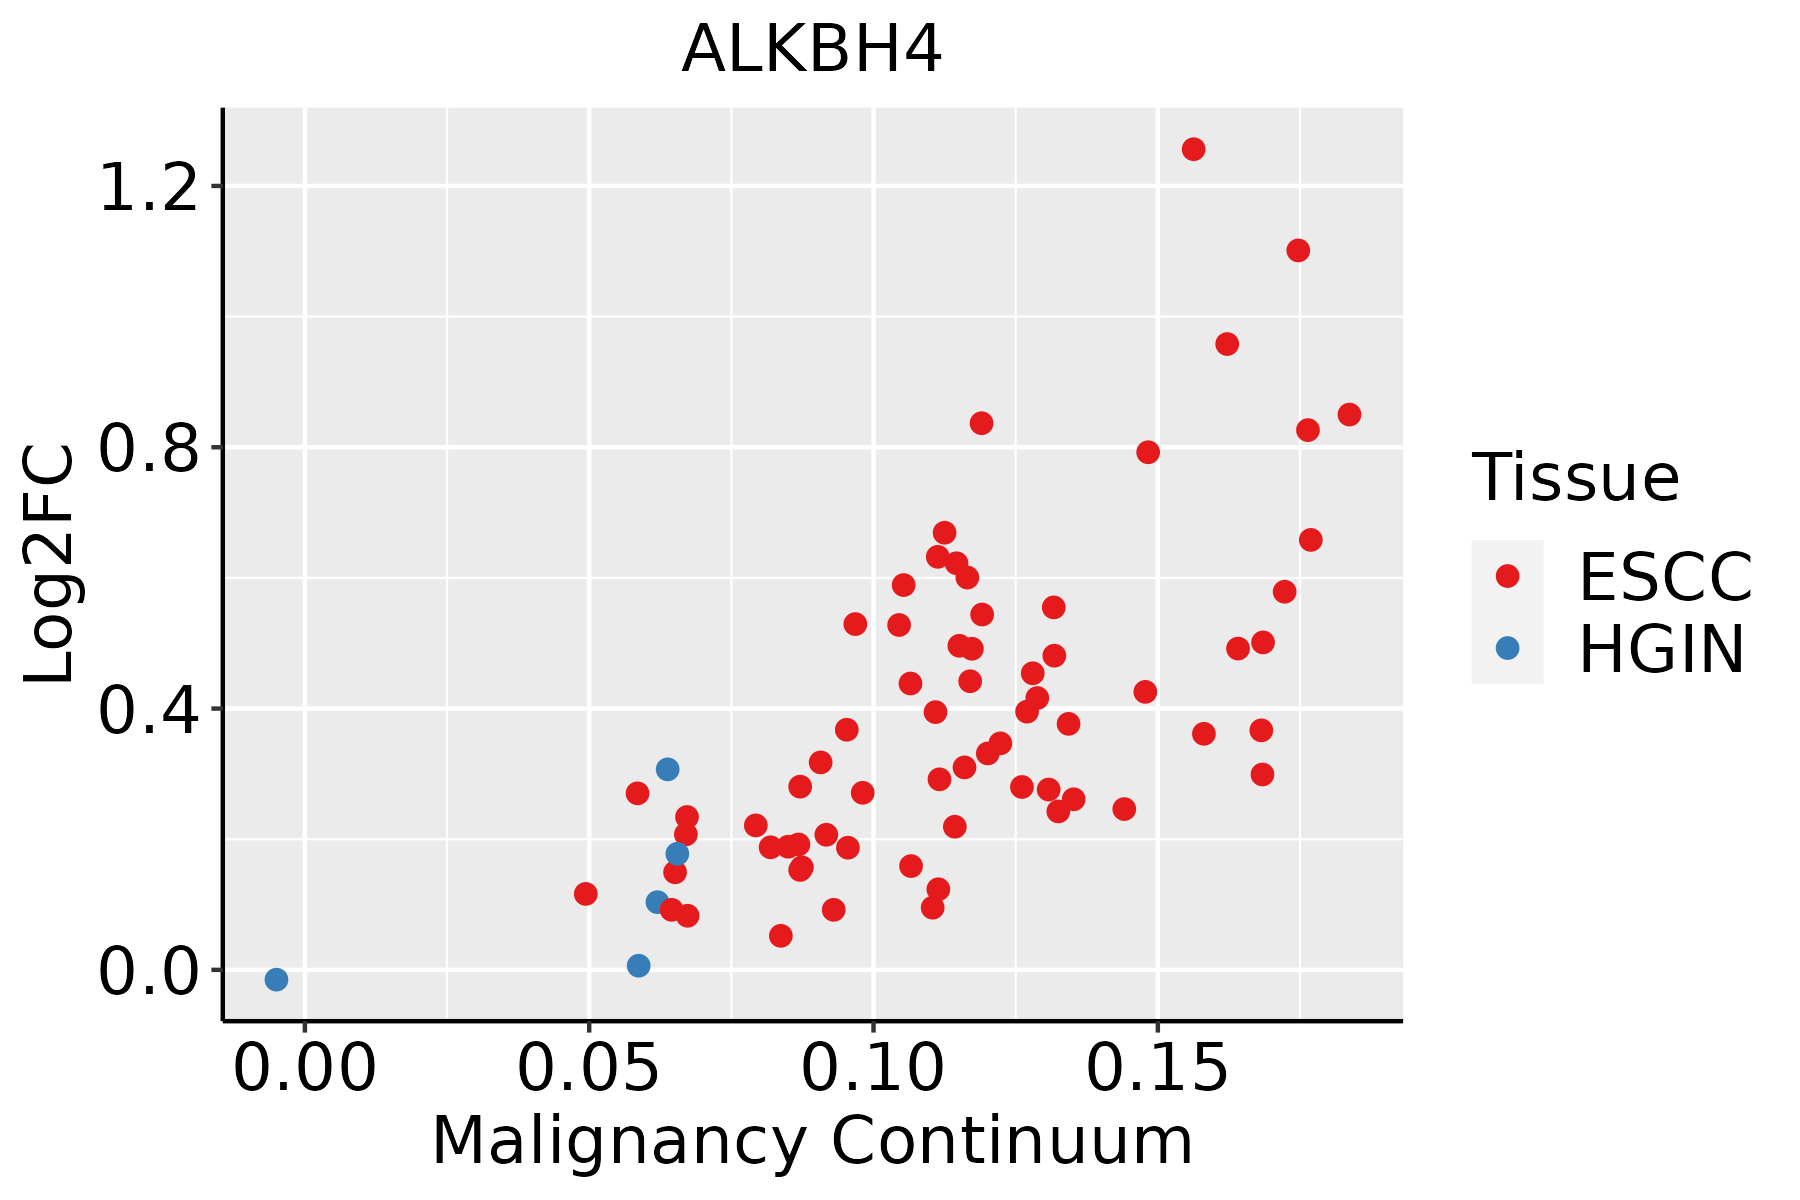 | ESCC: Esophageal squamous cell carcinoma |
| HGIN: High-grade intraepithelial neoplasias | ||
| LGIN: Low-grade intraepithelial neoplasias | ||
| Liver | 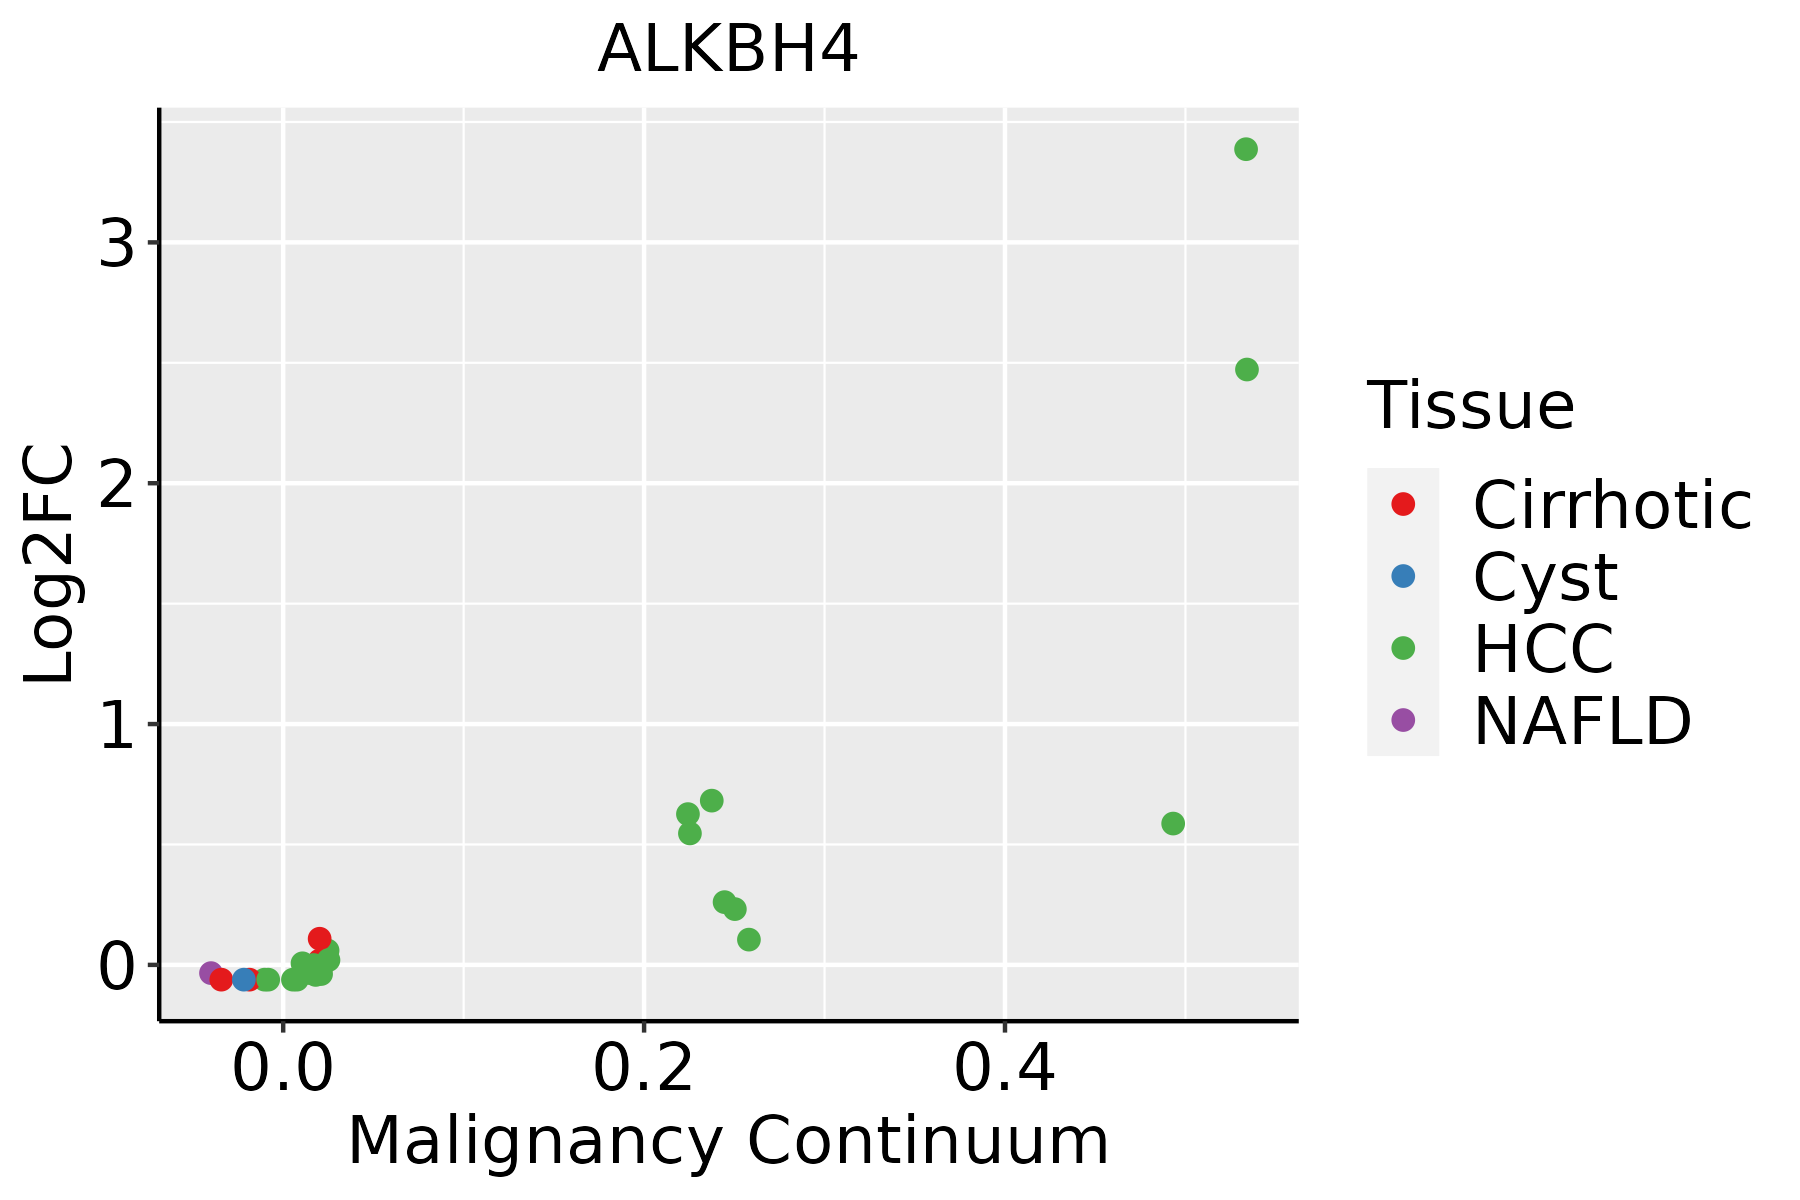 | HCC: Hepatocellular carcinoma |
| NAFLD: Non-alcoholic fatty liver disease | ||
| Oral Cavity |  | EOLP: Erosive Oral lichen planus |
| LP: leukoplakia | ||
| NEOLP: Non-erosive oral lichen planus | ||
| OSCC: Oral squamous cell carcinoma |
| ∗log2FC in expression of this searched gene in stem-like cells from each diseased tissue sample relative to stem-like cells in normal samples in each tissue plotted against the malignancy continuum. Samples are colored based on if they are from different disease stage. |
Top |
Malignant transformation related pathway analysis |
| Find out the enriched GO biological processes and KEGG pathways involved in transition from healthy to precancer to cancer |
| Tissue | Disease Stage | Enriched GO biological Processes |
| Colorectum | AD |  |
| Colorectum | SER |  |
| Colorectum | MSS |  |
| Colorectum | MSI-H |  |
| Colorectum | FAP |  |
| ∗Top 15 enriched GO BP terms are showed in the bar plot of each disease state in each tissue. Each row represents a significant GO biological process which is colored according to the -log10(p.adjust). |
| Page: 1 2 3 4 5 6 7 8 9 |
| GO ID | Tissue | Disease Stage | Description | Gene Ratio | Bg Ratio | pvalue | p.adjust | Count |
| GO:003250614 | Esophagus | ESCC | cytokinetic process | 35/8552 | 39/18723 | 9.38e-09 | 1.90e-07 | 35 |
| GO:000091016 | Esophagus | ESCC | cytokinesis | 115/8552 | 173/18723 | 2.48e-08 | 4.68e-07 | 115 |
| GO:000632517 | Esophagus | ESCC | chromatin organization | 240/8552 | 409/18723 | 6.52e-08 | 1.14e-06 | 240 |
| GO:006164015 | Esophagus | ESCC | cytoskeleton-dependent cytokinesis | 72/8552 | 100/18723 | 8.10e-08 | 1.39e-06 | 72 |
| GO:00064824 | Esophagus | ESCC | protein demethylation | 24/8552 | 33/18723 | 1.50e-03 | 7.06e-03 | 24 |
| GO:00082144 | Esophagus | ESCC | protein dealkylation | 24/8552 | 33/18723 | 1.50e-03 | 7.06e-03 | 24 |
| GO:003103219 | Esophagus | ESCC | actomyosin structure organization | 108/8552 | 196/18723 | 4.86e-03 | 1.88e-02 | 108 |
| GO:0006304 | Esophagus | ESCC | DNA modification | 68/8552 | 120/18723 | 9.95e-03 | 3.42e-02 | 68 |
| GO:19022751 | Esophagus | ESCC | regulation of chromatin organization | 22/8552 | 33/18723 | 1.22e-02 | 4.08e-02 | 22 |
| GO:003103212 | Liver | Cirrhotic | actomyosin structure organization | 74/4634 | 196/18723 | 3.39e-05 | 4.17e-04 | 74 |
| GO:00325063 | Liver | Cirrhotic | cytokinetic process | 21/4634 | 39/18723 | 9.13e-05 | 9.74e-04 | 21 |
| GO:00009105 | Liver | Cirrhotic | cytokinesis | 62/4634 | 173/18723 | 7.13e-04 | 5.33e-03 | 62 |
| GO:00616402 | Liver | Cirrhotic | cytoskeleton-dependent cytokinesis | 38/4634 | 100/18723 | 2.22e-03 | 1.35e-02 | 38 |
| GO:0070989 | Liver | Cirrhotic | oxidative demethylation | 10/4634 | 19/18723 | 8.23e-03 | 3.83e-02 | 10 |
| GO:003250611 | Liver | HCC | cytokinetic process | 32/7958 | 39/18723 | 4.73e-07 | 7.69e-06 | 32 |
| GO:000091011 | Liver | HCC | cytokinesis | 100/7958 | 173/18723 | 3.38e-05 | 3.39e-04 | 100 |
| GO:003103222 | Liver | HCC | actomyosin structure organization | 109/7958 | 196/18723 | 1.39e-04 | 1.13e-03 | 109 |
| GO:006164011 | Liver | HCC | cytoskeleton-dependent cytokinesis | 60/7958 | 100/18723 | 3.09e-04 | 2.20e-03 | 60 |
| GO:000632511 | Liver | HCC | chromatin organization | 206/7958 | 409/18723 | 7.23e-04 | 4.41e-03 | 206 |
| GO:00325065 | Oral cavity | OSCC | cytokinetic process | 33/7305 | 39/18723 | 5.91e-09 | 1.26e-07 | 33 |
| Page: 1 2 |
| Pathway ID | Tissue | Disease Stage | Description | Gene Ratio | Bg Ratio | pvalue | p.adjust | qvalue | Count |
| Page: 1 |
Top |
Cell-cell communication analysis |
| Identification of potential cell-cell interactions between two cell types and their ligand-receptor pairs for different disease states |
| Ligand | Receptor | LRpair | Pathway | Tissue | Disease Stage |
| Page: 1 |
Top |
Single-cell gene regulatory network inference analysis |
| Find out the significant the regulons (TFs) and the target genes of each regulon across cell types for different disease states |
| TF | Cell Type | Tissue | Disease Stage | Target Gene | RSS | Regulon Activity |
| ∗The dot plots of a searched regulon are shown for all cell subpopulations in each disease state of each tissue based on the regulon specific score inferred using pySCENIC and by calculating the average expression. |
| Page: 1 |
Top |
Somatic mutation of malignant transformation related genes |
| Annotation of somatic variants for genes involved in malignant transformation |
| Hugo Symbol | Variant Class | Variant Classification | dbSNP RS | HGVSc | HGVSp | HGVSp Short | SWISSPROT | BIOTYPE | SIFT | PolyPhen | Tumor Sample Barcode | Tissue | Histology | Sex | Age | Stage | Therapy Types | Drugs | Outcome |
| ALKBH4 | deletion | Frame_Shift_Del | novel | c.250delN | p.Glu84LysfsTer37 | p.E84Kfs*37 | Q9NXW9 | protein_coding | TCGA-D8-A27V-01 | Breast | breast invasive carcinoma | Female | <65 | I/II | Hormone Therapy | tamoxiphen | SD | ||
| ALKBH4 | SNV | Missense_Mutation | rs372354272 | c.620C>T | p.Pro207Leu | p.P207L | Q9NXW9 | protein_coding | tolerated(0.1) | benign(0.015) | TCGA-2W-A8YY-01 | Cervix | cervical & endocervical cancer | Female | <65 | I/II | Chemotherapy | cisplatin | CR |
| ALKBH4 | SNV | Missense_Mutation | rs544736620 | c.16N>A | p.Ala6Thr | p.A6T | Q9NXW9 | protein_coding | tolerated_low_confidence(0.15) | benign(0.001) | TCGA-5M-AAT6-01 | Colorectum | colon adenocarcinoma | Female | <65 | III/IV | Unknown | Unknown | PD |
| ALKBH4 | SNV | Missense_Mutation | c.590C>T | p.Ala197Val | p.A197V | Q9NXW9 | protein_coding | tolerated(0.07) | benign(0.18) | TCGA-A6-5665-01 | Colorectum | colon adenocarcinoma | Female | >=65 | I/II | Unknown | Unknown | PD | |
| ALKBH4 | SNV | Missense_Mutation | c.170N>A | p.Gly57Asp | p.G57D | Q9NXW9 | protein_coding | tolerated(0.09) | benign(0.163) | TCGA-AD-6895-01 | Colorectum | colon adenocarcinoma | Male | >=65 | III/IV | Unknown | Unknown | SD | |
| ALKBH4 | SNV | Missense_Mutation | c.518N>T | p.Ala173Val | p.A173V | Q9NXW9 | protein_coding | tolerated(0.59) | benign(0.013) | TCGA-AZ-4615-01 | Colorectum | colon adenocarcinoma | Male | >=65 | III/IV | Chemotherapy | xeloda | PD | |
| ALKBH4 | SNV | Missense_Mutation | rs377627772 | c.134G>A | p.Arg45His | p.R45H | Q9NXW9 | protein_coding | tolerated(0.34) | benign(0) | TCGA-D5-6928-01 | Colorectum | colon adenocarcinoma | Male | >=65 | I/II | Unknown | Unknown | SD |
| ALKBH4 | SNV | Missense_Mutation | c.354N>C | p.Gln118His | p.Q118H | Q9NXW9 | protein_coding | deleterious(0.02) | benign(0.019) | TCGA-AJ-A2QM-01 | Endometrium | uterine corpus endometrioid carcinoma | Female | >=65 | I/II | Chemotherapy | carboplatin | CR | |
| ALKBH4 | SNV | Missense_Mutation | rs371943941 | c.880G>A | p.Ala294Thr | p.A294T | Q9NXW9 | protein_coding | deleterious(0) | possibly_damaging(0.677) | TCGA-AP-A051-01 | Endometrium | uterine corpus endometrioid carcinoma | Female | >=65 | I/II | Unknown | Unknown | SD |
| ALKBH4 | SNV | Missense_Mutation | novel | c.902N>T | p.Pro301Leu | p.P301L | Q9NXW9 | protein_coding | deleterious(0) | possibly_damaging(0.696) | TCGA-AP-A059-01 | Endometrium | uterine corpus endometrioid carcinoma | Female | >=65 | I/II | Unknown | Unknown | SD |
| Page: 1 2 3 4 |
Top |
Related drugs of malignant transformation related genes |
| Identification of chemicals and drugs interact with genes involved in malignant transfromation |
| (DGIdb 4.0) |
| Entrez ID | Symbol | Category | Interaction Types | Drug Claim Name | Drug Name | PMIDs |
| Page: 1 |

Copyright 2023-Present -The University of Texas Health Science Center at Houston |