
|
|||||
|
 | |
| |
| |
| |
| |
| |
|
Gene: AKAP10 |
Gene summary for AKAP10 |
| Gene information | Species | Human | Gene symbol | AKAP10 | Gene ID | 11216 |
| Gene name | A-kinase anchoring protein 10 | |
| Gene Alias | AKAP-10 | |
| Cytomap | 17p11.2 | |
| Gene Type | protein-coding | GO ID | GO:0007154 | UniProtAcc | E7EMD6 |
Top |
Malignant transformation analysis |
| Identification of the aberrant gene expression in precancerous and cancerous lesions by comparing the gene expression of stem-like cells in diseased tissues with normal stem cells |
| Entrez ID | Symbol | Replicates | Species | Organ | Tissue | Adj P-value | Log2FC | Malignancy |
| 11216 | AKAP10 | P22T-E | Human | Esophagus | ESCC | 1.97e-10 | 1.91e-01 | 0.1236 |
| 11216 | AKAP10 | P23T-E | Human | Esophagus | ESCC | 3.15e-15 | 2.06e-01 | 0.108 |
| 11216 | AKAP10 | P24T-E | Human | Esophagus | ESCC | 3.89e-12 | 1.93e-01 | 0.1287 |
| 11216 | AKAP10 | P26T-E | Human | Esophagus | ESCC | 1.88e-04 | 1.35e-01 | 0.1276 |
| 11216 | AKAP10 | P27T-E | Human | Esophagus | ESCC | 2.34e-20 | 1.94e-01 | 0.1055 |
| 11216 | AKAP10 | P28T-E | Human | Esophagus | ESCC | 1.88e-11 | 2.16e-01 | 0.1149 |
| 11216 | AKAP10 | P30T-E | Human | Esophagus | ESCC | 1.43e-09 | 2.66e-01 | 0.137 |
| 11216 | AKAP10 | P31T-E | Human | Esophagus | ESCC | 2.06e-08 | 1.72e-01 | 0.1251 |
| 11216 | AKAP10 | P32T-E | Human | Esophagus | ESCC | 1.76e-12 | 2.32e-01 | 0.1666 |
| 11216 | AKAP10 | P36T-E | Human | Esophagus | ESCC | 3.60e-11 | 3.22e-01 | 0.1187 |
| 11216 | AKAP10 | P37T-E | Human | Esophagus | ESCC | 2.48e-14 | 2.83e-01 | 0.1371 |
| 11216 | AKAP10 | P39T-E | Human | Esophagus | ESCC | 8.56e-12 | 1.89e-01 | 0.0894 |
| 11216 | AKAP10 | P42T-E | Human | Esophagus | ESCC | 1.70e-15 | 2.59e-01 | 0.1175 |
| 11216 | AKAP10 | P44T-E | Human | Esophagus | ESCC | 1.17e-06 | 1.67e-01 | 0.1096 |
| 11216 | AKAP10 | P47T-E | Human | Esophagus | ESCC | 4.44e-08 | 1.53e-01 | 0.1067 |
| 11216 | AKAP10 | P48T-E | Human | Esophagus | ESCC | 4.41e-07 | 1.44e-01 | 0.0959 |
| 11216 | AKAP10 | P49T-E | Human | Esophagus | ESCC | 4.58e-03 | 5.03e-01 | 0.1768 |
| 11216 | AKAP10 | P52T-E | Human | Esophagus | ESCC | 8.83e-12 | 1.74e-01 | 0.1555 |
| 11216 | AKAP10 | P54T-E | Human | Esophagus | ESCC | 2.75e-17 | 2.15e-01 | 0.0975 |
| 11216 | AKAP10 | P56T-E | Human | Esophagus | ESCC | 2.54e-11 | 6.56e-01 | 0.1613 |
| Page: 1 2 3 4 |
| Tissue | Expression Dynamics | Abbreviation |
| Esophagus | 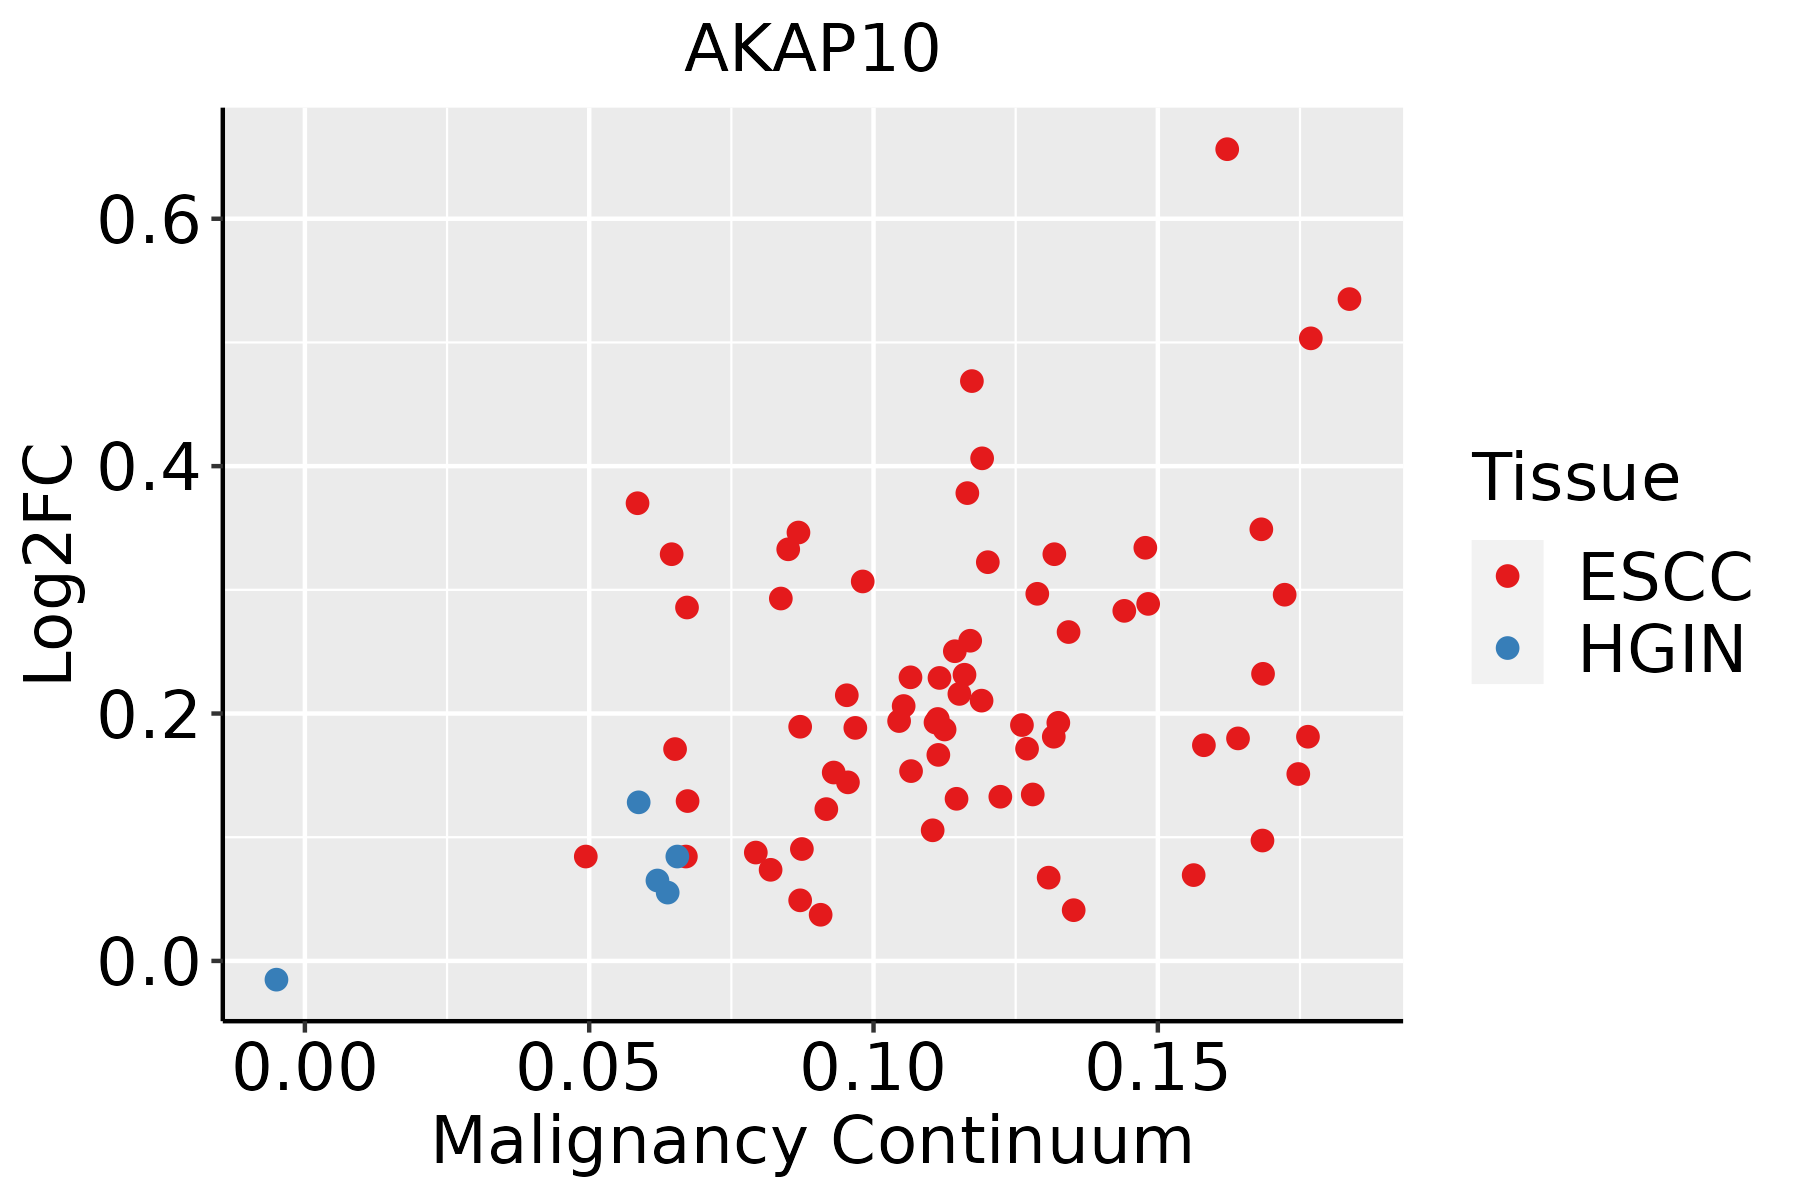 | ESCC: Esophageal squamous cell carcinoma |
| HGIN: High-grade intraepithelial neoplasias | ||
| LGIN: Low-grade intraepithelial neoplasias | ||
| Liver | 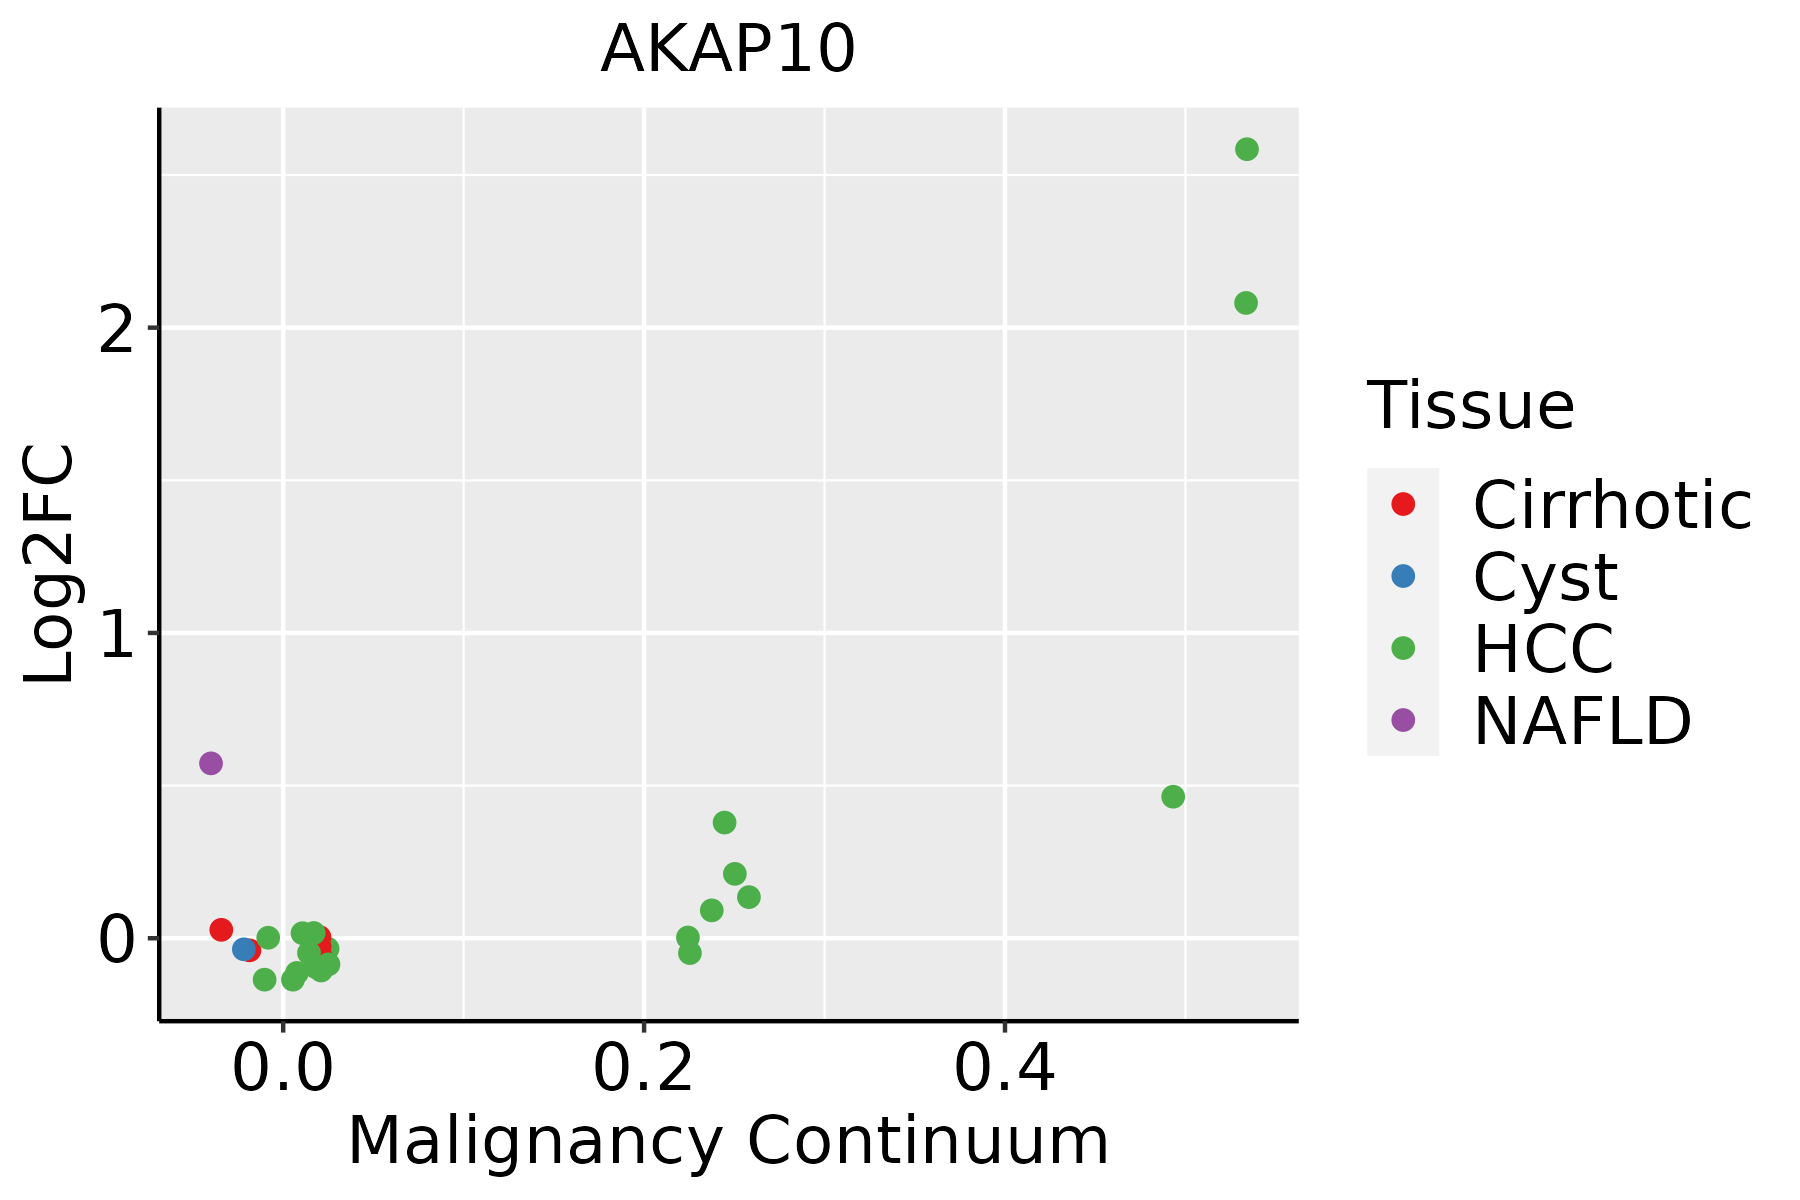 | HCC: Hepatocellular carcinoma |
| NAFLD: Non-alcoholic fatty liver disease |
| ∗log2FC in expression of this searched gene in stem-like cells from each diseased tissue sample relative to stem-like cells in normal samples in each tissue plotted against the malignancy continuum. Samples are colored based on if they are from different disease stage. |
Top |
Malignant transformation related pathway analysis |
| Find out the enriched GO biological processes and KEGG pathways involved in transition from healthy to precancer to cancer |
| Tissue | Disease Stage | Enriched GO biological Processes |
| Colorectum | AD |  |
| Colorectum | SER |  |
| Colorectum | MSS |  |
| Colorectum | MSI-H |  |
| Colorectum | FAP |  |
| ∗Top 15 enriched GO BP terms are showed in the bar plot of each disease state in each tissue. Each row represents a significant GO biological process which is colored according to the -log10(p.adjust). |
| Page: 1 2 3 4 5 6 7 8 9 |
| GO ID | Tissue | Disease Stage | Description | Gene Ratio | Bg Ratio | pvalue | p.adjust | Count |
| Page: 1 |
| Pathway ID | Tissue | Disease Stage | Description | Gene Ratio | Bg Ratio | pvalue | p.adjust | qvalue | Count |
| Page: 1 |
Top |
Cell-cell communication analysis |
| Identification of potential cell-cell interactions between two cell types and their ligand-receptor pairs for different disease states |
| Ligand | Receptor | LRpair | Pathway | Tissue | Disease Stage |
| Page: 1 |
Top |
Single-cell gene regulatory network inference analysis |
| Find out the significant the regulons (TFs) and the target genes of each regulon across cell types for different disease states |
| TF | Cell Type | Tissue | Disease Stage | Target Gene | RSS | Regulon Activity |
| ∗The dot plots of a searched regulon are shown for all cell subpopulations in each disease state of each tissue based on the regulon specific score inferred using pySCENIC and by calculating the average expression. |
| Page: 1 |
Top |
Somatic mutation of malignant transformation related genes |
| Annotation of somatic variants for genes involved in malignant transformation |
| Hugo Symbol | Variant Class | Variant Classification | dbSNP RS | HGVSc | HGVSp | HGVSp Short | SWISSPROT | BIOTYPE | SIFT | PolyPhen | Tumor Sample Barcode | Tissue | Histology | Sex | Age | Stage | Therapy Types | Drugs | Outcome |
| AKAP10 | SNV | Missense_Mutation | rs139686167 | c.1930A>G | p.Ser644Gly | p.S644G | O43572 | protein_coding | tolerated(0.13) | benign(0.058) | TCGA-D8-A1XK-01 | Breast | breast invasive carcinoma | Female | <65 | I/II | Chemotherapy | doxorubicine+cyclophosphamide | SD |
| AKAP10 | SNV | Missense_Mutation | c.1300G>A | p.Asp434Asn | p.D434N | O43572 | protein_coding | deleterious(0) | probably_damaging(1) | TCGA-D8-A27G-01 | Breast | breast invasive carcinoma | Female | >=65 | I/II | Unknown | Unknown | SD | |
| AKAP10 | SNV | Missense_Mutation | c.1552N>A | p.Leu518Met | p.L518M | O43572 | protein_coding | tolerated(0.24) | benign(0) | TCGA-MY-A5BD-01 | Cervix | cervical & endocervical cancer | Female | <65 | I/II | Chemotherapy | cisplatin | CR | |
| AKAP10 | SNV | Missense_Mutation | novel | c.64N>T | p.Ala22Ser | p.A22S | O43572 | protein_coding | tolerated_low_confidence(0.07) | benign(0.097) | TCGA-ZJ-AB0H-01 | Cervix | cervical & endocervical cancer | Female | <65 | III/IV | Unknown | Unknown | SD |
| AKAP10 | SNV | Missense_Mutation | rs778214457 | c.1038A>G | p.Ile346Met | p.I346M | O43572 | protein_coding | deleterious(0.03) | possibly_damaging(0.453) | TCGA-AA-3663-01 | Colorectum | colon adenocarcinoma | Male | <65 | I/II | Unknown | Unknown | SD |
| AKAP10 | SNV | Missense_Mutation | novel | c.1401N>T | p.Arg467Ser | p.R467S | O43572 | protein_coding | deleterious(0) | probably_damaging(0.993) | TCGA-AA-3845-01 | Colorectum | colon adenocarcinoma | Female | >=65 | I/II | Unknown | Unknown | PD |
| AKAP10 | SNV | Missense_Mutation | c.1287N>T | p.Gln429His | p.Q429H | O43572 | protein_coding | deleterious(0.03) | probably_damaging(0.942) | TCGA-AZ-6598-01 | Colorectum | colon adenocarcinoma | Female | >=65 | I/II | Unknown | Unknown | SD | |
| AKAP10 | SNV | Missense_Mutation | c.266N>T | p.Ala89Val | p.A89V | O43572 | protein_coding | tolerated_low_confidence(0.1) | probably_damaging(0.996) | TCGA-DM-A28A-01 | Colorectum | colon adenocarcinoma | Male | >=65 | III/IV | Unknown | Unknown | SD | |
| AKAP10 | SNV | Missense_Mutation | c.1053N>T | p.Met351Ile | p.M351I | O43572 | protein_coding | tolerated(0.42) | benign(0.063) | TCGA-F4-6703-01 | Colorectum | colon adenocarcinoma | Male | <65 | I/II | Unknown | Unknown | SD | |
| AKAP10 | SNV | Missense_Mutation | novel | c.1717G>A | p.Asp573Asn | p.D573N | O43572 | protein_coding | tolerated(0.15) | benign(0.296) | TCGA-AG-3726-01 | Colorectum | rectum adenocarcinoma | Female | <65 | I/II | Unknown | Unknown | SD |
| Page: 1 2 3 4 |
Top |
Related drugs of malignant transformation related genes |
| Identification of chemicals and drugs interact with genes involved in malignant transfromation |
| (DGIdb 4.0) |
| Entrez ID | Symbol | Category | Interaction Types | Drug Claim Name | Drug Name | PMIDs |
| Page: 1 |

Copyright 2023-Present -The University of Texas Health Science Center at Houston |