
|
|||||
|
 | |
| |
| |
| |
| |
| |
|
Gene: AHDC1 |
Gene summary for AHDC1 |
| Gene information | Species | Human | Gene symbol | AHDC1 | Gene ID | 27245 |
| Gene name | AT-hook DNA binding motif containing 1 | |
| Gene Alias | MRD25 | |
| Cytomap | 1p36.11-p35.3 | |
| Gene Type | protein-coding | GO ID | GO:0003674 | UniProtAcc | Q5TGY3 |
Top |
Malignant transformation analysis |
| Identification of the aberrant gene expression in precancerous and cancerous lesions by comparing the gene expression of stem-like cells in diseased tissues with normal stem cells |
| Entrez ID | Symbol | Replicates | Species | Organ | Tissue | Adj P-value | Log2FC | Malignancy |
| 27245 | AHDC1 | P23T-E | Human | Esophagus | ESCC | 1.04e-07 | 1.45e-01 | 0.108 |
| 27245 | AHDC1 | P24T-E | Human | Esophagus | ESCC | 5.02e-07 | -1.59e-02 | 0.1287 |
| 27245 | AHDC1 | P26T-E | Human | Esophagus | ESCC | 3.40e-08 | 3.51e-02 | 0.1276 |
| 27245 | AHDC1 | P27T-E | Human | Esophagus | ESCC | 4.91e-19 | 3.55e-01 | 0.1055 |
| 27245 | AHDC1 | P28T-E | Human | Esophagus | ESCC | 1.60e-19 | 2.96e-01 | 0.1149 |
| 27245 | AHDC1 | P30T-E | Human | Esophagus | ESCC | 4.25e-09 | 4.19e-01 | 0.137 |
| 27245 | AHDC1 | P31T-E | Human | Esophagus | ESCC | 8.18e-11 | 1.97e-01 | 0.1251 |
| 27245 | AHDC1 | P32T-E | Human | Esophagus | ESCC | 1.46e-04 | 1.50e-01 | 0.1666 |
| 27245 | AHDC1 | P36T-E | Human | Esophagus | ESCC | 2.41e-08 | 1.28e-01 | 0.1187 |
| 27245 | AHDC1 | P37T-E | Human | Esophagus | ESCC | 4.02e-10 | 1.29e-01 | 0.1371 |
| 27245 | AHDC1 | P39T-E | Human | Esophagus | ESCC | 4.88e-14 | 3.96e-01 | 0.0894 |
| 27245 | AHDC1 | P40T-E | Human | Esophagus | ESCC | 6.70e-04 | 4.39e-02 | 0.109 |
| 27245 | AHDC1 | P42T-E | Human | Esophagus | ESCC | 7.05e-10 | 2.54e-01 | 0.1175 |
| 27245 | AHDC1 | P44T-E | Human | Esophagus | ESCC | 1.91e-03 | 2.00e-02 | 0.1096 |
| 27245 | AHDC1 | P47T-E | Human | Esophagus | ESCC | 1.05e-07 | 3.15e-02 | 0.1067 |
| 27245 | AHDC1 | P48T-E | Human | Esophagus | ESCC | 3.53e-17 | 2.61e-01 | 0.0959 |
| 27245 | AHDC1 | P49T-E | Human | Esophagus | ESCC | 1.48e-03 | 4.27e-01 | 0.1768 |
| 27245 | AHDC1 | P52T-E | Human | Esophagus | ESCC | 3.43e-08 | 1.21e-01 | 0.1555 |
| 27245 | AHDC1 | P54T-E | Human | Esophagus | ESCC | 5.64e-19 | 4.02e-01 | 0.0975 |
| 27245 | AHDC1 | P56T-E | Human | Esophagus | ESCC | 2.09e-05 | 9.85e-01 | 0.1613 |
| Page: 1 2 3 4 5 |
| Tissue | Expression Dynamics | Abbreviation |
| Cervix | 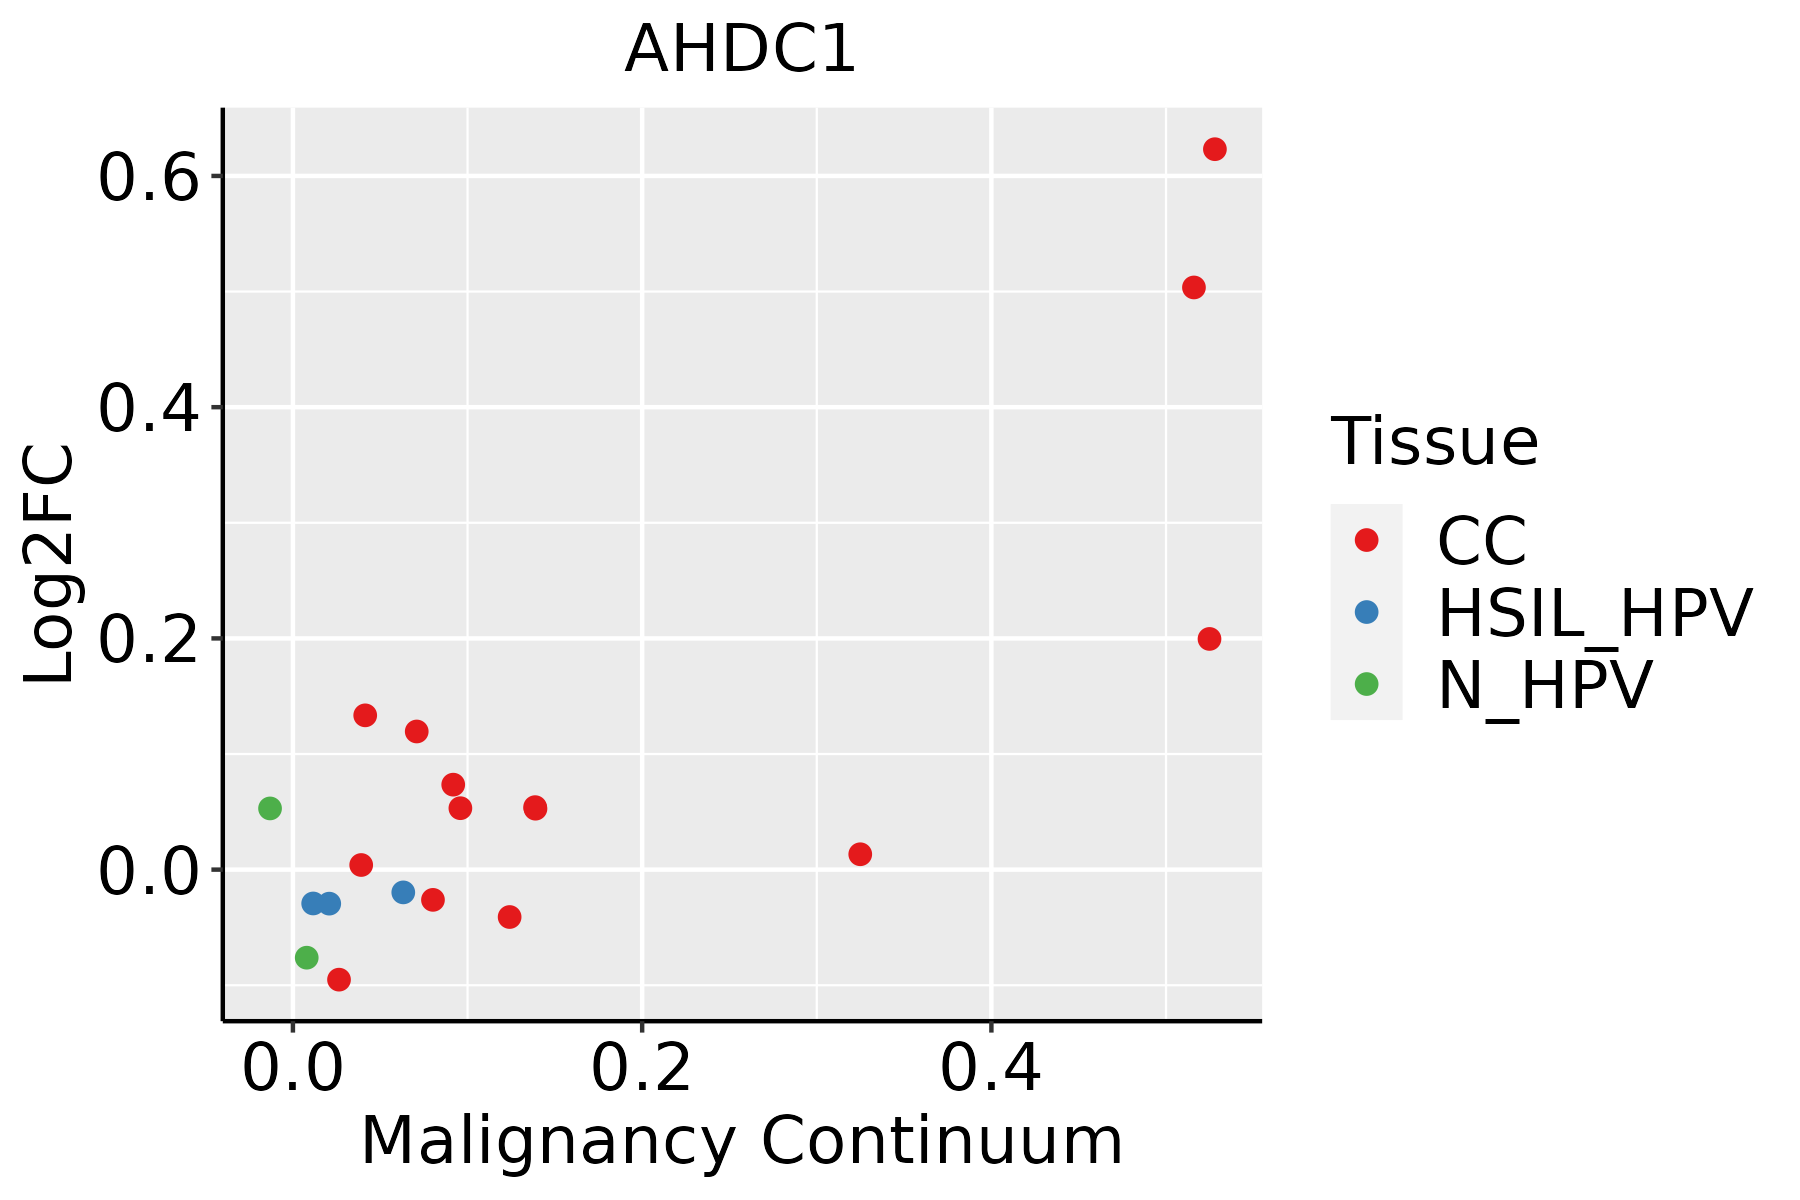 | CC: Cervix cancer |
| HSIL_HPV: HPV-infected high-grade squamous intraepithelial lesions | ||
| N_HPV: HPV-infected normal cervix | ||
| Esophagus | 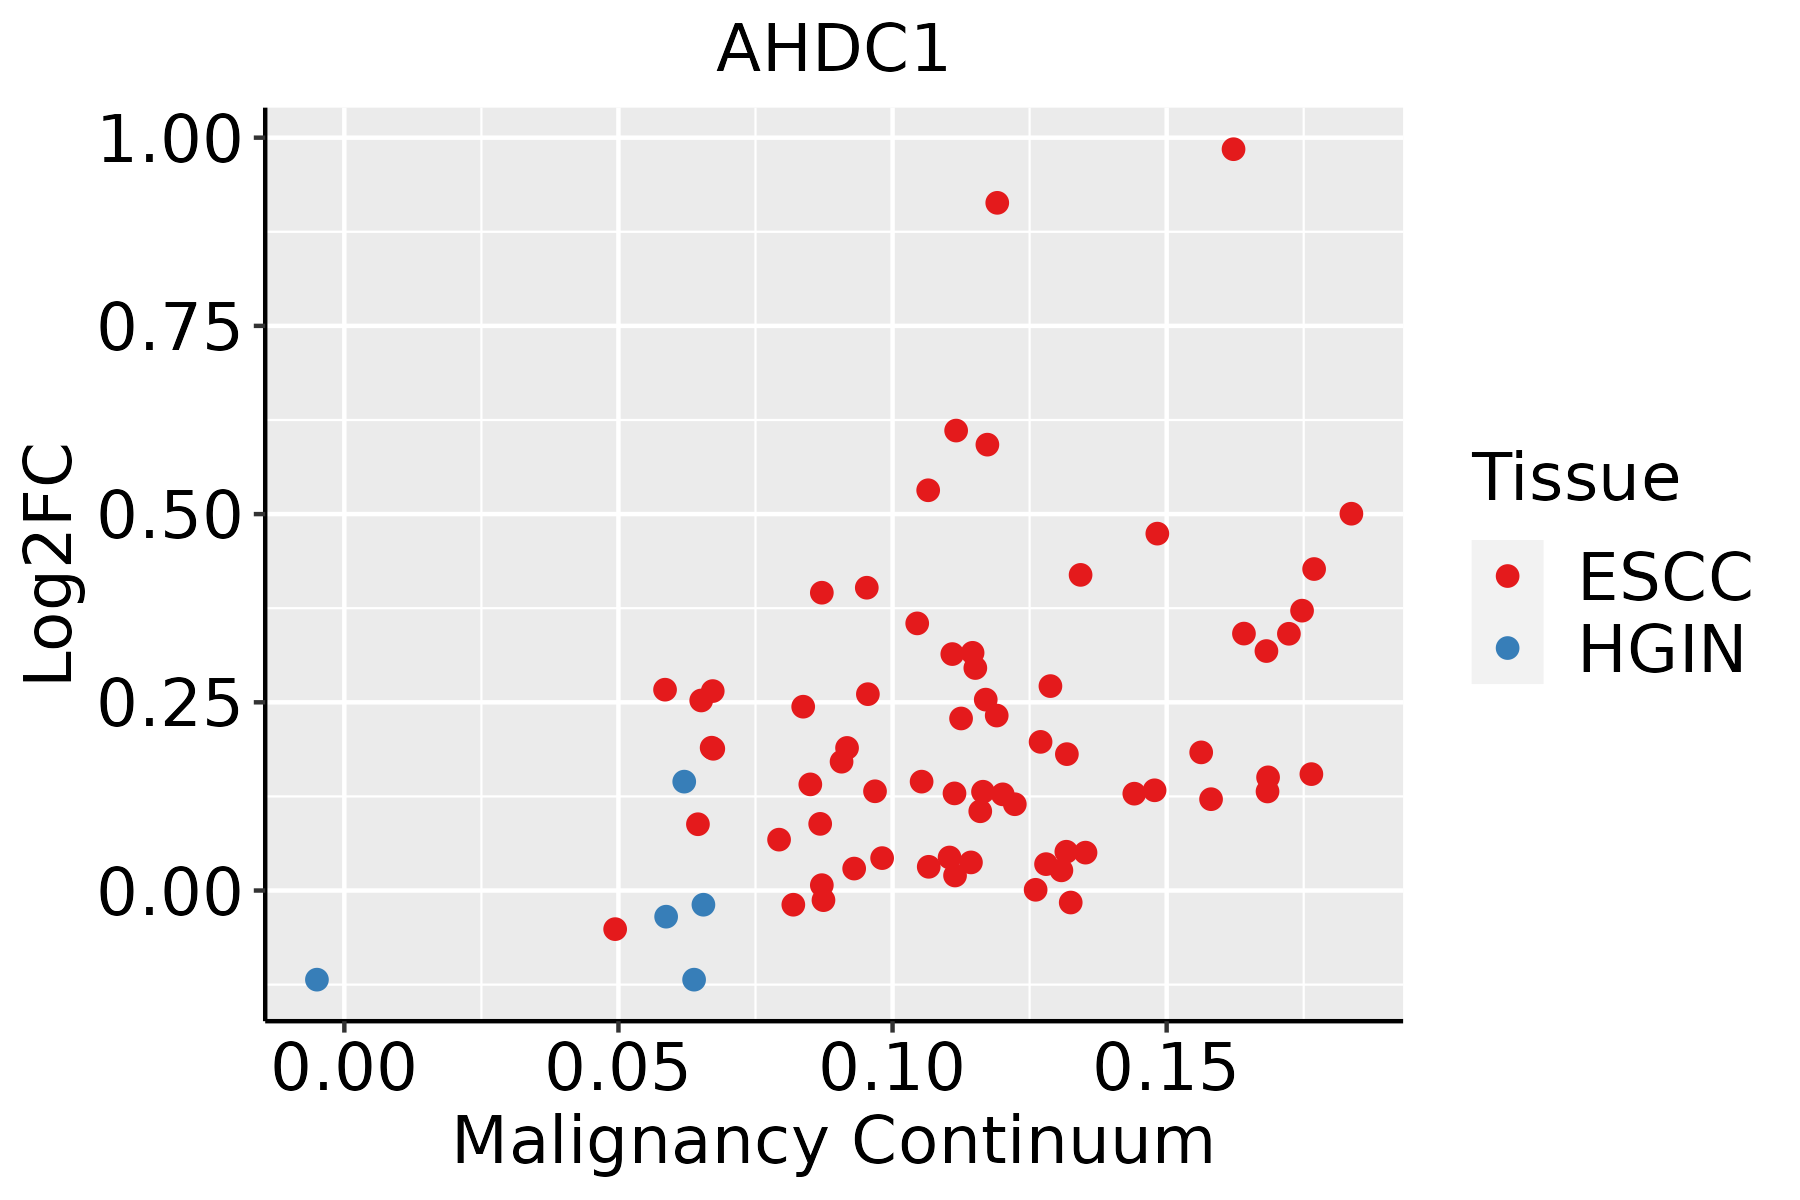 | ESCC: Esophageal squamous cell carcinoma |
| HGIN: High-grade intraepithelial neoplasias | ||
| LGIN: Low-grade intraepithelial neoplasias | ||
| Liver |  | HCC: Hepatocellular carcinoma |
| NAFLD: Non-alcoholic fatty liver disease | ||
| Oral Cavity |  | EOLP: Erosive Oral lichen planus |
| LP: leukoplakia | ||
| NEOLP: Non-erosive oral lichen planus | ||
| OSCC: Oral squamous cell carcinoma | ||
| Thyroid |  | ATC: Anaplastic thyroid cancer |
| HT: Hashimoto's thyroiditis | ||
| PTC: Papillary thyroid cancer |
| ∗log2FC in expression of this searched gene in stem-like cells from each diseased tissue sample relative to stem-like cells in normal samples in each tissue plotted against the malignancy continuum. Samples are colored based on if they are from different disease stage. |
Top |
Malignant transformation related pathway analysis |
| Find out the enriched GO biological processes and KEGG pathways involved in transition from healthy to precancer to cancer |
| Tissue | Disease Stage | Enriched GO biological Processes |
| Colorectum | AD |  |
| Colorectum | SER |  |
| Colorectum | MSS |  |
| Colorectum | MSI-H |  |
| Colorectum | FAP |  |
| ∗Top 15 enriched GO BP terms are showed in the bar plot of each disease state in each tissue. Each row represents a significant GO biological process which is colored according to the -log10(p.adjust). |
| Page: 1 2 3 4 5 6 7 8 9 |
| GO ID | Tissue | Disease Stage | Description | Gene Ratio | Bg Ratio | pvalue | p.adjust | Count |
| Page: 1 |
| Pathway ID | Tissue | Disease Stage | Description | Gene Ratio | Bg Ratio | pvalue | p.adjust | qvalue | Count |
| Page: 1 |
Top |
Cell-cell communication analysis |
| Identification of potential cell-cell interactions between two cell types and their ligand-receptor pairs for different disease states |
| Ligand | Receptor | LRpair | Pathway | Tissue | Disease Stage |
| Page: 1 |
Top |
Single-cell gene regulatory network inference analysis |
| Find out the significant the regulons (TFs) and the target genes of each regulon across cell types for different disease states |
| TF | Cell Type | Tissue | Disease Stage | Target Gene | RSS | Regulon Activity |
| ∗The dot plots of a searched regulon are shown for all cell subpopulations in each disease state of each tissue based on the regulon specific score inferred using pySCENIC and by calculating the average expression. |
| Page: 1 |
Top |
Somatic mutation of malignant transformation related genes |
| Annotation of somatic variants for genes involved in malignant transformation |
| Hugo Symbol | Variant Class | Variant Classification | dbSNP RS | HGVSc | HGVSp | HGVSp Short | SWISSPROT | BIOTYPE | SIFT | PolyPhen | Tumor Sample Barcode | Tissue | Histology | Sex | Age | Stage | Therapy Types | Drugs | Outcome |
| AHDC1 | SNV | Missense_Mutation | c.607G>C | p.Glu203Gln | p.E203Q | Q5TGY3 | protein_coding | tolerated_low_confidence(0.42) | possibly_damaging(0.859) | TCGA-C8-A26Y-01 | Breast | breast invasive carcinoma | Female | >=65 | I/II | Unknown | Unknown | SD | |
| AHDC1 | insertion | Frame_Shift_Ins | novel | c.4176dupC | p.Gly1393ArgfsTer88 | p.G1393Rfs*88 | Q5TGY3 | protein_coding | TCGA-BH-A0BZ-01 | Breast | breast invasive carcinoma | Female | <65 | III/IV | Chemotherapy | doxorubicin | CR | ||
| AHDC1 | SNV | Missense_Mutation | rs377405108 | c.3857G>A | p.Arg1286Gln | p.R1286Q | Q5TGY3 | protein_coding | tolerated(0.08) | possibly_damaging(0.728) | TCGA-MU-A5YI-01 | Cervix | cervical & endocervical cancer | Female | <65 | I/II | Unknown | Unknown | PD |
| AHDC1 | SNV | Missense_Mutation | rs757919190 | c.460N>T | p.Arg154Cys | p.R154C | Q5TGY3 | protein_coding | tolerated_low_confidence(0.06) | possibly_damaging(0.542) | TCGA-A6-2672-01 | Colorectum | colon adenocarcinoma | Female | >=65 | III/IV | Unknown | Unknown | SD |
| AHDC1 | SNV | Missense_Mutation | c.3703C>T | p.Arg1235Trp | p.R1235W | Q5TGY3 | protein_coding | deleterious(0) | probably_damaging(0.999) | TCGA-AA-3710-01 | Colorectum | colon adenocarcinoma | Female | >=65 | I/II | Unknown | Unknown | SD | |
| AHDC1 | SNV | Missense_Mutation | rs766744511 | c.3256N>G | p.Ser1086Ala | p.S1086A | Q5TGY3 | protein_coding | tolerated_low_confidence(0.9) | possibly_damaging(0.525) | TCGA-AA-3713-01 | Colorectum | colon adenocarcinoma | Male | >=65 | III/IV | Chemotherapy | 5-fluorouracil | PR |
| AHDC1 | SNV | Missense_Mutation | rs754239206 | c.2594G>A | p.Arg865Gln | p.R865Q | Q5TGY3 | protein_coding | deleterious(0.01) | benign(0.236) | TCGA-AA-3864-01 | Colorectum | colon adenocarcinoma | Male | >=65 | I/II | Unknown | Unknown | SD |
| AHDC1 | SNV | Missense_Mutation | rs766744511 | c.3256N>G | p.Ser1086Ala | p.S1086A | Q5TGY3 | protein_coding | tolerated_low_confidence(0.9) | possibly_damaging(0.525) | TCGA-AA-3966-01 | Colorectum | colon adenocarcinoma | Female | >=65 | I/II | Unknown | Unknown | SD |
| AHDC1 | SNV | Missense_Mutation | rs764325293 | c.668N>T | p.Thr223Met | p.T223M | Q5TGY3 | protein_coding | deleterious_low_confidence(0.03) | possibly_damaging(0.706) | TCGA-AD-6895-01 | Colorectum | colon adenocarcinoma | Male | >=65 | III/IV | Unknown | Unknown | SD |
| AHDC1 | SNV | Missense_Mutation | c.3415C>T | p.Pro1139Ser | p.P1139S | Q5TGY3 | protein_coding | tolerated(0.33) | benign(0.147) | TCGA-AD-6964-01 | Colorectum | colon adenocarcinoma | Male | <65 | III/IV | Chemotherapy | folfox | PD |
| Page: 1 2 3 4 5 6 7 8 9 10 11 |
Top |
Related drugs of malignant transformation related genes |
| Identification of chemicals and drugs interact with genes involved in malignant transfromation |
| (DGIdb 4.0) |
| Entrez ID | Symbol | Category | Interaction Types | Drug Claim Name | Drug Name | PMIDs |
| Page: 1 |

Copyright 2023-Present -The University of Texas Health Science Center at Houston |