| Entrez ID | Symbol | Replicates | Species | Organ | Tissue | Adj P-value | Log2FC | Malignancy |
| 6154 | RPL26 | GSM5353221_PA_PB2A_Pool_1_3_S25_L001 | Human | Prostate | Tumor | 5.01e-111 | -1.48e+00 | 0.1633 |
| 6154 | RPL26 | GSM5353222_PA_PB2B_Pool_1_3_S52_L002 | Human | Prostate | Tumor | 7.98e-127 | -1.51e+00 | 0.1608 |
| 6154 | RPL26 | GSM5353223_PA_PB2B_Pool_2_S26_L001 | Human | Prostate | Tumor | 5.69e-94 | -1.39e+00 | 0.1604 |
| 6154 | RPL26 | GSM5353224_PA_PR5186_Pool_1_2_3_S27_L001 | Human | Prostate | Tumor | 2.22e-104 | -1.22e+00 | 0.1621 |
| 6154 | RPL26 | GSM5353225_PA_PR5196-1_Pool_1_2_3_S53_L002 | Human | Prostate | Tumor | 3.25e-59 | -1.60e+00 | 0.1619 |
| 6154 | RPL26 | GSM5353226_PA_PR5196-2_Pool_1_2_3_S54_L002 | Human | Prostate | Tumor | 2.77e-49 | -1.70e+00 | 0.159 |
| 6154 | RPL26 | GSM5353227_PA_PR5199-193K_Pool_1_2_3_S55_L002 | Human | Prostate | Tumor | 1.25e-90 | -1.69e+00 | 0.1602 |
| 6154 | RPL26 | GSM5353228_PA_PR5199-640K_Pool_1_3_S108_L004 | Human | Prostate | Tumor | 1.85e-27 | -1.92e+00 | 0.1537 |
| 6154 | RPL26 | GSM5353232_PA_PR5249_T1_S3_L001 | Human | Prostate | Tumor | 5.35e-30 | -1.71e+00 | 0.1439 |
| 6154 | RPL26 | GSM5353236_PA_PR5251_T1_S7_L001 | Human | Prostate | Tumor | 2.08e-68 | -1.56e+00 | 0.1608 |
| 6154 | RPL26 | GSM5353237_PA_PR5251_T2_S8_L001 | Human | Prostate | Tumor | 1.14e-59 | -1.55e+00 | 0.1622 |
| 6154 | RPL26 | GSM5353240_PA_PR5254_T1_S15_L001 | Human | Prostate | Tumor | 8.97e-121 | -1.30e+00 | 0.1575 |
| 6154 | RPL26 | GSM5353243_PA_PR5261_T1_S23_L002 | Human | Prostate | Tumor | 6.07e-115 | -1.76e+00 | 0.1545 |
| 6154 | RPL26 | GSM5353244_PA_PR5261_T2_S24_L002 | Human | Prostate | Tumor | 9.67e-98 | -1.60e+00 | 0.1569 |
| 6154 | RPL26 | GSM5353247_PA_PR5269_3_S27_L002 | Human | Prostate | Tumor | 2.98e-25 | -1.90e+00 | 0.1532 |
| 6154 | RPL26 | GSM5353248_PA_PR5269_4_S28_L002 | Human | Prostate | Tumor | 2.40e-35 | -1.89e+00 | 0.1541 |
| 6154 | RPL26 | P1_S1_AK | Human | Skin | AK | 1.02e-15 | -6.83e-02 | -0.3399 |
| 6154 | RPL26 | P2_S3_AK | Human | Skin | AK | 1.73e-07 | -2.37e-02 | -0.3287 |
| 6154 | RPL26 | P3_S6_AK | Human | Skin | AK | 2.09e-16 | -1.25e-01 | -0.3256 |
| 6154 | RPL26 | P5_S10_cSCC | Human | Skin | cSCC | 1.24e-91 | -3.26e-01 | -0.299 |
| Tissue | Expression Dynamics | Abbreviation |
| Breast |  | IDC: Invasive ductal carcinoma |
| DCIS: Ductal carcinoma in situ |
| Precancer(BRCA1-mut): Precancerous lesion from BRCA1 mutation carriers |
| Cervix | 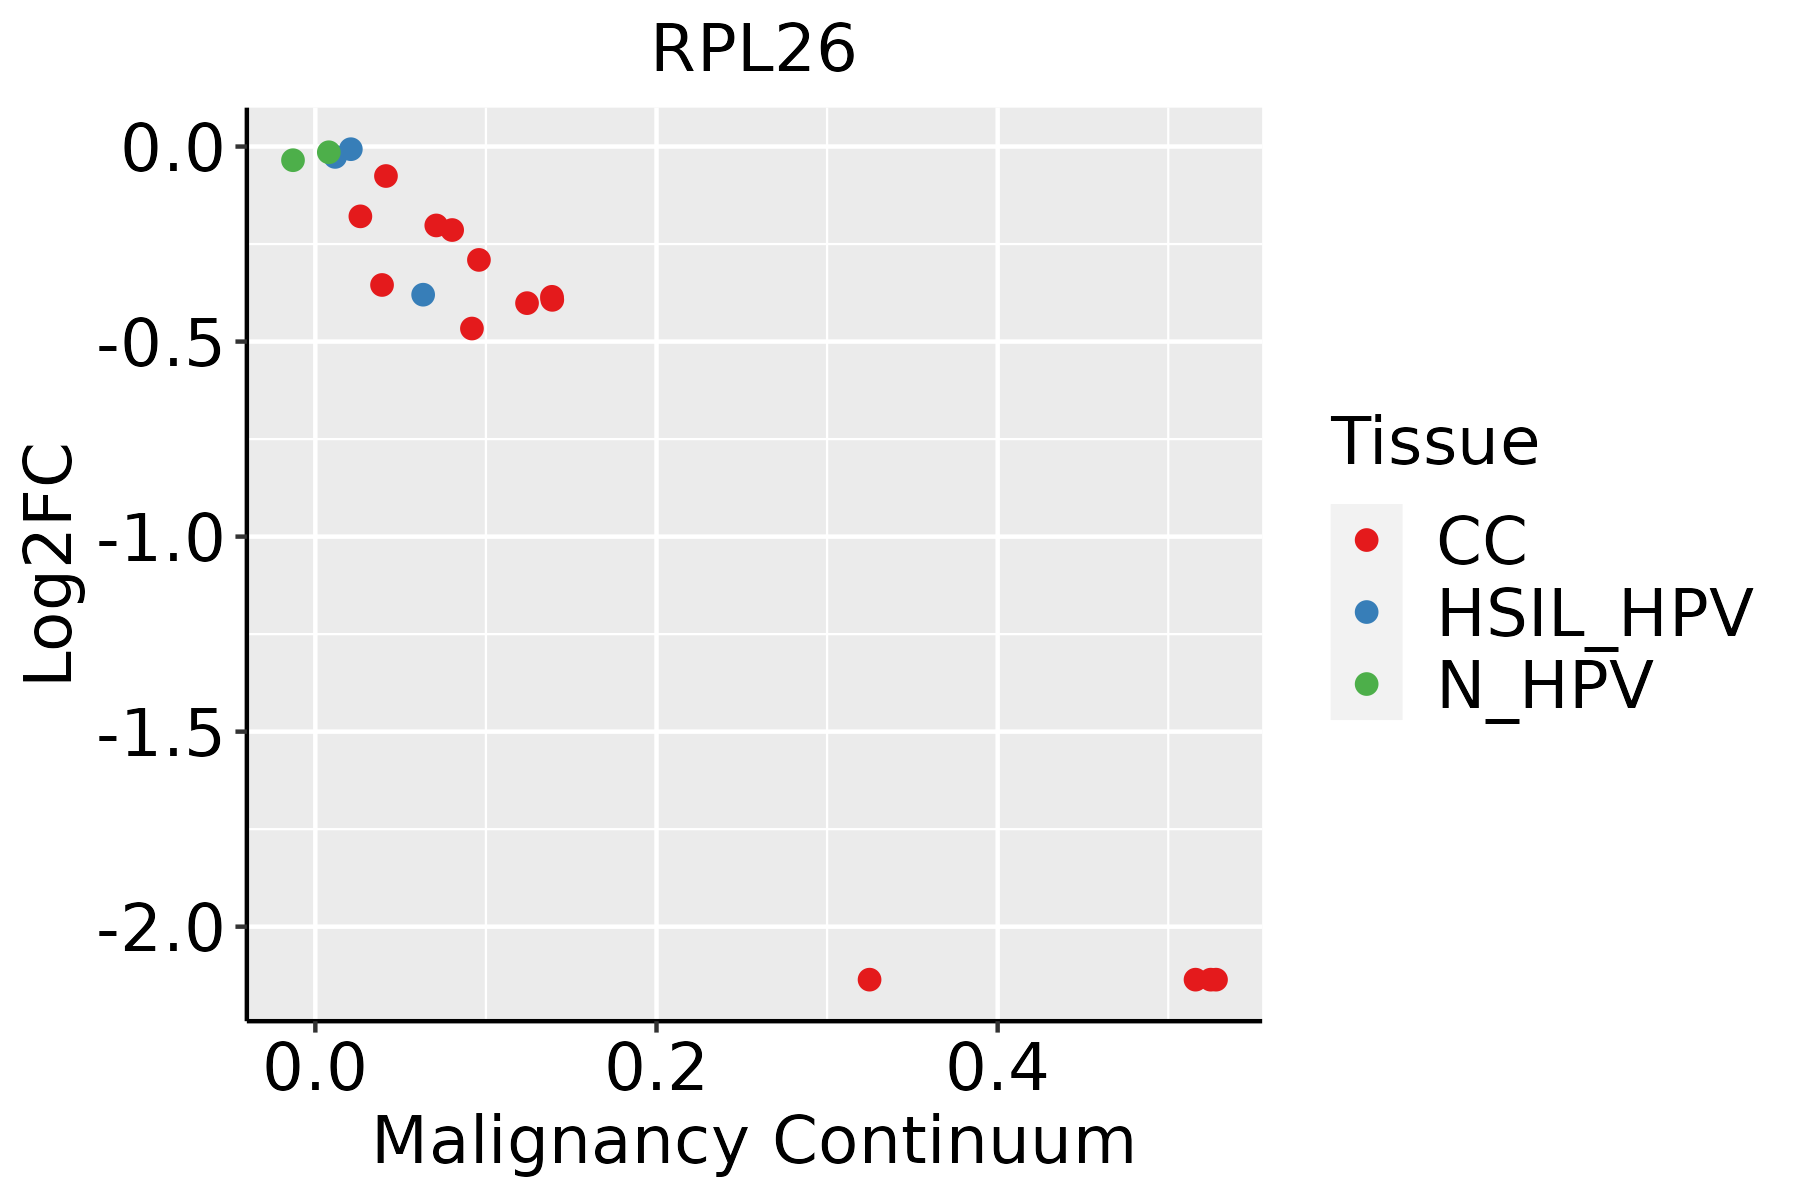 | CC: Cervix cancer |
| HSIL_HPV: HPV-infected high-grade squamous intraepithelial lesions |
| N_HPV: HPV-infected normal cervix |
| Colorectum (GSE201348) |  | FAP: Familial adenomatous polyposis |
| CRC: Colorectal cancer |
| Colorectum (HTA11) |  | AD: Adenomas |
| SER: Sessile serrated lesions |
| MSI-H: Microsatellite-high colorectal cancer |
| MSS: Microsatellite stable colorectal cancer |
| Endometrium | 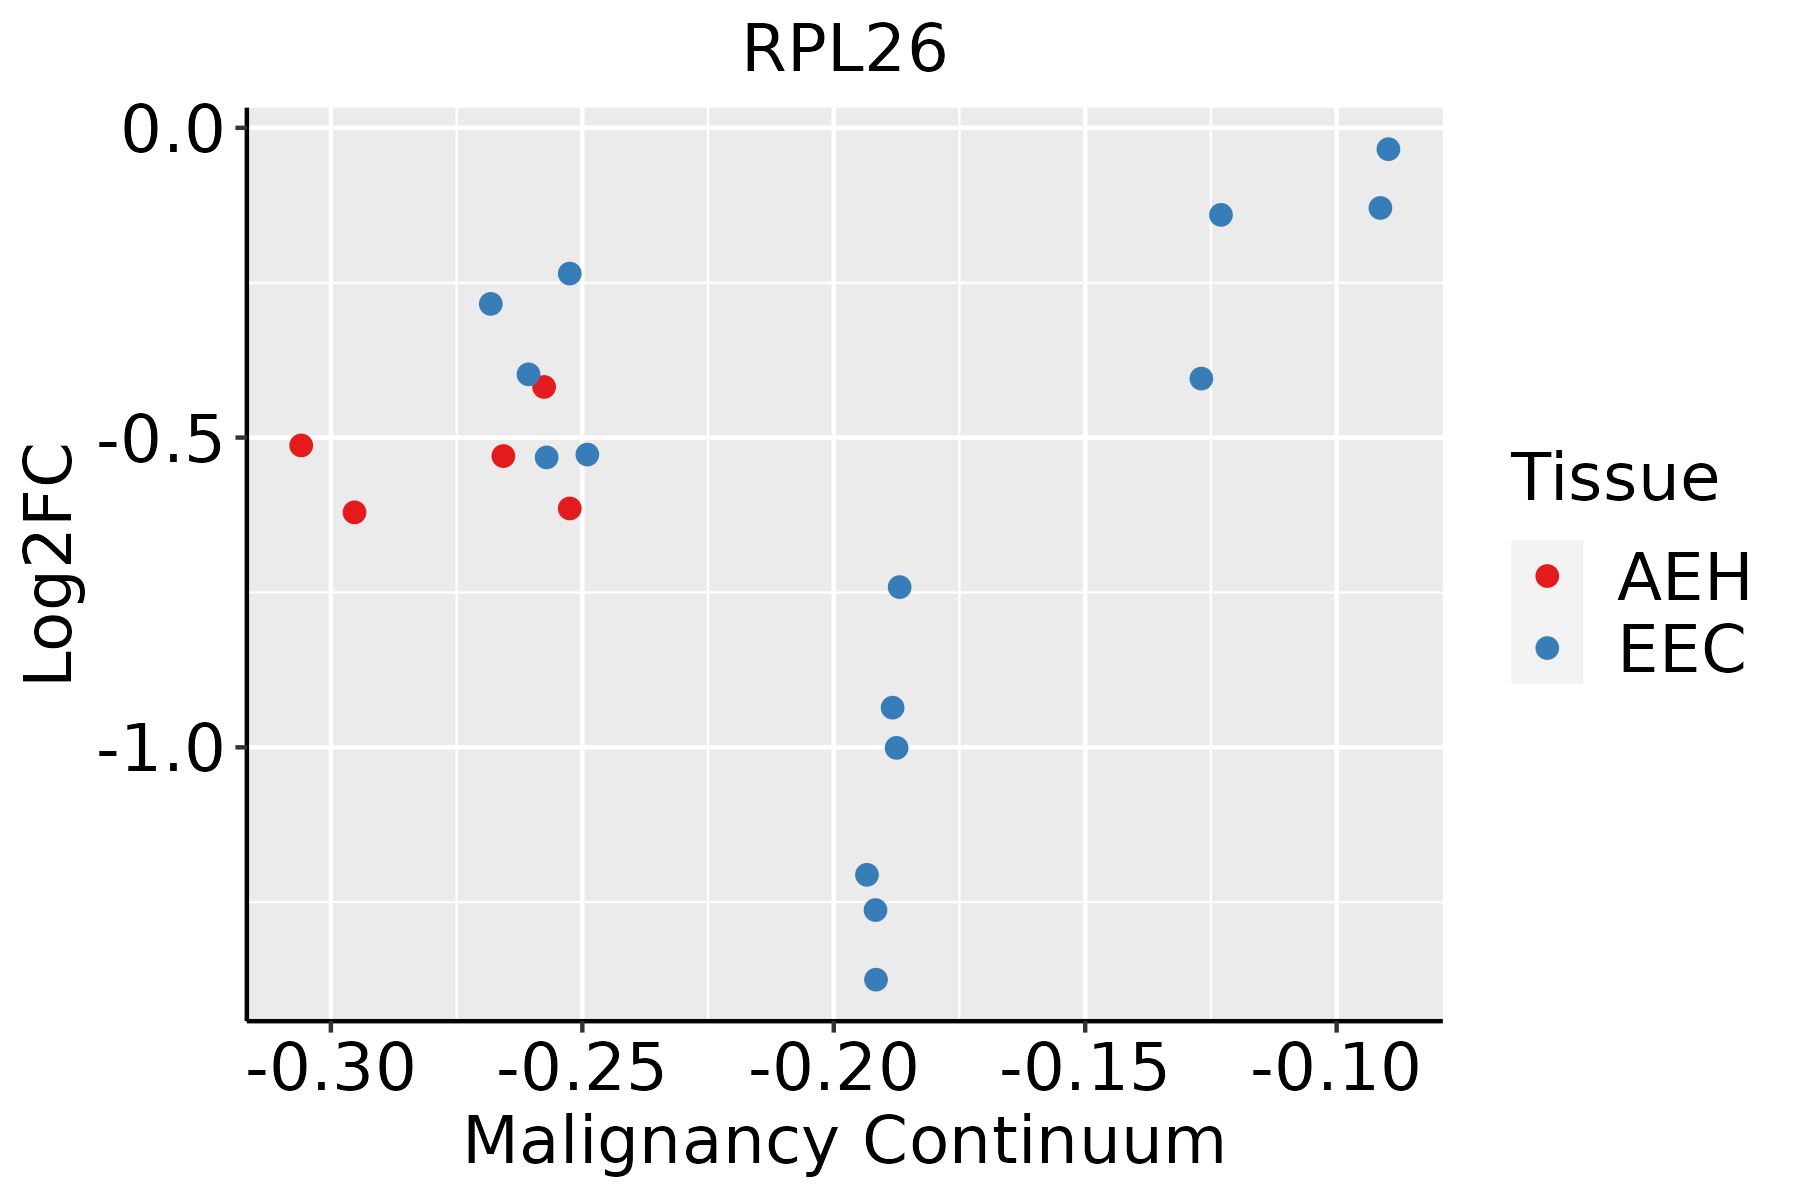 | AEH: Atypical endometrial hyperplasia |
| EEC: Endometrioid Cancer |
| Esophagus | 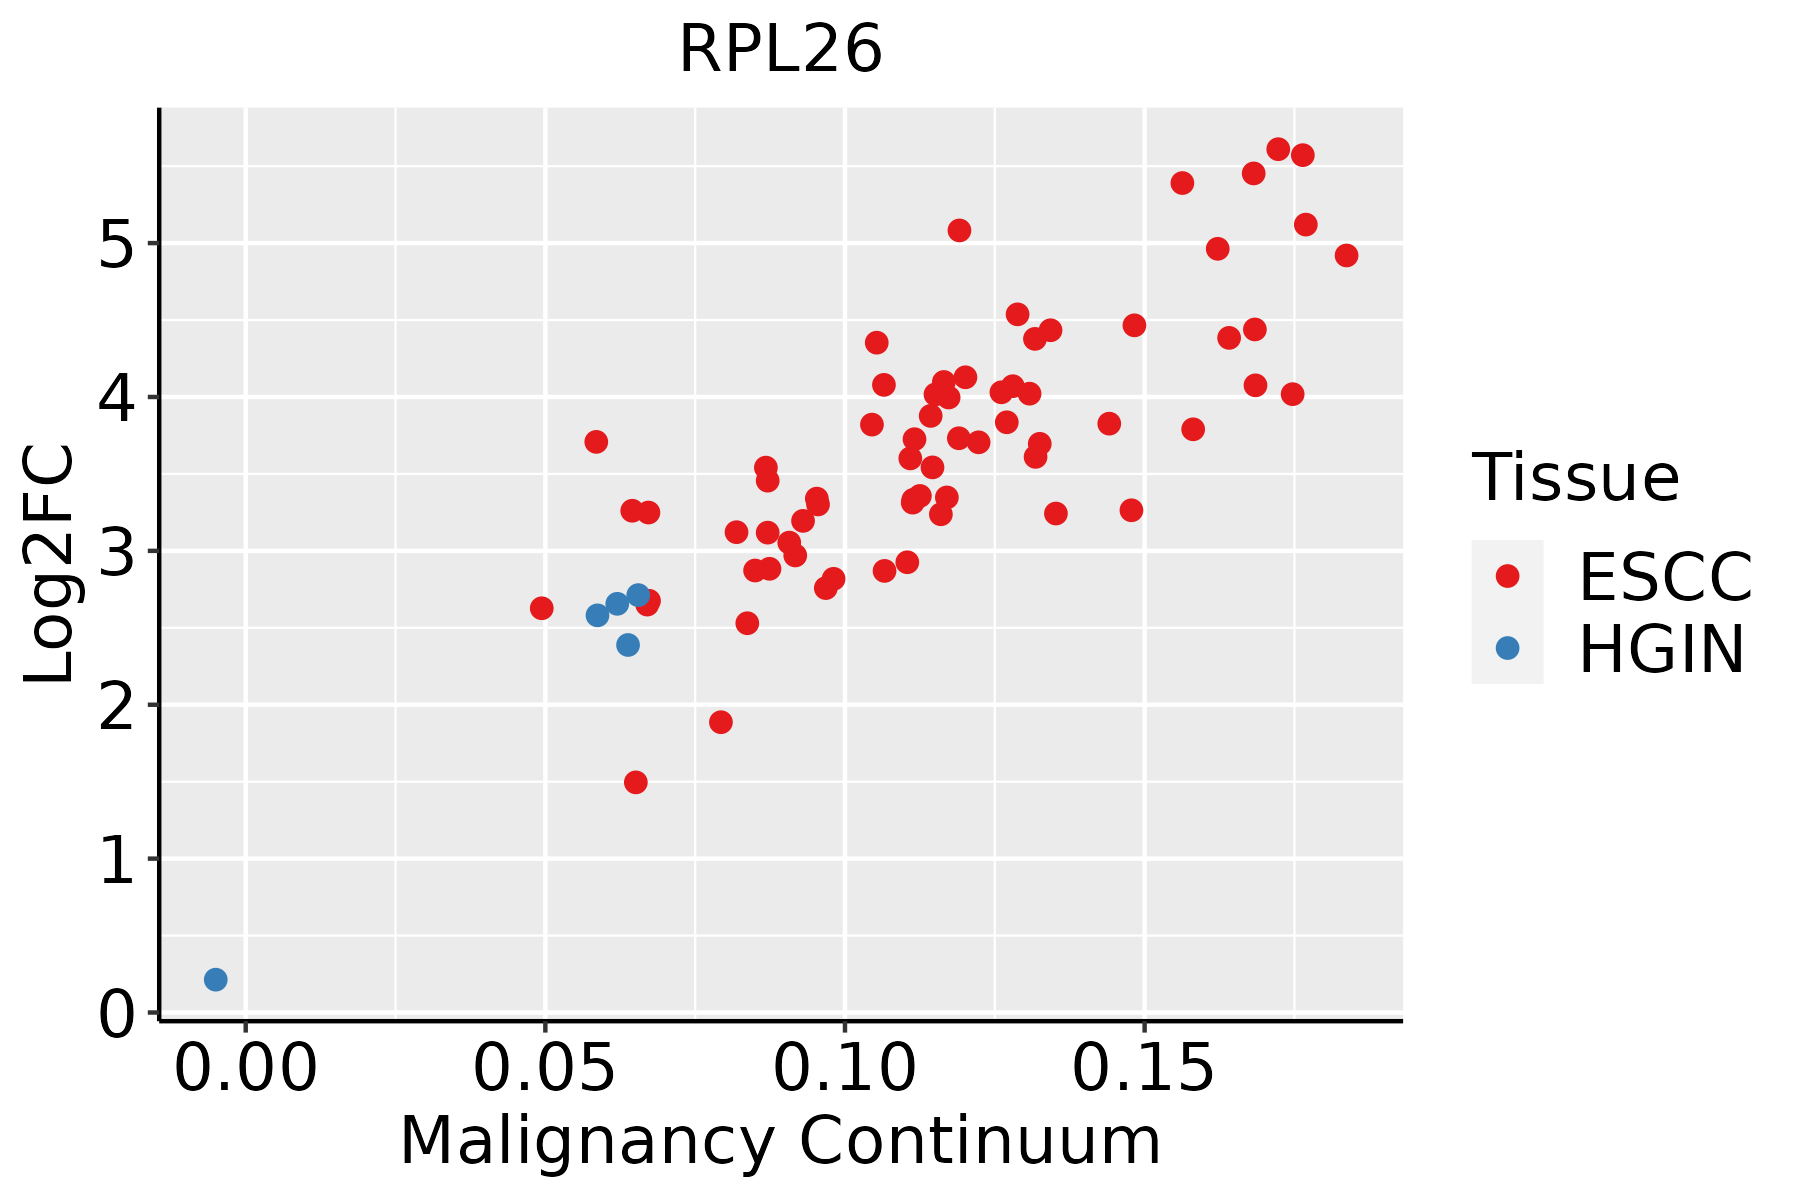 | ESCC: Esophageal squamous cell carcinoma |
| HGIN: High-grade intraepithelial neoplasias |
| LGIN: Low-grade intraepithelial neoplasias |
| Liver | 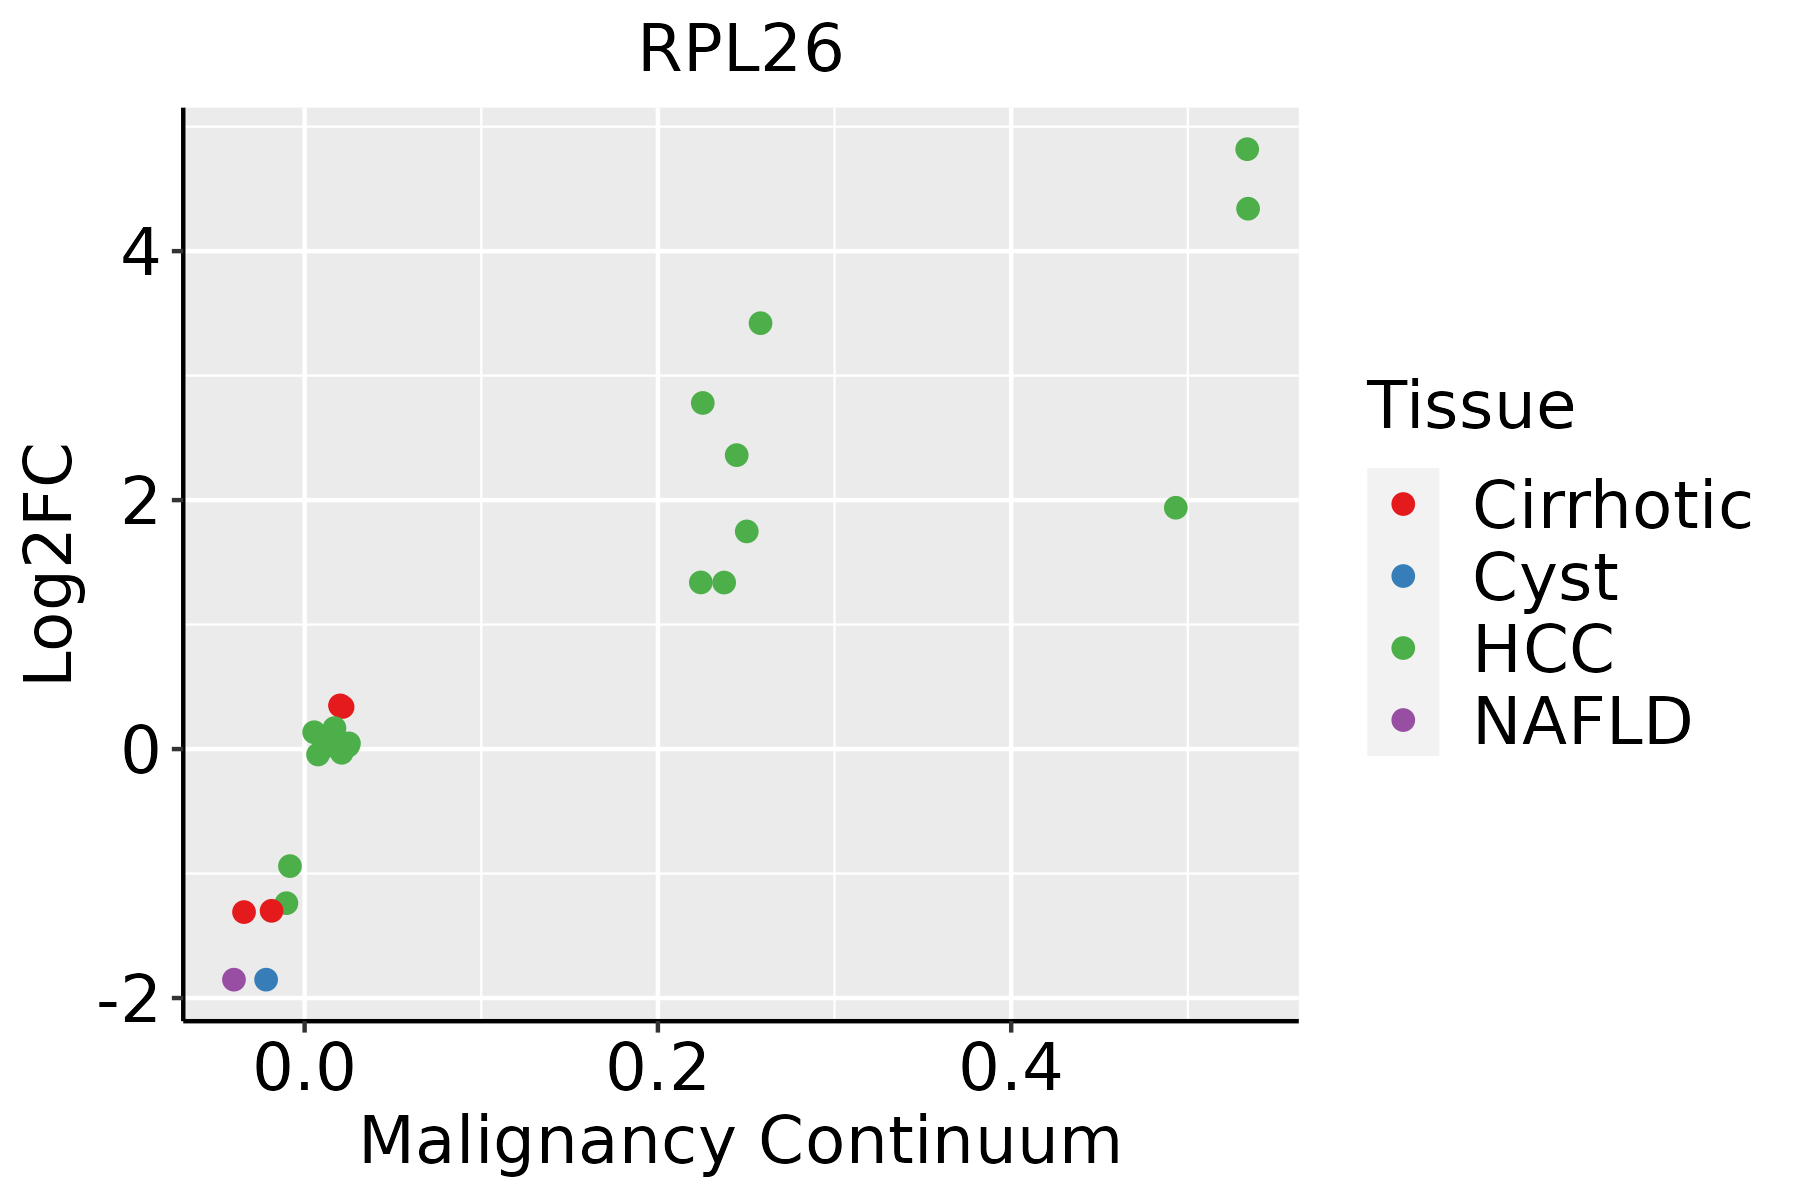 | HCC: Hepatocellular carcinoma |
| NAFLD: Non-alcoholic fatty liver disease |
| Lung | 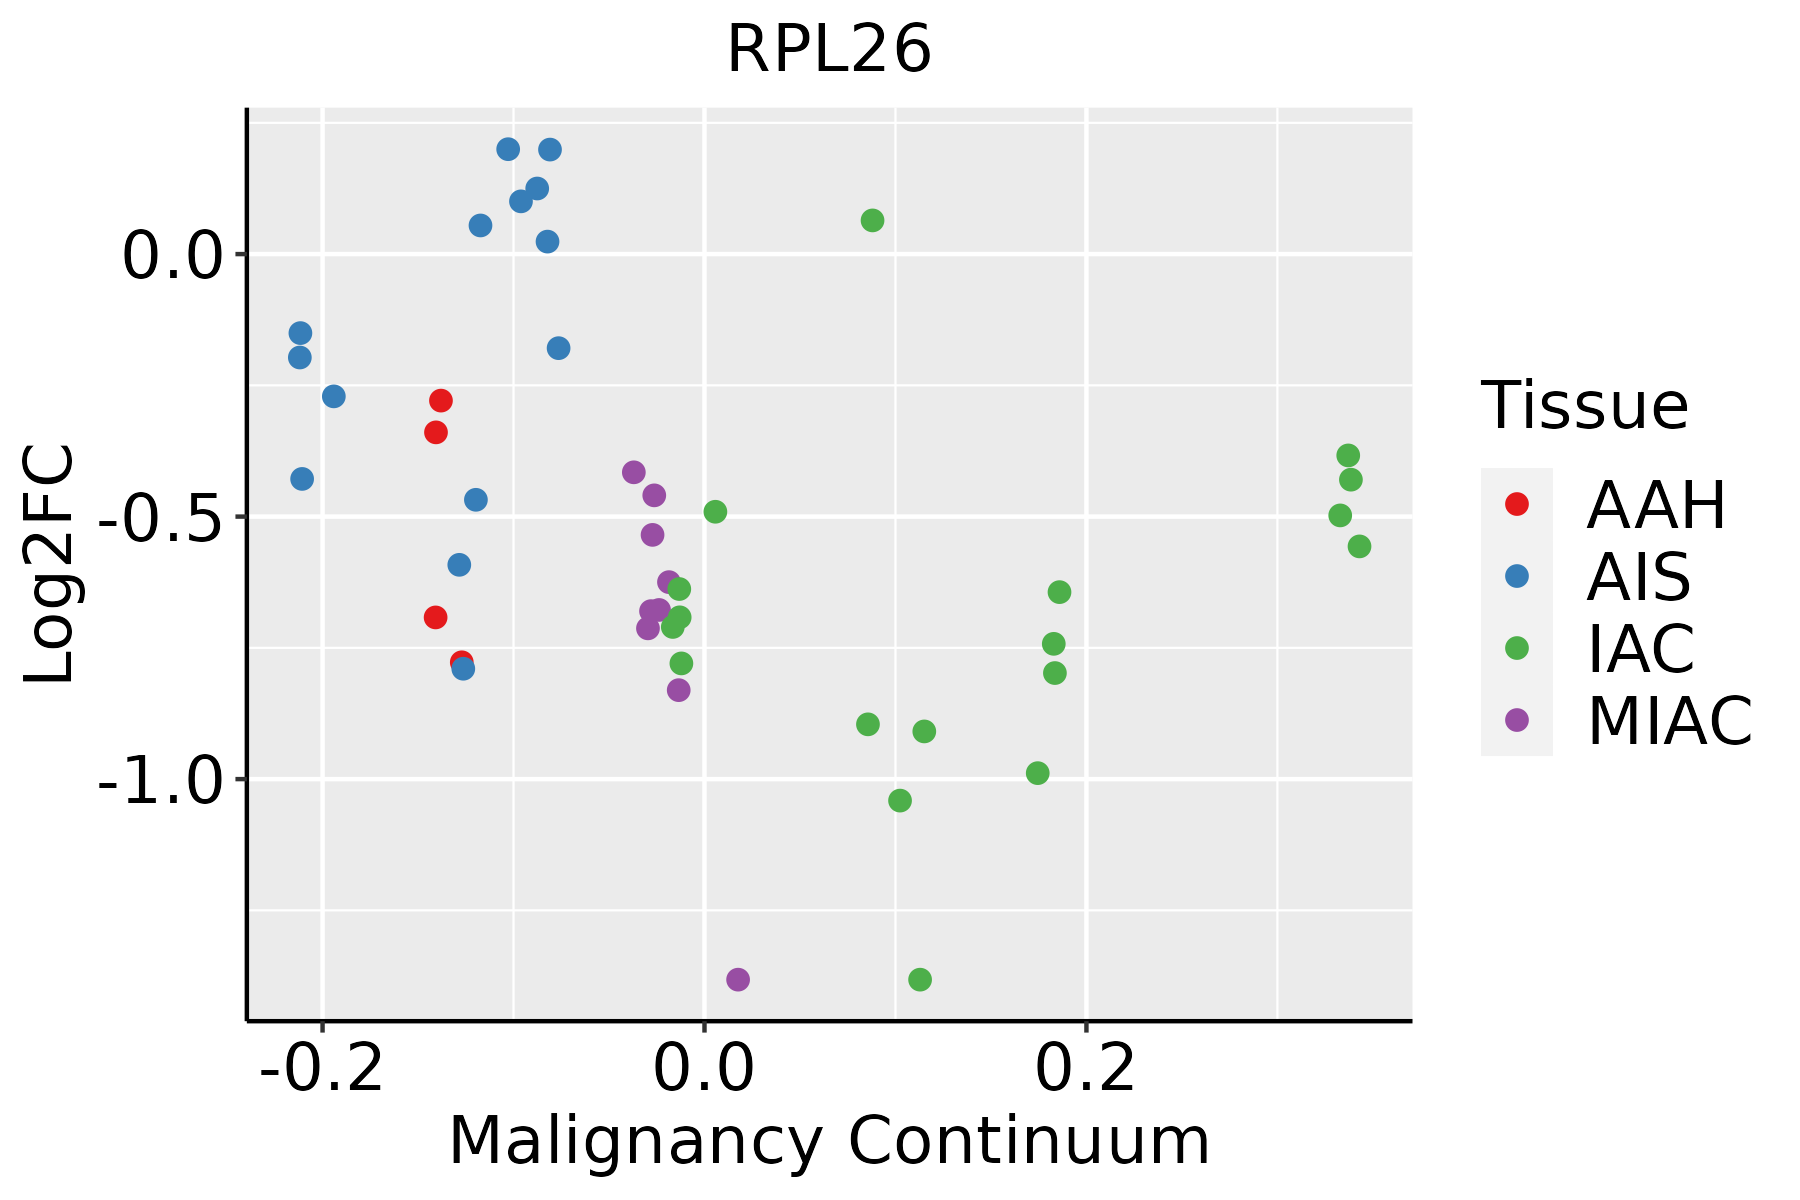 | AAH: Atypical adenomatous hyperplasia |
| AIS: Adenocarcinoma in situ |
| IAC: Invasive lung adenocarcinoma |
| MIA: Minimally invasive adenocarcinoma |
| Oral Cavity | 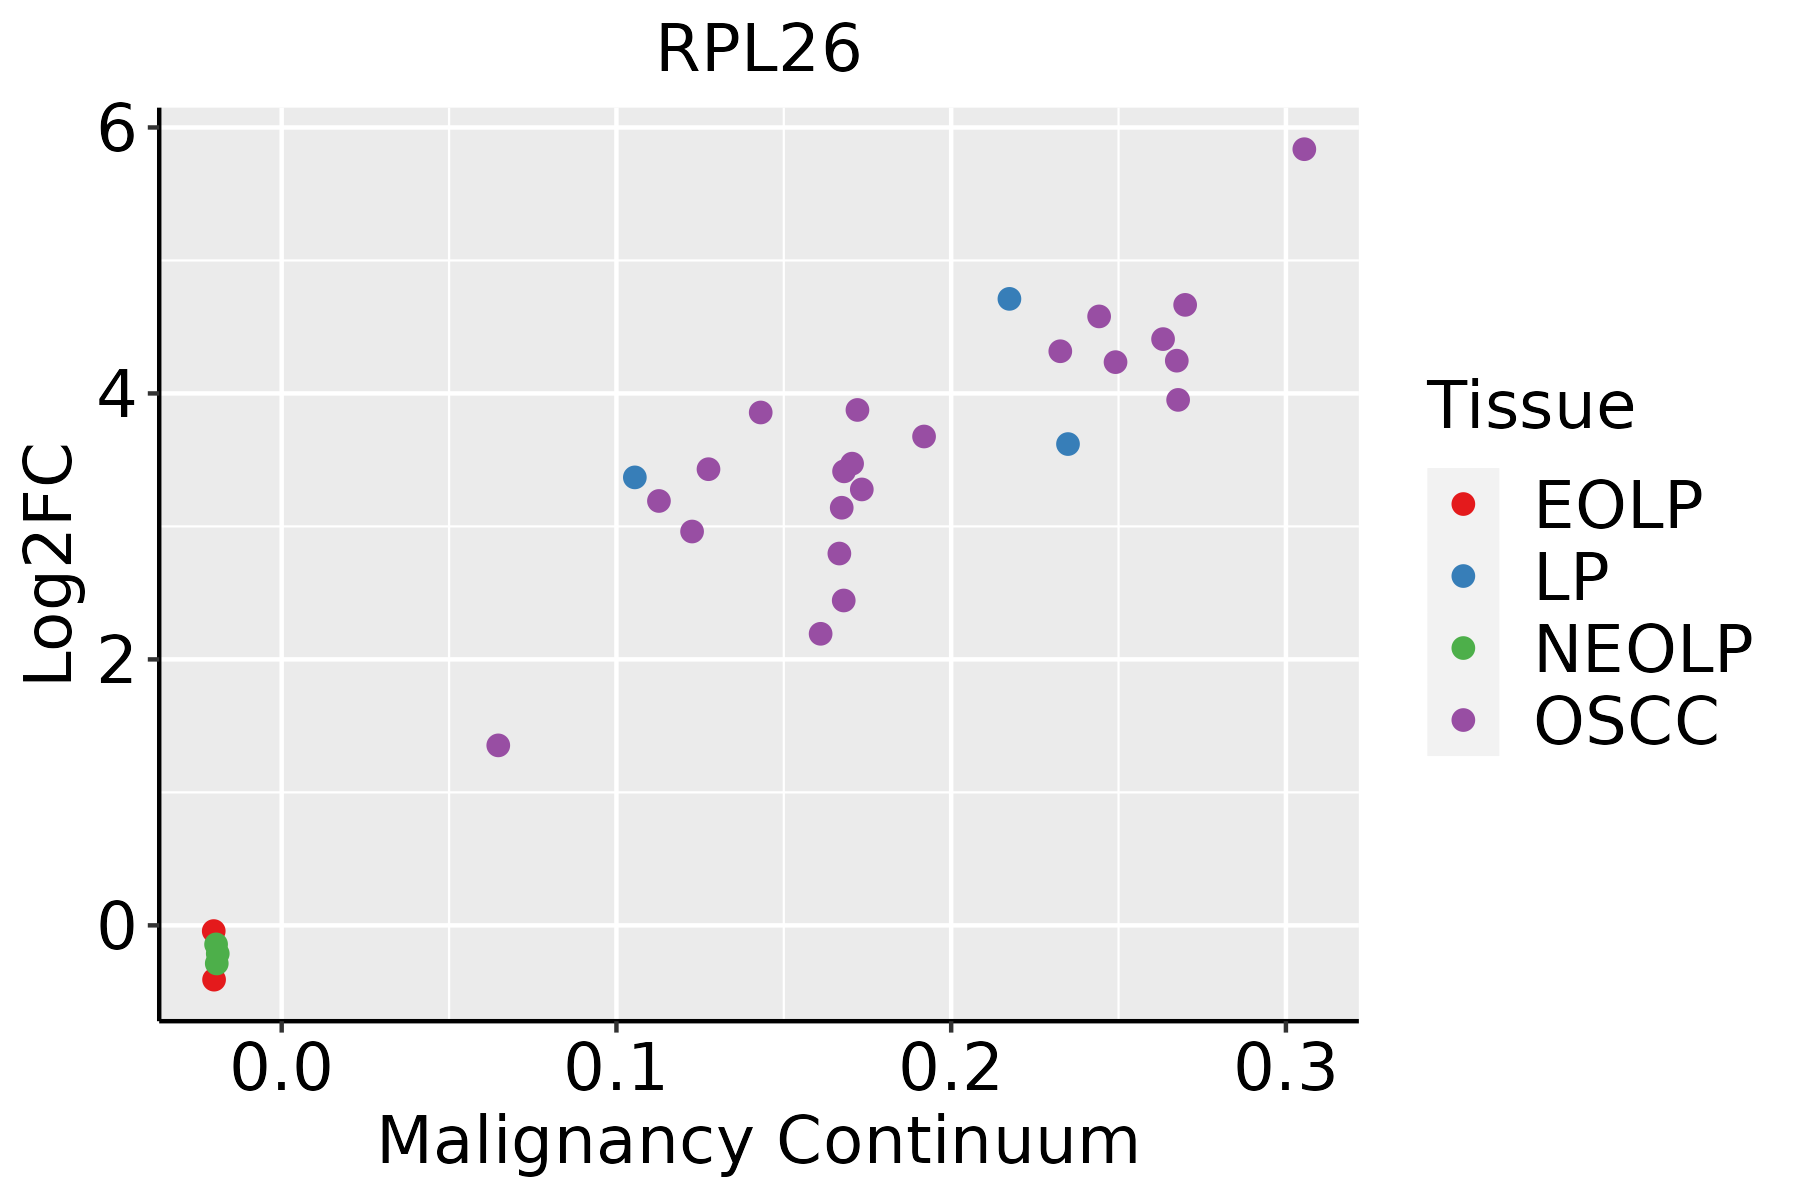 | EOLP: Erosive Oral lichen planus |
| LP: leukoplakia |
| NEOLP: Non-erosive oral lichen planus |
| OSCC: Oral squamous cell carcinoma |
| Prostate |  | BPH: Benign Prostatic Hyperplasia |
| Skin | 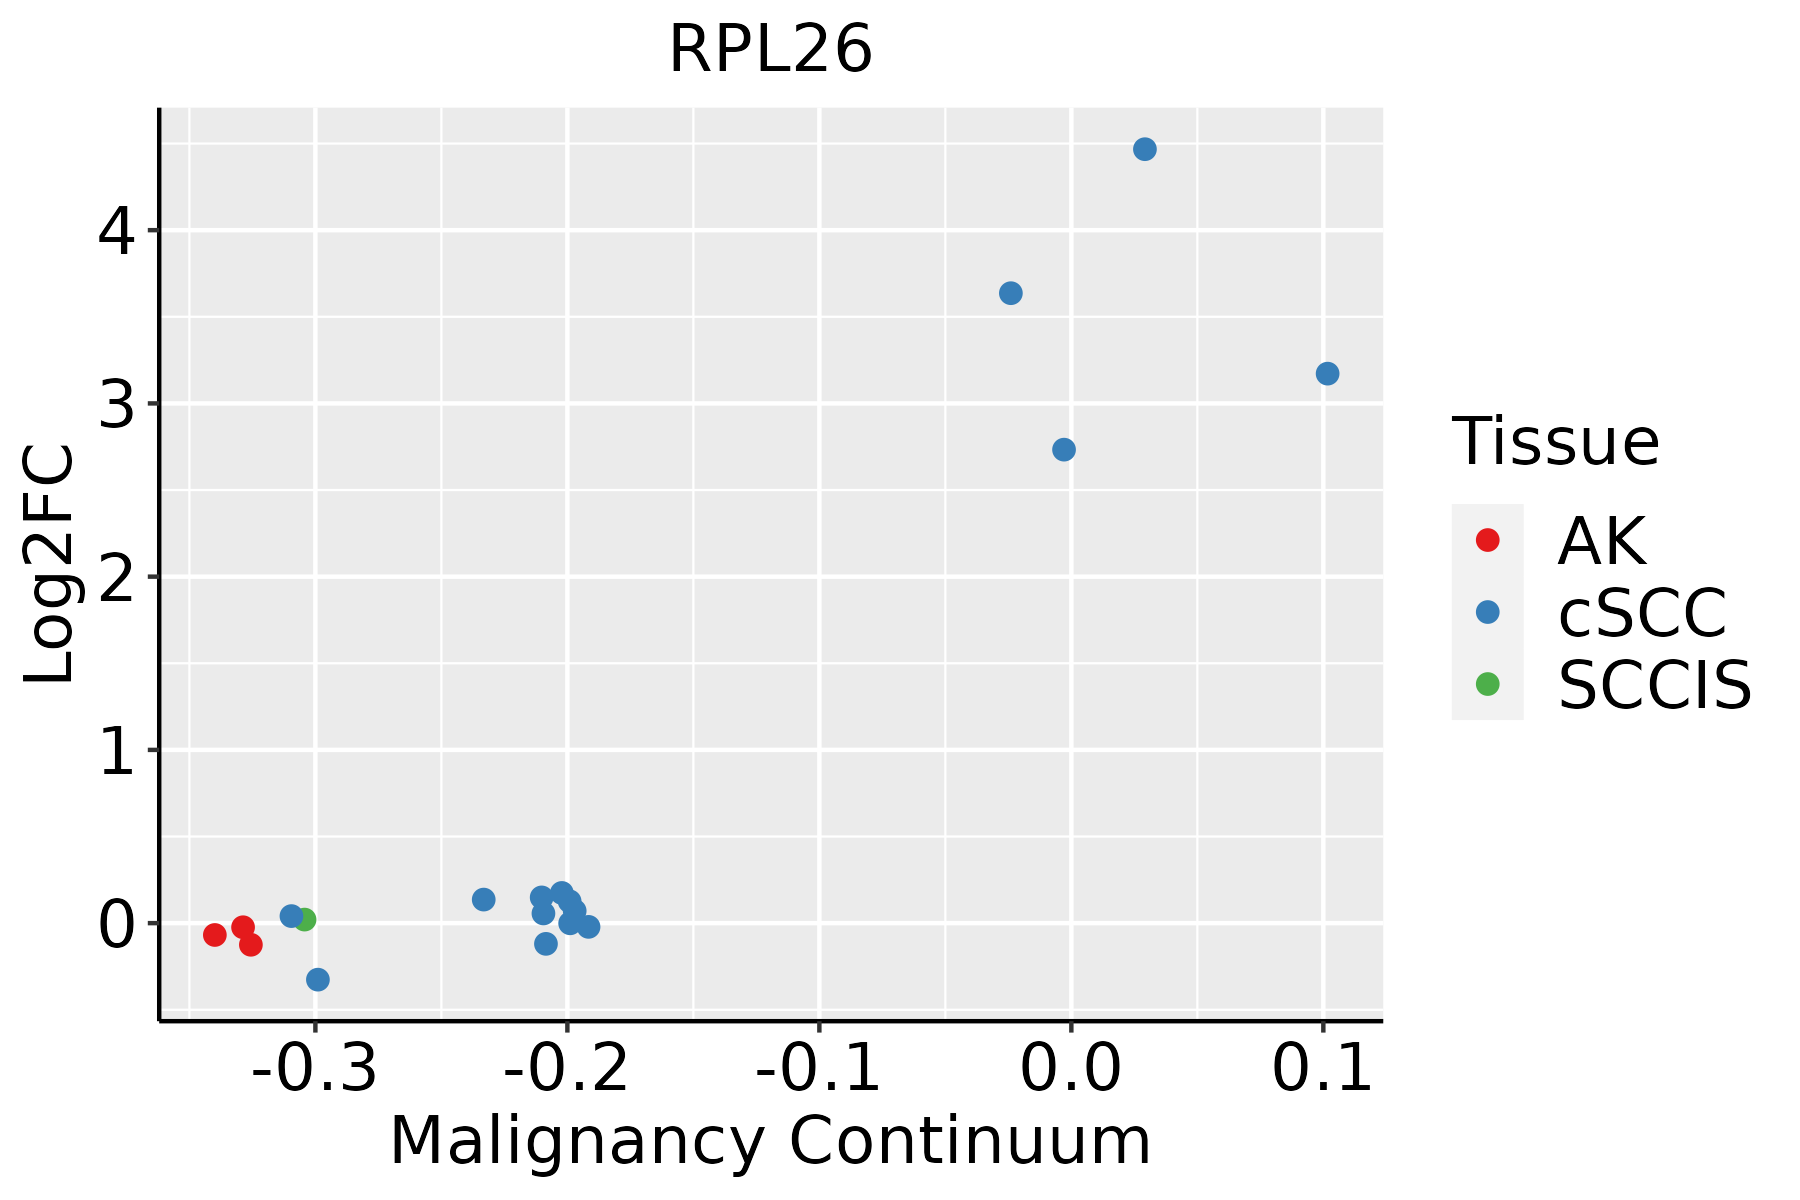 | AK: Actinic keratosis |
| cSCC: Cutaneous squamous cell carcinoma |
| SCCIS:squamous cell carcinoma in situ |
| Thyroid | 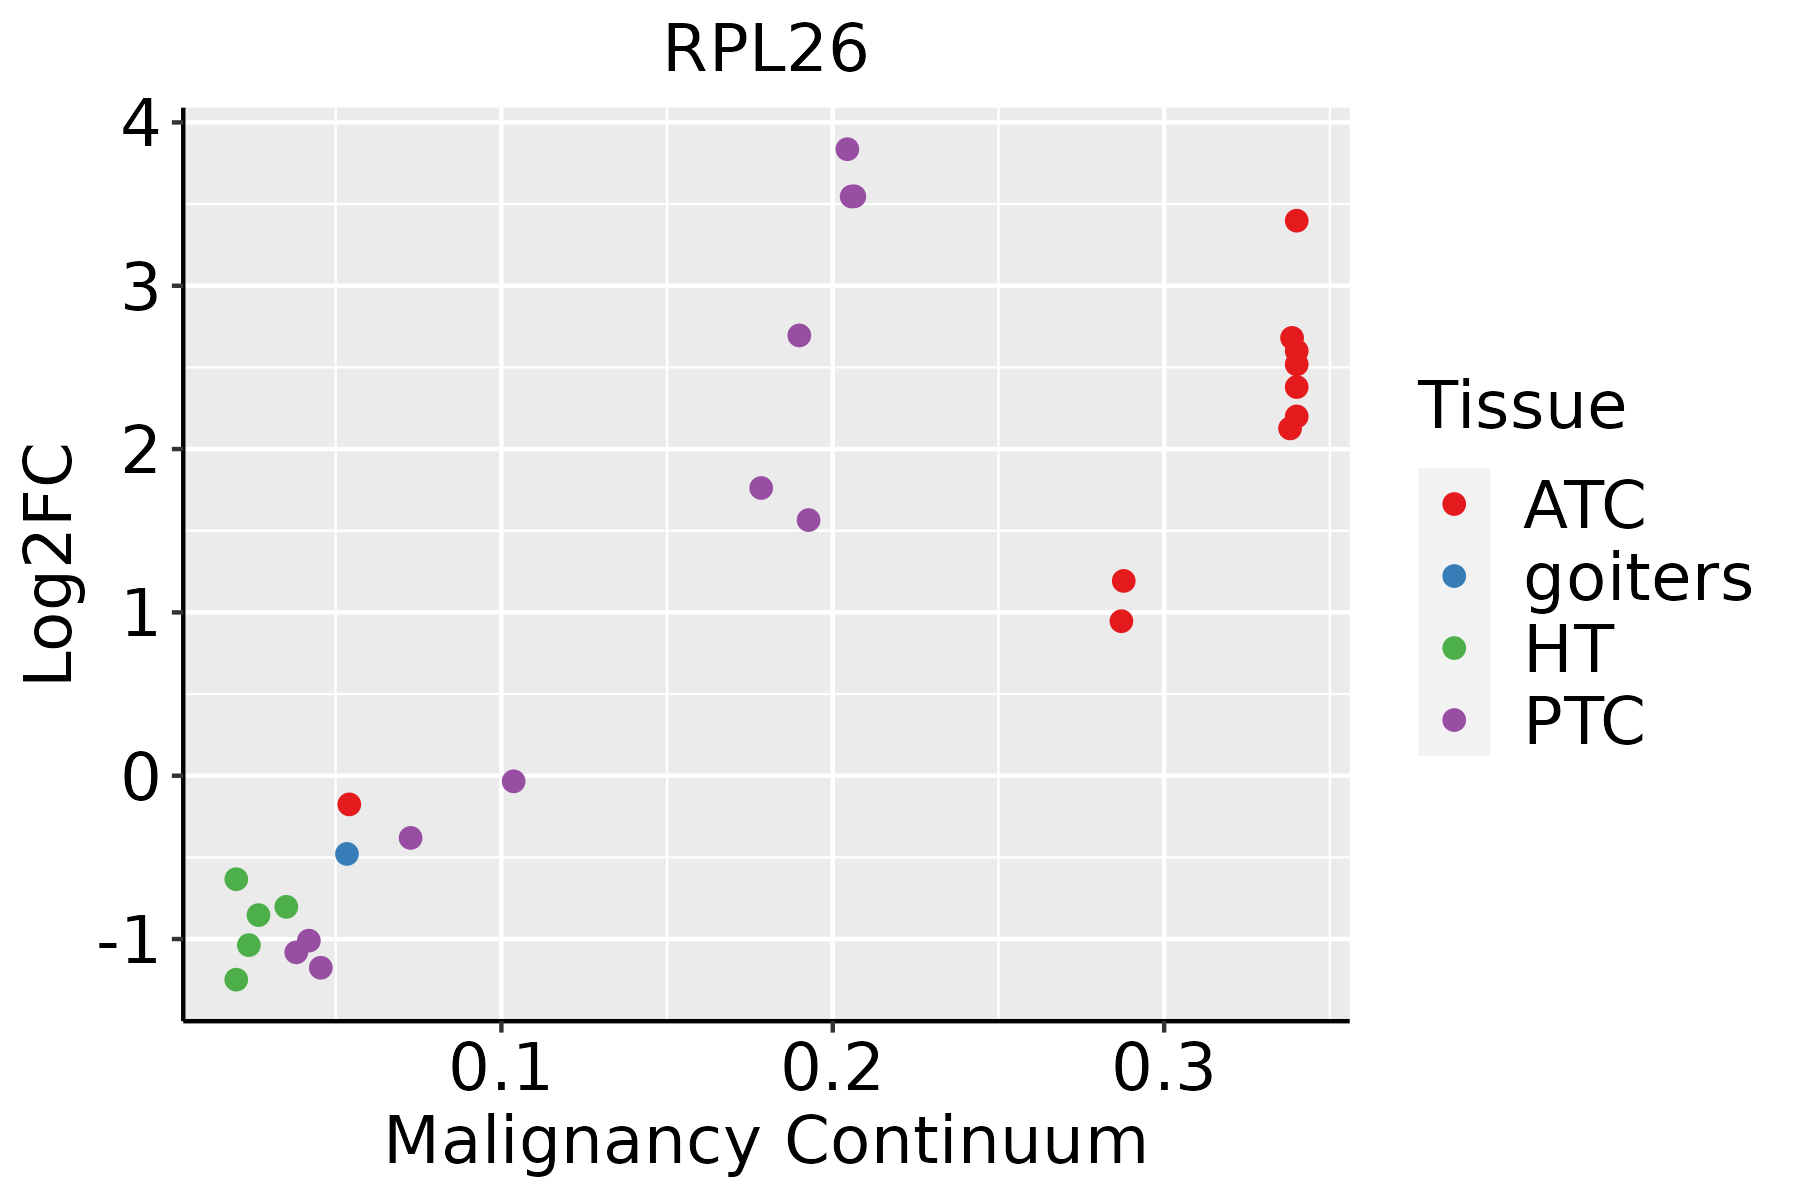 | ATC: Anaplastic thyroid cancer |
| HT: Hashimoto's thyroiditis |
| PTC: Papillary thyroid cancer |
| GO ID | Tissue | Disease Stage | Description | Gene Ratio | Bg Ratio | pvalue | p.adjust | Count |
| GO:00021819 | Breast | Precancer | cytoplasmic translation | 80/1080 | 148/18723 | 1.59e-59 | 8.54e-56 | 80 |
| GO:00226139 | Breast | Precancer | ribonucleoprotein complex biogenesis | 79/1080 | 463/18723 | 2.11e-18 | 1.03e-15 | 79 |
| GO:00971939 | Breast | Precancer | intrinsic apoptotic signaling pathway | 59/1080 | 288/18723 | 8.07e-18 | 3.60e-15 | 59 |
| GO:20012339 | Breast | Precancer | regulation of apoptotic signaling pathway | 65/1080 | 356/18723 | 7.70e-17 | 3.17e-14 | 65 |
| GO:20012429 | Breast | Precancer | regulation of intrinsic apoptotic signaling pathway | 41/1080 | 164/18723 | 6.48e-16 | 2.31e-13 | 41 |
| GO:00422549 | Breast | Precancer | ribosome biogenesis | 52/1080 | 299/18723 | 7.35e-13 | 1.51e-10 | 52 |
| GO:00064179 | Breast | Precancer | regulation of translation | 67/1080 | 468/18723 | 4.71e-12 | 7.64e-10 | 67 |
| GO:00457279 | Breast | Precancer | positive regulation of translation | 32/1080 | 136/18723 | 5.89e-12 | 9.27e-10 | 32 |
| GO:00422739 | Breast | Precancer | ribosomal large subunit biogenesis | 22/1080 | 72/18723 | 5.03e-11 | 5.61e-09 | 22 |
| GO:00342509 | Breast | Precancer | positive regulation of cellular amide metabolic process | 33/1080 | 162/18723 | 1.72e-10 | 1.77e-08 | 33 |
| GO:20012445 | Breast | Precancer | positive regulation of intrinsic apoptotic signaling pathway | 17/1080 | 58/18723 | 1.59e-08 | 1.12e-06 | 17 |
| GO:00063646 | Breast | Precancer | rRNA processing | 35/1080 | 225/18723 | 7.90e-08 | 4.60e-06 | 35 |
| GO:00160726 | Breast | Precancer | rRNA metabolic process | 36/1080 | 236/18723 | 8.59e-08 | 4.84e-06 | 36 |
| GO:20012356 | Breast | Precancer | positive regulation of apoptotic signaling pathway | 24/1080 | 126/18723 | 1.98e-07 | 1.01e-05 | 24 |
| GO:19017989 | Breast | Precancer | positive regulation of signal transduction by p53 class mediator | 10/1080 | 25/18723 | 5.77e-07 | 2.49e-05 | 10 |
| GO:19017969 | Breast | Precancer | regulation of signal transduction by p53 class mediator | 19/1080 | 93/18723 | 1.20e-06 | 4.60e-05 | 19 |
| GO:00723319 | Breast | Precancer | signal transduction by p53 class mediator | 26/1080 | 163/18723 | 2.23e-06 | 7.76e-05 | 26 |
| GO:00723328 | Breast | Precancer | intrinsic apoptotic signaling pathway by p53 class mediator | 16/1080 | 76/18723 | 5.49e-06 | 1.63e-04 | 16 |
| GO:00103323 | Breast | Precancer | response to gamma radiation | 13/1080 | 56/18723 | 1.35e-05 | 3.38e-04 | 13 |
| GO:19022537 | Breast | Precancer | regulation of intrinsic apoptotic signaling pathway by p53 class mediator | 9/1080 | 29/18723 | 2.40e-05 | 5.53e-04 | 9 |
| Pathway ID | Tissue | Disease Stage | Description | Gene Ratio | Bg Ratio | pvalue | p.adjust | qvalue | Count |
| hsa0301018 | Breast | Precancer | Ribosome | 80/684 | 167/8465 | 7.33e-44 | 2.32e-41 | 1.77e-41 | 80 |
| hsa0517118 | Breast | Precancer | Coronavirus disease - COVID-19 | 81/684 | 232/8465 | 3.74e-32 | 2.36e-30 | 1.81e-30 | 81 |
| hsa0301019 | Breast | Precancer | Ribosome | 80/684 | 167/8465 | 7.33e-44 | 2.32e-41 | 1.77e-41 | 80 |
| hsa0517119 | Breast | Precancer | Coronavirus disease - COVID-19 | 81/684 | 232/8465 | 3.74e-32 | 2.36e-30 | 1.81e-30 | 81 |
| hsa0301024 | Breast | IDC | Ribosome | 83/867 | 167/8465 | 6.07e-39 | 9.87e-37 | 7.38e-37 | 83 |
| hsa0517124 | Breast | IDC | Coronavirus disease - COVID-19 | 86/867 | 232/8465 | 1.50e-28 | 9.72e-27 | 7.27e-27 | 86 |
| hsa0301034 | Breast | IDC | Ribosome | 83/867 | 167/8465 | 6.07e-39 | 9.87e-37 | 7.38e-37 | 83 |
| hsa0517134 | Breast | IDC | Coronavirus disease - COVID-19 | 86/867 | 232/8465 | 1.50e-28 | 9.72e-27 | 7.27e-27 | 86 |
| hsa0301044 | Breast | DCIS | Ribosome | 82/846 | 167/8465 | 8.69e-39 | 1.40e-36 | 1.03e-36 | 82 |
| hsa0517144 | Breast | DCIS | Coronavirus disease - COVID-19 | 86/846 | 232/8465 | 2.42e-29 | 1.56e-27 | 1.15e-27 | 86 |
| hsa0301054 | Breast | DCIS | Ribosome | 82/846 | 167/8465 | 8.69e-39 | 1.40e-36 | 1.03e-36 | 82 |
| hsa0517154 | Breast | DCIS | Coronavirus disease - COVID-19 | 86/846 | 232/8465 | 2.42e-29 | 1.56e-27 | 1.15e-27 | 86 |
| hsa0517120 | Cervix | CC | Coronavirus disease - COVID-19 | 111/1267 | 232/8465 | 1.82e-33 | 5.90e-31 | 3.49e-31 | 111 |
| hsa0301020 | Cervix | CC | Ribosome | 85/1267 | 167/8465 | 3.17e-28 | 5.14e-26 | 3.04e-26 | 85 |
| hsa05171110 | Cervix | CC | Coronavirus disease - COVID-19 | 111/1267 | 232/8465 | 1.82e-33 | 5.90e-31 | 3.49e-31 | 111 |
| hsa03010110 | Cervix | CC | Ribosome | 85/1267 | 167/8465 | 3.17e-28 | 5.14e-26 | 3.04e-26 | 85 |
| hsa0301025 | Cervix | HSIL_HPV | Ribosome | 80/459 | 167/8465 | 9.61e-58 | 2.82e-55 | 2.28e-55 | 80 |
| hsa0517125 | Cervix | HSIL_HPV | Coronavirus disease - COVID-19 | 91/459 | 232/8465 | 2.14e-56 | 3.13e-54 | 2.53e-54 | 91 |
| hsa0301035 | Cervix | HSIL_HPV | Ribosome | 80/459 | 167/8465 | 9.61e-58 | 2.82e-55 | 2.28e-55 | 80 |
| hsa0517135 | Cervix | HSIL_HPV | Coronavirus disease - COVID-19 | 91/459 | 232/8465 | 2.14e-56 | 3.13e-54 | 2.53e-54 | 91 |


