
|
|||||
|
 | |
| |
| |
| |
| |
| |
|
Gene: RPL29 |
Gene summary for RPL29 |
| Gene information | Species | Human | Gene symbol | RPL29 | Gene ID | 6159 |
| Gene name | ribosomal protein L29 | |
| Gene Alias | HIP | |
| Cytomap | 3p21.2 | |
| Gene Type | protein-coding | GO ID | GO:0000003 | UniProtAcc | P47914 |
Top |
Malignant transformation analysis |
| Identification of the aberrant gene expression in precancerous and cancerous lesions by comparing the gene expression of stem-like cells in diseased tissues with normal stem cells |
| Entrez ID | Symbol | Replicates | Species | Organ | Tissue | Adj P-value | Log2FC | Malignancy |
| 6159 | RPL29 | GSM5353217_PA_PB1A_Pool_2_S107_L004 | Human | Prostate | Tumor | 2.61e-24 | -1.56e+00 | 0.156 |
| 6159 | RPL29 | GSM5353218_PA_PB1B_Pool_1_2_S74_L003 | Human | Prostate | Tumor | 1.23e-31 | -1.30e+00 | 0.1479 |
| 6159 | RPL29 | GSM5353220_PA_PB1B_Pool_3_S51_L002 | Human | Prostate | Tumor | 2.24e-28 | -1.22e+00 | 0.1531 |
| 6159 | RPL29 | GSM5353221_PA_PB2A_Pool_1_3_S25_L001 | Human | Prostate | Tumor | 1.77e-90 | -1.23e+00 | 0.1633 |
| 6159 | RPL29 | GSM5353222_PA_PB2B_Pool_1_3_S52_L002 | Human | Prostate | Tumor | 6.95e-100 | -1.32e+00 | 0.1608 |
| 6159 | RPL29 | GSM5353223_PA_PB2B_Pool_2_S26_L001 | Human | Prostate | Tumor | 4.08e-78 | -1.15e+00 | 0.1604 |
| 6159 | RPL29 | GSM5353224_PA_PR5186_Pool_1_2_3_S27_L001 | Human | Prostate | Tumor | 4.57e-101 | -1.26e+00 | 0.1621 |
| 6159 | RPL29 | GSM5353225_PA_PR5196-1_Pool_1_2_3_S53_L002 | Human | Prostate | Tumor | 2.60e-50 | -1.40e+00 | 0.1619 |
| 6159 | RPL29 | GSM5353226_PA_PR5196-2_Pool_1_2_3_S54_L002 | Human | Prostate | Tumor | 6.37e-45 | -1.53e+00 | 0.159 |
| 6159 | RPL29 | GSM5353227_PA_PR5199-193K_Pool_1_2_3_S55_L002 | Human | Prostate | Tumor | 9.50e-84 | -1.62e+00 | 0.1602 |
| 6159 | RPL29 | GSM5353228_PA_PR5199-640K_Pool_1_3_S108_L004 | Human | Prostate | Tumor | 3.79e-24 | -1.87e+00 | 0.1537 |
| 6159 | RPL29 | GSM5353232_PA_PR5249_T1_S3_L001 | Human | Prostate | Tumor | 9.86e-32 | -2.11e+00 | 0.1439 |
| 6159 | RPL29 | GSM5353236_PA_PR5251_T1_S7_L001 | Human | Prostate | Tumor | 7.20e-58 | -1.70e+00 | 0.1608 |
| 6159 | RPL29 | GSM5353237_PA_PR5251_T2_S8_L001 | Human | Prostate | Tumor | 3.35e-41 | -1.37e+00 | 0.1622 |
| 6159 | RPL29 | GSM5353240_PA_PR5254_T1_S15_L001 | Human | Prostate | Tumor | 4.13e-112 | -1.63e+00 | 0.1575 |
| 6159 | RPL29 | GSM5353243_PA_PR5261_T1_S23_L002 | Human | Prostate | Tumor | 9.30e-94 | -1.51e+00 | 0.1545 |
| 6159 | RPL29 | GSM5353244_PA_PR5261_T2_S24_L002 | Human | Prostate | Tumor | 2.61e-84 | -1.53e+00 | 0.1569 |
| 6159 | RPL29 | GSM5353247_PA_PR5269_3_S27_L002 | Human | Prostate | Tumor | 8.31e-17 | -1.58e+00 | 0.1532 |
| 6159 | RPL29 | GSM5353248_PA_PR5269_4_S28_L002 | Human | Prostate | Tumor | 2.73e-28 | -1.80e+00 | 0.1541 |
| 6159 | RPL29 | P1_S1_AK | Human | Skin | AK | 1.10e-02 | 4.32e-02 | -0.3399 |
| Page: 1 2 3 4 5 6 7 8 9 10 11 12 13 14 15 16 17 18 19 |
| Tissue | Expression Dynamics | Abbreviation |
| Breast | 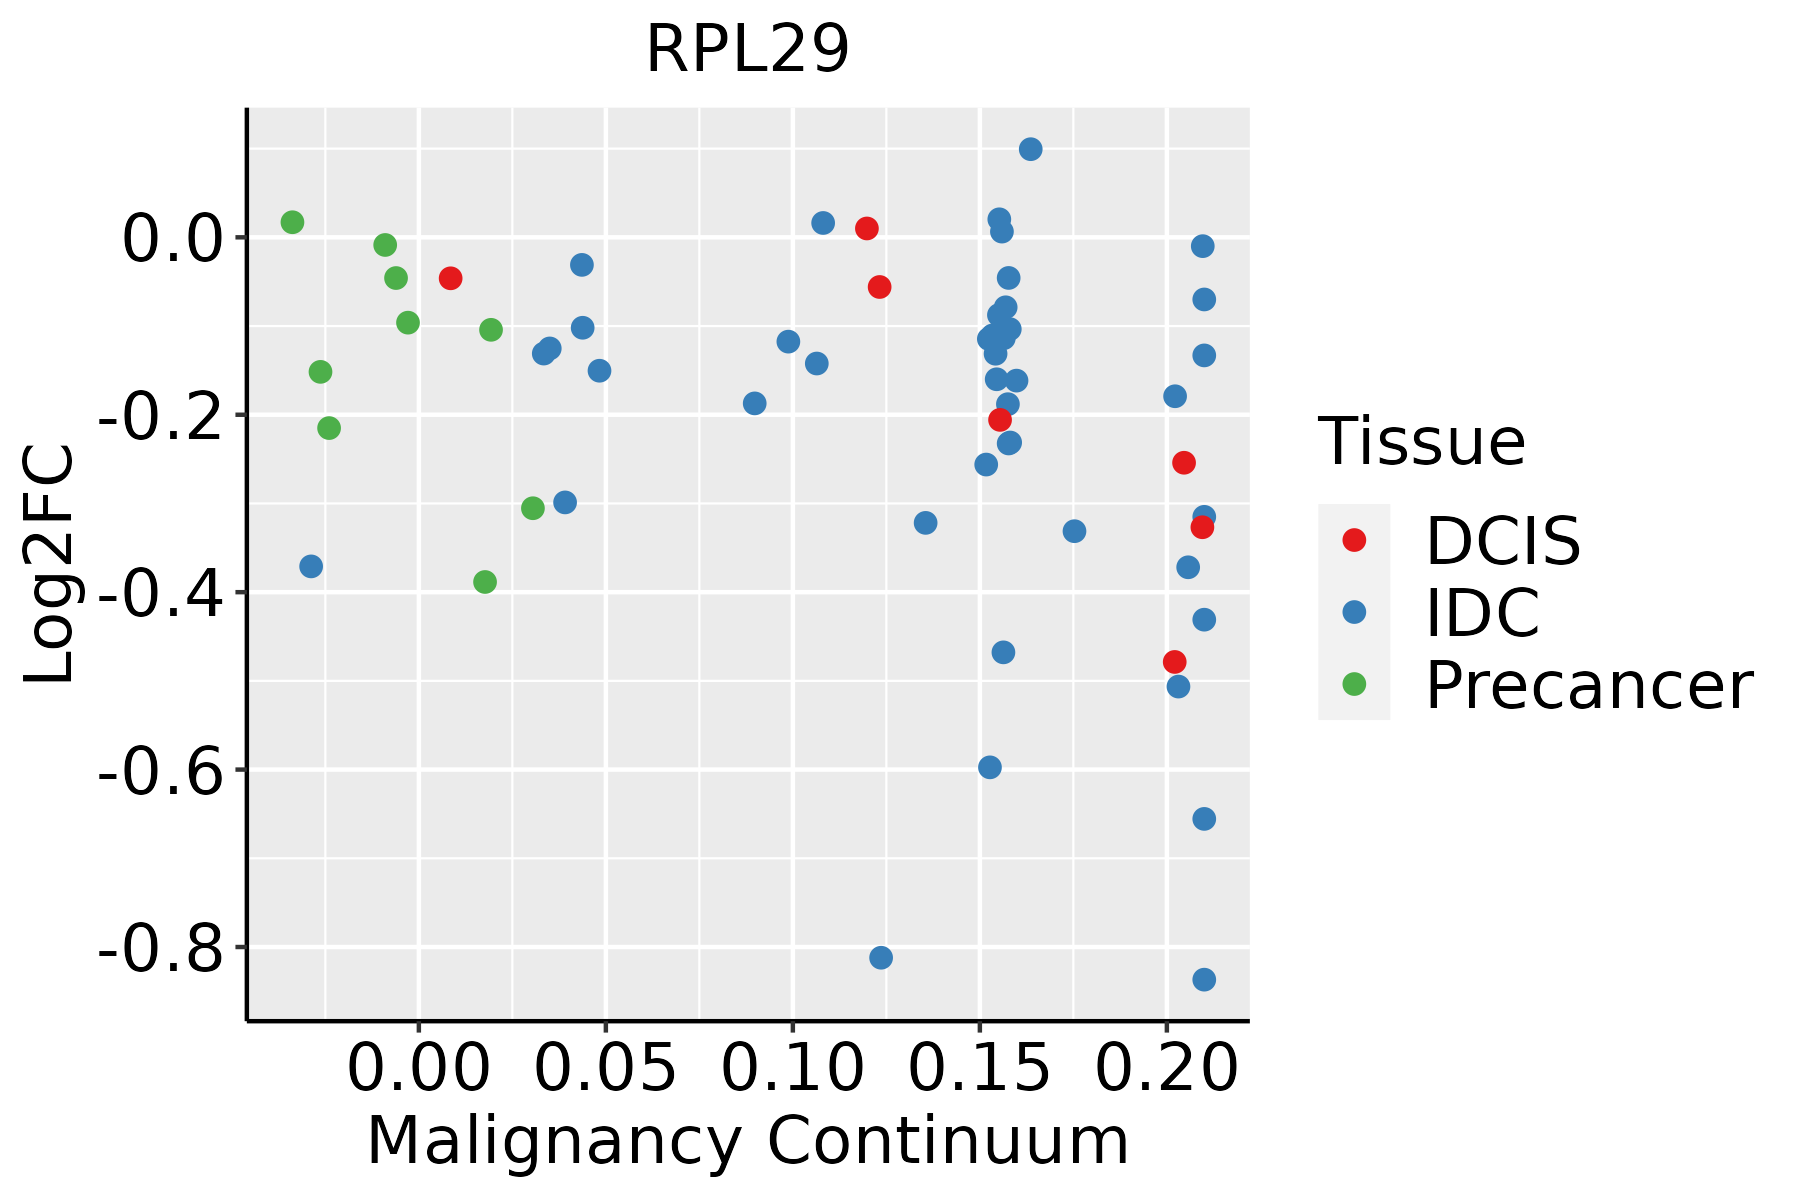 | IDC: Invasive ductal carcinoma |
| DCIS: Ductal carcinoma in situ | ||
| Precancer(BRCA1-mut): Precancerous lesion from BRCA1 mutation carriers | ||
| Cervix |  | CC: Cervix cancer |
| HSIL_HPV: HPV-infected high-grade squamous intraepithelial lesions | ||
| N_HPV: HPV-infected normal cervix | ||
| Colorectum (GSE201348) |  | FAP: Familial adenomatous polyposis |
| CRC: Colorectal cancer | ||
| Colorectum (HTA11) |  | AD: Adenomas |
| SER: Sessile serrated lesions | ||
| MSI-H: Microsatellite-high colorectal cancer | ||
| MSS: Microsatellite stable colorectal cancer | ||
| Endometrium | 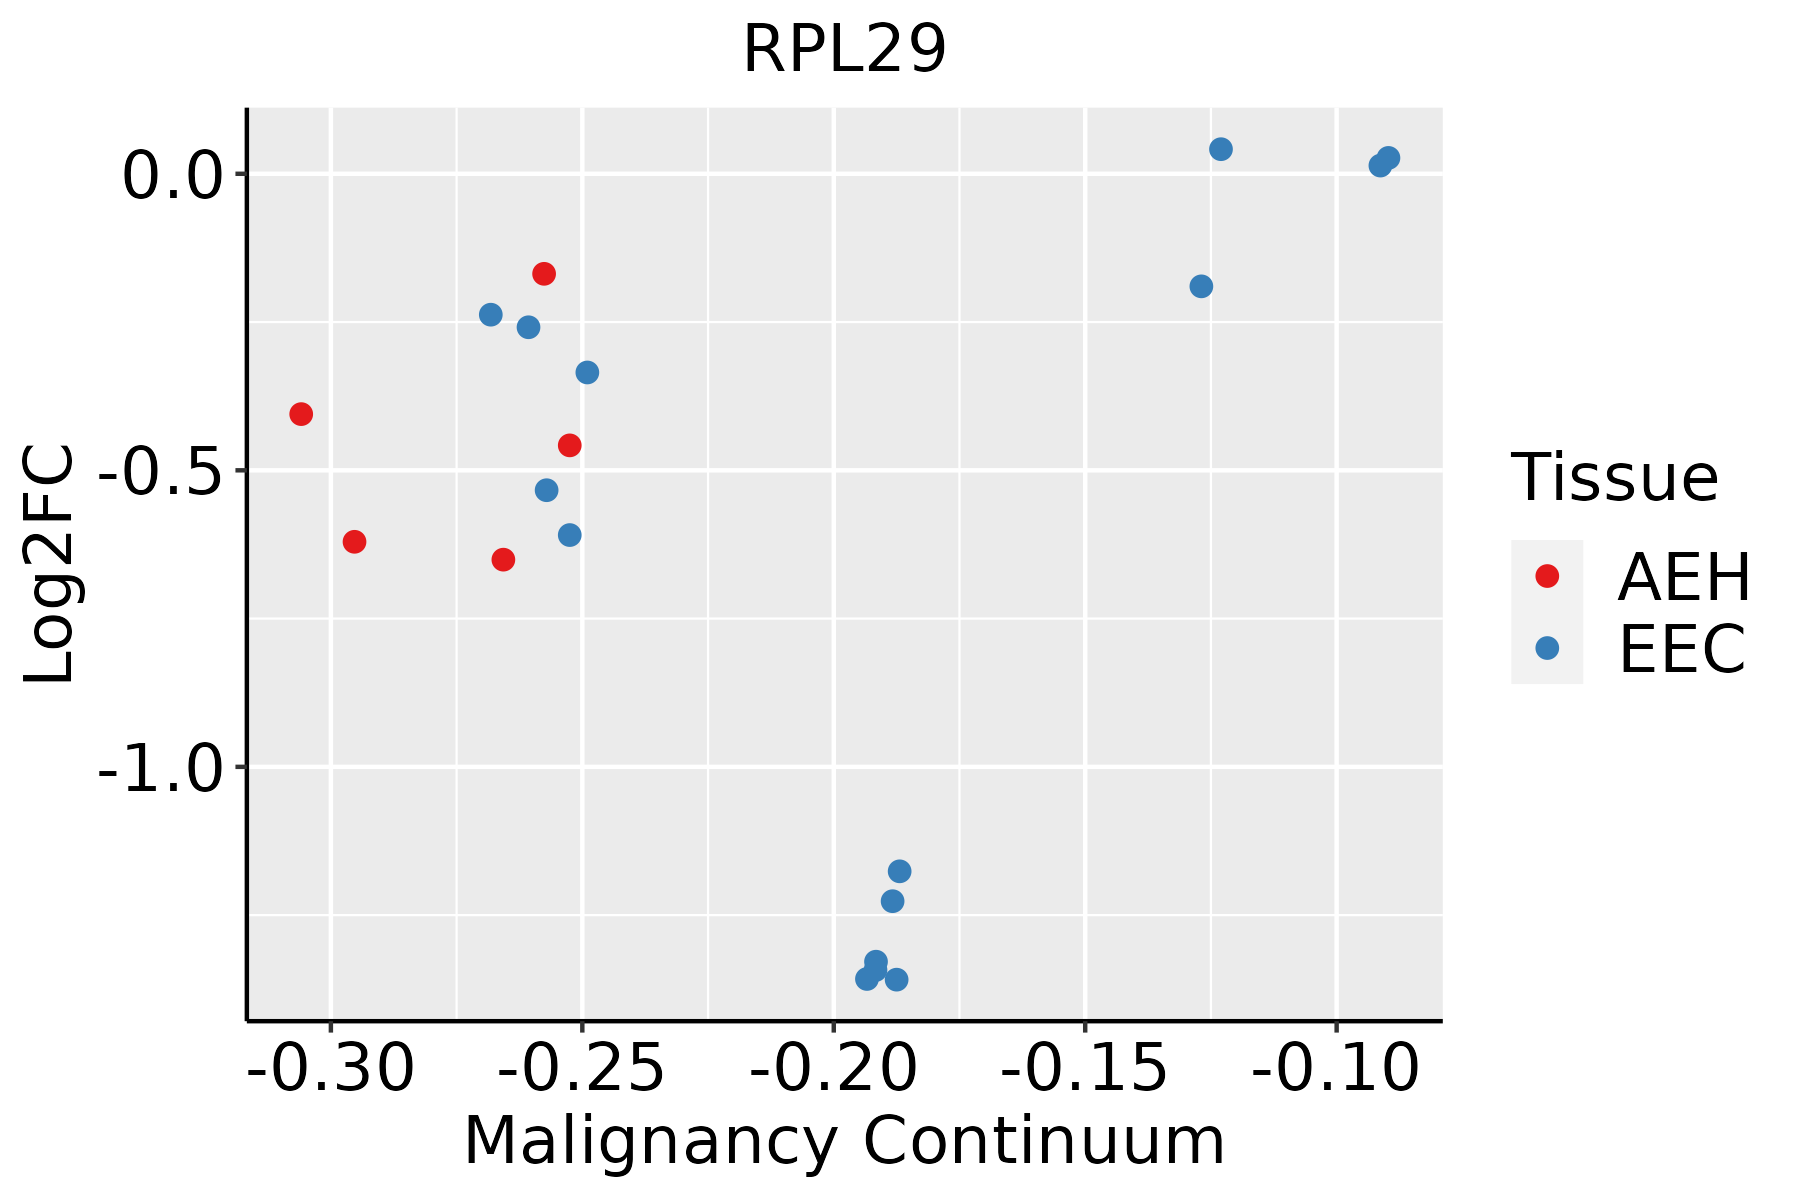 | AEH: Atypical endometrial hyperplasia |
| EEC: Endometrioid Cancer | ||
| Esophagus | 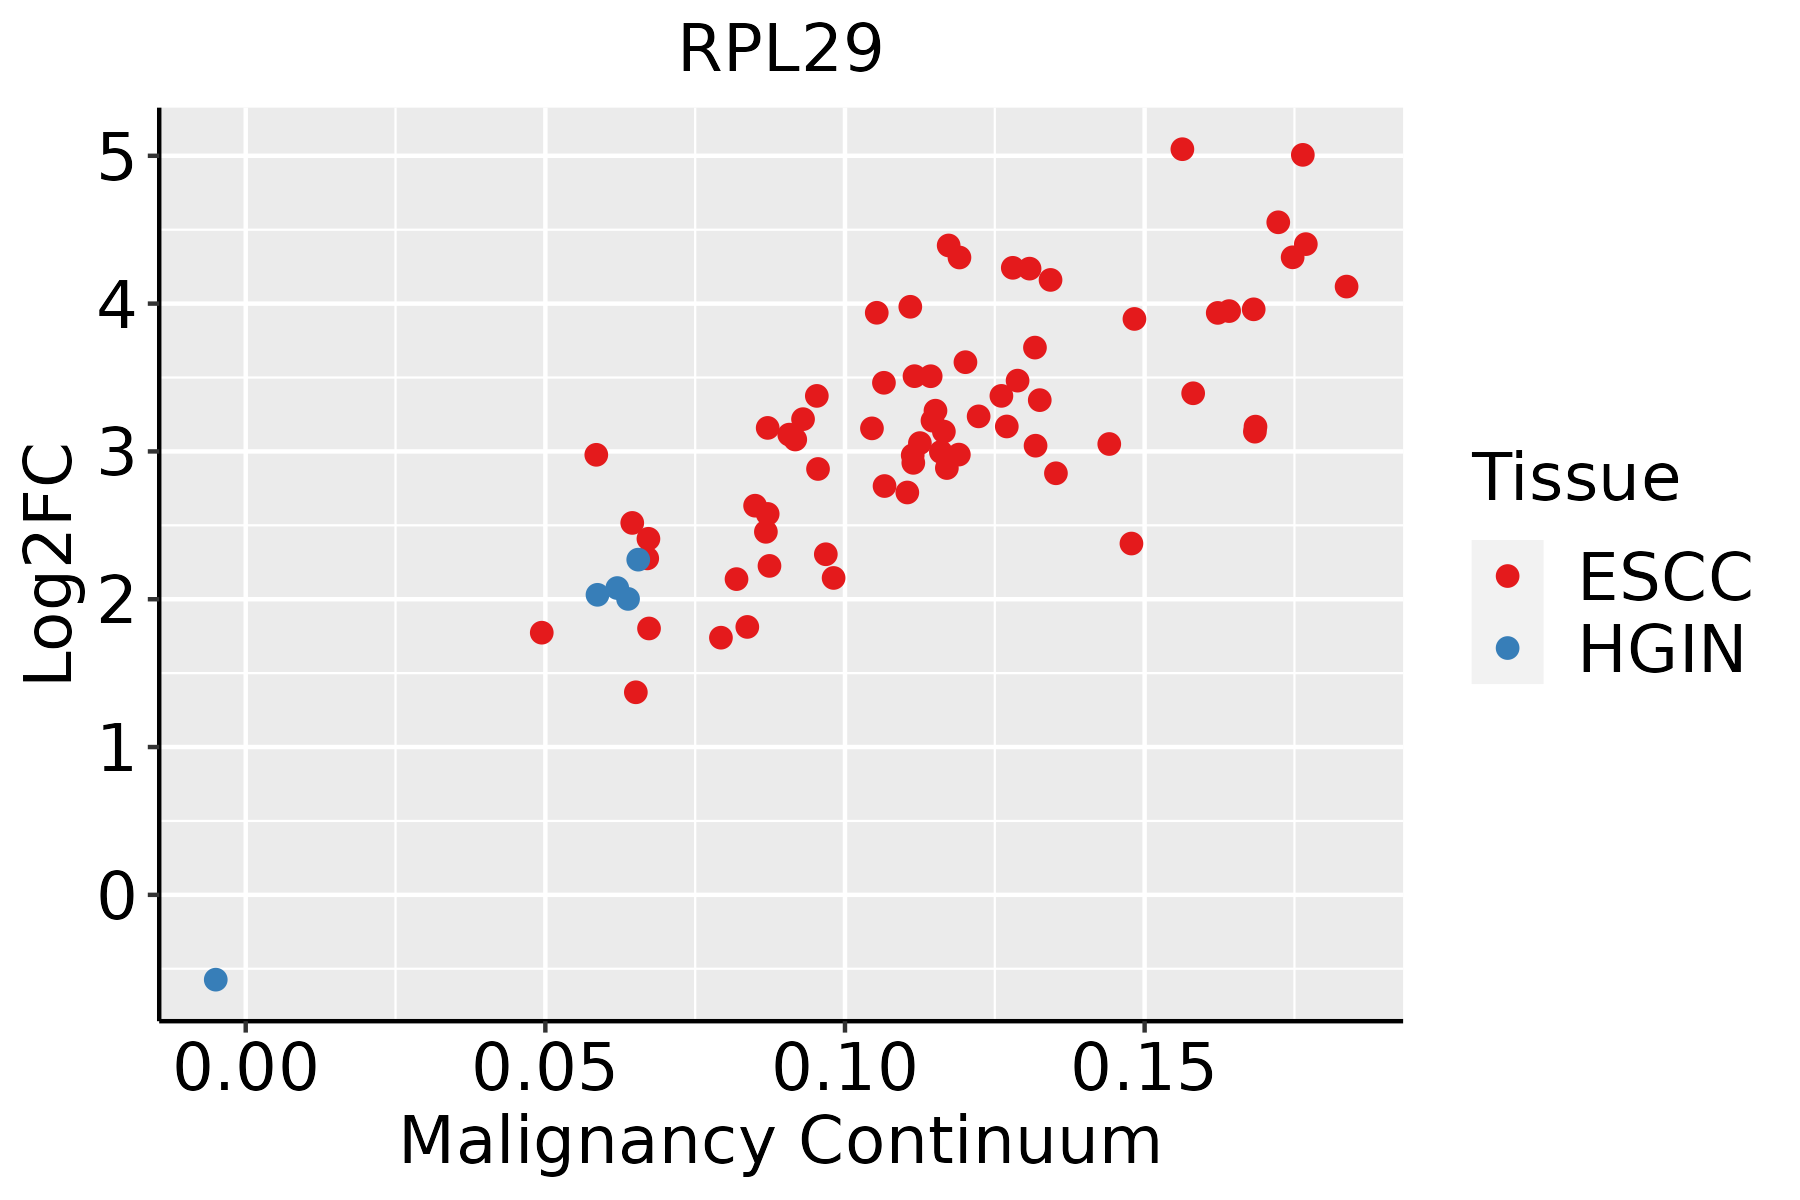 | ESCC: Esophageal squamous cell carcinoma |
| HGIN: High-grade intraepithelial neoplasias | ||
| LGIN: Low-grade intraepithelial neoplasias | ||
| GC | 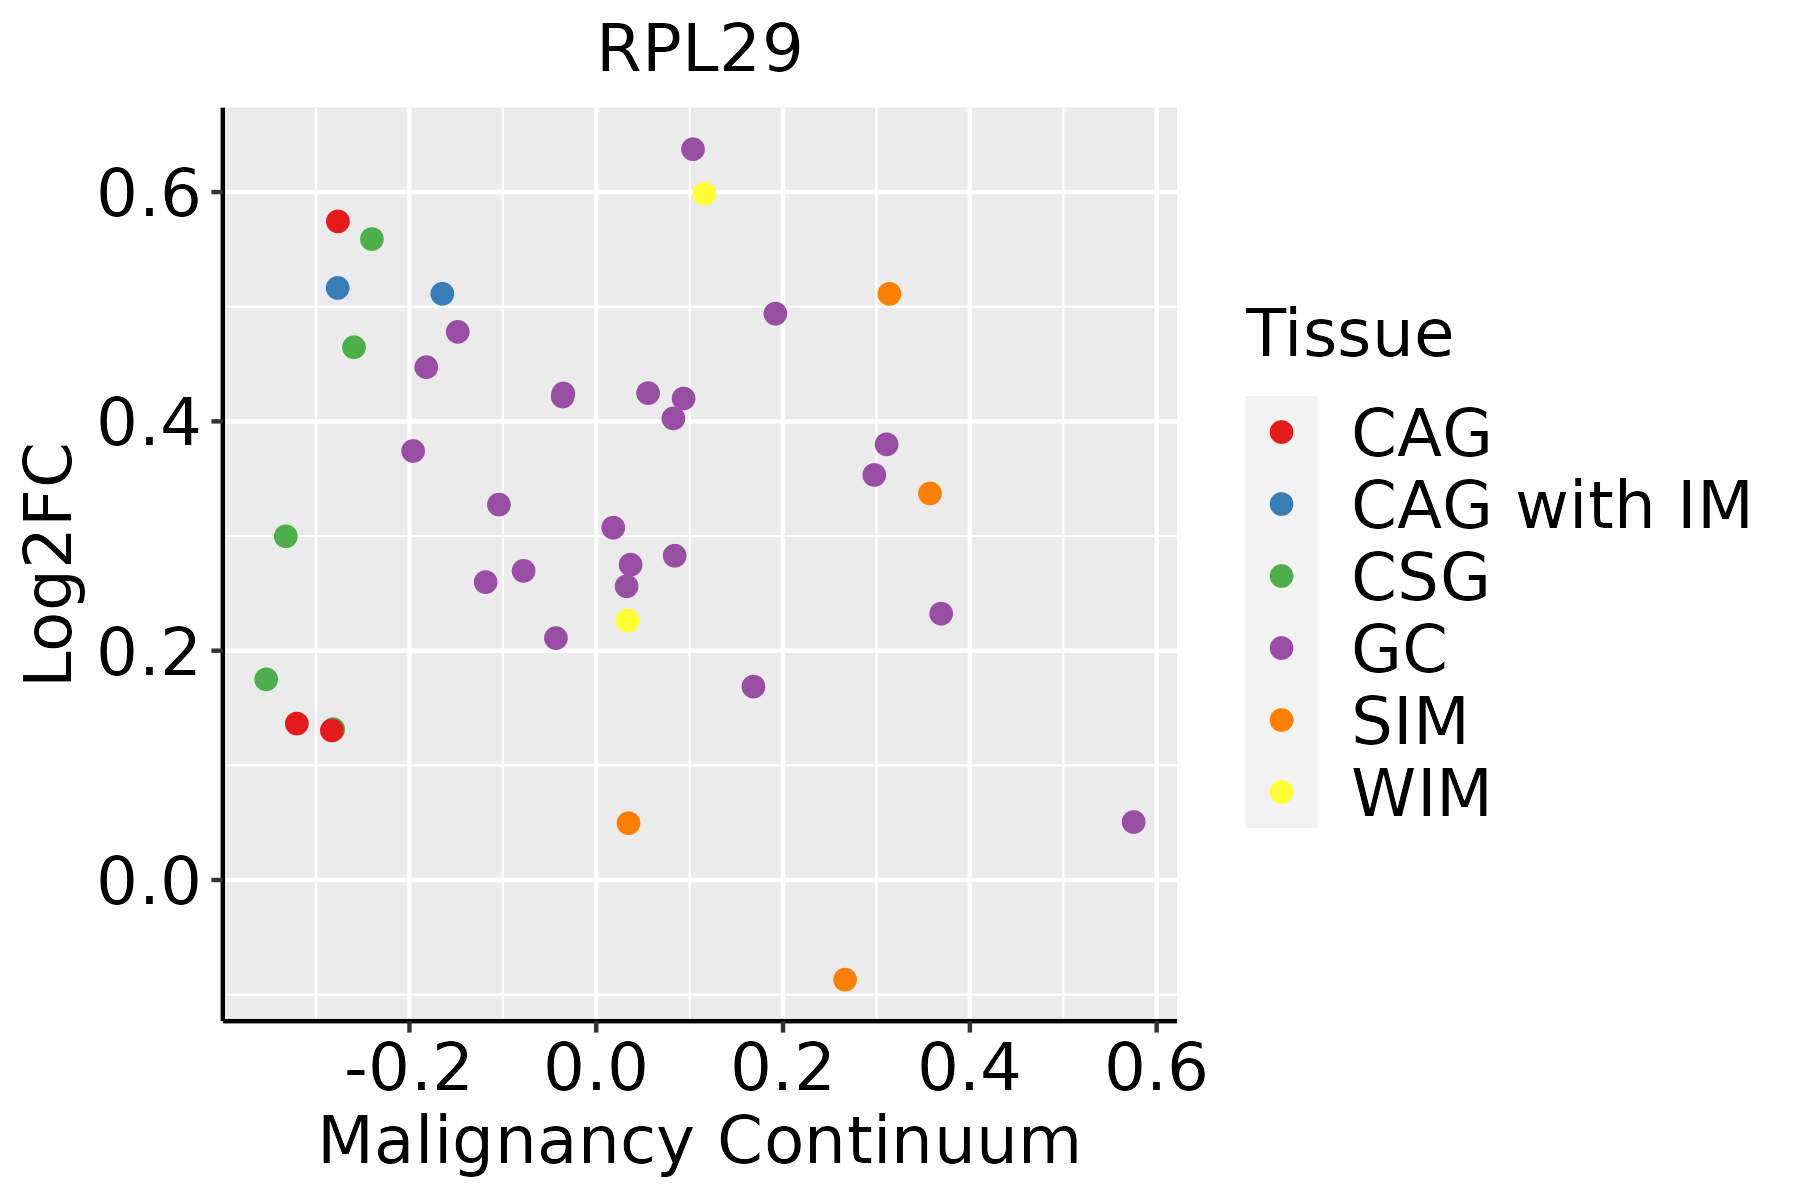 | CAG: Chronic atrophic gastritis |
| CAG with IM: Chronic atrophic gastritis with intestinal metaplasia | ||
| CSG: Chronic superficial gastritis | ||
| GC: Gastric cancer | ||
| SIM: Severe intestinal metaplasia | ||
| WIM: Wild intestinal metaplasia | ||
| Liver | 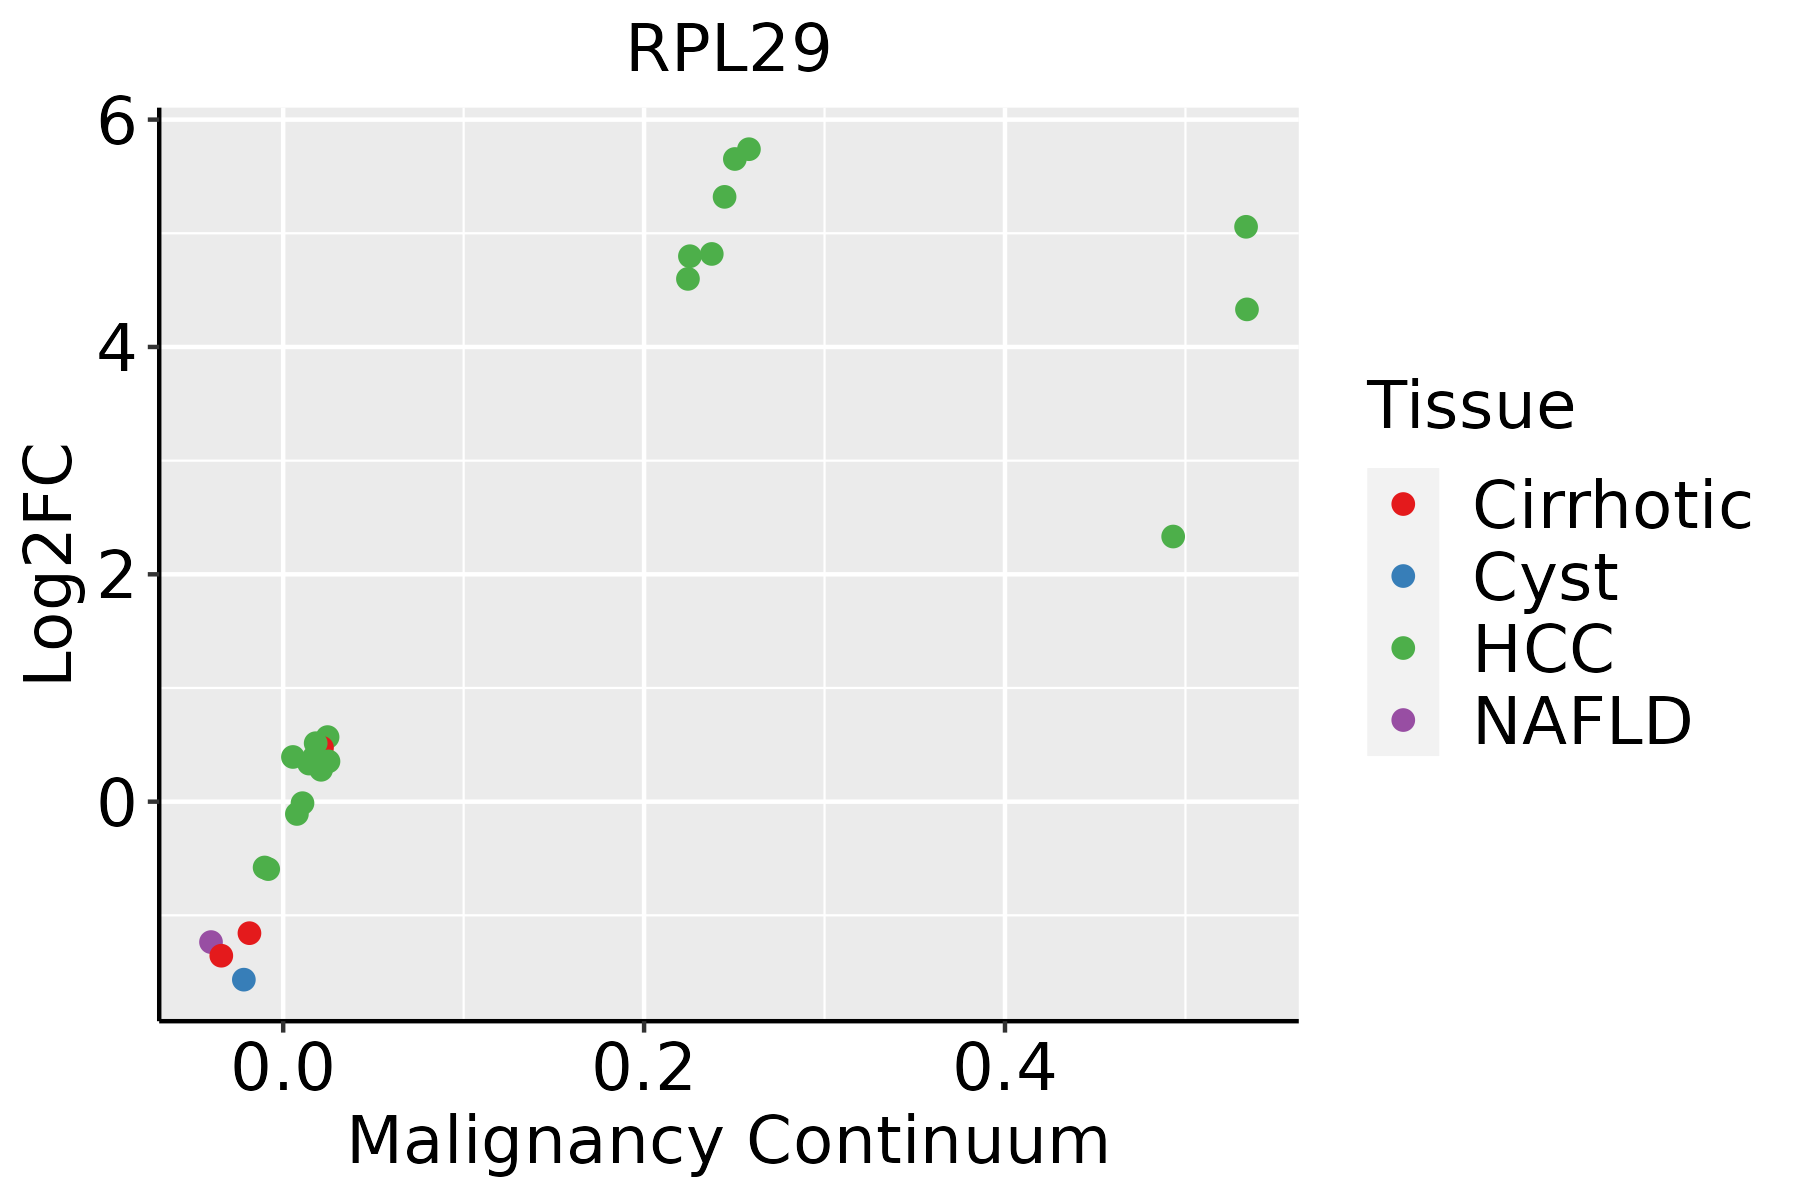 | HCC: Hepatocellular carcinoma |
| NAFLD: Non-alcoholic fatty liver disease | ||
| Oral Cavity | 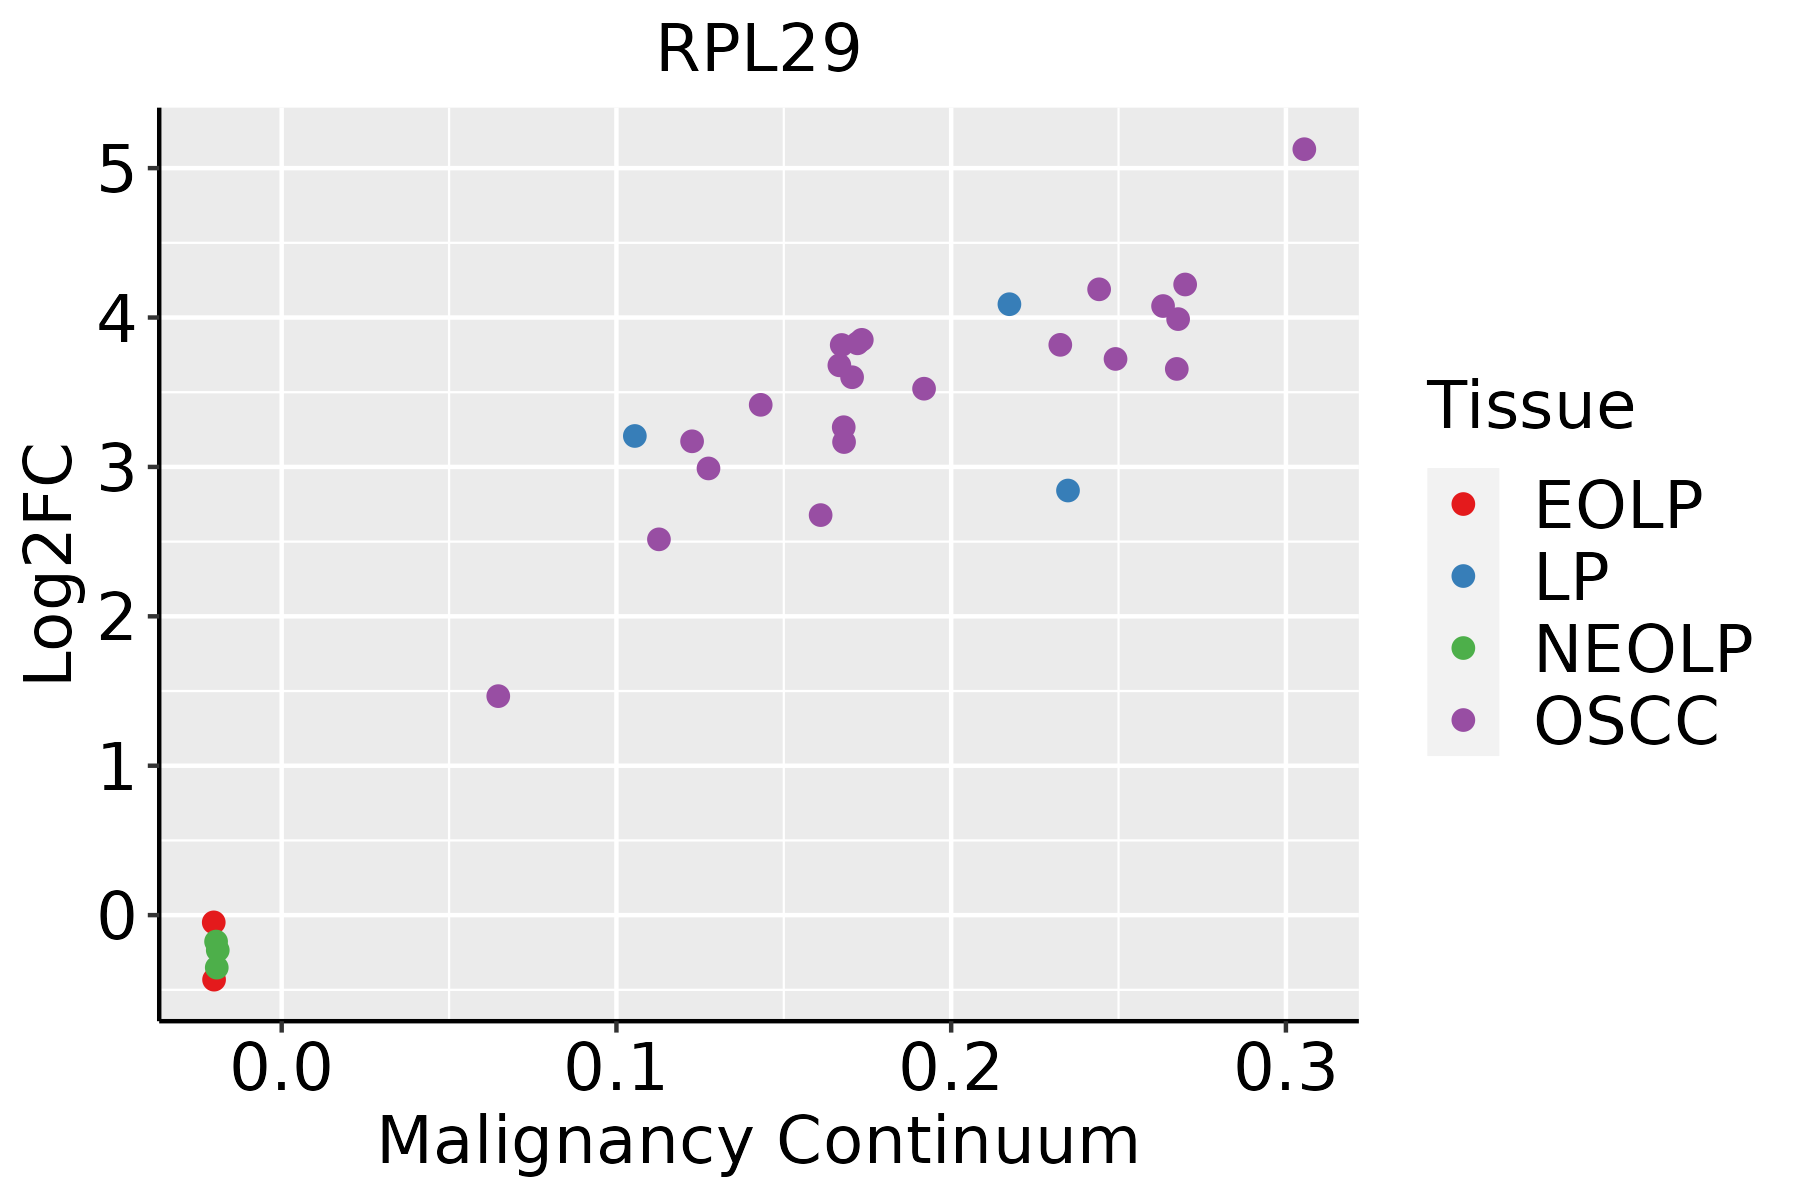 | EOLP: Erosive Oral lichen planus |
| LP: leukoplakia | ||
| NEOLP: Non-erosive oral lichen planus | ||
| OSCC: Oral squamous cell carcinoma | ||
| Prostate | 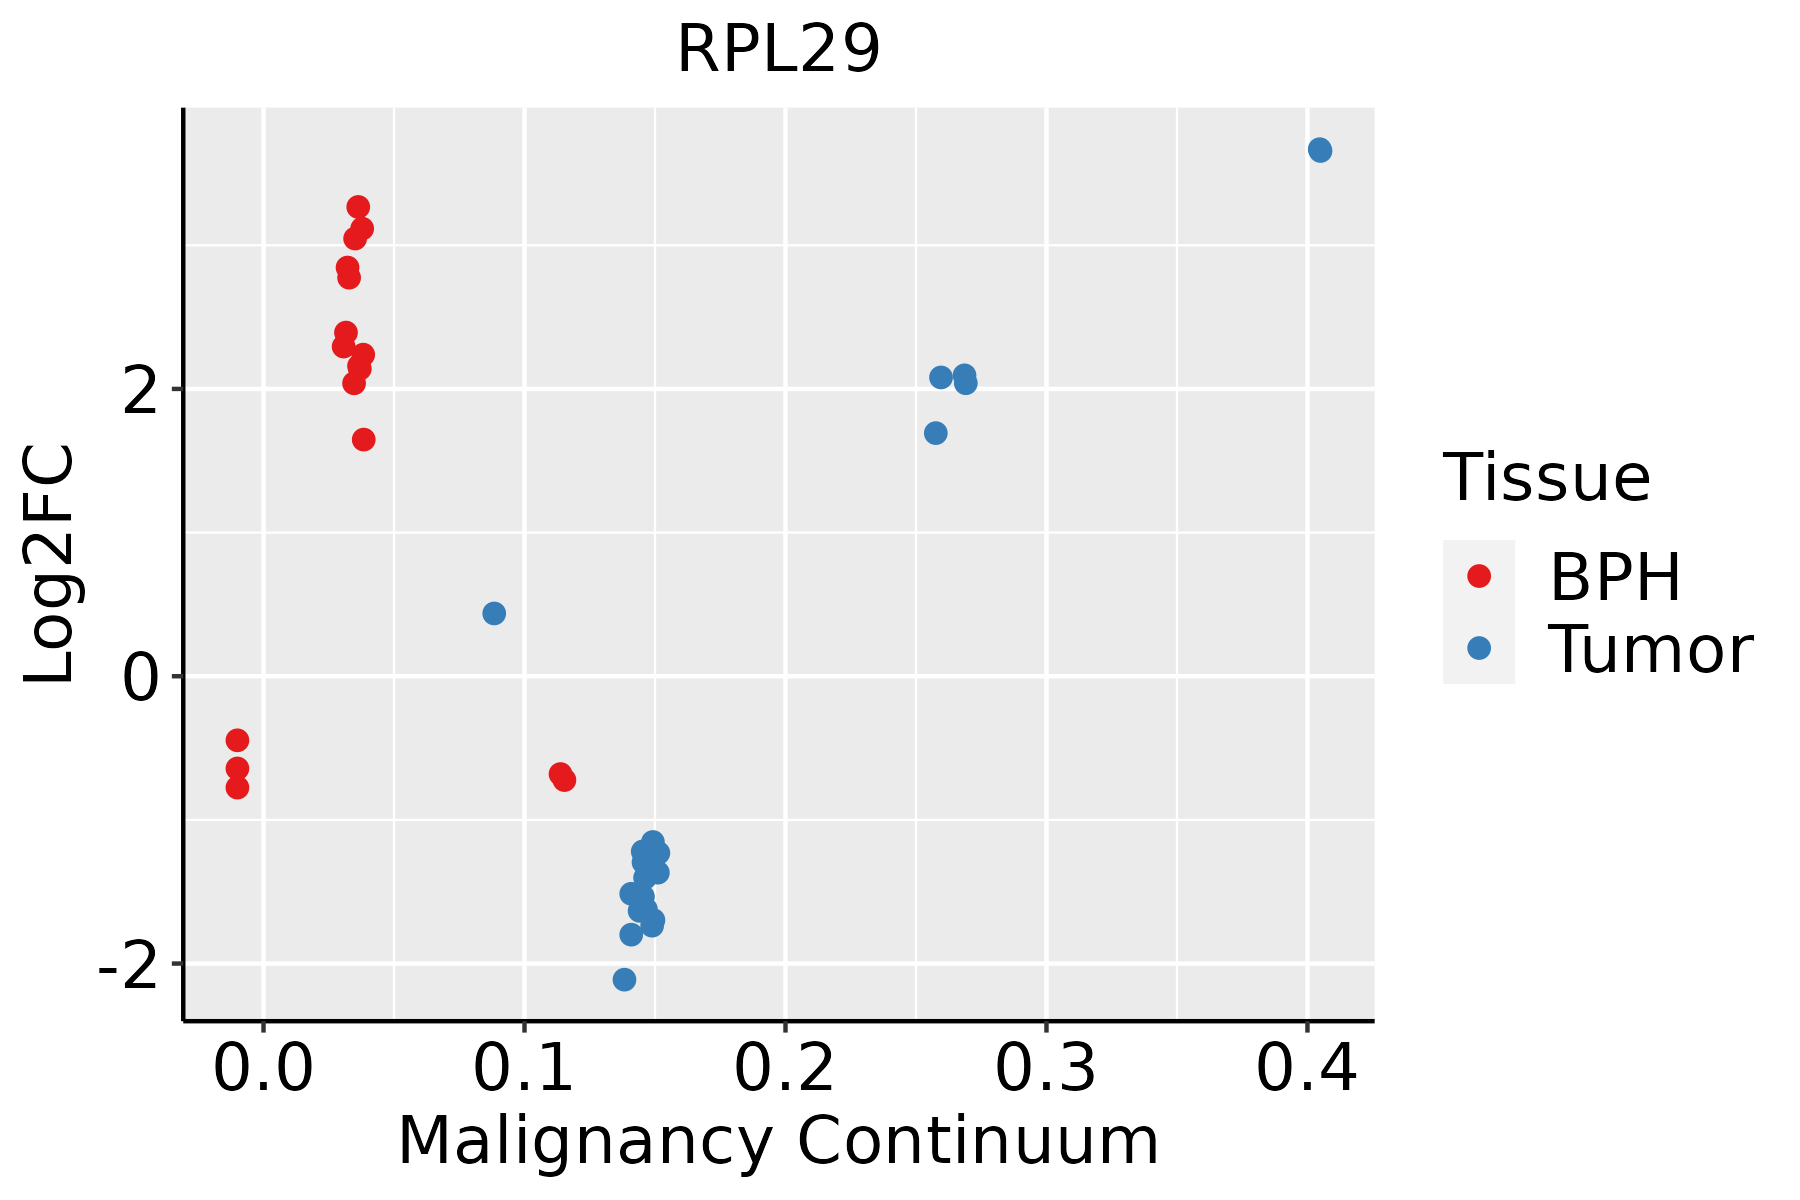 | BPH: Benign Prostatic Hyperplasia |
| Skin | 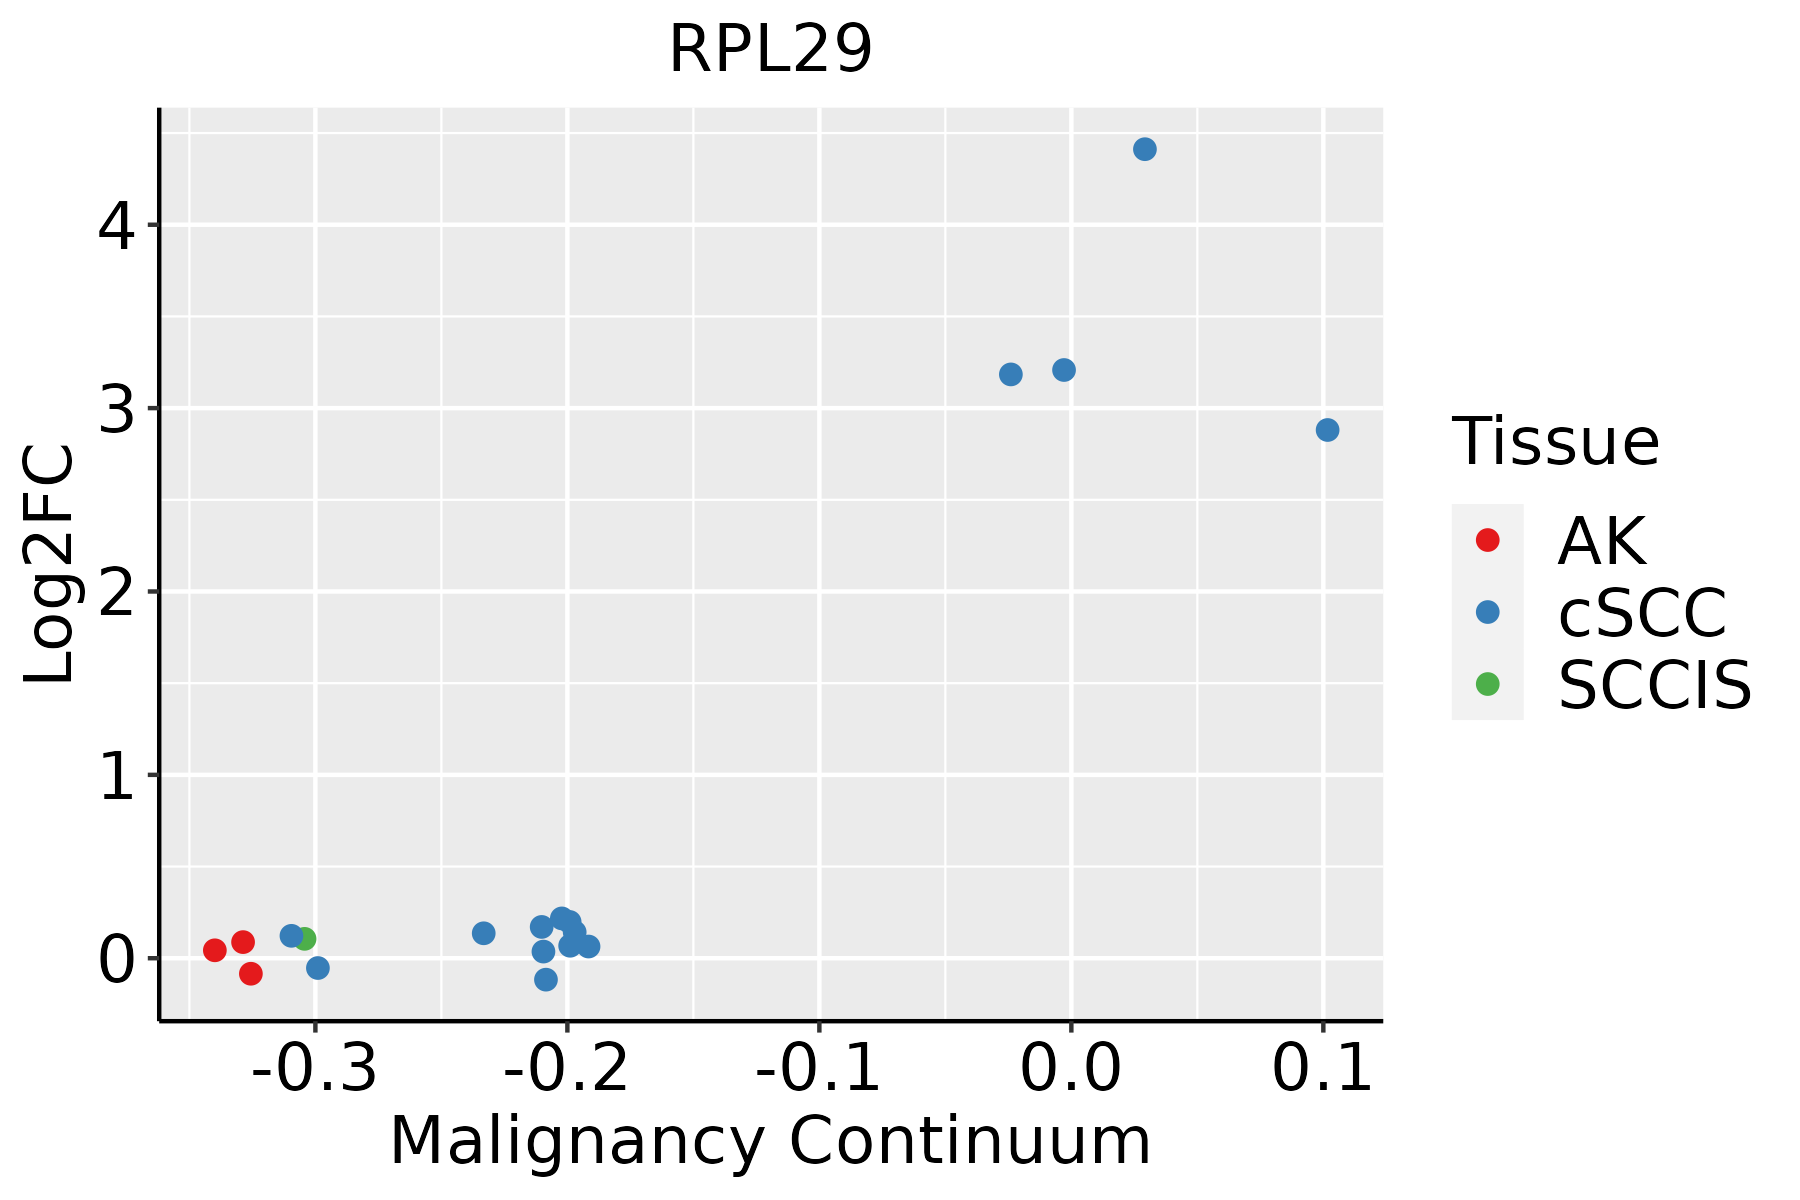 | AK: Actinic keratosis |
| cSCC: Cutaneous squamous cell carcinoma | ||
| SCCIS:squamous cell carcinoma in situ | ||
| Thyroid |  | ATC: Anaplastic thyroid cancer |
| HT: Hashimoto's thyroiditis | ||
| PTC: Papillary thyroid cancer |
| ∗log2FC in expression of this searched gene in stem-like cells from each diseased tissue sample relative to stem-like cells in normal samples in each tissue plotted against the malignancy continuum. Samples are colored based on if they are from different disease stage. |
Top |
Malignant transformation related pathway analysis |
| Find out the enriched GO biological processes and KEGG pathways involved in transition from healthy to precancer to cancer |
| Tissue | Disease Stage | Enriched GO biological Processes |
| Colorectum | AD |  |
| Colorectum | SER |  |
| Colorectum | MSS |  |
| Colorectum | MSI-H |  |
| Colorectum | FAP |  |
| ∗Top 15 enriched GO BP terms are showed in the bar plot of each disease state in each tissue. Each row represents a significant GO biological process which is colored according to the -log10(p.adjust). |
| Page: 1 2 3 4 5 6 7 8 9 |
| GO ID | Tissue | Disease Stage | Description | Gene Ratio | Bg Ratio | pvalue | p.adjust | Count |
| GO:00021819 | Breast | Precancer | cytoplasmic translation | 80/1080 | 148/18723 | 1.59e-59 | 8.54e-56 | 80 |
| GO:00075653 | Breast | Precancer | female pregnancy | 29/1080 | 193/18723 | 2.07e-06 | 7.31e-05 | 29 |
| GO:00447063 | Breast | Precancer | multi-multicellular organism process | 31/1080 | 220/18723 | 3.73e-06 | 1.19e-04 | 31 |
| GO:00075663 | Breast | Precancer | embryo implantation | 11/1080 | 53/18723 | 1.82e-04 | 2.95e-03 | 11 |
| GO:000218114 | Breast | IDC | cytoplasmic translation | 82/1434 | 148/18723 | 2.60e-52 | 1.48e-48 | 82 |
| GO:000756511 | Breast | IDC | female pregnancy | 39/1434 | 193/18723 | 1.81e-08 | 1.27e-06 | 39 |
| GO:00447061 | Breast | IDC | multi-multicellular organism process | 41/1434 | 220/18723 | 8.58e-08 | 5.19e-06 | 41 |
| GO:000756611 | Breast | IDC | embryo implantation | 14/1434 | 53/18723 | 3.14e-05 | 7.32e-04 | 14 |
| GO:000218124 | Breast | DCIS | cytoplasmic translation | 82/1390 | 148/18723 | 2.21e-53 | 1.25e-49 | 82 |
| GO:00075652 | Breast | DCIS | female pregnancy | 37/1390 | 193/18723 | 7.85e-08 | 4.47e-06 | 37 |
| GO:00447062 | Breast | DCIS | multi-multicellular organism process | 39/1390 | 220/18723 | 3.05e-07 | 1.46e-05 | 39 |
| GO:00075662 | Breast | DCIS | embryo implantation | 13/1390 | 53/18723 | 1.00e-04 | 1.82e-03 | 13 |
| GO:000218110 | Cervix | CC | cytoplasmic translation | 96/2311 | 148/18723 | 4.87e-51 | 2.91e-47 | 96 |
| GO:00075654 | Cervix | CC | female pregnancy | 43/2311 | 193/18723 | 7.62e-05 | 1.04e-03 | 43 |
| GO:00447064 | Cervix | CC | multi-multicellular organism process | 45/2311 | 220/18723 | 4.14e-04 | 4.21e-03 | 45 |
| GO:00075664 | Cervix | CC | embryo implantation | 15/2311 | 53/18723 | 1.43e-03 | 1.12e-02 | 15 |
| GO:000218115 | Cervix | HSIL_HPV | cytoplasmic translation | 86/737 | 148/18723 | 3.97e-82 | 1.91e-78 | 86 |
| GO:000756512 | Cervix | HSIL_HPV | female pregnancy | 26/737 | 193/18723 | 4.32e-08 | 3.41e-06 | 26 |
| GO:004470611 | Cervix | HSIL_HPV | multi-multicellular organism process | 27/737 | 220/18723 | 1.69e-07 | 1.03e-05 | 27 |
| GO:000756612 | Cervix | HSIL_HPV | embryo implantation | 10/737 | 53/18723 | 3.53e-05 | 9.72e-04 | 10 |
| Page: 1 2 3 4 5 |
| Pathway ID | Tissue | Disease Stage | Description | Gene Ratio | Bg Ratio | pvalue | p.adjust | qvalue | Count |
| hsa0301018 | Breast | Precancer | Ribosome | 80/684 | 167/8465 | 7.33e-44 | 2.32e-41 | 1.77e-41 | 80 |
| hsa0517118 | Breast | Precancer | Coronavirus disease - COVID-19 | 81/684 | 232/8465 | 3.74e-32 | 2.36e-30 | 1.81e-30 | 81 |
| hsa0301019 | Breast | Precancer | Ribosome | 80/684 | 167/8465 | 7.33e-44 | 2.32e-41 | 1.77e-41 | 80 |
| hsa0517119 | Breast | Precancer | Coronavirus disease - COVID-19 | 81/684 | 232/8465 | 3.74e-32 | 2.36e-30 | 1.81e-30 | 81 |
| hsa0301024 | Breast | IDC | Ribosome | 83/867 | 167/8465 | 6.07e-39 | 9.87e-37 | 7.38e-37 | 83 |
| hsa0517124 | Breast | IDC | Coronavirus disease - COVID-19 | 86/867 | 232/8465 | 1.50e-28 | 9.72e-27 | 7.27e-27 | 86 |
| hsa0301034 | Breast | IDC | Ribosome | 83/867 | 167/8465 | 6.07e-39 | 9.87e-37 | 7.38e-37 | 83 |
| hsa0517134 | Breast | IDC | Coronavirus disease - COVID-19 | 86/867 | 232/8465 | 1.50e-28 | 9.72e-27 | 7.27e-27 | 86 |
| hsa0301044 | Breast | DCIS | Ribosome | 82/846 | 167/8465 | 8.69e-39 | 1.40e-36 | 1.03e-36 | 82 |
| hsa0517144 | Breast | DCIS | Coronavirus disease - COVID-19 | 86/846 | 232/8465 | 2.42e-29 | 1.56e-27 | 1.15e-27 | 86 |
| hsa0301054 | Breast | DCIS | Ribosome | 82/846 | 167/8465 | 8.69e-39 | 1.40e-36 | 1.03e-36 | 82 |
| hsa0517154 | Breast | DCIS | Coronavirus disease - COVID-19 | 86/846 | 232/8465 | 2.42e-29 | 1.56e-27 | 1.15e-27 | 86 |
| hsa0517120 | Cervix | CC | Coronavirus disease - COVID-19 | 111/1267 | 232/8465 | 1.82e-33 | 5.90e-31 | 3.49e-31 | 111 |
| hsa0301020 | Cervix | CC | Ribosome | 85/1267 | 167/8465 | 3.17e-28 | 5.14e-26 | 3.04e-26 | 85 |
| hsa05171110 | Cervix | CC | Coronavirus disease - COVID-19 | 111/1267 | 232/8465 | 1.82e-33 | 5.90e-31 | 3.49e-31 | 111 |
| hsa03010110 | Cervix | CC | Ribosome | 85/1267 | 167/8465 | 3.17e-28 | 5.14e-26 | 3.04e-26 | 85 |
| hsa0301025 | Cervix | HSIL_HPV | Ribosome | 80/459 | 167/8465 | 9.61e-58 | 2.82e-55 | 2.28e-55 | 80 |
| hsa0517125 | Cervix | HSIL_HPV | Coronavirus disease - COVID-19 | 91/459 | 232/8465 | 2.14e-56 | 3.13e-54 | 2.53e-54 | 91 |
| hsa0301035 | Cervix | HSIL_HPV | Ribosome | 80/459 | 167/8465 | 9.61e-58 | 2.82e-55 | 2.28e-55 | 80 |
| hsa0517135 | Cervix | HSIL_HPV | Coronavirus disease - COVID-19 | 91/459 | 232/8465 | 2.14e-56 | 3.13e-54 | 2.53e-54 | 91 |
| Page: 1 2 3 4 5 6 7 |
Top |
Cell-cell communication analysis |
| Identification of potential cell-cell interactions between two cell types and their ligand-receptor pairs for different disease states |
| Ligand | Receptor | LRpair | Pathway | Tissue | Disease Stage |
| Page: 1 |
Top |
Single-cell gene regulatory network inference analysis |
| Find out the significant the regulons (TFs) and the target genes of each regulon across cell types for different disease states |
| TF | Cell Type | Tissue | Disease Stage | Target Gene | RSS | Regulon Activity |
| ∗The dot plots of a searched regulon are shown for all cell subpopulations in each disease state of each tissue based on the regulon specific score inferred using pySCENIC and by calculating the average expression. |
| Page: 1 |
Top |
Somatic mutation of malignant transformation related genes |
| Annotation of somatic variants for genes involved in malignant transformation |
| Hugo Symbol | Variant Class | Variant Classification | dbSNP RS | HGVSc | HGVSp | HGVSp Short | SWISSPROT | BIOTYPE | SIFT | PolyPhen | Tumor Sample Barcode | Tissue | Histology | Sex | Age | Stage | Therapy Types | Drugs | Outcome |
| RPL29 | SNV | Missense_Mutation | rs764458055 | c.208N>A | p.Glu70Lys | p.E70K | P47914 | protein_coding | tolerated(0.08) | benign(0.01) | TCGA-A5-A0G2-01 | Endometrium | uterine corpus endometrioid carcinoma | Female | <65 | III/IV | Unknown | Unknown | SD |
| RPL29 | SNV | Missense_Mutation | rs375605221 | c.271C>T | p.Arg91Cys | p.R91C | P47914 | protein_coding | tolerated(0.47) | benign(0) | TCGA-AJ-A3BG-01 | Endometrium | uterine corpus endometrioid carcinoma | Female | >=65 | I/II | Chemotherapy | carboplatin | PD |
| RPL29 | SNV | Missense_Mutation | c.205N>A | p.Ala69Thr | p.A69T | P47914 | protein_coding | tolerated(0.07) | benign(0.062) | TCGA-AP-A059-01 | Endometrium | uterine corpus endometrioid carcinoma | Female | >=65 | I/II | Unknown | Unknown | SD | |
| RPL29 | SNV | Missense_Mutation | c.53G>A | p.Arg18Lys | p.R18K | P47914 | protein_coding | deleterious(0.04) | probably_damaging(0.944) | TCGA-B5-A0JY-01 | Endometrium | uterine corpus endometrioid carcinoma | Female | <65 | III/IV | Chemotherapy | doxorubicin | SD | |
| RPL29 | SNV | Missense_Mutation | novel | c.382N>G | p.Lys128Glu | p.K128E | P47914 | protein_coding | tolerated(0.15) | benign(0) | TCGA-EO-A22X-01 | Endometrium | uterine corpus endometrioid carcinoma | Female | <65 | III/IV | Unspecific | Carboplatin | Complete Response |
| RPL29 | SNV | Missense_Mutation | novel | c.165N>T | p.Lys55Asn | p.K55N | P47914 | protein_coding | deleterious(0.01) | probably_damaging(0.981) | TCGA-EO-A3B0-01 | Endometrium | uterine corpus endometrioid carcinoma | Female | <65 | III/IV | Unknown | Unknown | SD |
| RPL29 | SNV | Missense_Mutation | novel | c.139N>G | p.Lys47Glu | p.K47E | P47914 | protein_coding | deleterious(0.04) | benign(0.221) | TCGA-UB-A7MB-01 | Liver | liver hepatocellular carcinoma | Male | <65 | I/II | Targeted Molecular therapy | sorafenib | PD |
| RPL29 | SNV | Missense_Mutation | novel | c.130N>T | p.Arg44Cys | p.R44C | P47914 | protein_coding | tolerated(0.27) | benign(0) | TCGA-XK-AAIW-01 | Prostate | prostate adenocarcinoma | Male | >=65 | 9 | Unknown | Unknown | PD |
| RPL29 | SNV | Missense_Mutation | rs772176036 | c.320G>A | p.Arg107His | p.R107H | P47914 | protein_coding | tolerated(0.41) | benign(0) | TCGA-F1-A448-01 | Stomach | stomach adenocarcinoma | Male | >=65 | III/IV | Chemotherapy | capecitabine | CR |
| Page: 1 |
Top |
Related drugs of malignant transformation related genes |
| Identification of chemicals and drugs interact with genes involved in malignant transfromation |
| (DGIdb 4.0) |
| Entrez ID | Symbol | Category | Interaction Types | Drug Claim Name | Drug Name | PMIDs |
| Page: 1 |

Copyright 2023-Present -The University of Texas Health Science Center at Houston |