| Entrez ID | Symbol | Replicates | Species | Organ | Tissue | Adj P-value | Log2FC | Malignancy |
| 6141 | RPL18 | Dong_P1 | Human | Prostate | Tumor | 9.50e-05 | 5.85e-02 | 0.035 |
| 6141 | RPL18 | Dong_P3 | Human | Prostate | Tumor | 2.64e-02 | 7.11e-02 | 0.0278 |
| 6141 | RPL18 | Dong_P5 | Human | Prostate | Tumor | 8.31e-44 | 1.81e-01 | 0.053 |
| 6141 | RPL18 | Dong_P6 | Human | Prostate | Tumor | 2.17e-26 | 2.14e-01 | 0.0371 |
| 6141 | RPL18 | P7 | Human | Prostate | Tumor | 3.52e-45 | 2.24e+00 | -0.1025 |
| 6141 | RPL18 | P9 | Human | Prostate | Tumor | 1.71e-07 | 7.43e-01 | -0.0285 |
| 6141 | RPL18 | P10 | Human | Prostate | Tumor | 1.09e-16 | 1.70e+00 | -0.0902 |
| 6141 | RPL18 | GSM5353217_PA_PB1A_Pool_2_S107_L004 | Human | Prostate | Tumor | 1.23e-03 | -4.67e-01 | 0.156 |
| 6141 | RPL18 | GSM5353218_PA_PB1B_Pool_1_2_S74_L003 | Human | Prostate | Tumor | 1.82e-05 | -3.36e-01 | 0.1479 |
| 6141 | RPL18 | GSM5353220_PA_PB1B_Pool_3_S51_L002 | Human | Prostate | Tumor | 8.59e-04 | -3.45e-01 | 0.1531 |
| 6141 | RPL18 | GSM5353221_PA_PB2A_Pool_1_3_S25_L001 | Human | Prostate | Tumor | 9.94e-11 | -1.94e-01 | 0.1633 |
| 6141 | RPL18 | GSM5353222_PA_PB2B_Pool_1_3_S52_L002 | Human | Prostate | Tumor | 5.07e-13 | -3.05e-01 | 0.1608 |
| 6141 | RPL18 | GSM5353223_PA_PB2B_Pool_2_S26_L001 | Human | Prostate | Tumor | 4.09e-05 | -2.17e-01 | 0.1604 |
| 6141 | RPL18 | GSM5353224_PA_PR5186_Pool_1_2_3_S27_L001 | Human | Prostate | Tumor | 1.22e-07 | -1.64e-01 | 0.1621 |
| 6141 | RPL18 | GSM5353225_PA_PR5196-1_Pool_1_2_3_S53_L002 | Human | Prostate | Tumor | 2.33e-07 | -2.58e-01 | 0.1619 |
| 6141 | RPL18 | GSM5353227_PA_PR5199-193K_Pool_1_2_3_S55_L002 | Human | Prostate | Tumor | 3.02e-17 | -3.80e-01 | 0.1602 |
| 6141 | RPL18 | GSM5353228_PA_PR5199-640K_Pool_1_3_S108_L004 | Human | Prostate | Tumor | 1.11e-05 | -6.60e-01 | 0.1537 |
| 6141 | RPL18 | GSM5353232_PA_PR5249_T1_S3_L001 | Human | Prostate | Tumor | 5.13e-07 | -6.07e-01 | 0.1439 |
| 6141 | RPL18 | GSM5353236_PA_PR5251_T1_S7_L001 | Human | Prostate | Tumor | 3.92e-02 | -2.48e-01 | 0.1608 |
| 6141 | RPL18 | GSM5353243_PA_PR5261_T1_S23_L002 | Human | Prostate | Tumor | 1.31e-13 | -3.49e-01 | 0.1545 |
| Tissue | Expression Dynamics | Abbreviation |
| Breast |  | IDC: Invasive ductal carcinoma |
| DCIS: Ductal carcinoma in situ |
| Precancer(BRCA1-mut): Precancerous lesion from BRCA1 mutation carriers |
| Cervix | 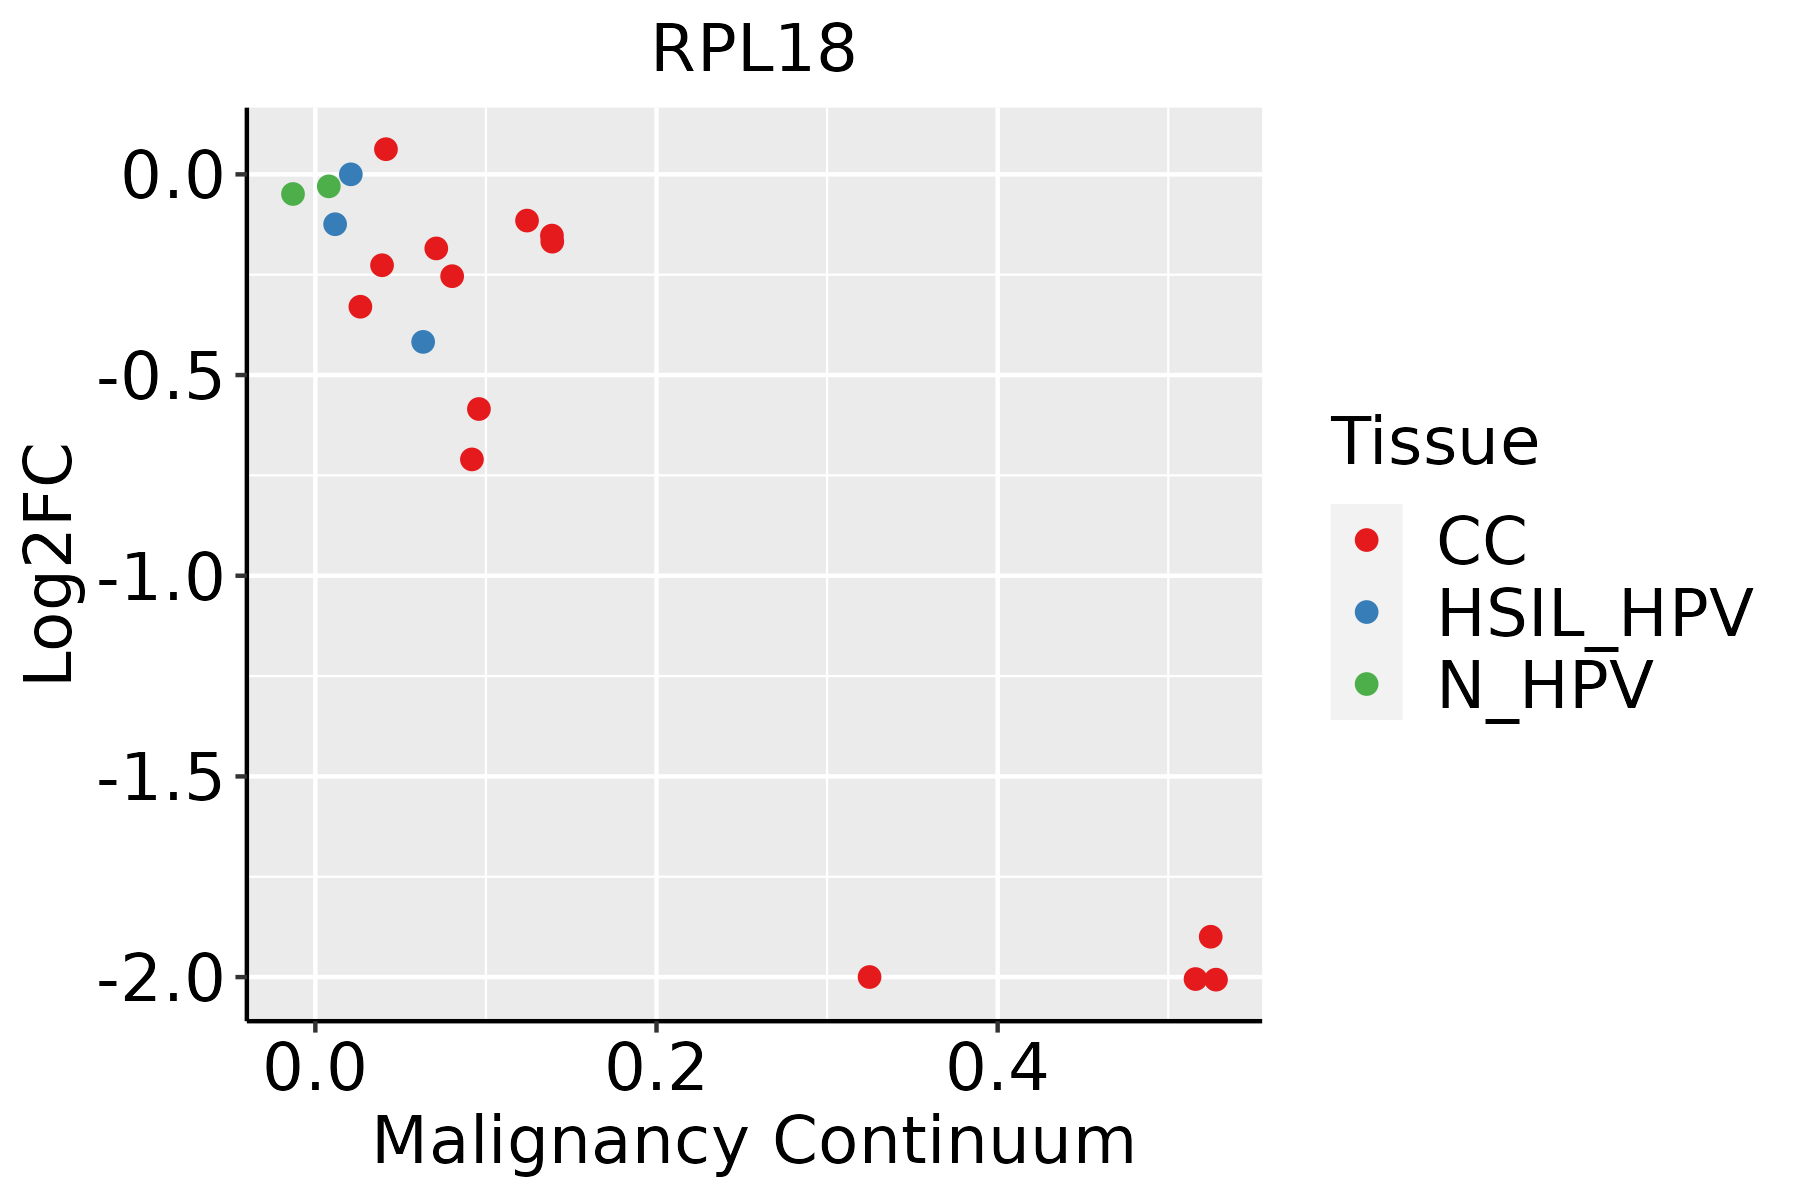 | CC: Cervix cancer |
| HSIL_HPV: HPV-infected high-grade squamous intraepithelial lesions |
| N_HPV: HPV-infected normal cervix |
| Colorectum (GSE201348) |  | FAP: Familial adenomatous polyposis |
| CRC: Colorectal cancer |
| Colorectum (HTA11) |  | AD: Adenomas |
| SER: Sessile serrated lesions |
| MSI-H: Microsatellite-high colorectal cancer |
| MSS: Microsatellite stable colorectal cancer |
| Endometrium | 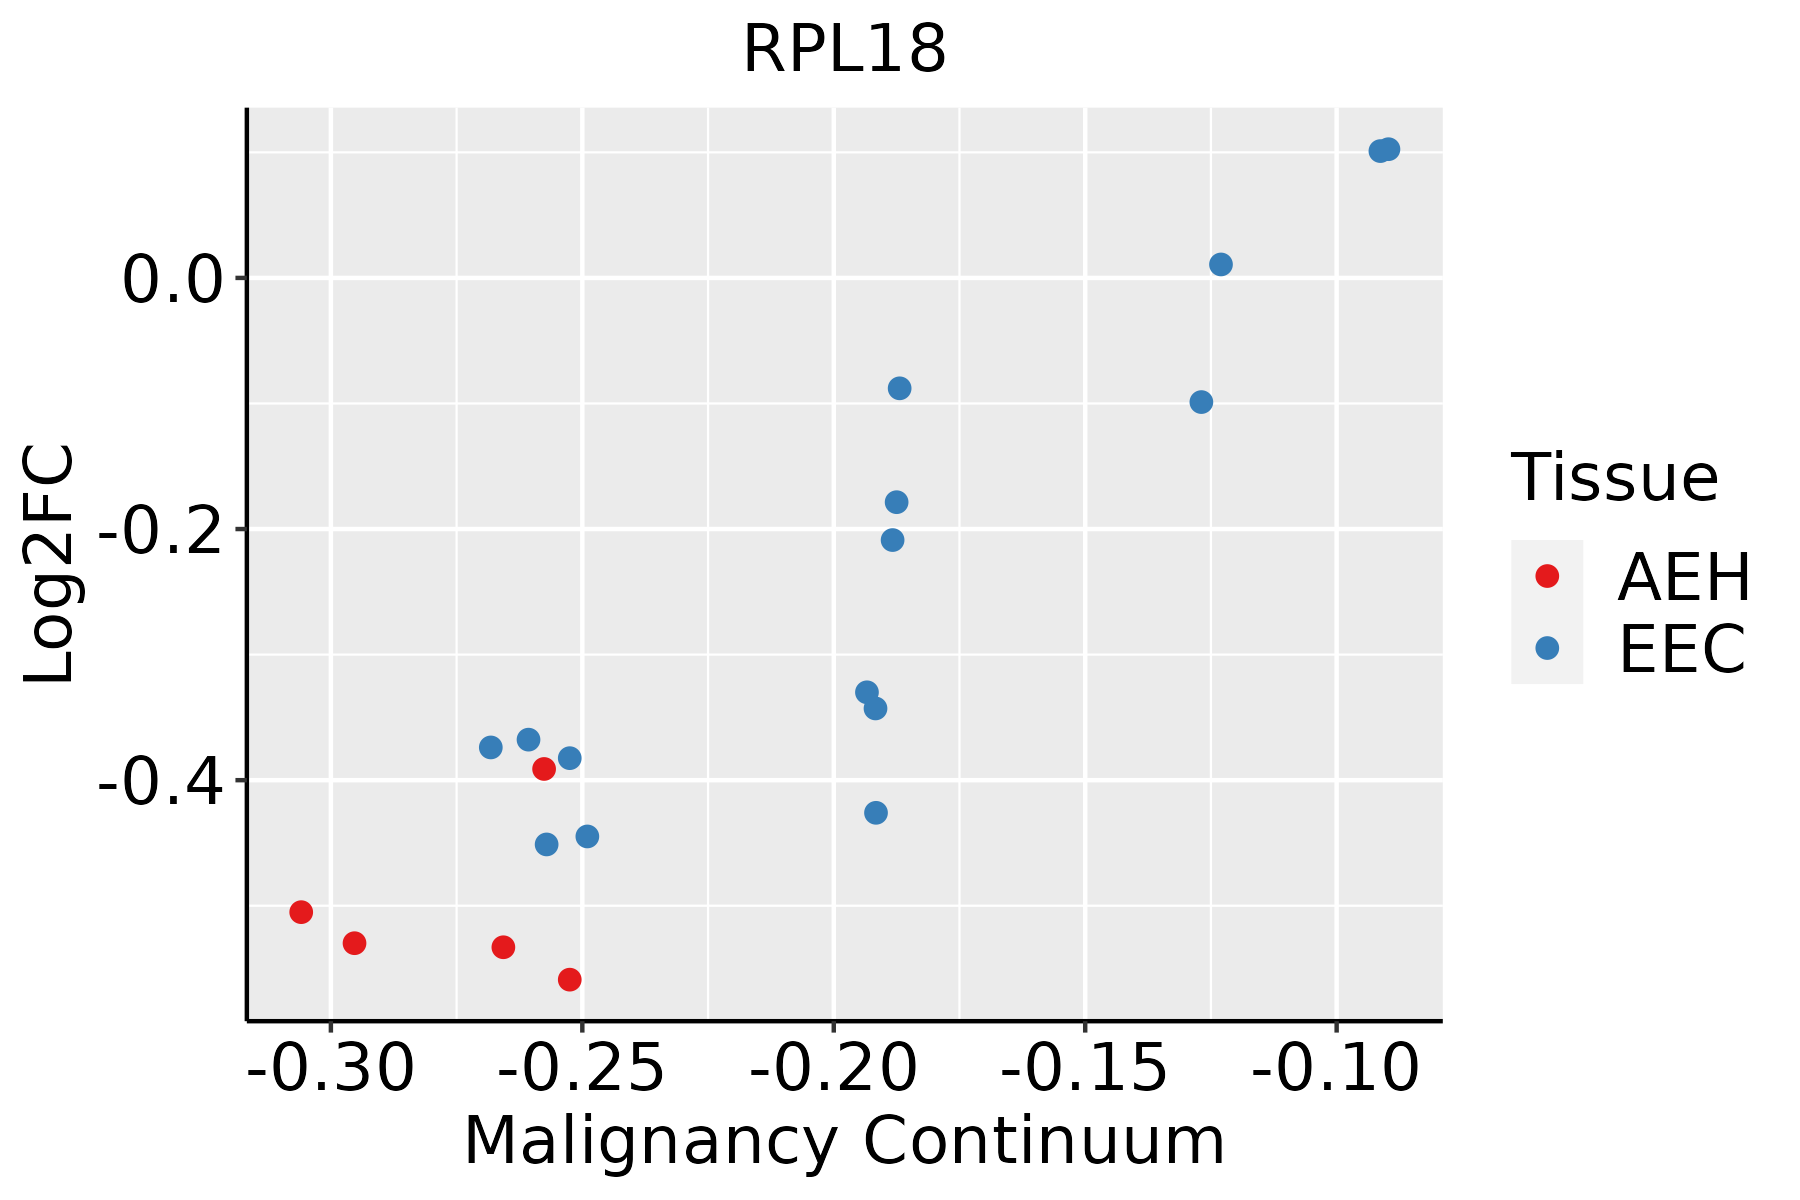 | AEH: Atypical endometrial hyperplasia |
| EEC: Endometrioid Cancer |
| Esophagus | 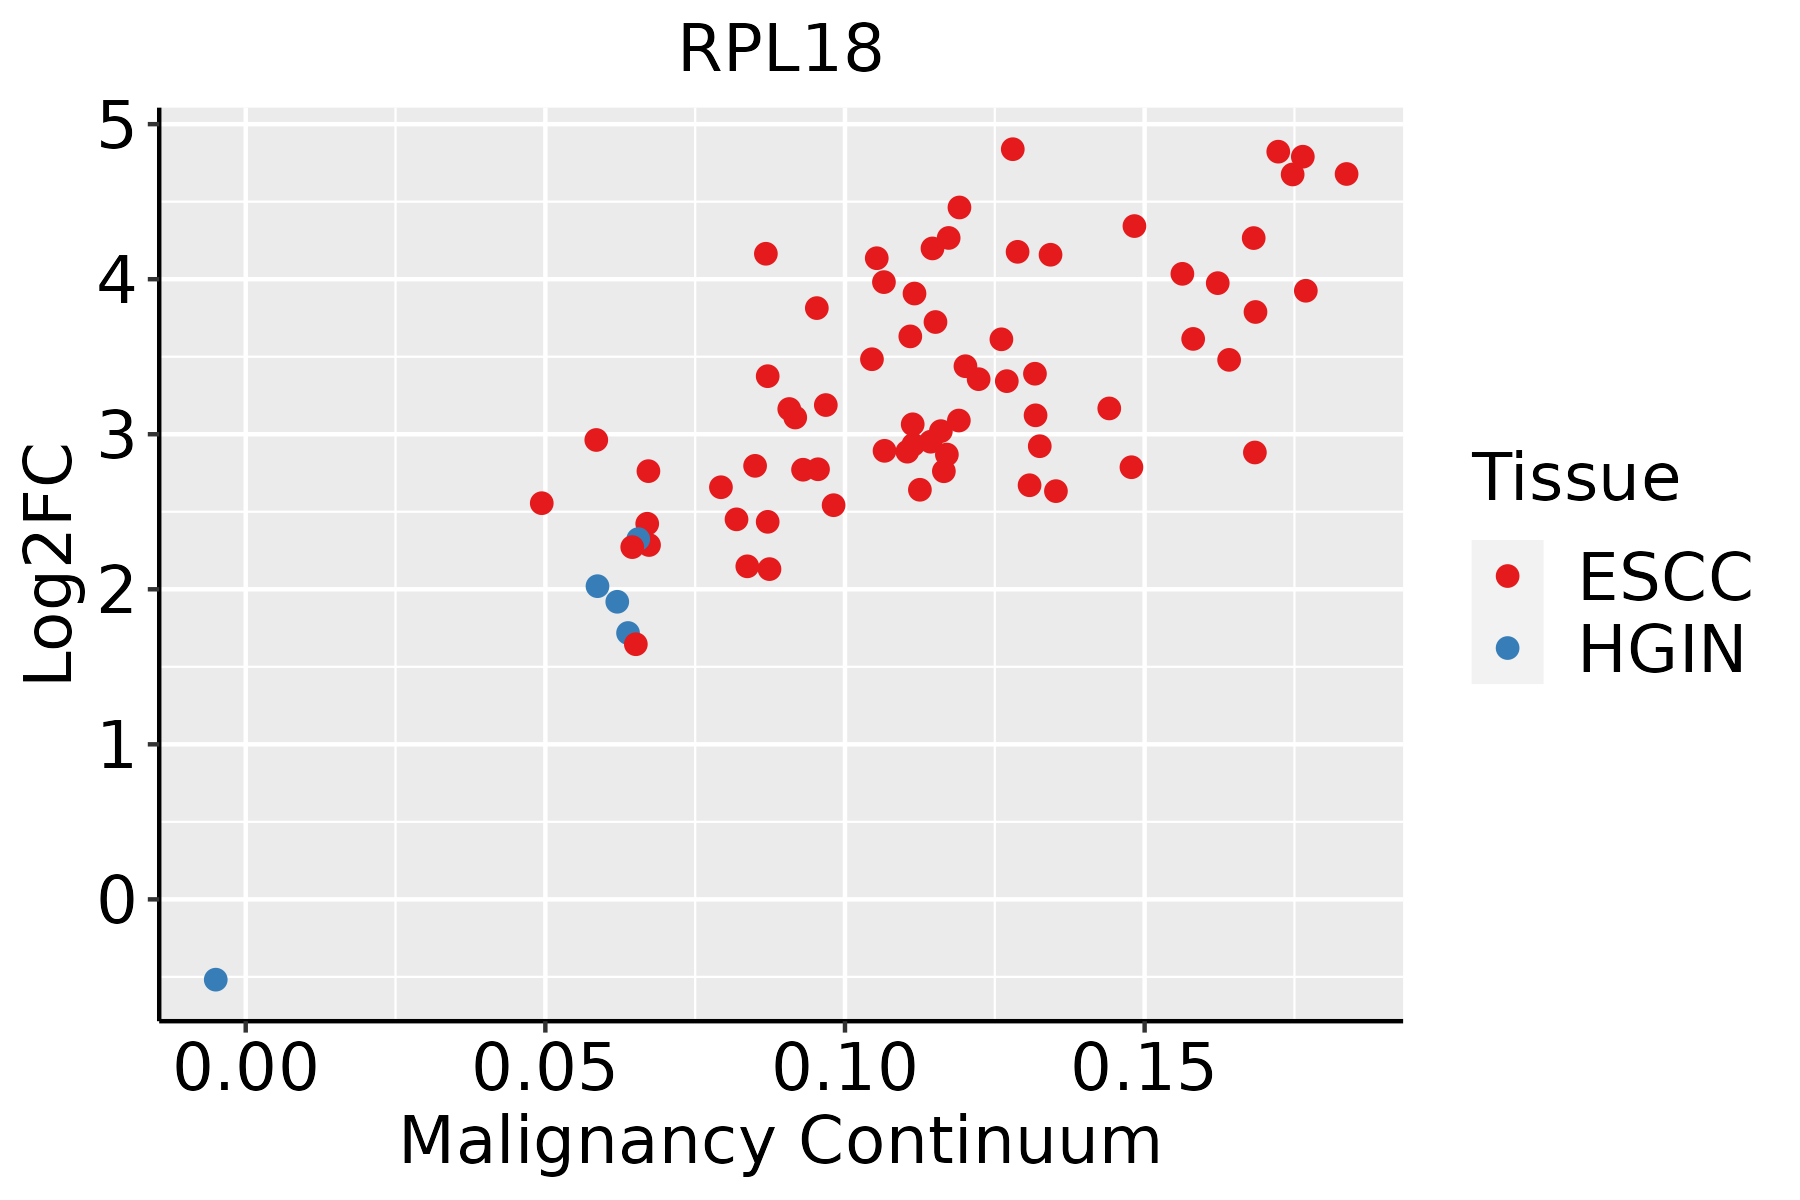 | ESCC: Esophageal squamous cell carcinoma |
| HGIN: High-grade intraepithelial neoplasias |
| LGIN: Low-grade intraepithelial neoplasias |
| GC | 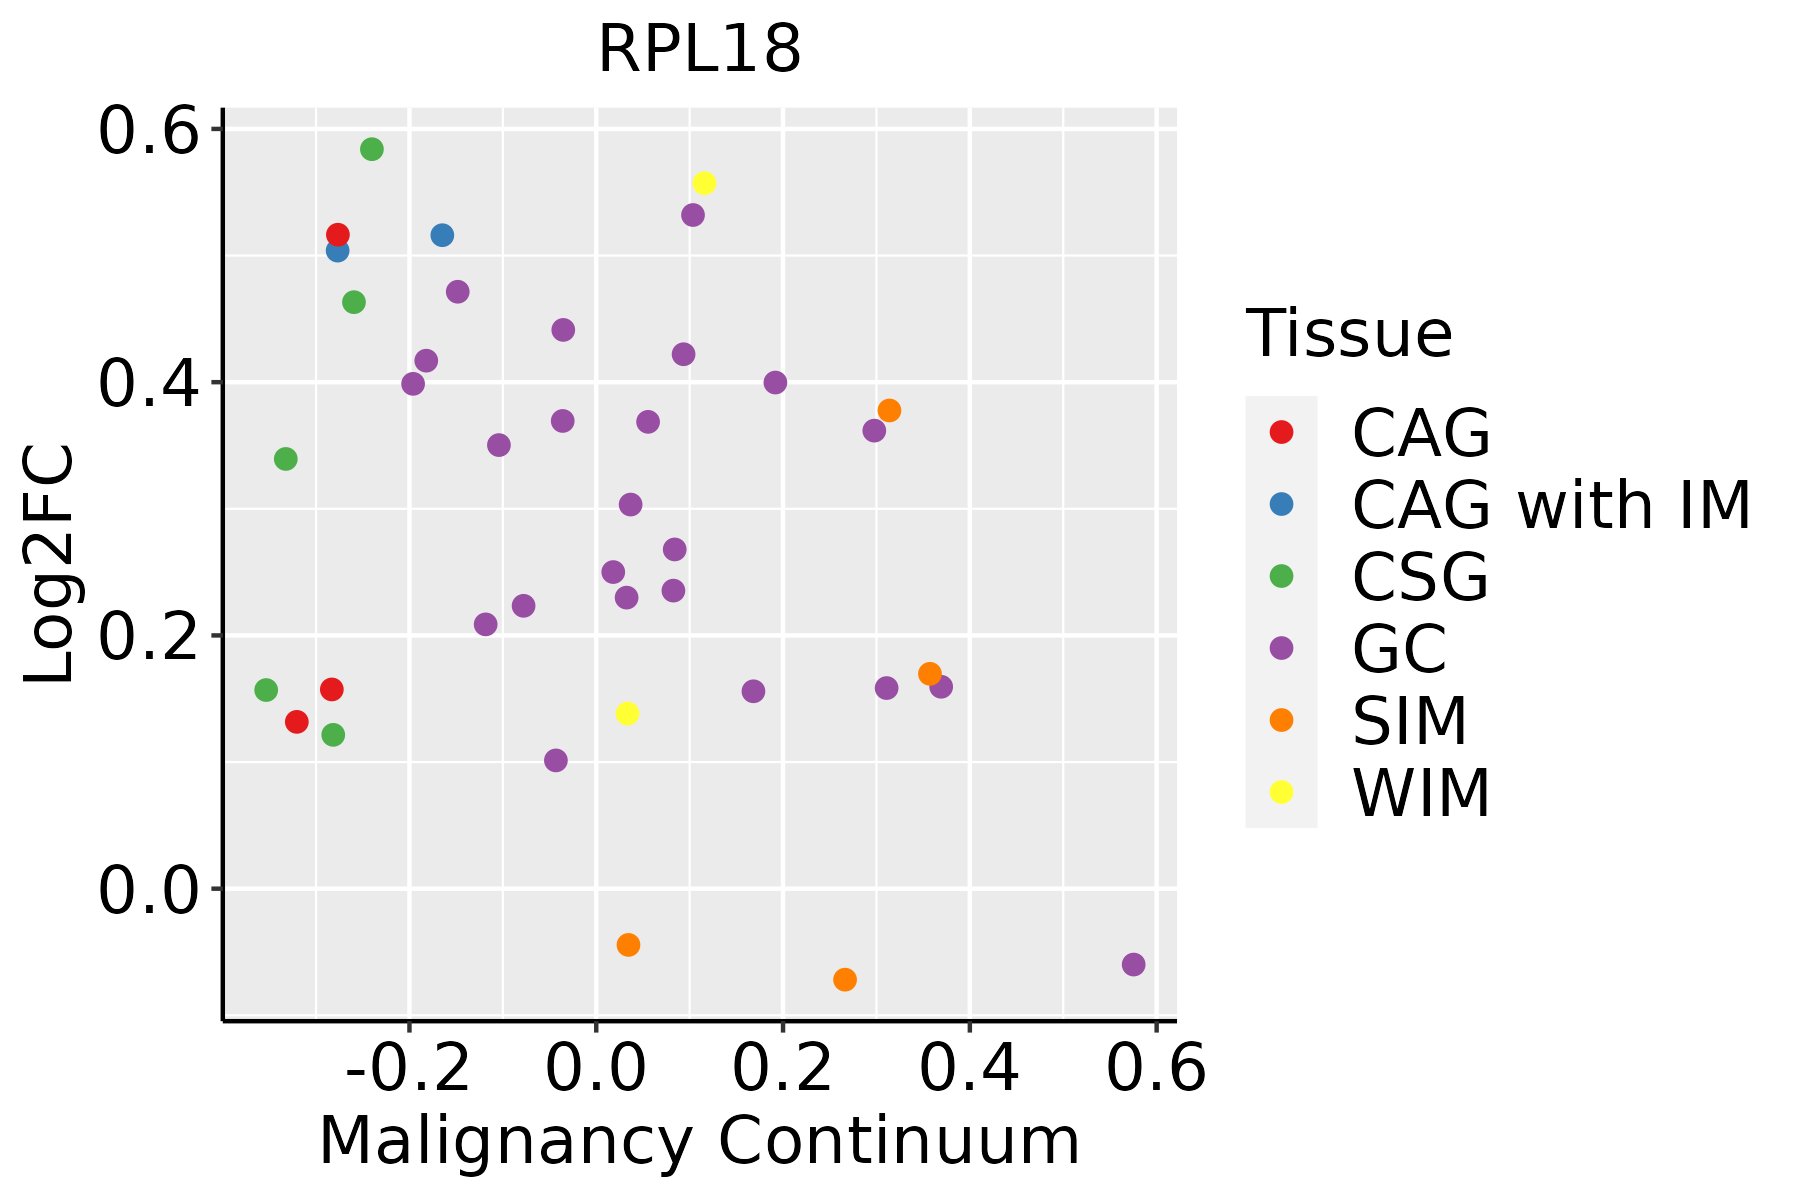 | CAG: Chronic atrophic gastritis |
| CAG with IM: Chronic atrophic gastritis with intestinal metaplasia |
| CSG: Chronic superficial gastritis |
| GC: Gastric cancer |
| SIM: Severe intestinal metaplasia |
| WIM: Wild intestinal metaplasia |
| Liver |  | HCC: Hepatocellular carcinoma |
| NAFLD: Non-alcoholic fatty liver disease |
| Lung | 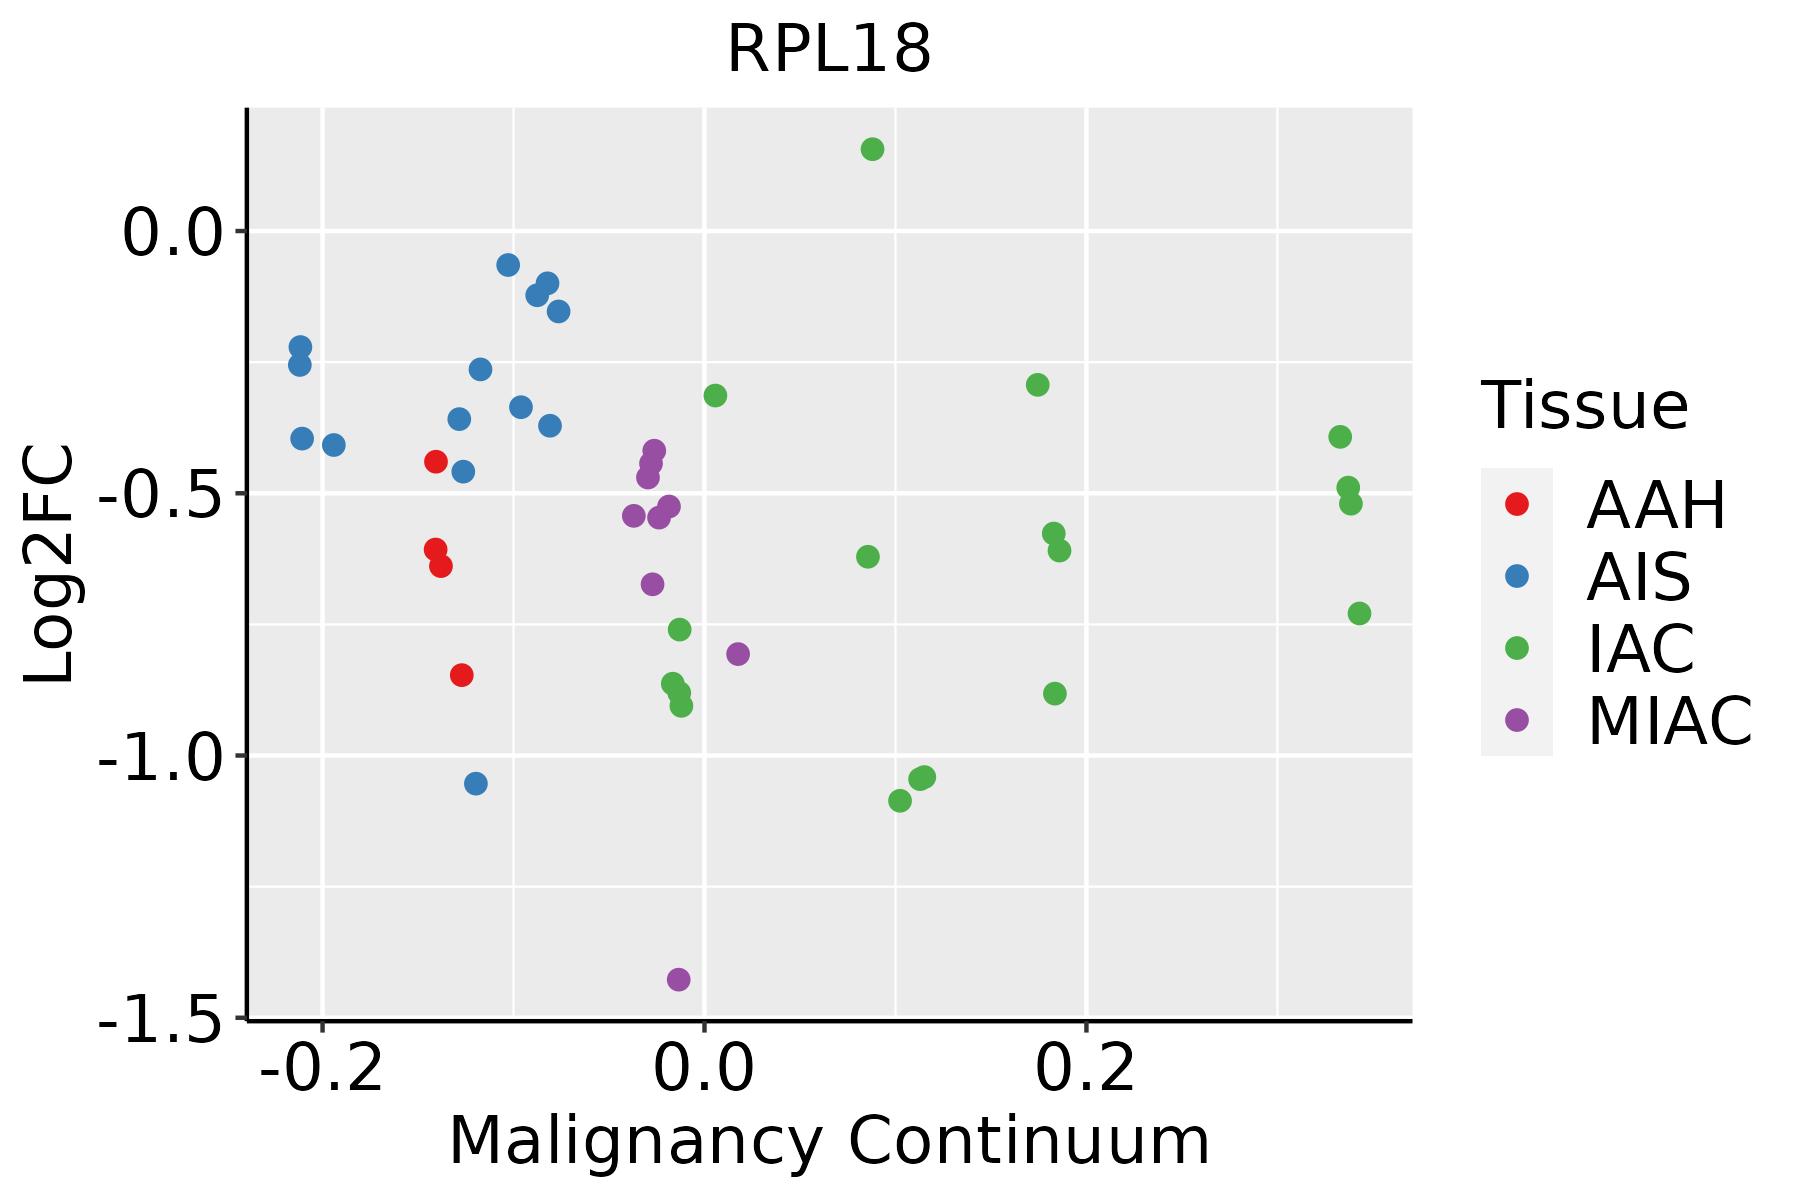 | AAH: Atypical adenomatous hyperplasia |
| AIS: Adenocarcinoma in situ |
| IAC: Invasive lung adenocarcinoma |
| MIA: Minimally invasive adenocarcinoma |
| Oral Cavity | 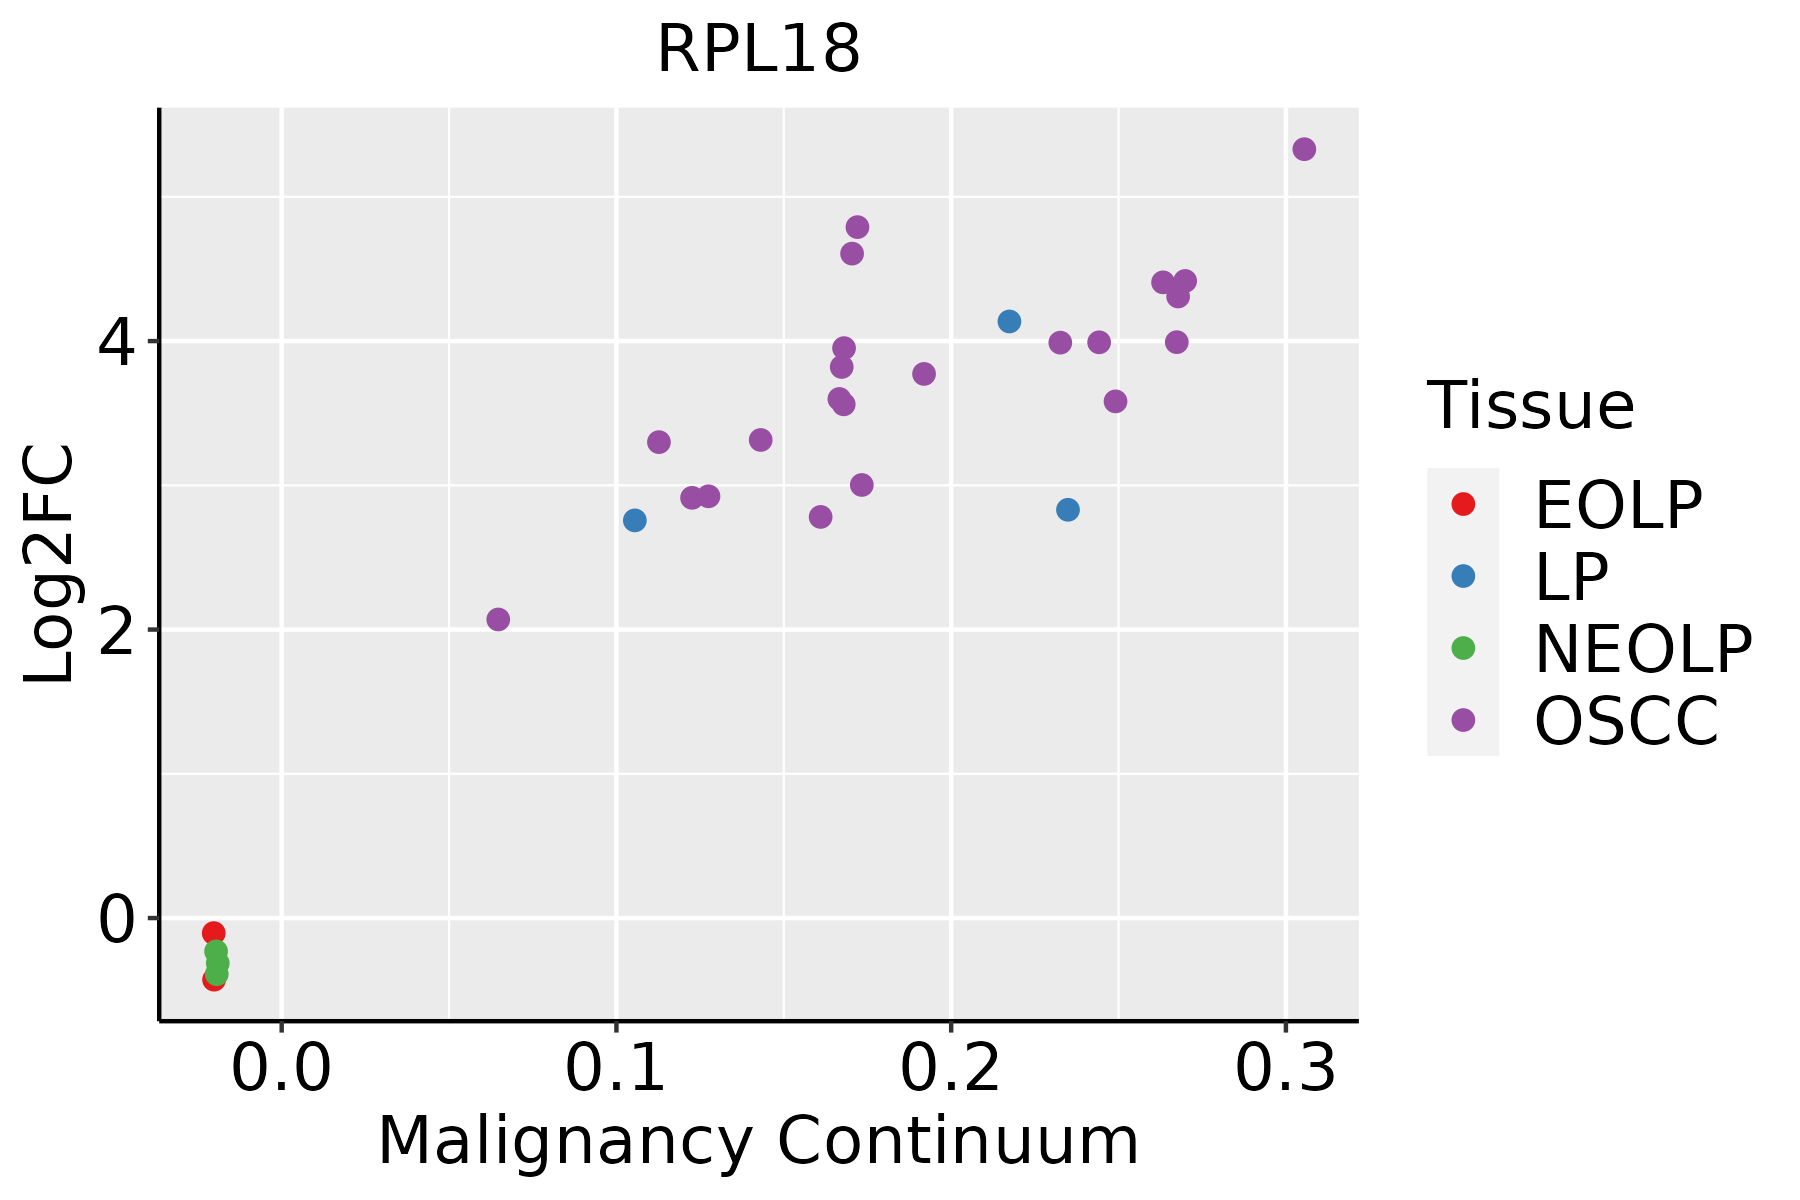 | EOLP: Erosive Oral lichen planus |
| LP: leukoplakia |
| NEOLP: Non-erosive oral lichen planus |
| OSCC: Oral squamous cell carcinoma |
| Prostate | 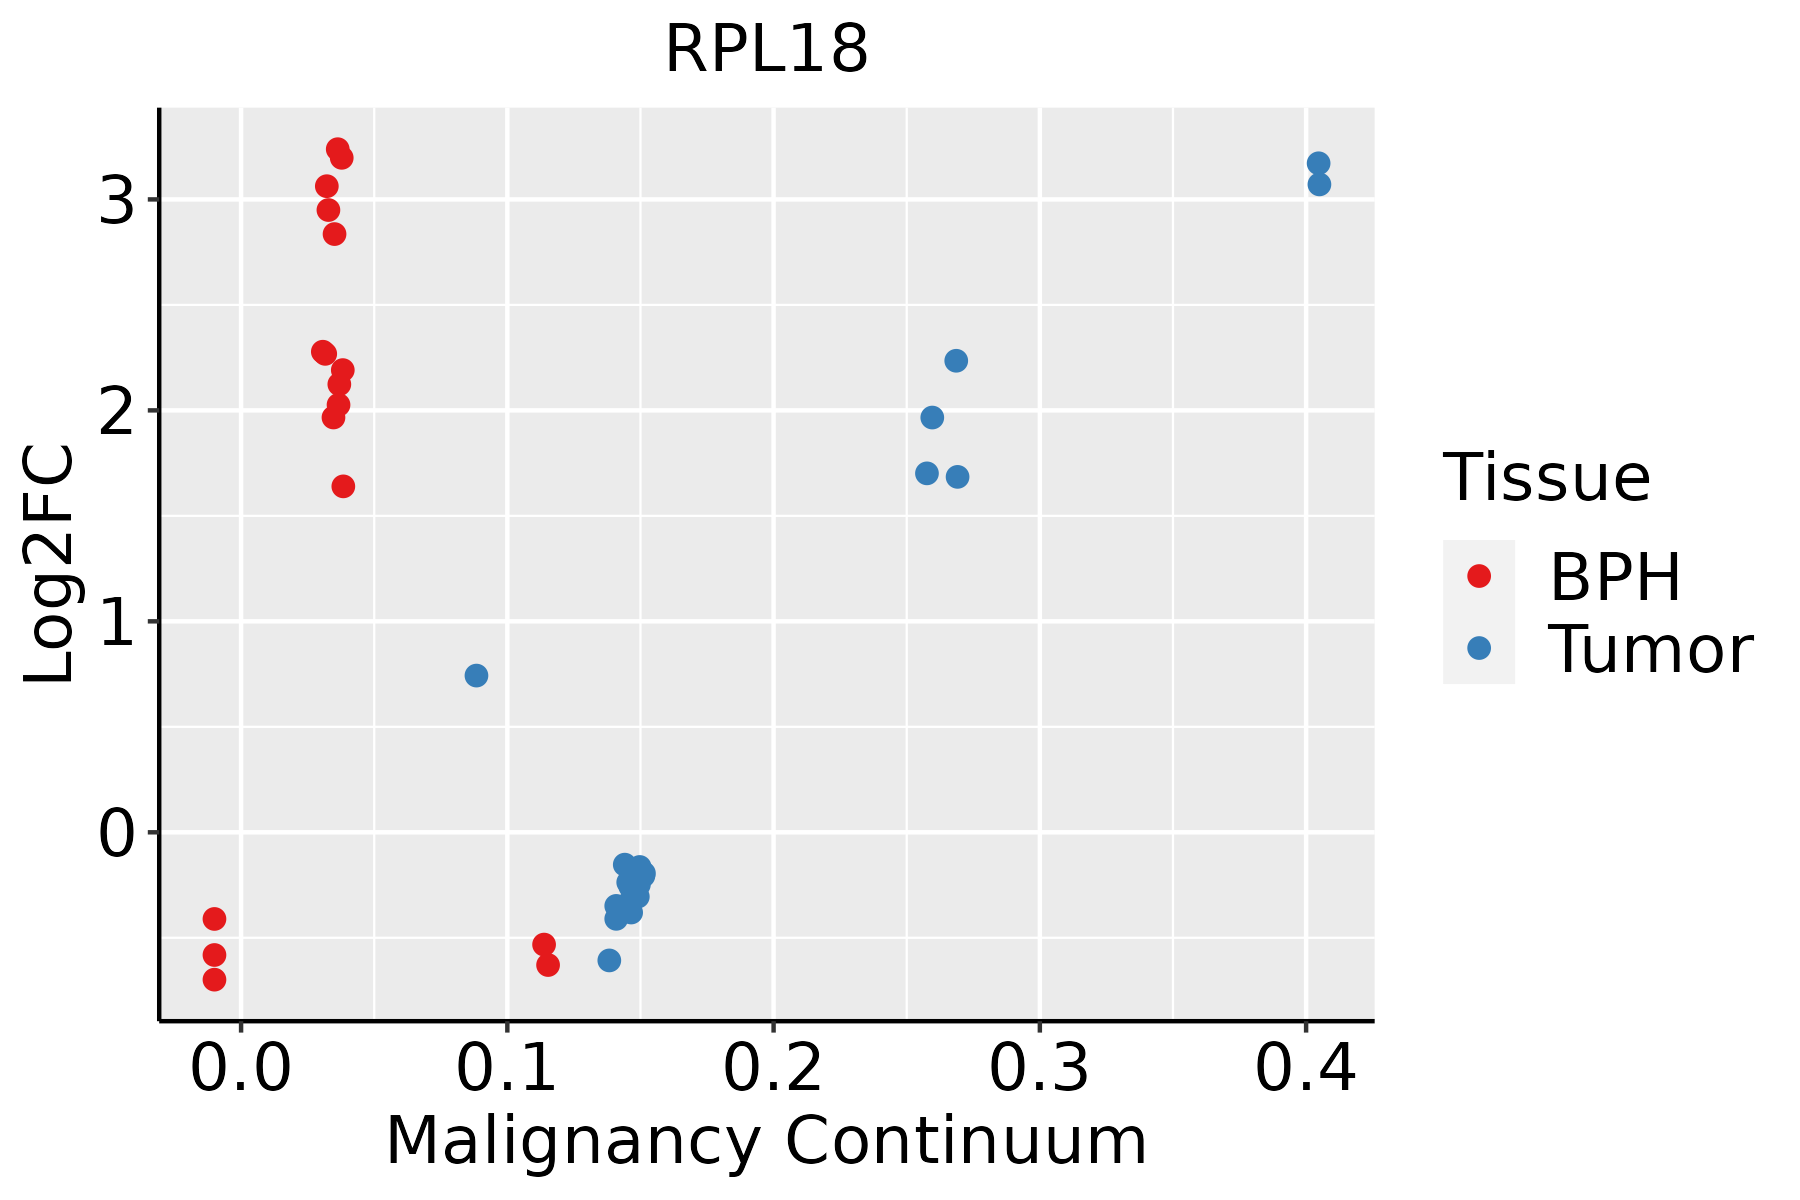 | BPH: Benign Prostatic Hyperplasia |
| Skin | 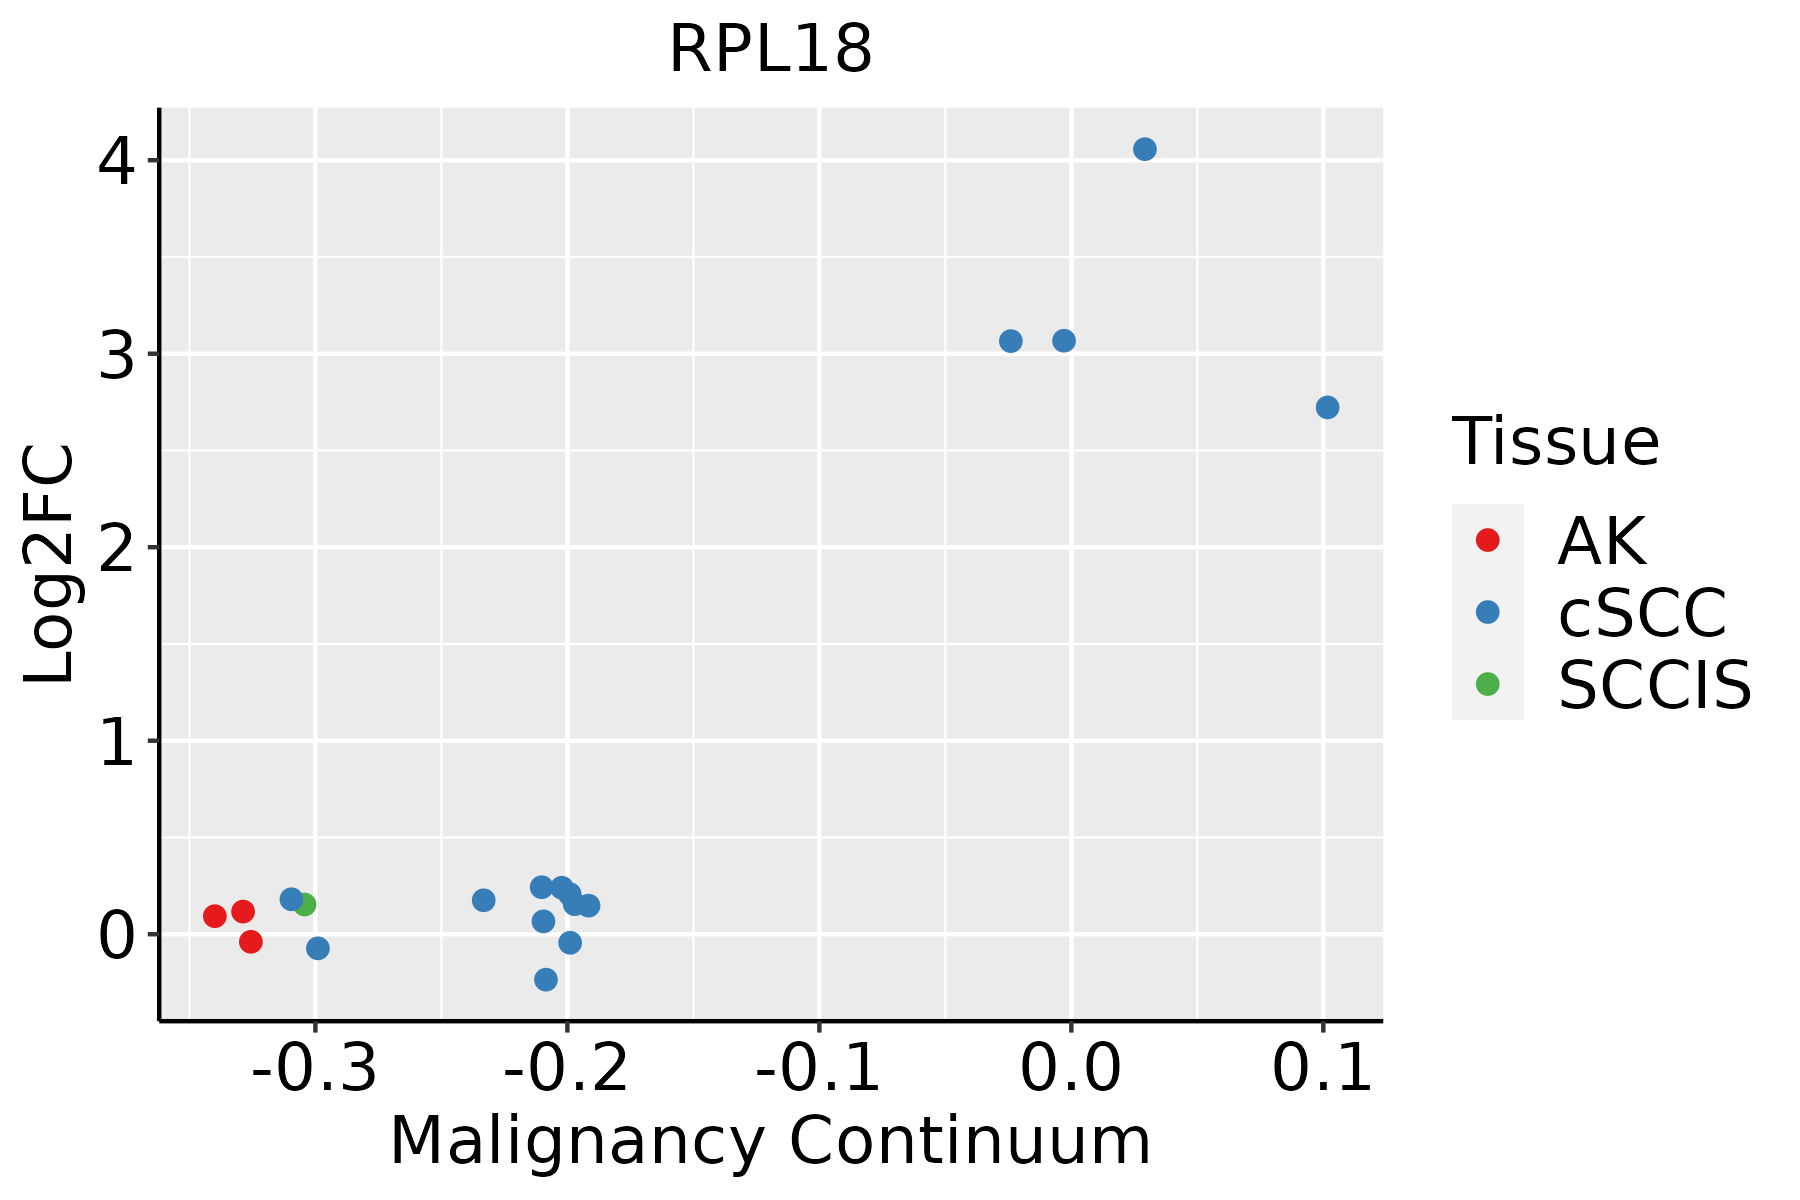 | AK: Actinic keratosis |
| cSCC: Cutaneous squamous cell carcinoma |
| SCCIS:squamous cell carcinoma in situ |
| Thyroid |  | ATC: Anaplastic thyroid cancer |
| HT: Hashimoto's thyroiditis |
| PTC: Papillary thyroid cancer |
| Pathway ID | Tissue | Disease Stage | Description | Gene Ratio | Bg Ratio | pvalue | p.adjust | qvalue | Count |
| hsa0301018 | Breast | Precancer | Ribosome | 80/684 | 167/8465 | 7.33e-44 | 2.32e-41 | 1.77e-41 | 80 |
| hsa0517118 | Breast | Precancer | Coronavirus disease - COVID-19 | 81/684 | 232/8465 | 3.74e-32 | 2.36e-30 | 1.81e-30 | 81 |
| hsa0301019 | Breast | Precancer | Ribosome | 80/684 | 167/8465 | 7.33e-44 | 2.32e-41 | 1.77e-41 | 80 |
| hsa0517119 | Breast | Precancer | Coronavirus disease - COVID-19 | 81/684 | 232/8465 | 3.74e-32 | 2.36e-30 | 1.81e-30 | 81 |
| hsa0301024 | Breast | IDC | Ribosome | 83/867 | 167/8465 | 6.07e-39 | 9.87e-37 | 7.38e-37 | 83 |
| hsa0517124 | Breast | IDC | Coronavirus disease - COVID-19 | 86/867 | 232/8465 | 1.50e-28 | 9.72e-27 | 7.27e-27 | 86 |
| hsa0301034 | Breast | IDC | Ribosome | 83/867 | 167/8465 | 6.07e-39 | 9.87e-37 | 7.38e-37 | 83 |
| hsa0517134 | Breast | IDC | Coronavirus disease - COVID-19 | 86/867 | 232/8465 | 1.50e-28 | 9.72e-27 | 7.27e-27 | 86 |
| hsa0301044 | Breast | DCIS | Ribosome | 82/846 | 167/8465 | 8.69e-39 | 1.40e-36 | 1.03e-36 | 82 |
| hsa0517144 | Breast | DCIS | Coronavirus disease - COVID-19 | 86/846 | 232/8465 | 2.42e-29 | 1.56e-27 | 1.15e-27 | 86 |
| hsa0301054 | Breast | DCIS | Ribosome | 82/846 | 167/8465 | 8.69e-39 | 1.40e-36 | 1.03e-36 | 82 |
| hsa0517154 | Breast | DCIS | Coronavirus disease - COVID-19 | 86/846 | 232/8465 | 2.42e-29 | 1.56e-27 | 1.15e-27 | 86 |
| hsa0517120 | Cervix | CC | Coronavirus disease - COVID-19 | 111/1267 | 232/8465 | 1.82e-33 | 5.90e-31 | 3.49e-31 | 111 |
| hsa0301020 | Cervix | CC | Ribosome | 85/1267 | 167/8465 | 3.17e-28 | 5.14e-26 | 3.04e-26 | 85 |
| hsa05171110 | Cervix | CC | Coronavirus disease - COVID-19 | 111/1267 | 232/8465 | 1.82e-33 | 5.90e-31 | 3.49e-31 | 111 |
| hsa03010110 | Cervix | CC | Ribosome | 85/1267 | 167/8465 | 3.17e-28 | 5.14e-26 | 3.04e-26 | 85 |
| hsa0301025 | Cervix | HSIL_HPV | Ribosome | 80/459 | 167/8465 | 9.61e-58 | 2.82e-55 | 2.28e-55 | 80 |
| hsa0517125 | Cervix | HSIL_HPV | Coronavirus disease - COVID-19 | 91/459 | 232/8465 | 2.14e-56 | 3.13e-54 | 2.53e-54 | 91 |
| hsa0301035 | Cervix | HSIL_HPV | Ribosome | 80/459 | 167/8465 | 9.61e-58 | 2.82e-55 | 2.28e-55 | 80 |
| hsa0517135 | Cervix | HSIL_HPV | Coronavirus disease - COVID-19 | 91/459 | 232/8465 | 2.14e-56 | 3.13e-54 | 2.53e-54 | 91 |
| Hugo Symbol | Variant Class | Variant Classification | dbSNP RS | HGVSc | HGVSp | HGVSp Short | SWISSPROT | BIOTYPE | SIFT | PolyPhen | Tumor Sample Barcode | Tissue | Histology | Sex | Age | Stage | Therapy Types | Drugs | Outcome |
| RPL18 | SNV | Missense_Mutation | novel | c.116N>A | p.Thr39Asn | p.T39N | Q07020 | protein_coding | deleterious(0.02) | probably_damaging(0.929) | TCGA-3C-AAAU-01 | Breast | breast invasive carcinoma | Female | <65 | I/II | Chemotherapy | zoladex | SD |
| RPL18 | SNV | Missense_Mutation | rs368131281 | c.437N>A | p.Arg146Gln | p.R146Q | Q07020 | protein_coding | tolerated(0.05) | benign(0.377) | TCGA-DR-A0ZM-01 | Cervix | cervical & endocervical cancer | Female | <65 | III/IV | Unspecific | Cisplatin | SD |
| RPL18 | SNV | Missense_Mutation | novel | c.473C>T | p.Thr158Ile | p.T158I | Q07020 | protein_coding | tolerated(0.11) | benign(0.017) | TCGA-A5-A0G2-01 | Endometrium | uterine corpus endometrioid carcinoma | Female | <65 | III/IV | Unknown | Unknown | SD |
| RPL18 | SNV | Missense_Mutation | novel | c.499G>T | p.Val167Phe | p.V167F | Q07020 | protein_coding | deleterious(0.01) | benign(0.25) | TCGA-AX-A2H7-01 | Endometrium | uterine corpus endometrioid carcinoma | Female | >=65 | I/II | Unknown | Unknown | PD |
| RPL18 | SNV | Missense_Mutation | | c.264N>A | p.Asp88Glu | p.D88E | Q07020 | protein_coding | deleterious(0) | probably_damaging(0.933) | TCGA-B5-A11H-01 | Endometrium | uterine corpus endometrioid carcinoma | Female | >=65 | III/IV | Hormone Therapy | megace | SD |
| RPL18 | SNV | Missense_Mutation | novel | c.383N>C | p.Leu128Pro | p.L128P | Q07020 | protein_coding | deleterious(0.01) | possibly_damaging(0.841) | TCGA-FI-A2D0-01 | Endometrium | uterine corpus endometrioid carcinoma | Female | <65 | I/II | Unknown | Unknown | SD |
| RPL18 | SNV | Missense_Mutation | novel | c.503N>A | p.Arg168His | p.R168H | Q07020 | protein_coding | tolerated(0.1) | benign(0.097) | TCGA-FI-A2D5-01 | Endometrium | uterine corpus endometrioid carcinoma | Female | <65 | III/IV | Chemotherapy | carboplatinum | PD |
| RPL18 | SNV | Missense_Mutation | | c.79N>A | p.Leu27Met | p.L27M | Q07020 | protein_coding | deleterious(0.02) | probably_damaging(0.955) | TCGA-G3-A7M9-01 | Liver | liver hepatocellular carcinoma | Male | >=65 | III/IV | Unknown | Unknown | SD |
| RPL18 | insertion | In_Frame_Ins | novel | c.25_26insGGAGGTGGAGCTTGC | p.Lys9delinsArgArgTrpSerLeuGln | p.K9delinsRRWSLQ | Q07020 | protein_coding | | | TCGA-ZS-A9CG-01 | Liver | liver hepatocellular carcinoma | Male | <65 | I/II | Unknown | Unknown | SD |
| RPL18 | SNV | Missense_Mutation | | c.263N>G | p.Asp88Gly | p.D88G | Q07020 | protein_coding | deleterious(0) | probably_damaging(0.933) | TCGA-BR-8591-01 | Stomach | stomach adenocarcinoma | Male | >=65 | III/IV | Unknown | Unknown | SD |


