| Entrez ID | Symbol | Replicates | Species | Organ | Tissue | Adj P-value | Log2FC | Malignancy |
| 6231 | RPS26 | HTA12-29-1 | Human | Pancreas | PDAC | 4.02e-23 | -9.40e-01 | 0.3722 |
| 6231 | RPS26 | 3829-EC | Human | Pancreas | PanIN | 1.04e-14 | 3.75e-01 | 0.009 |
| 6231 | RPS26 | 4347-EC | Human | Pancreas | PanIN | 1.13e-07 | -1.32e-02 | 0.0572 |
| 6231 | RPS26 | DS20191261Tumor | Human | Pancreas | PDAC | 5.44e-14 | -9.30e-01 | 0.1367 |
| 6231 | RPS26 | GSM5252126_BPH283PrGF_Via | Human | Prostate | BPH | 1.80e-37 | 1.47e+00 | -0.1771 |
| 6231 | RPS26 | GSM5252127_BPH283PrSF_Via | Human | Prostate | BPH | 1.63e-22 | 1.04e+00 | -0.1453 |
| 6231 | RPS26 | GSM5252128_BPH327PrGF_Via | Human | Prostate | BPH | 2.80e-63 | 1.81e+00 | -0.1688 |
| 6231 | RPS26 | GSM5252129_BPH327PrSF_Via | Human | Prostate | BPH | 4.15e-60 | 1.69e+00 | -0.1697 |
| 6231 | RPS26 | GSM5252130_BPH340PrGF_Via | Human | Prostate | BPH | 2.63e-34 | 9.90e-01 | -0.1972 |
| 6231 | RPS26 | GSM5252131_BPH340PrSF_Via | Human | Prostate | BPH | 5.25e-16 | 5.22e-01 | -0.2126 |
| 6231 | RPS26 | GSM5252132_BPH389PrGF | Human | Prostate | BPH | 2.14e-14 | 1.93e+00 | -0.2247 |
| 6231 | RPS26 | GSM5252133_BPH389PrSF | Human | Prostate | BPH | 4.32e-12 | 2.02e+00 | -0.2027 |
| 6231 | RPS26 | GSM5252134_BPH511PrG_Fcol_3GEX | Human | Prostate | BPH | 1.98e-29 | 9.26e-01 | -0.1433 |
| 6231 | RPS26 | GSM5252135_BPH511PrPUr_Fcol_3GEX | Human | Prostate | BPH | 7.24e-33 | 1.27e+00 | -0.1833 |
| 6231 | RPS26 | GSM5252136_BPH556PrGA1_Fcol | Human | Prostate | BPH | 1.29e-04 | 1.00e-01 | -0.23 |
| 6231 | RPS26 | GSM5252137_BPH556PrGA2_Fcol | Human | Prostate | BPH | 1.02e-13 | 2.59e-01 | -0.23 |
| 6231 | RPS26 | 047563_1562-all-cells | Human | Prostate | BPH | 1.61e-07 | 9.87e-02 | 0.0791 |
| 6231 | RPS26 | 048752_1579-all-cells | Human | Prostate | BPH | 1.25e-14 | -3.29e-01 | 0.1008 |
| 6231 | RPS26 | 052095_1628-all-cells | Human | Prostate | BPH | 1.67e-50 | -9.10e-01 | 0.1032 |
| 6231 | RPS26 | 052097_1595-all-cells | Human | Prostate | BPH | 5.54e-15 | -4.09e-01 | 0.0972 |
| Tissue | Expression Dynamics | Abbreviation |
| Breast | 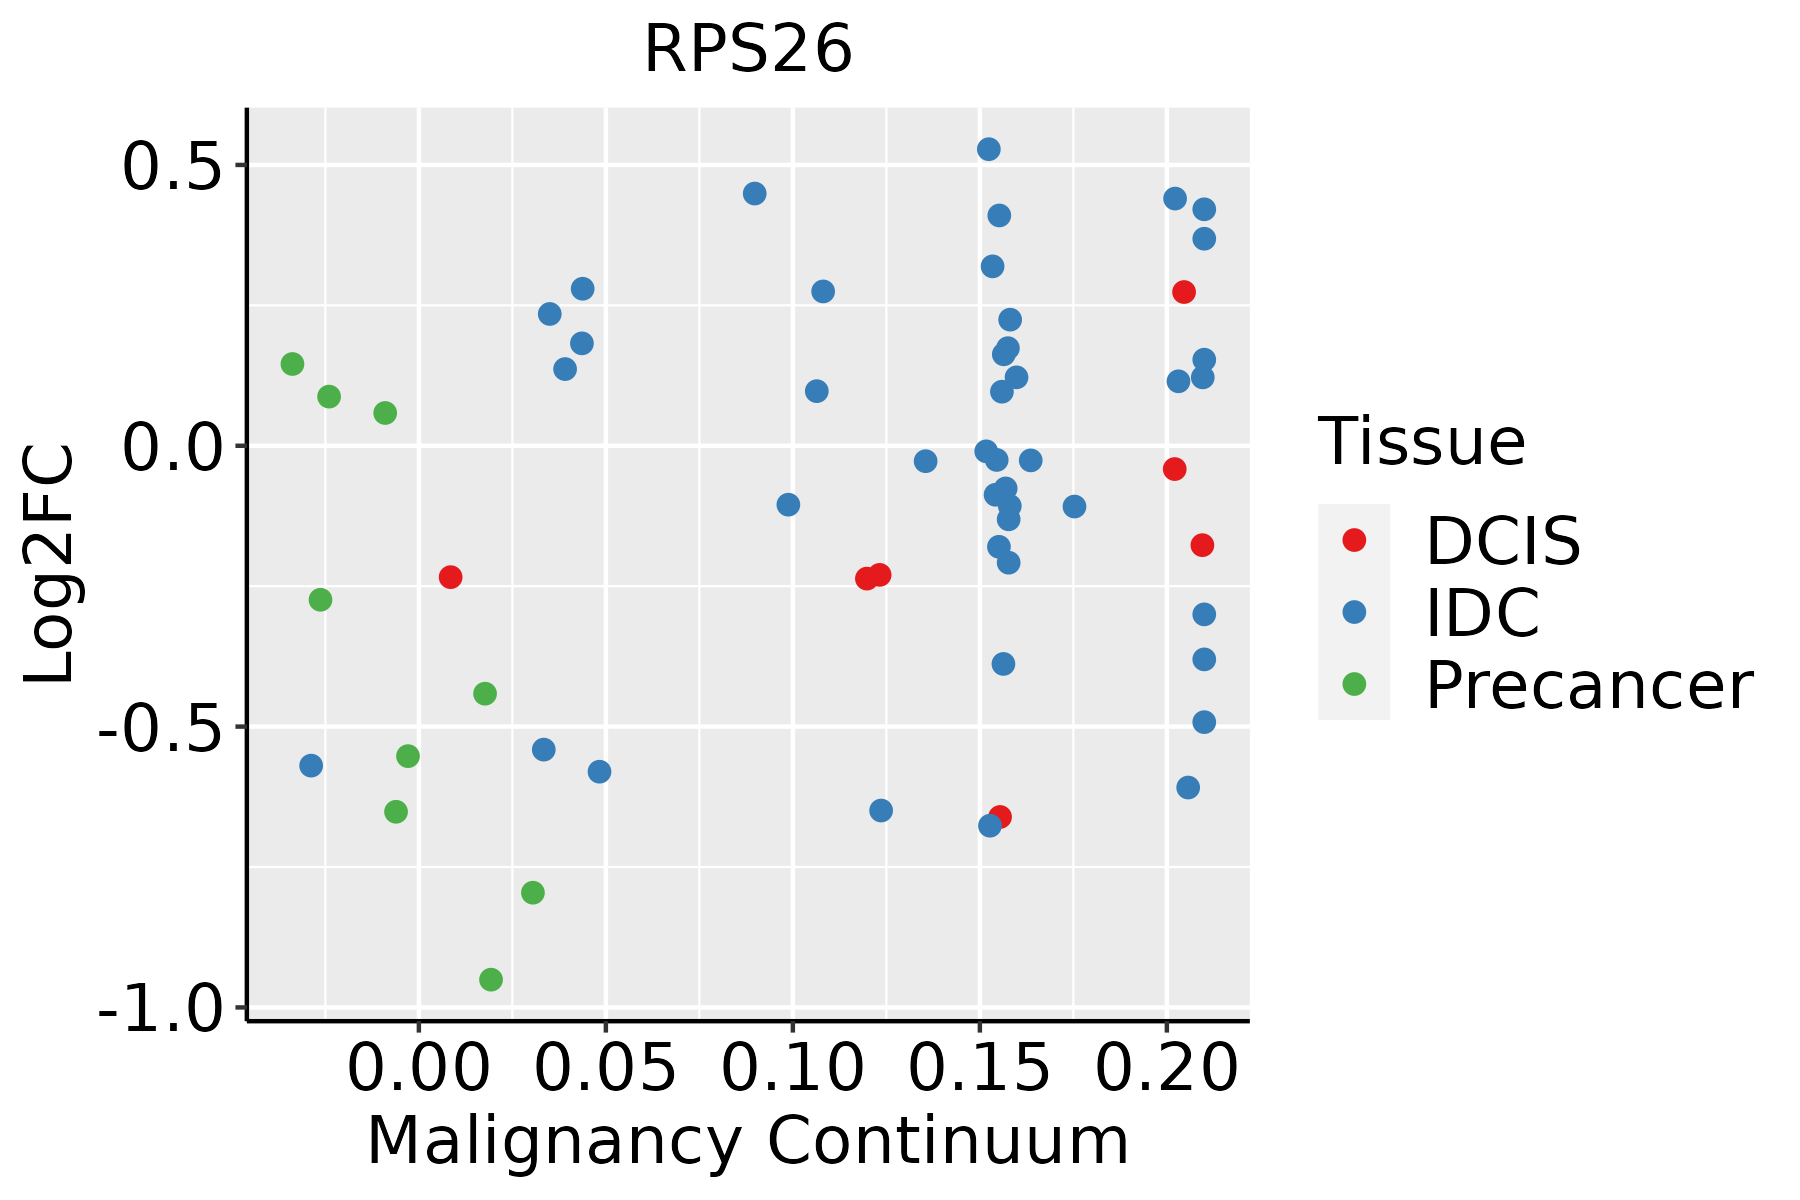 | IDC: Invasive ductal carcinoma |
| DCIS: Ductal carcinoma in situ |
| Precancer(BRCA1-mut): Precancerous lesion from BRCA1 mutation carriers |
| Cervix | 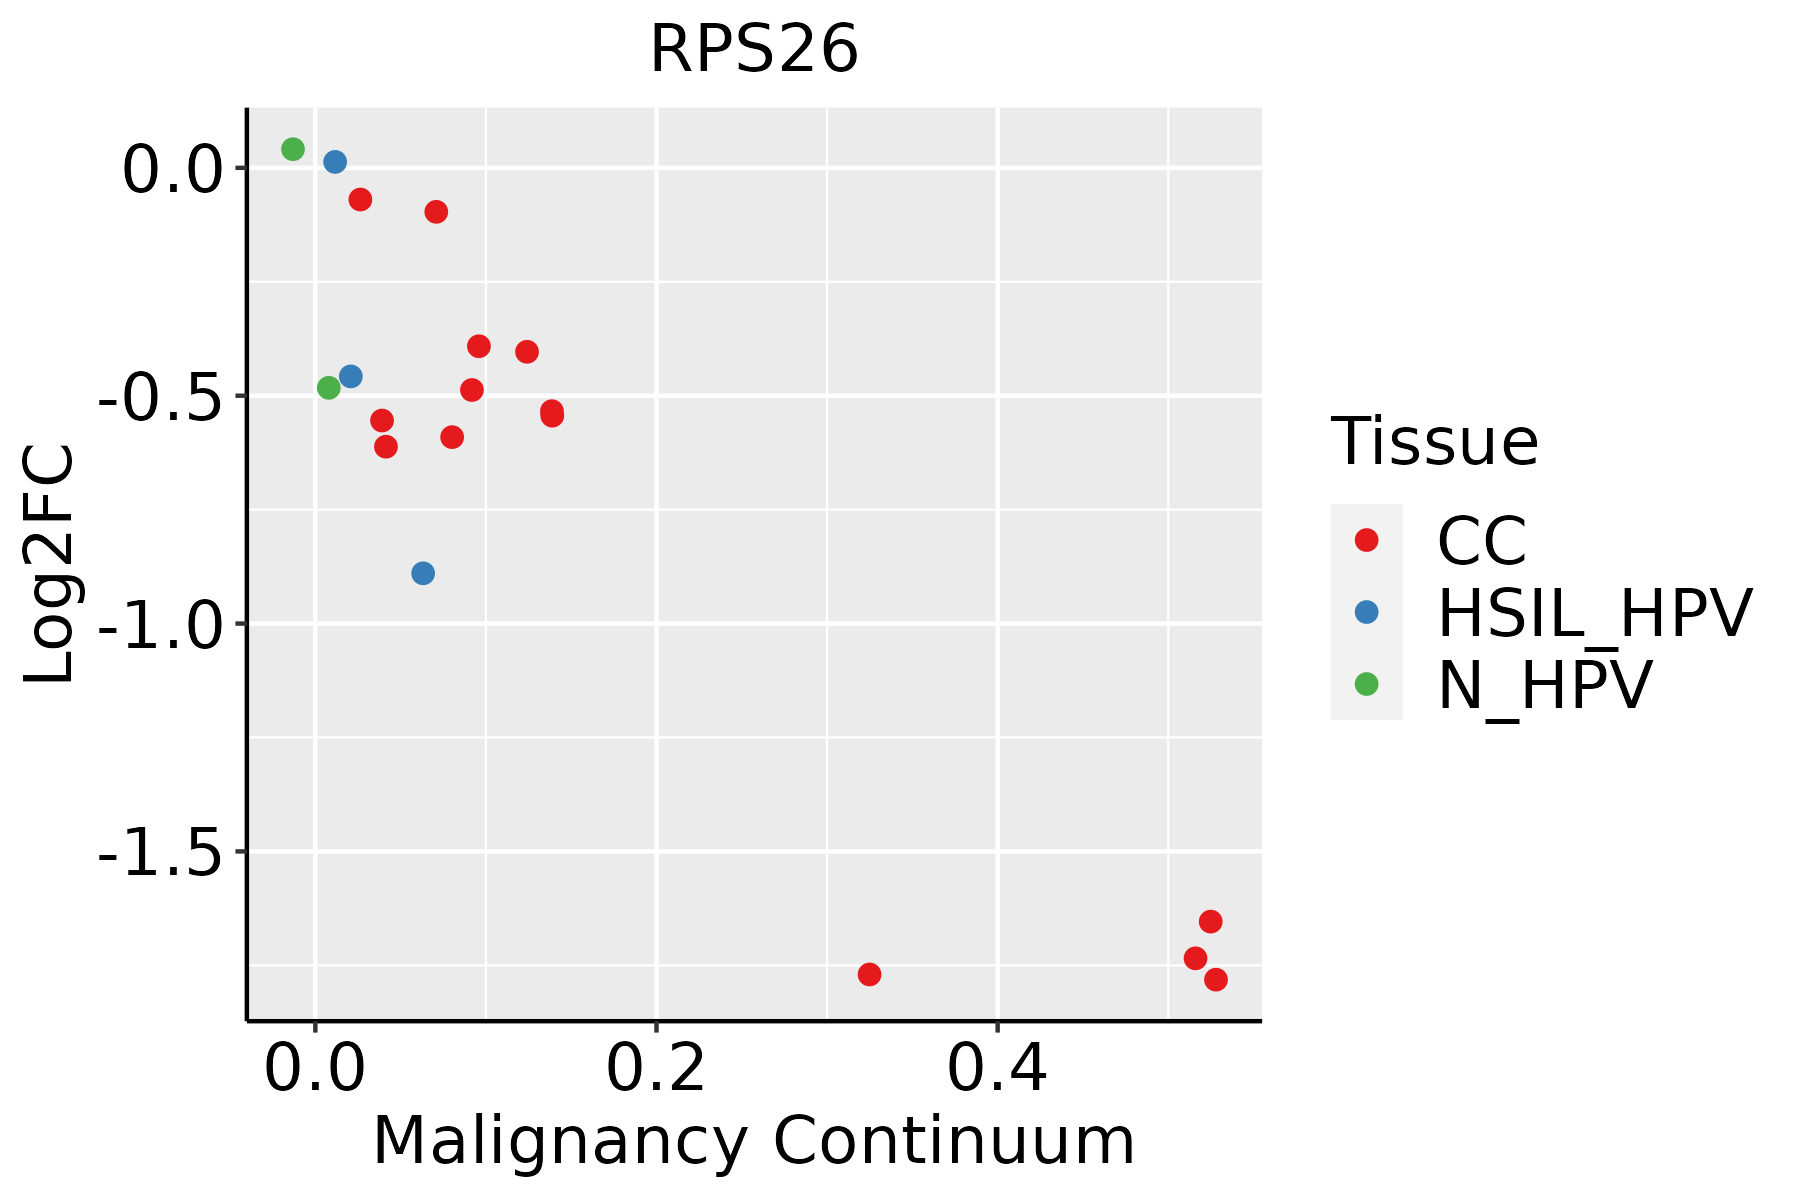 | CC: Cervix cancer |
| HSIL_HPV: HPV-infected high-grade squamous intraepithelial lesions |
| N_HPV: HPV-infected normal cervix |
| Colorectum (GSE201348) |  | FAP: Familial adenomatous polyposis |
| CRC: Colorectal cancer |
| Colorectum (HTA11) |  | AD: Adenomas |
| SER: Sessile serrated lesions |
| MSI-H: Microsatellite-high colorectal cancer |
| MSS: Microsatellite stable colorectal cancer |
| Endometrium | 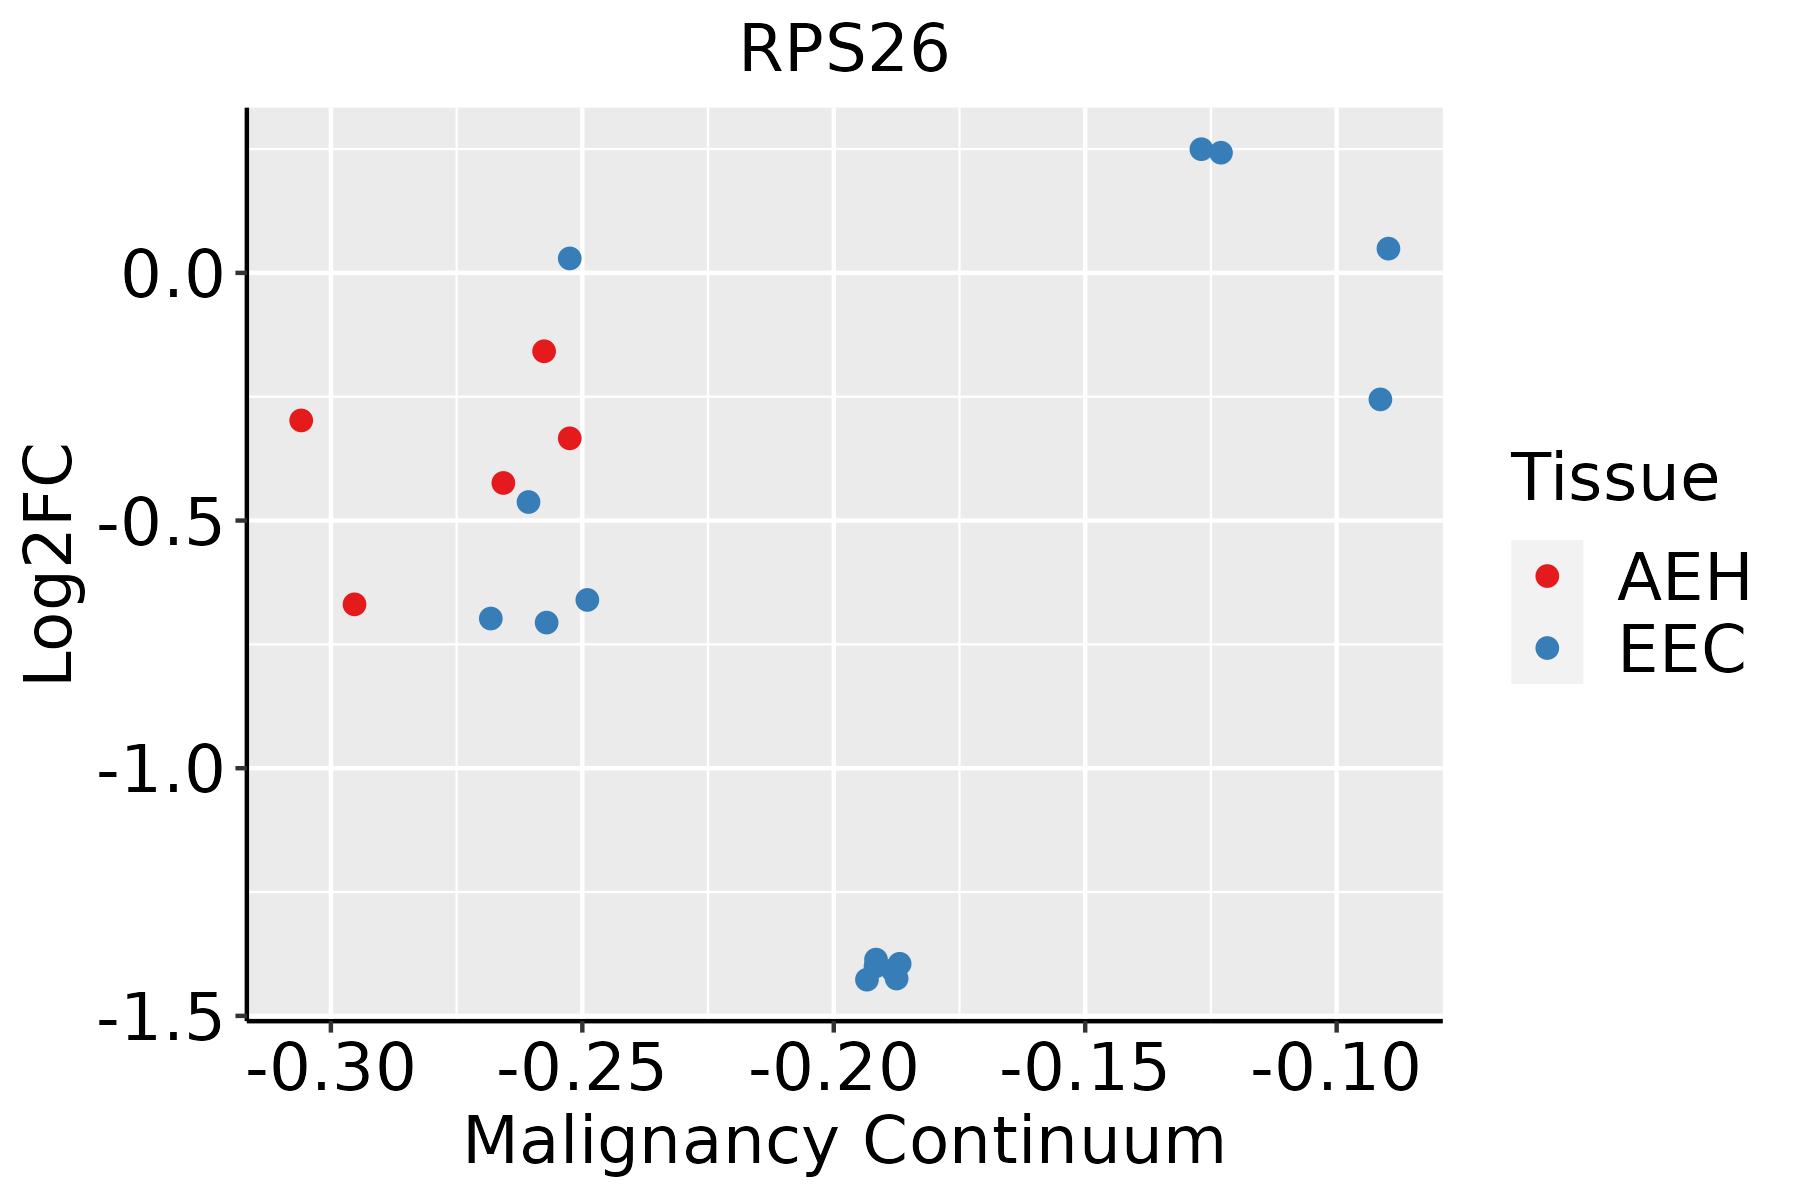 | AEH: Atypical endometrial hyperplasia |
| EEC: Endometrioid Cancer |
| Esophagus | 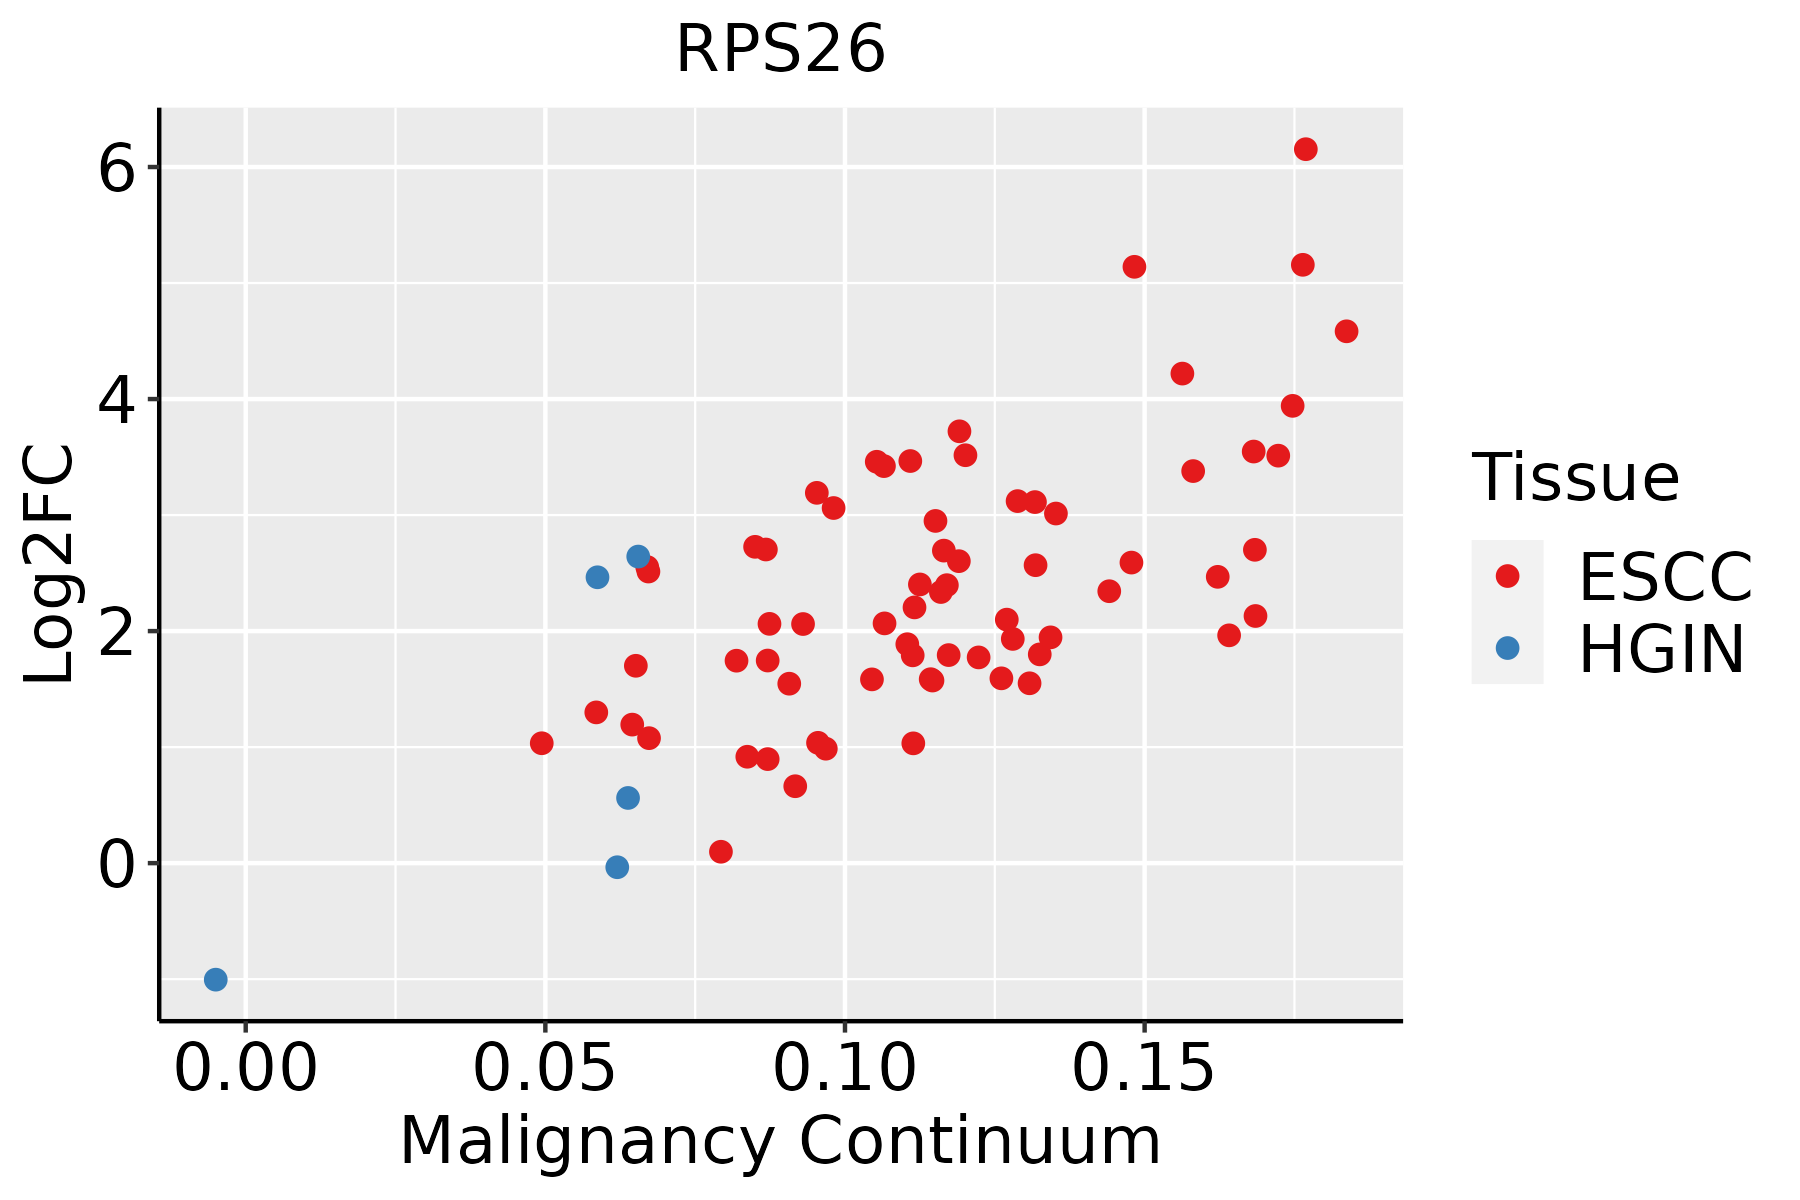 | ESCC: Esophageal squamous cell carcinoma |
| HGIN: High-grade intraepithelial neoplasias |
| LGIN: Low-grade intraepithelial neoplasias |
| GC | 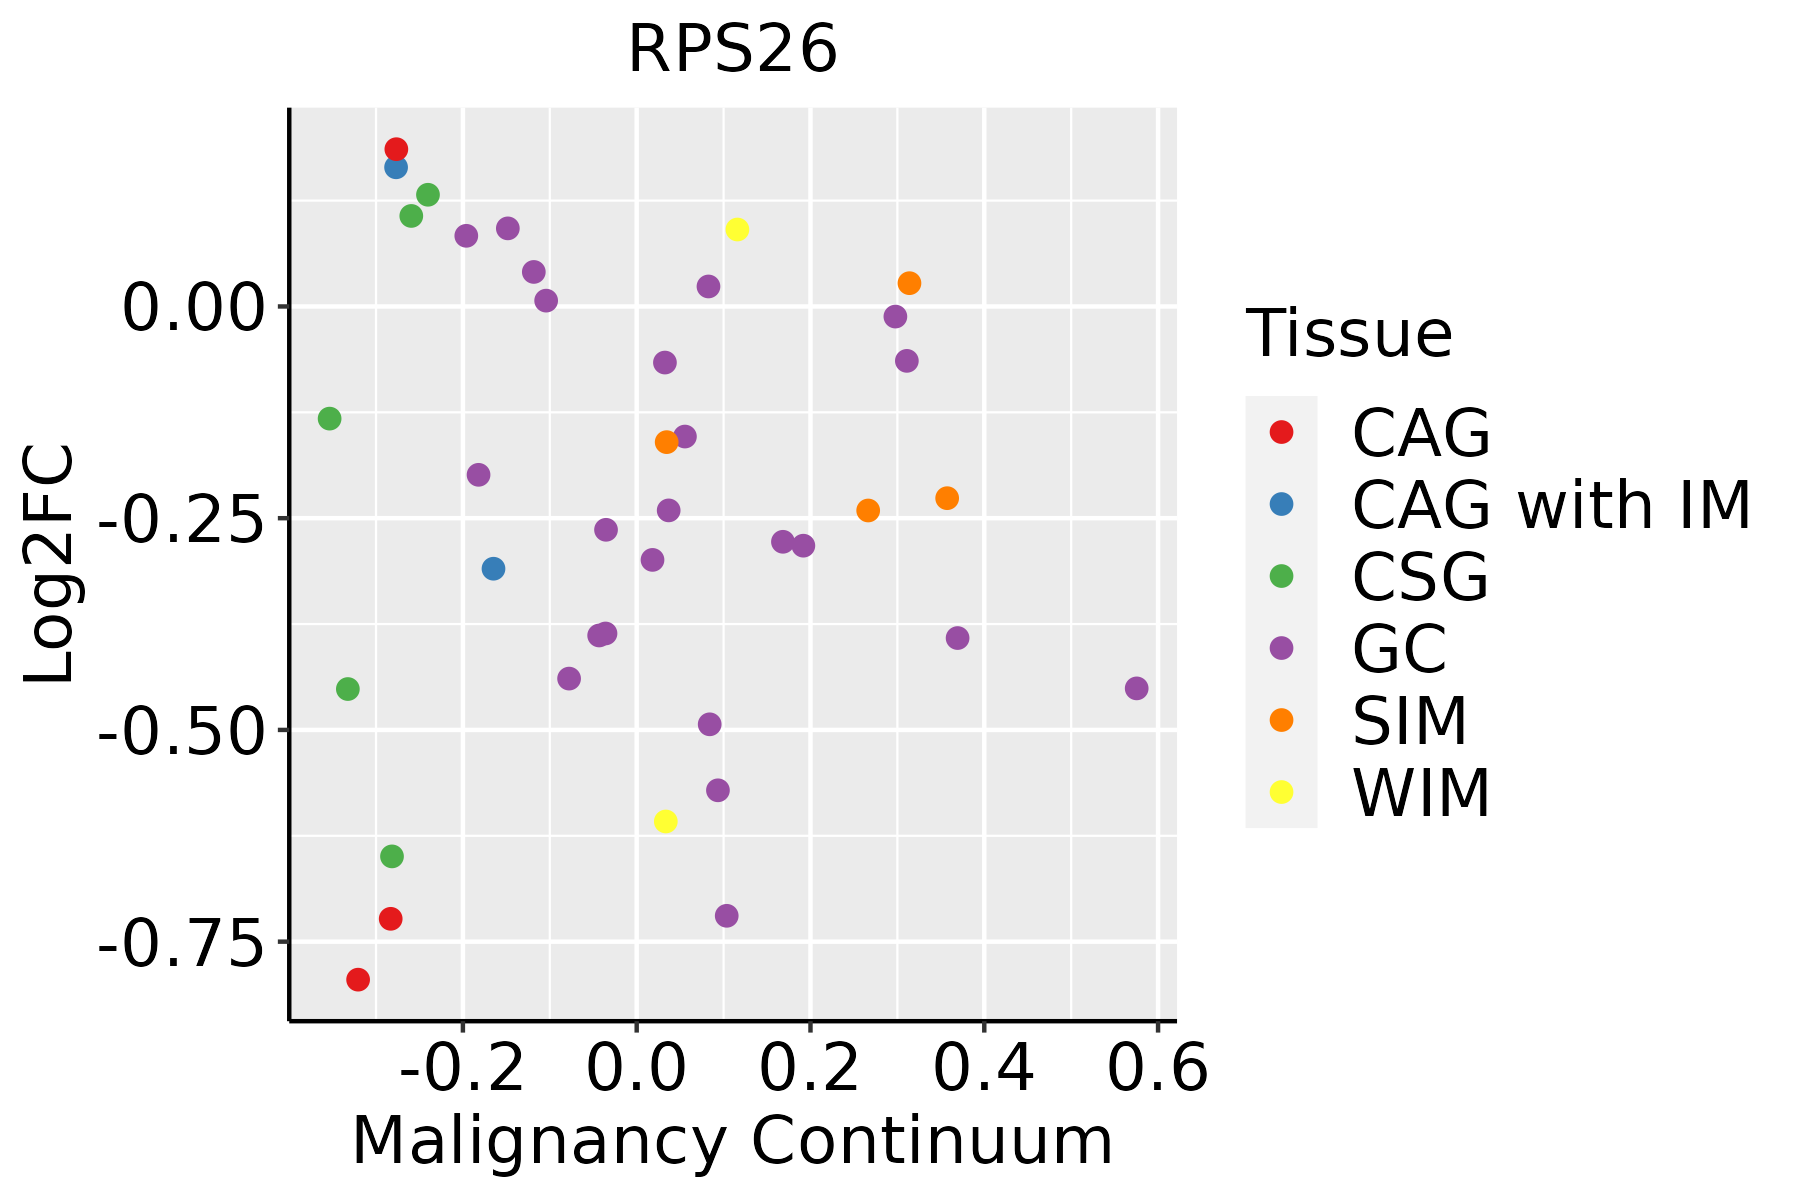 | CAG: Chronic atrophic gastritis |
| CAG with IM: Chronic atrophic gastritis with intestinal metaplasia |
| CSG: Chronic superficial gastritis |
| GC: Gastric cancer |
| SIM: Severe intestinal metaplasia |
| WIM: Wild intestinal metaplasia |
| Liver | 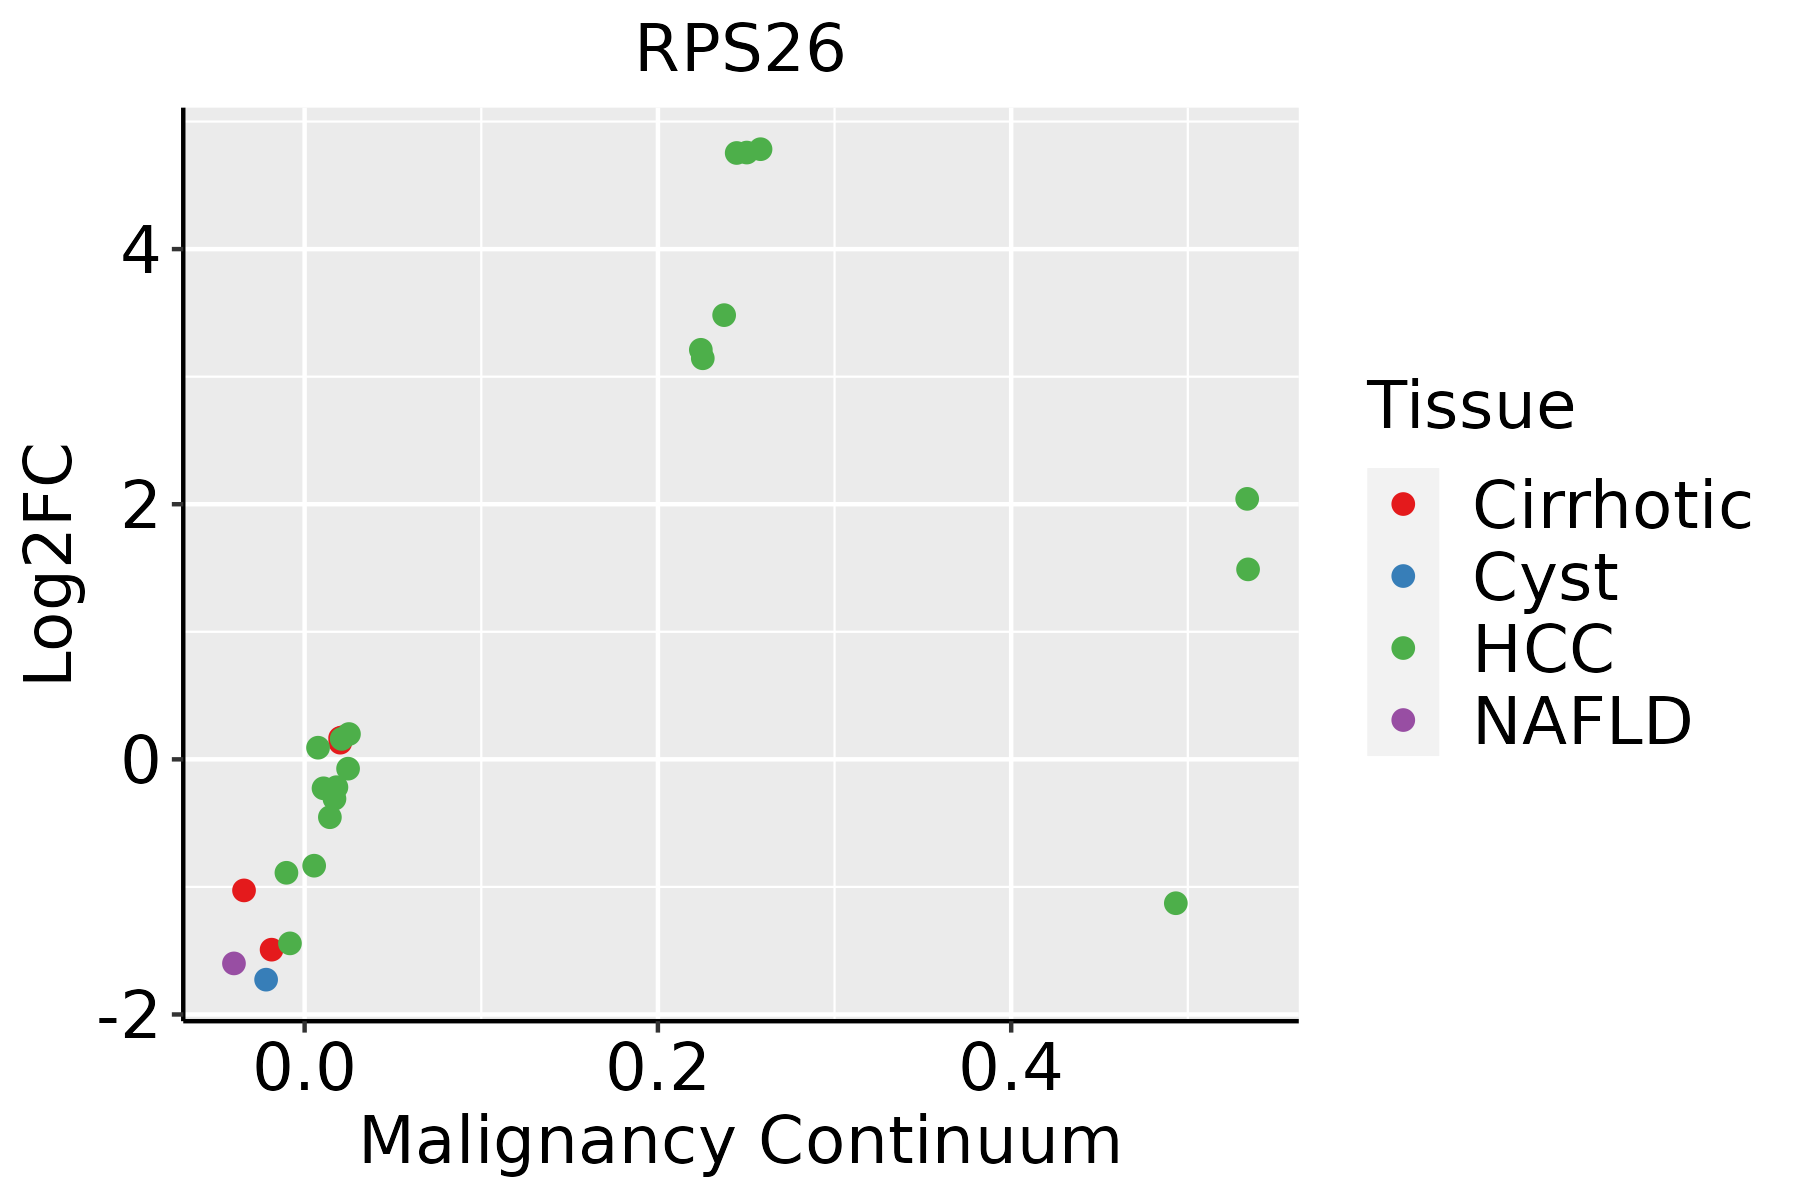 | HCC: Hepatocellular carcinoma |
| NAFLD: Non-alcoholic fatty liver disease |
| Lung |  | AAH: Atypical adenomatous hyperplasia |
| AIS: Adenocarcinoma in situ |
| IAC: Invasive lung adenocarcinoma |
| MIA: Minimally invasive adenocarcinoma |
| Oral Cavity |  | EOLP: Erosive Oral lichen planus |
| LP: leukoplakia |
| NEOLP: Non-erosive oral lichen planus |
| OSCC: Oral squamous cell carcinoma |
| Prostate | 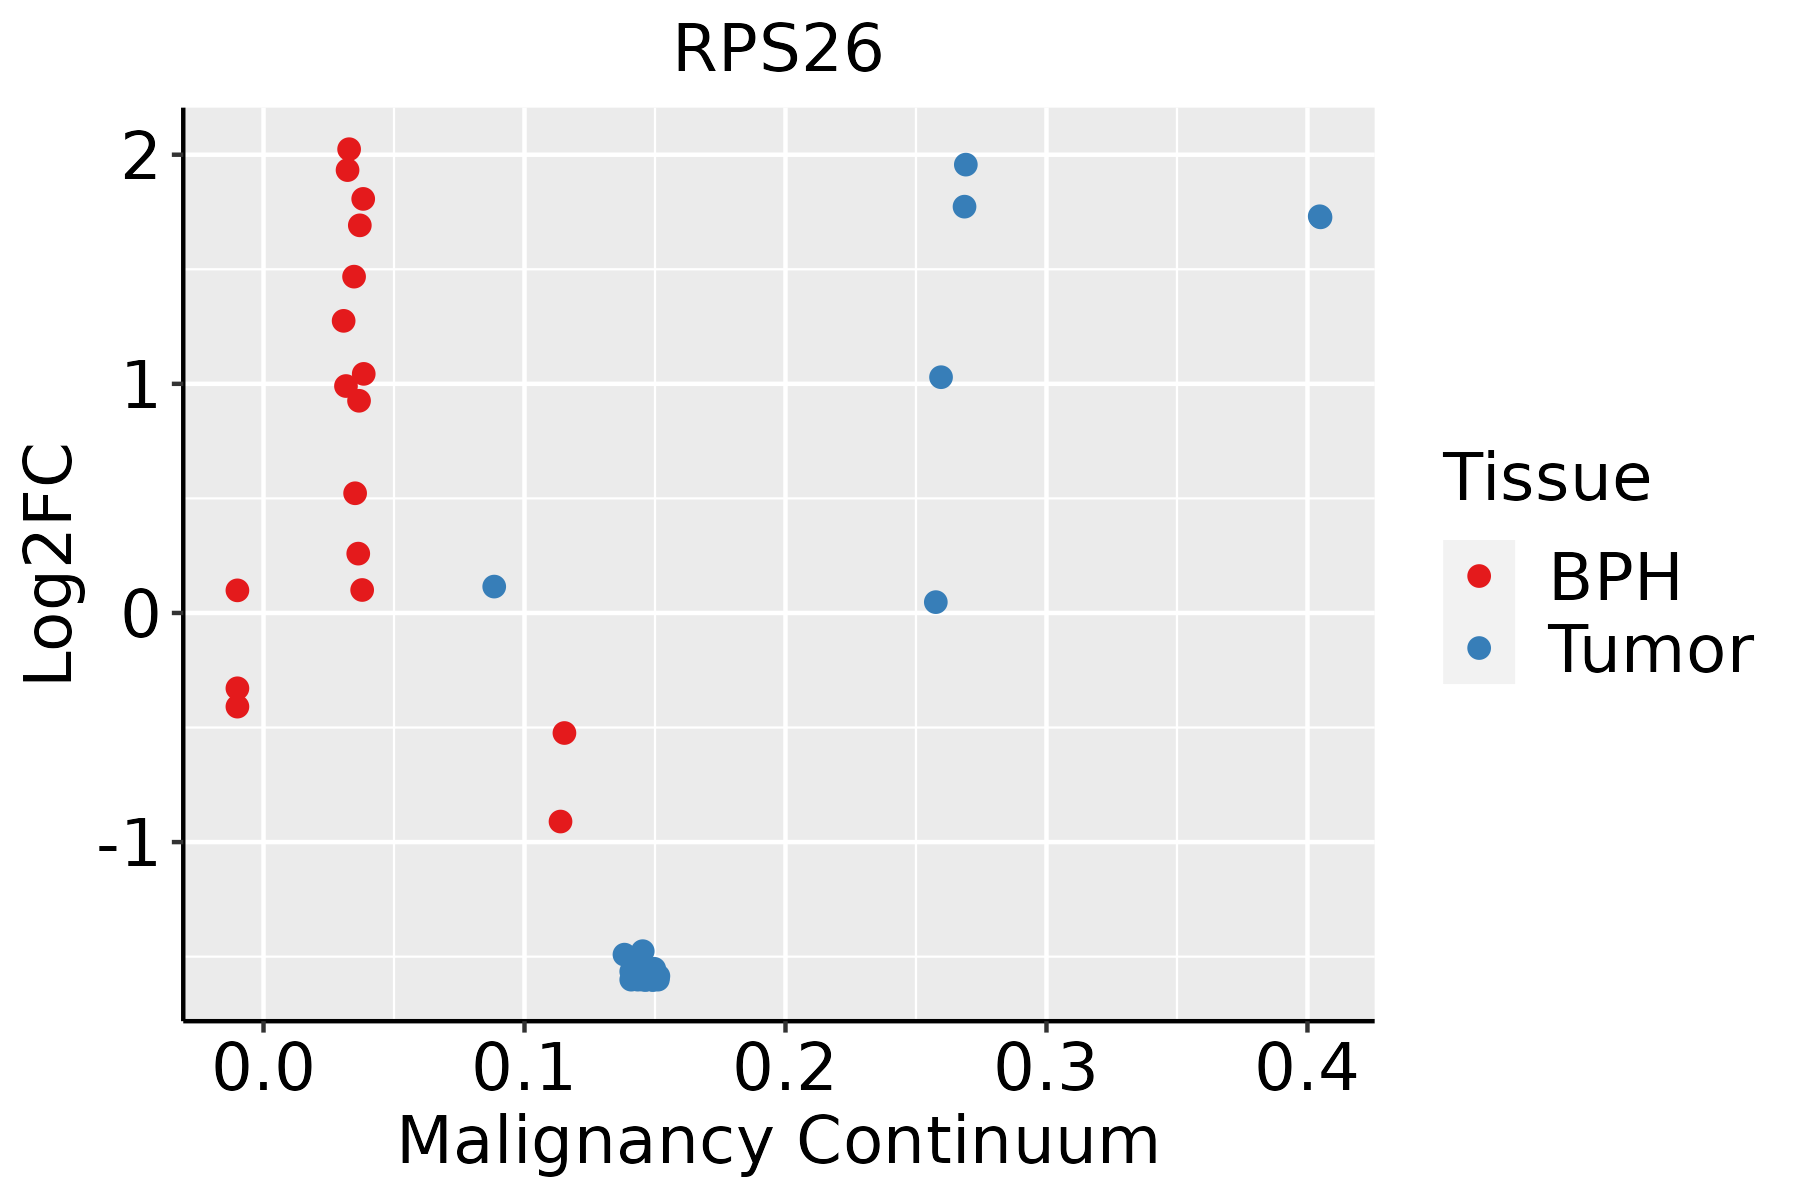 | BPH: Benign Prostatic Hyperplasia |
| Skin | 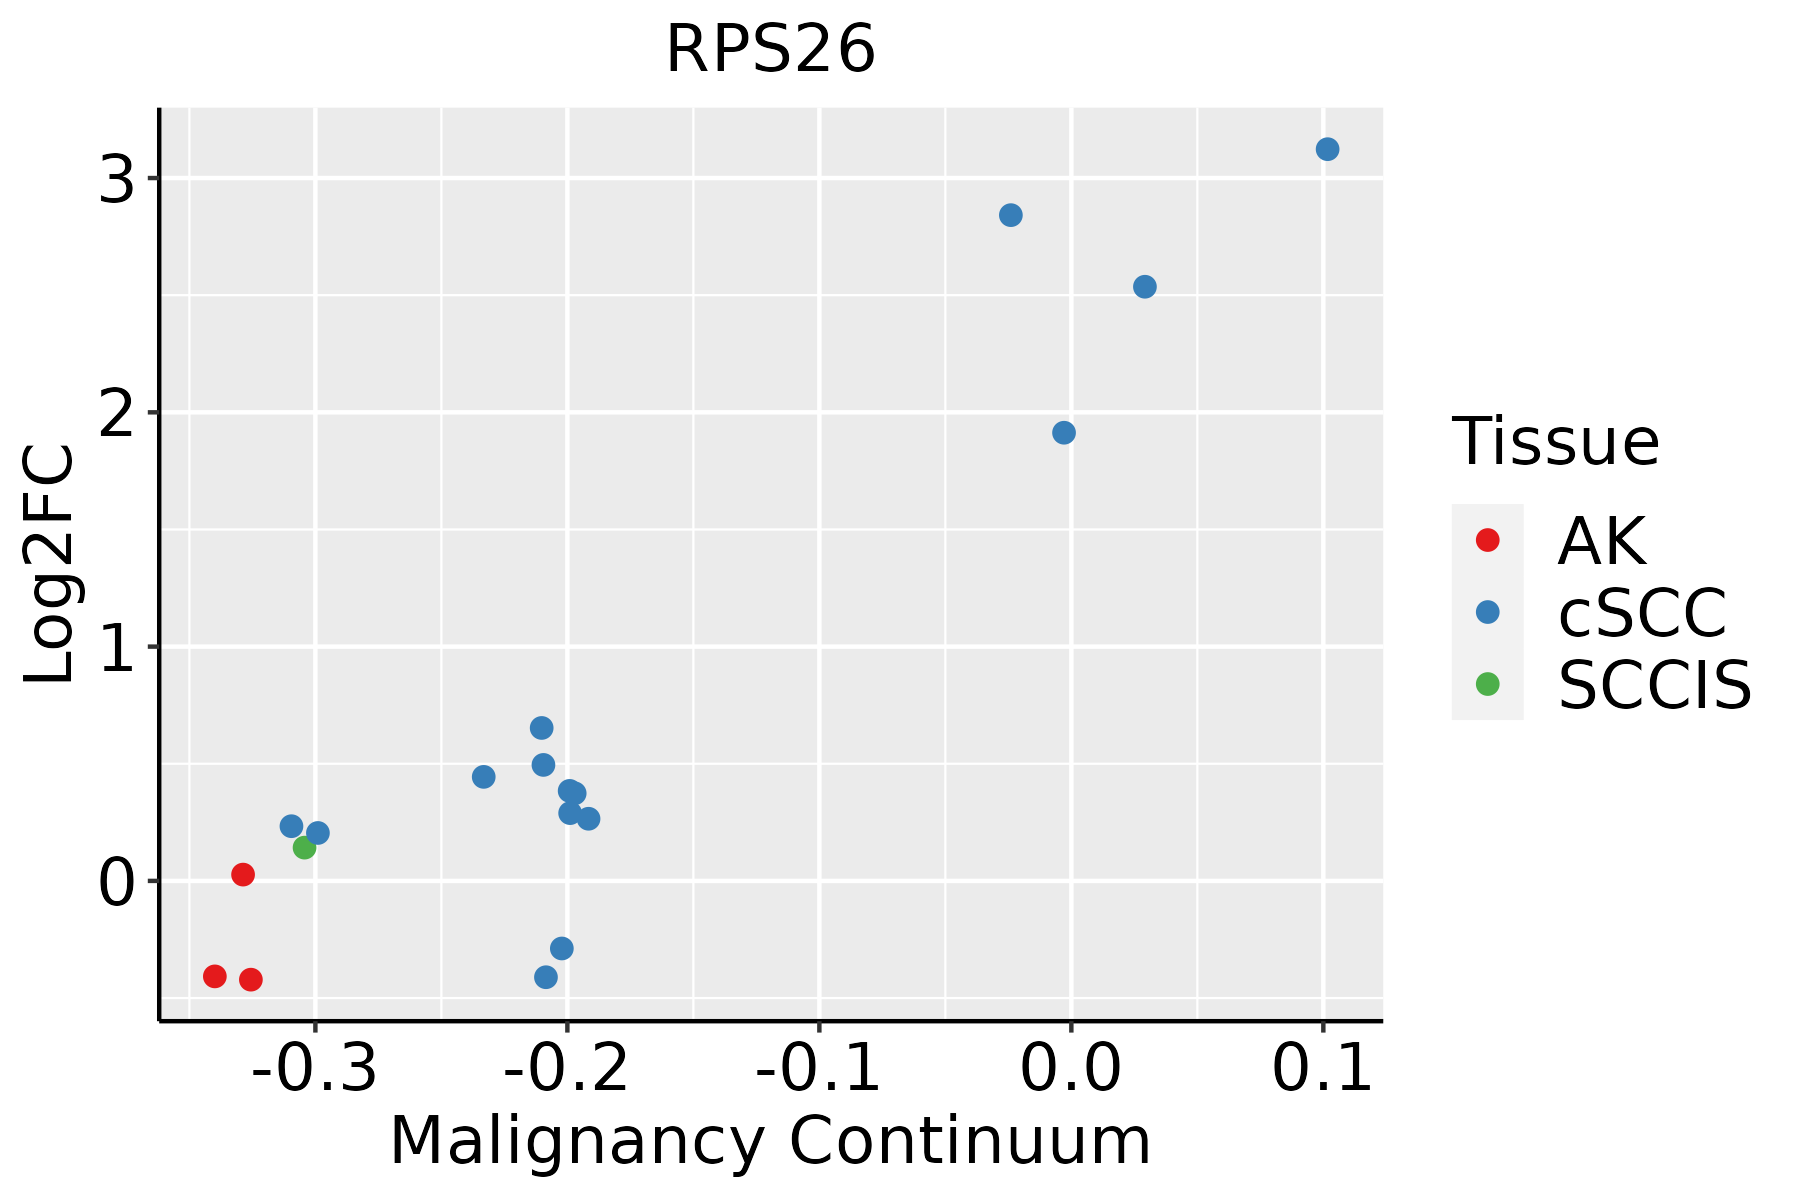 | AK: Actinic keratosis |
| cSCC: Cutaneous squamous cell carcinoma |
| SCCIS:squamous cell carcinoma in situ |
| Thyroid | 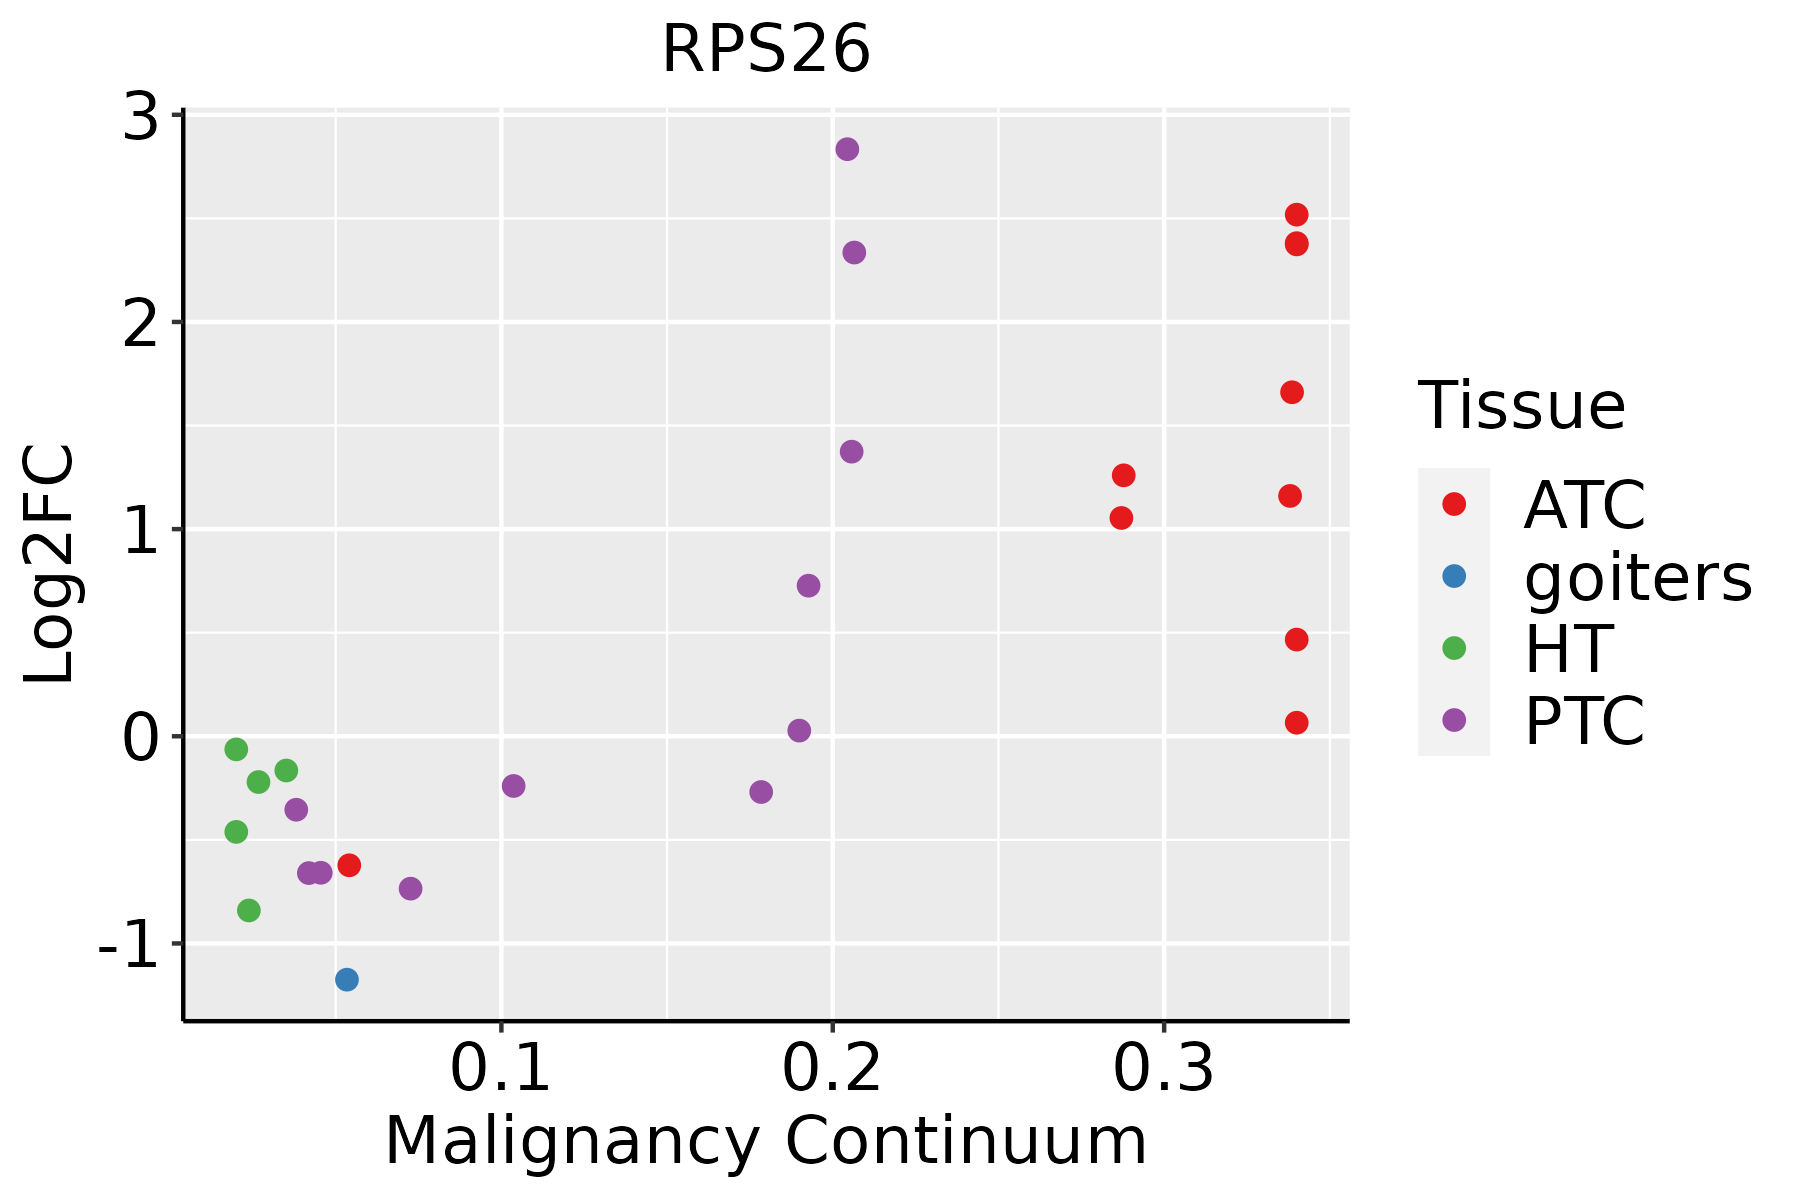 | ATC: Anaplastic thyroid cancer |
| HT: Hashimoto's thyroiditis |
| PTC: Papillary thyroid cancer |
| GO ID | Tissue | Disease Stage | Description | Gene Ratio | Bg Ratio | pvalue | p.adjust | Count |
| GO:00021819 | Breast | Precancer | cytoplasmic translation | 80/1080 | 148/18723 | 1.59e-59 | 8.54e-56 | 80 |
| GO:00083809 | Breast | Precancer | RNA splicing | 65/1080 | 434/18723 | 1.27e-12 | 2.53e-10 | 65 |
| GO:00434849 | Breast | Precancer | regulation of RNA splicing | 34/1080 | 148/18723 | 2.66e-12 | 4.75e-10 | 34 |
| GO:00331199 | Breast | Precancer | negative regulation of RNA splicing | 9/1080 | 25/18723 | 6.03e-06 | 1.72e-04 | 9 |
| GO:000218114 | Breast | IDC | cytoplasmic translation | 82/1434 | 148/18723 | 2.60e-52 | 1.48e-48 | 82 |
| GO:000838014 | Breast | IDC | RNA splicing | 73/1434 | 434/18723 | 1.27e-10 | 1.57e-08 | 73 |
| GO:004348414 | Breast | IDC | regulation of RNA splicing | 36/1434 | 148/18723 | 3.32e-10 | 3.77e-08 | 36 |
| GO:003311914 | Breast | IDC | negative regulation of RNA splicing | 9/1434 | 25/18723 | 5.85e-05 | 1.23e-03 | 9 |
| GO:000218124 | Breast | DCIS | cytoplasmic translation | 82/1390 | 148/18723 | 2.21e-53 | 1.25e-49 | 82 |
| GO:000838024 | Breast | DCIS | RNA splicing | 73/1390 | 434/18723 | 3.05e-11 | 5.08e-09 | 73 |
| GO:004348424 | Breast | DCIS | regulation of RNA splicing | 36/1390 | 148/18723 | 1.40e-10 | 1.69e-08 | 36 |
| GO:003311924 | Breast | DCIS | negative regulation of RNA splicing | 9/1390 | 25/18723 | 4.58e-05 | 9.53e-04 | 9 |
| GO:000218110 | Cervix | CC | cytoplasmic translation | 96/2311 | 148/18723 | 4.87e-51 | 2.91e-47 | 96 |
| GO:004348410 | Cervix | CC | regulation of RNA splicing | 42/2311 | 148/18723 | 1.25e-07 | 6.24e-06 | 42 |
| GO:003311910 | Cervix | CC | negative regulation of RNA splicing | 13/2311 | 25/18723 | 1.83e-06 | 5.89e-05 | 13 |
| GO:000838010 | Cervix | CC | RNA splicing | 76/2311 | 434/18723 | 9.79e-04 | 8.19e-03 | 76 |
| GO:000218115 | Cervix | HSIL_HPV | cytoplasmic translation | 86/737 | 148/18723 | 3.97e-82 | 1.91e-78 | 86 |
| GO:004348415 | Cervix | HSIL_HPV | regulation of RNA splicing | 13/737 | 148/18723 | 5.72e-03 | 4.55e-02 | 13 |
| GO:000218125 | Cervix | N_HPV | cytoplasmic translation | 42/534 | 148/18723 | 2.61e-30 | 1.19e-26 | 42 |
| GO:004348425 | Cervix | N_HPV | regulation of RNA splicing | 15/534 | 148/18723 | 2.23e-05 | 6.26e-04 | 15 |
| Pathway ID | Tissue | Disease Stage | Description | Gene Ratio | Bg Ratio | pvalue | p.adjust | qvalue | Count |
| hsa0301018 | Breast | Precancer | Ribosome | 80/684 | 167/8465 | 7.33e-44 | 2.32e-41 | 1.77e-41 | 80 |
| hsa0517118 | Breast | Precancer | Coronavirus disease - COVID-19 | 81/684 | 232/8465 | 3.74e-32 | 2.36e-30 | 1.81e-30 | 81 |
| hsa0301019 | Breast | Precancer | Ribosome | 80/684 | 167/8465 | 7.33e-44 | 2.32e-41 | 1.77e-41 | 80 |
| hsa0517119 | Breast | Precancer | Coronavirus disease - COVID-19 | 81/684 | 232/8465 | 3.74e-32 | 2.36e-30 | 1.81e-30 | 81 |
| hsa0301024 | Breast | IDC | Ribosome | 83/867 | 167/8465 | 6.07e-39 | 9.87e-37 | 7.38e-37 | 83 |
| hsa0517124 | Breast | IDC | Coronavirus disease - COVID-19 | 86/867 | 232/8465 | 1.50e-28 | 9.72e-27 | 7.27e-27 | 86 |
| hsa0301034 | Breast | IDC | Ribosome | 83/867 | 167/8465 | 6.07e-39 | 9.87e-37 | 7.38e-37 | 83 |
| hsa0517134 | Breast | IDC | Coronavirus disease - COVID-19 | 86/867 | 232/8465 | 1.50e-28 | 9.72e-27 | 7.27e-27 | 86 |
| hsa0301044 | Breast | DCIS | Ribosome | 82/846 | 167/8465 | 8.69e-39 | 1.40e-36 | 1.03e-36 | 82 |
| hsa0517144 | Breast | DCIS | Coronavirus disease - COVID-19 | 86/846 | 232/8465 | 2.42e-29 | 1.56e-27 | 1.15e-27 | 86 |
| hsa0301054 | Breast | DCIS | Ribosome | 82/846 | 167/8465 | 8.69e-39 | 1.40e-36 | 1.03e-36 | 82 |
| hsa0517154 | Breast | DCIS | Coronavirus disease - COVID-19 | 86/846 | 232/8465 | 2.42e-29 | 1.56e-27 | 1.15e-27 | 86 |
| hsa0517120 | Cervix | CC | Coronavirus disease - COVID-19 | 111/1267 | 232/8465 | 1.82e-33 | 5.90e-31 | 3.49e-31 | 111 |
| hsa0301020 | Cervix | CC | Ribosome | 85/1267 | 167/8465 | 3.17e-28 | 5.14e-26 | 3.04e-26 | 85 |
| hsa05171110 | Cervix | CC | Coronavirus disease - COVID-19 | 111/1267 | 232/8465 | 1.82e-33 | 5.90e-31 | 3.49e-31 | 111 |
| hsa03010110 | Cervix | CC | Ribosome | 85/1267 | 167/8465 | 3.17e-28 | 5.14e-26 | 3.04e-26 | 85 |
| hsa0301025 | Cervix | HSIL_HPV | Ribosome | 80/459 | 167/8465 | 9.61e-58 | 2.82e-55 | 2.28e-55 | 80 |
| hsa0517125 | Cervix | HSIL_HPV | Coronavirus disease - COVID-19 | 91/459 | 232/8465 | 2.14e-56 | 3.13e-54 | 2.53e-54 | 91 |
| hsa0301035 | Cervix | HSIL_HPV | Ribosome | 80/459 | 167/8465 | 9.61e-58 | 2.82e-55 | 2.28e-55 | 80 |
| hsa0517135 | Cervix | HSIL_HPV | Coronavirus disease - COVID-19 | 91/459 | 232/8465 | 2.14e-56 | 3.13e-54 | 2.53e-54 | 91 |


