| Tissue | Expression Dynamics | Abbreviation |
| Cervix |  | CC: Cervix cancer |
| HSIL_HPV: HPV-infected high-grade squamous intraepithelial lesions |
| N_HPV: HPV-infected normal cervix |
| Colorectum (GSE201348) |  | FAP: Familial adenomatous polyposis |
| CRC: Colorectal cancer |
| Colorectum (HTA11) |  | AD: Adenomas |
| SER: Sessile serrated lesions |
| MSI-H: Microsatellite-high colorectal cancer |
| MSS: Microsatellite stable colorectal cancer |
| Endometrium |  | AEH: Atypical endometrial hyperplasia |
| EEC: Endometrioid Cancer |
| Esophagus | 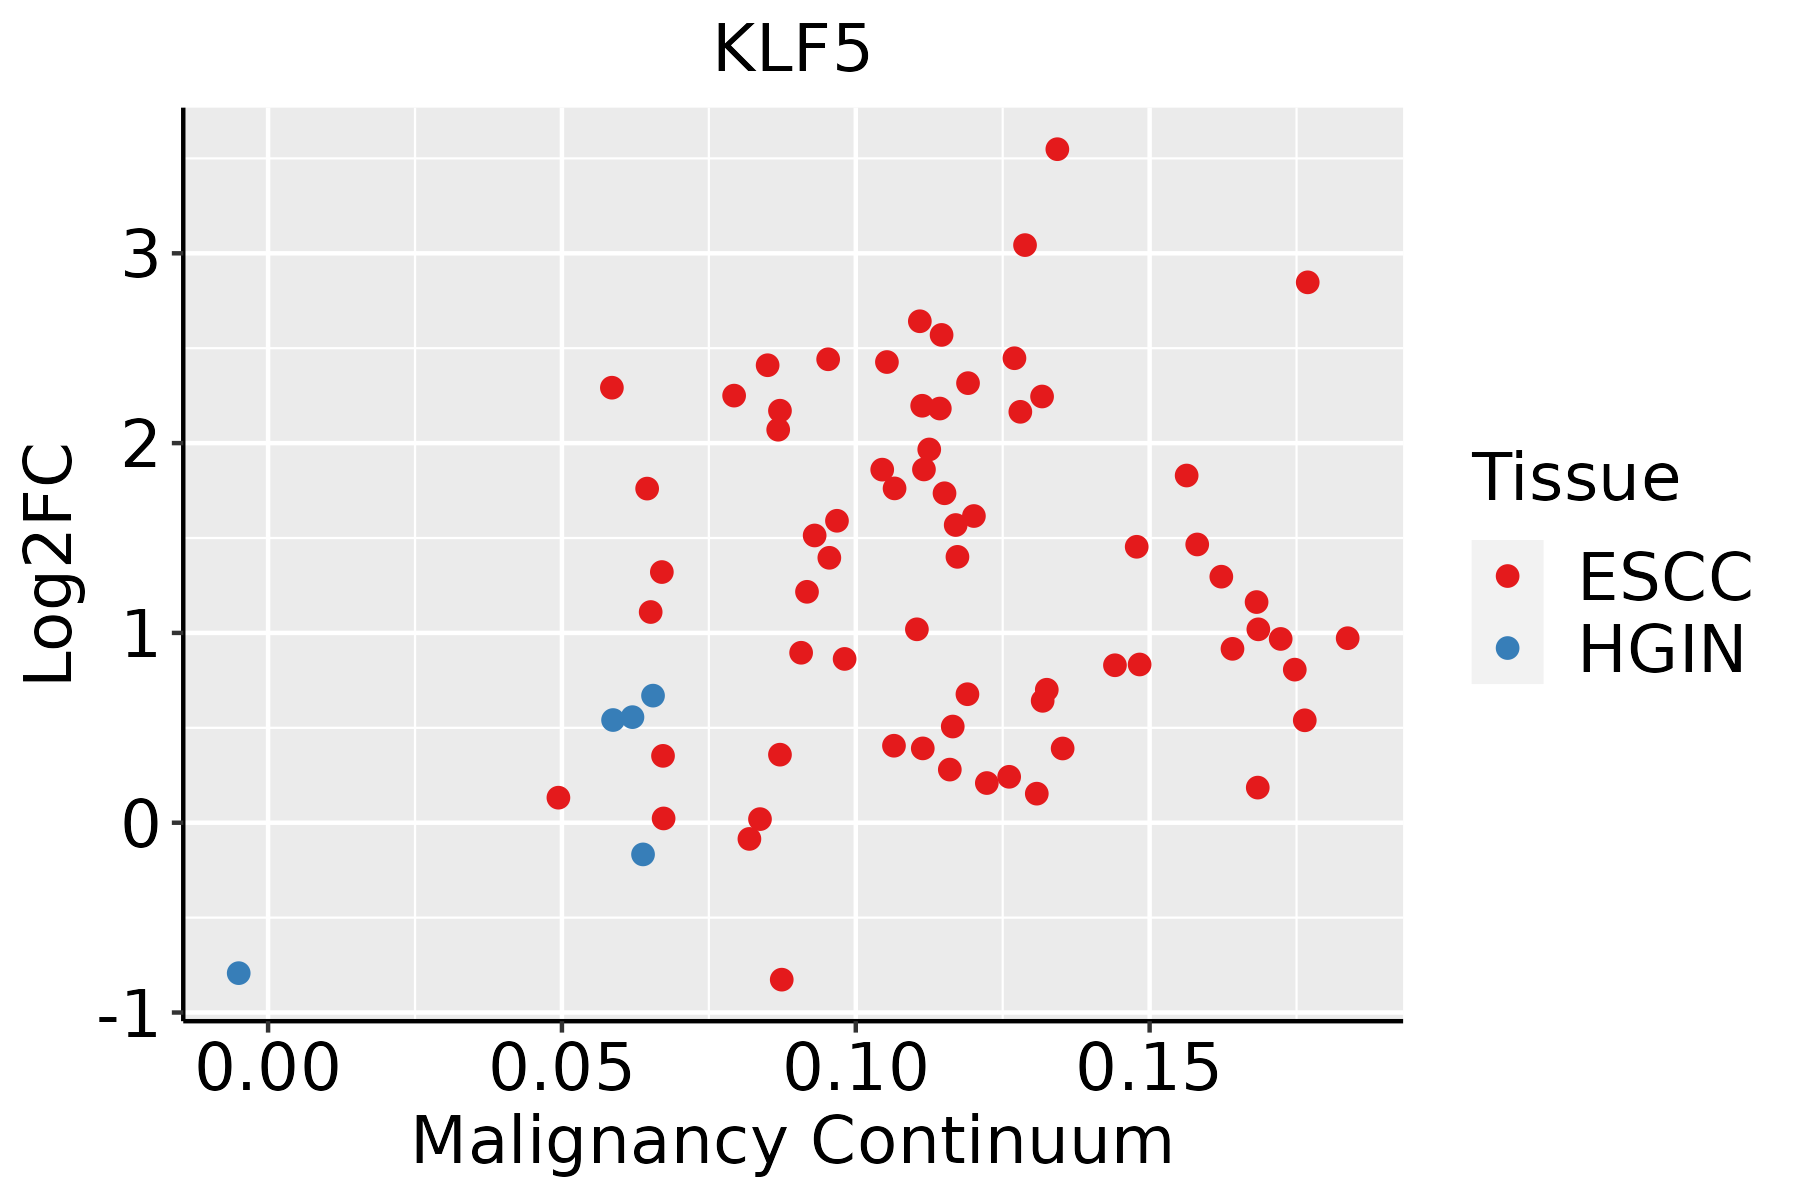 | ESCC: Esophageal squamous cell carcinoma |
| HGIN: High-grade intraepithelial neoplasias |
| LGIN: Low-grade intraepithelial neoplasias |
| GC | 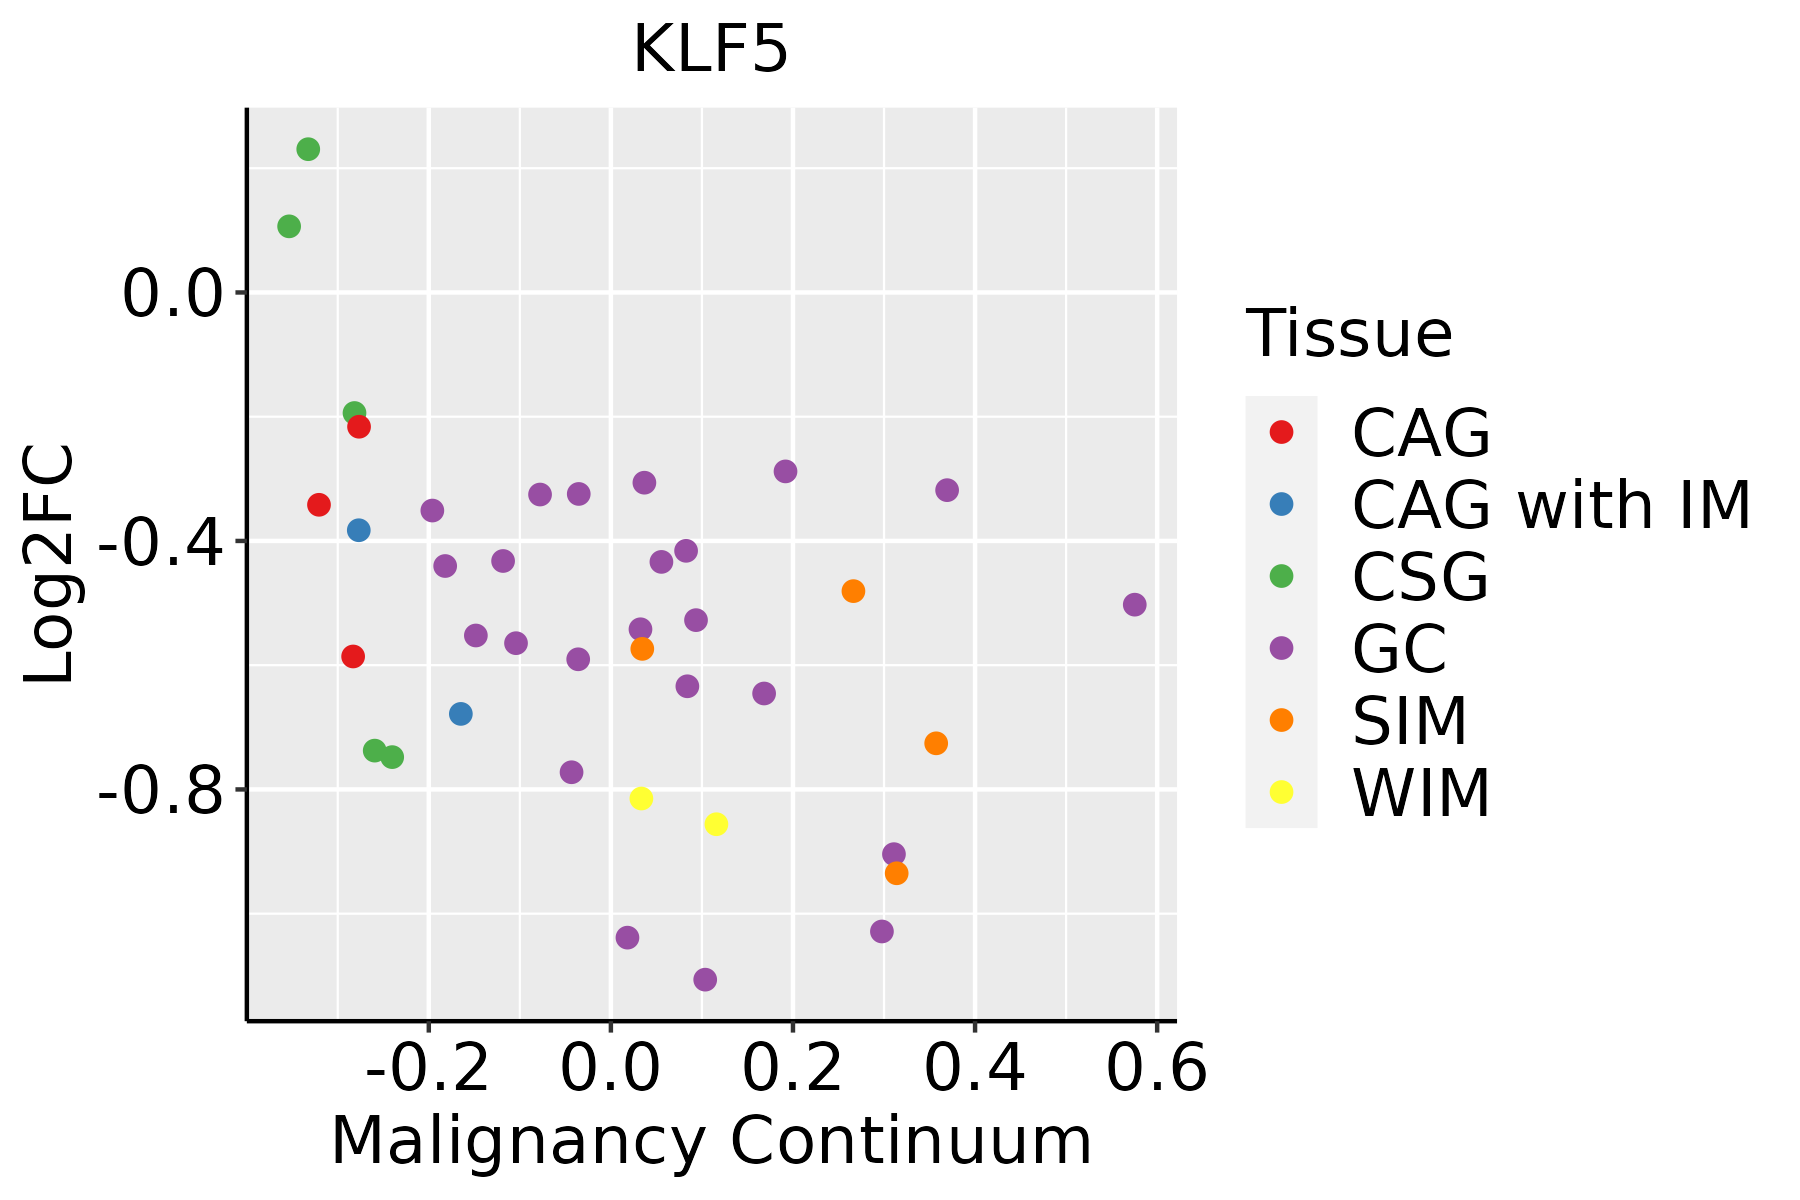 | CAG: Chronic atrophic gastritis |
| CAG with IM: Chronic atrophic gastritis with intestinal metaplasia |
| CSG: Chronic superficial gastritis |
| GC: Gastric cancer |
| SIM: Severe intestinal metaplasia |
| WIM: Wild intestinal metaplasia |
| Liver | 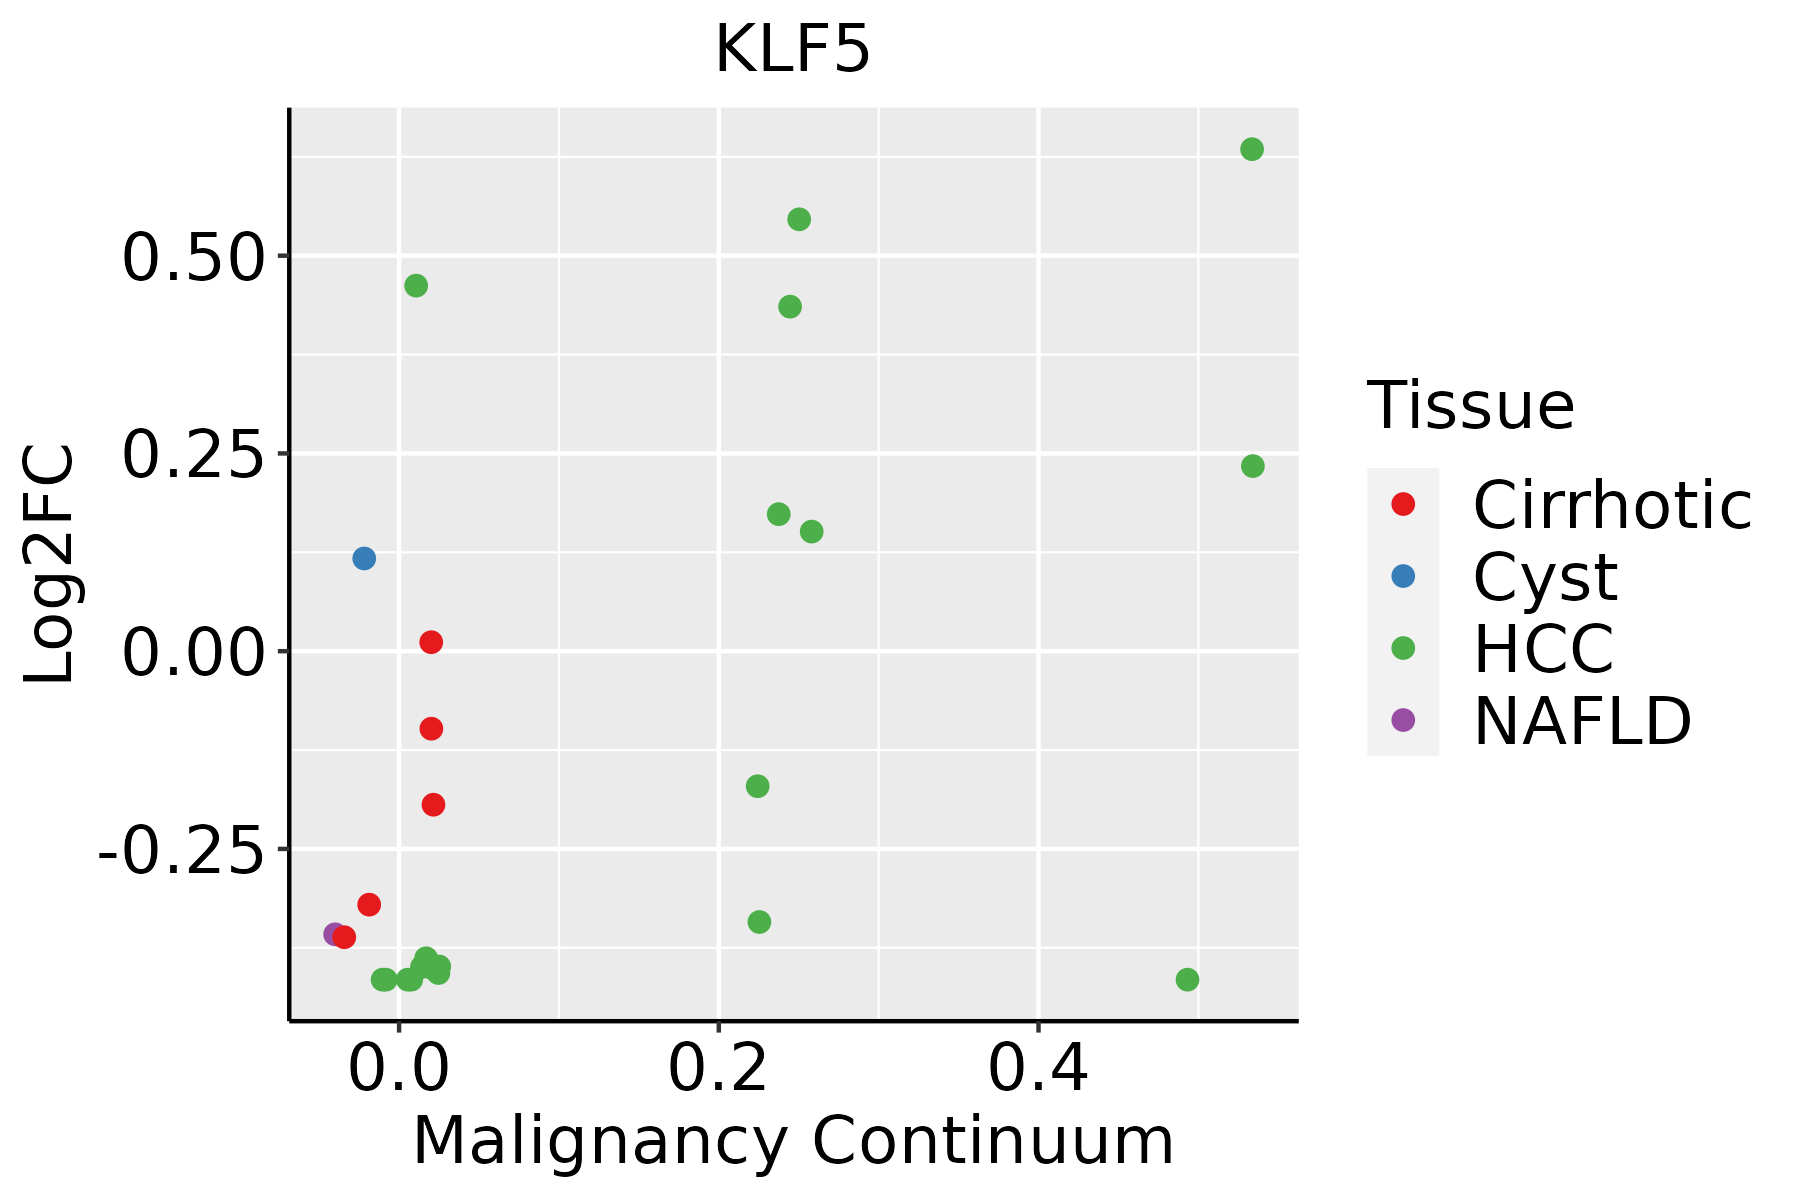 | HCC: Hepatocellular carcinoma |
| NAFLD: Non-alcoholic fatty liver disease |
| Lung |  | AAH: Atypical adenomatous hyperplasia |
| AIS: Adenocarcinoma in situ |
| IAC: Invasive lung adenocarcinoma |
| MIA: Minimally invasive adenocarcinoma |
| Oral Cavity |  | EOLP: Erosive Oral lichen planus |
| LP: leukoplakia |
| NEOLP: Non-erosive oral lichen planus |
| OSCC: Oral squamous cell carcinoma |
| Prostate | 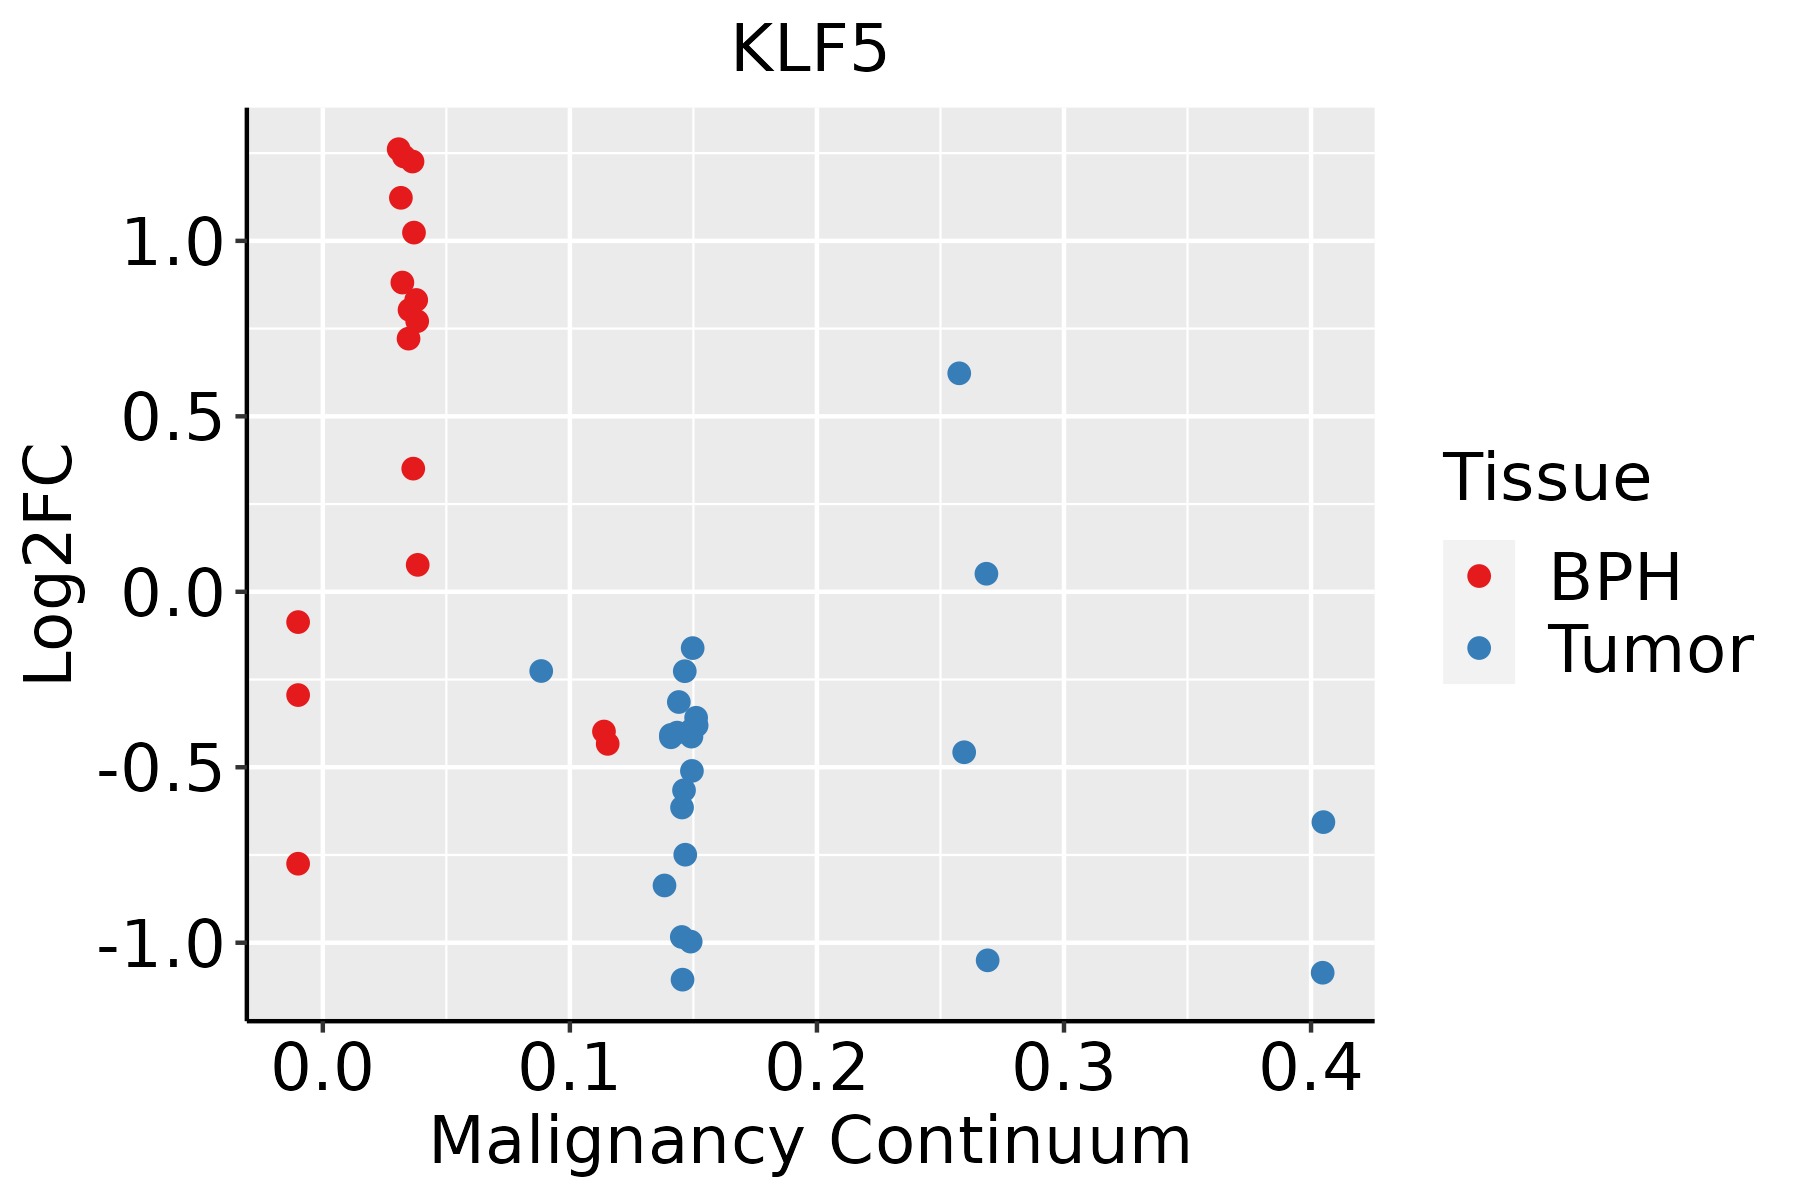 | BPH: Benign Prostatic Hyperplasia |
| Skin |  | AK: Actinic keratosis |
| cSCC: Cutaneous squamous cell carcinoma |
| SCCIS:squamous cell carcinoma in situ |
| Thyroid |  | ATC: Anaplastic thyroid cancer |
| HT: Hashimoto's thyroiditis |
| PTC: Papillary thyroid cancer |
| GO ID | Tissue | Disease Stage | Description | Gene Ratio | Bg Ratio | pvalue | p.adjust | Count |
| GO:00454445 | Cervix | CC | fat cell differentiation | 53/2311 | 229/18723 | 3.72e-06 | 9.75e-05 | 53 |
| GO:00616148 | Cervix | CC | pri-miRNA transcription by RNA polymerase II | 20/2311 | 55/18723 | 4.22e-06 | 1.09e-04 | 20 |
| GO:19028938 | Cervix | CC | regulation of pri-miRNA transcription by RNA polymerase II | 19/2311 | 54/18723 | 1.27e-05 | 2.60e-04 | 19 |
| GO:00310996 | Cervix | CC | regeneration | 46/2311 | 198/18723 | 1.43e-05 | 2.84e-04 | 46 |
| GO:19016538 | Cervix | CC | cellular response to peptide | 72/2311 | 359/18723 | 1.89e-05 | 3.48e-04 | 72 |
| GO:19028955 | Cervix | CC | positive regulation of pri-miRNA transcription by RNA polymerase II | 15/2311 | 42/18723 | 8.42e-05 | 1.13e-03 | 15 |
| GO:00605375 | Cervix | CC | muscle tissue development | 76/2311 | 403/18723 | 9.76e-05 | 1.27e-03 | 76 |
| GO:00147064 | Cervix | CC | striated muscle tissue development | 72/2311 | 384/18723 | 1.76e-04 | 2.07e-03 | 72 |
| GO:000206410 | Cervix | CC | epithelial cell development | 45/2311 | 220/18723 | 4.14e-04 | 4.21e-03 | 45 |
| GO:0045598 | Cervix | CC | regulation of fat cell differentiation | 31/2311 | 139/18723 | 7.06e-04 | 6.41e-03 | 31 |
| GO:00456004 | Cervix | CC | positive regulation of fat cell differentiation | 18/2311 | 66/18723 | 8.09e-04 | 7.07e-03 | 18 |
| GO:00426924 | Cervix | CC | muscle cell differentiation | 69/2311 | 384/18723 | 8.12e-04 | 7.09e-03 | 69 |
| GO:0042246 | Cervix | CC | tissue regeneration | 19/2311 | 72/18723 | 9.11e-04 | 7.81e-03 | 19 |
| GO:01200328 | Cervix | CC | regulation of plasma membrane bounded cell projection assembly | 38/2311 | 186/18723 | 1.14e-03 | 9.35e-03 | 38 |
| GO:00434032 | Cervix | CC | skeletal muscle tissue regeneration | 12/2311 | 37/18723 | 1.15e-03 | 9.39e-03 | 12 |
| GO:00604917 | Cervix | CC | regulation of cell projection assembly | 38/2311 | 188/18723 | 1.40e-03 | 1.10e-02 | 38 |
| GO:00300337 | Cervix | CC | microvillus assembly | 7/2311 | 16/18723 | 1.79e-03 | 1.34e-02 | 7 |
| GO:19908234 | Cervix | CC | response to leukemia inhibitory factor | 22/2311 | 95/18723 | 2.40e-03 | 1.70e-02 | 22 |
| GO:00075173 | Cervix | CC | muscle organ development | 58/2311 | 327/18723 | 2.73e-03 | 1.85e-02 | 58 |
| GO:19908304 | Cervix | CC | cellular response to leukemia inhibitory factor | 21/2311 | 94/18723 | 4.68e-03 | 2.82e-02 | 21 |
| TF | Cell Type | Tissue | Disease Stage | Target Gene | RSS | Regulon Activity |
| KLF5 | MES | Cervix | CC | ZFP36L1,CTNND1,MPZL2, etc. | 7.07e-01 |  |
| KLF5 | KER | Esophagus | Healthy | CLDN1,FAM46A,VIM, etc. | 2.01e-01 |  |
| KLF5 | STM | Esophagus | Healthy | CLDN1,FAM46A,VIM, etc. | 4.45e-01 | |
| KLF5 | DUCT1 | Pancreas | PDAC | LMO7,TM9SF3,CYP3A5, etc. | 6.34e-01 |  |
| KLF5 | CD8TRM | Pancreas | ADJ | MOB3A,FAM160A1,IL3RA, etc. | 0.00e+00 |  |
| KLF5 | CD8TEREX | Pancreas | ADJ | MOB3A,FAM160A1,IL3RA, etc. | 5.23e-03 | |
| KLF5 | CD8TCM | Pancreas | ADJ | MOB3A,FAM160A1,IL3RA, etc. | 2.22e-16 | |
| KLF5 | TREG | Pancreas | ADJ | MOB3A,FAM160A1,IL3RA, etc. | 2.22e-16 | |
| KLF5 | CD8TEREX | Pancreas | Healthy | MOB3A,FAM160A1,IL3RA, etc. | 0.00e+00 |  |
| KLF5 | TREG | Pancreas | Healthy | MOB3A,FAM160A1,IL3RA, etc. | 0.00e+00 | |
| Hugo Symbol | Variant Class | Variant Classification | dbSNP RS | HGVSc | HGVSp | HGVSp Short | SWISSPROT | BIOTYPE | SIFT | PolyPhen | Tumor Sample Barcode | Tissue | Histology | Sex | Age | Stage | Therapy Types | Drugs | Outcome |
| KLF5 | deletion | Frame_Shift_Del | novel | c.280delN | p.Lys94SerfsTer3 | p.K94Sfs*3 | Q13887 | protein_coding | | | TCGA-EW-A2FV-01 | Breast | breast invasive carcinoma | Female | <65 | III/IV | Chemotherapy | docetaxel | SD |
| KLF5 | SNV | Missense_Mutation | | c.1255G>A | p.Glu419Lys | p.E419K | Q13887 | protein_coding | deleterious(0) | probably_damaging(0.998) | TCGA-EK-A2R8-01 | Cervix | cervical & endocervical cancer | Female | <65 | I/II | Unknown | Unknown | SD |
| KLF5 | SNV | Missense_Mutation | | c.604N>A | p.Glu202Lys | p.E202K | Q13887 | protein_coding | tolerated(0.78) | benign(0) | TCGA-IR-A3LK-01 | Cervix | cervical & endocervical cancer | Female | >=65 | I/II | Chemotherapy | cisplatin | PD |
| KLF5 | SNV | Missense_Mutation | | c.1255N>A | p.Glu419Lys | p.E419K | Q13887 | protein_coding | deleterious(0) | probably_damaging(0.998) | TCGA-IR-A3LK-01 | Cervix | cervical & endocervical cancer | Female | >=65 | I/II | Chemotherapy | cisplatin | PD |
| KLF5 | SNV | Missense_Mutation | | c.341G>T | p.Arg114Leu | p.R114L | Q13887 | protein_coding | deleterious(0) | probably_damaging(0.997) | TCGA-IR-A3LL-01 | Cervix | cervical & endocervical cancer | Female | <65 | I/II | Chemotherapy | cisplatin | CR |
| KLF5 | SNV | Missense_Mutation | | c.1255N>A | p.Glu419Lys | p.E419K | Q13887 | protein_coding | deleterious(0) | probably_damaging(0.998) | TCGA-VS-A958-01 | Cervix | cervical & endocervical cancer | Female | <65 | I/II | Chemotherapy | cisplatin | CR |
| KLF5 | SNV | Missense_Mutation | | c.1255N>A | p.Glu419Lys | p.E419K | Q13887 | protein_coding | deleterious(0) | probably_damaging(0.998) | TCGA-VS-A959-01 | Cervix | cervical & endocervical cancer | Female | >=65 | I/II | Unknown | Unknown | SD |
| KLF5 | SNV | Missense_Mutation | novel | c.1256N>G | p.Glu419Gly | p.E419G | Q13887 | protein_coding | deleterious(0) | probably_damaging(0.999) | TCGA-VS-A959-01 | Cervix | cervical & endocervical cancer | Female | >=65 | I/II | Unknown | Unknown | SD |
| KLF5 | SNV | Missense_Mutation | | c.1255N>A | p.Glu419Lys | p.E419K | Q13887 | protein_coding | deleterious(0) | probably_damaging(0.998) | TCGA-VS-A9UC-01 | Cervix | cervical & endocervical cancer | Female | <65 | I/II | Chemotherapy | cisplatin | SD |
| KLF5 | deletion | Frame_Shift_Del | novel | c.282_288delGTATCTG | p.Tyr95HisfsTer9 | p.Y95Hfs*9 | Q13887 | protein_coding | | | TCGA-JW-A5VK-01 | Cervix | cervical & endocervical cancer | Female | <65 | I/II | Unknown | Unknown | SD |


