
|
|||||
|
 | |
| |
| |
| |
| |
| |
|
Gene: ITM2B |
Gene summary for ITM2B |
| Gene information | Species | Human | Gene symbol | ITM2B | Gene ID | 9445 |
| Gene name | integral membrane protein 2B | |
| Gene Alias | ABRI | |
| Cytomap | 13q14.2 | |
| Gene Type | protein-coding | GO ID | GO:0006807 | UniProtAcc | Q9Y287 |
Top |
Malignant transformation analysis |
| Identification of the aberrant gene expression in precancerous and cancerous lesions by comparing the gene expression of stem-like cells in diseased tissues with normal stem cells |
| Entrez ID | Symbol | Replicates | Species | Organ | Tissue | Adj P-value | Log2FC | Malignancy |
| 9445 | ITM2B | Dong_P1 | Human | Prostate | Tumor | 6.20e-41 | -3.24e-01 | 0.035 |
| 9445 | ITM2B | Dong_P5 | Human | Prostate | Tumor | 1.00e-48 | -6.51e-01 | 0.053 |
| 9445 | ITM2B | P7 | Human | Prostate | Tumor | 5.37e-32 | 1.47e+00 | -0.1025 |
| 9445 | ITM2B | P10 | Human | Prostate | Tumor | 5.52e-16 | 1.11e+00 | -0.0902 |
| 9445 | ITM2B | GSM5353227_PA_PR5199-193K_Pool_1_2_3_S55_L002 | Human | Prostate | Tumor | 3.67e-02 | 5.44e-02 | 0.1602 |
| 9445 | ITM2B | GSM5353232_PA_PR5249_T1_S3_L001 | Human | Prostate | Tumor | 5.75e-07 | -4.33e-01 | 0.1439 |
| 9445 | ITM2B | GSM5353236_PA_PR5251_T1_S7_L001 | Human | Prostate | Tumor | 6.11e-03 | 2.17e-01 | 0.1608 |
| 9445 | ITM2B | GSM5353240_PA_PR5254_T1_S15_L001 | Human | Prostate | Tumor | 2.69e-02 | -1.67e-01 | 0.1575 |
| 9445 | ITM2B | GSM5353243_PA_PR5261_T1_S23_L002 | Human | Prostate | Tumor | 1.37e-20 | -2.93e-01 | 0.1545 |
| 9445 | ITM2B | GSM5353244_PA_PR5261_T2_S24_L002 | Human | Prostate | Tumor | 6.95e-10 | -1.92e-01 | 0.1569 |
| 9445 | ITM2B | P1_S1_AK | Human | Skin | AK | 1.78e-14 | -3.63e-01 | -0.3399 |
| 9445 | ITM2B | P2_S3_AK | Human | Skin | AK | 6.90e-13 | -3.06e-01 | -0.3287 |
| 9445 | ITM2B | P2_S4_SCCIS | Human | Skin | SCCIS | 1.04e-03 | -2.17e-01 | -0.3043 |
| 9445 | ITM2B | P4_S8_cSCC | Human | Skin | cSCC | 5.23e-10 | -3.17e-02 | -0.3095 |
| 9445 | ITM2B | P5_S10_cSCC | Human | Skin | cSCC | 3.02e-07 | 8.12e-02 | -0.299 |
| 9445 | ITM2B | P1_cSCC | Human | Skin | cSCC | 3.55e-81 | 3.05e+00 | 0.0292 |
| 9445 | ITM2B | P2_cSCC | Human | Skin | cSCC | 4.24e-56 | 1.97e+00 | -0.024 |
| 9445 | ITM2B | P4_cSCC | Human | Skin | cSCC | 1.21e-76 | 2.49e+00 | -0.00290000000000005 |
| 9445 | ITM2B | P10_cSCC | Human | Skin | cSCC | 3.31e-63 | 2.70e+00 | 0.1017 |
| 9445 | ITM2B | cSCC_p10 | Human | Skin | cSCC | 3.28e-02 | 2.01e-01 | -0.2095 |
| Page: 1 2 3 4 5 6 7 8 9 10 11 12 13 14 15 16 |
| Tissue | Expression Dynamics | Abbreviation |
| Breast | 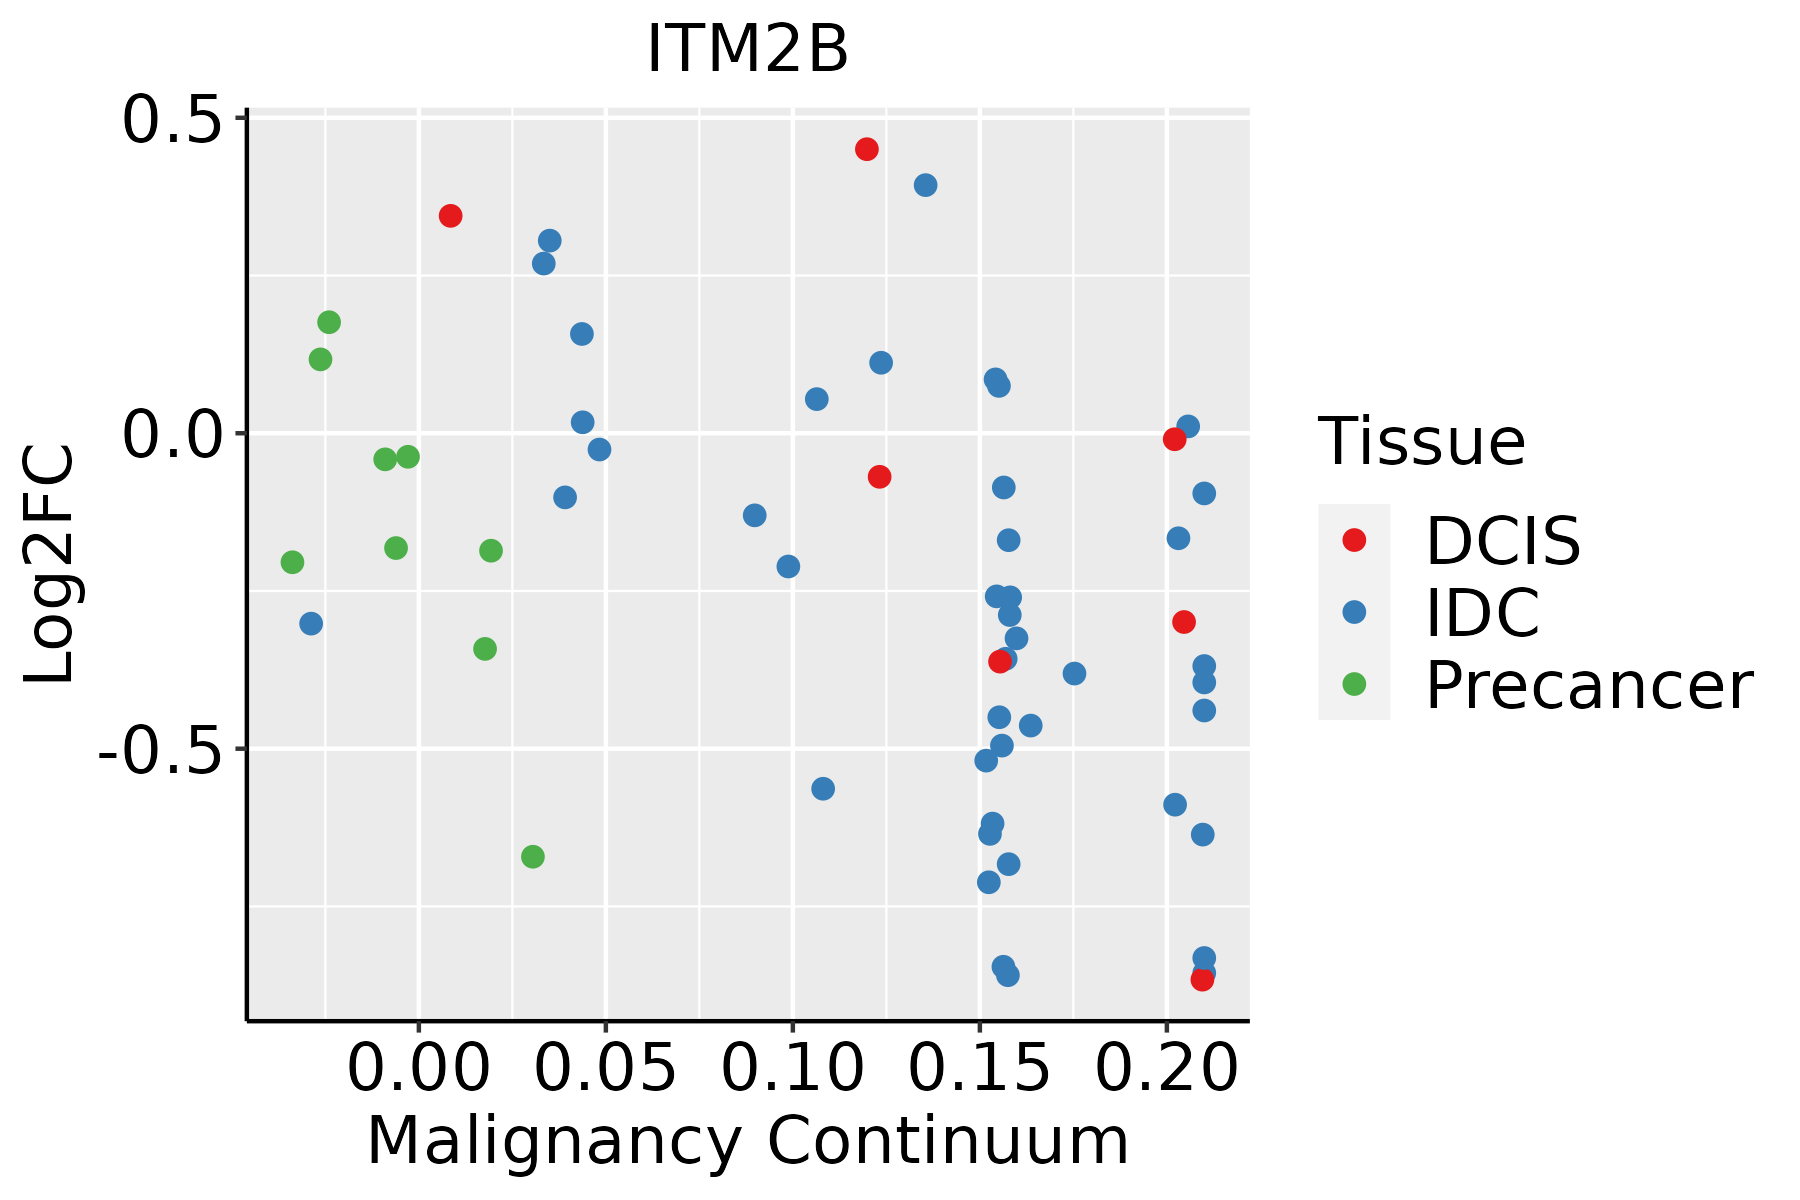 | IDC: Invasive ductal carcinoma |
| DCIS: Ductal carcinoma in situ | ||
| Precancer(BRCA1-mut): Precancerous lesion from BRCA1 mutation carriers | ||
| Cervix | 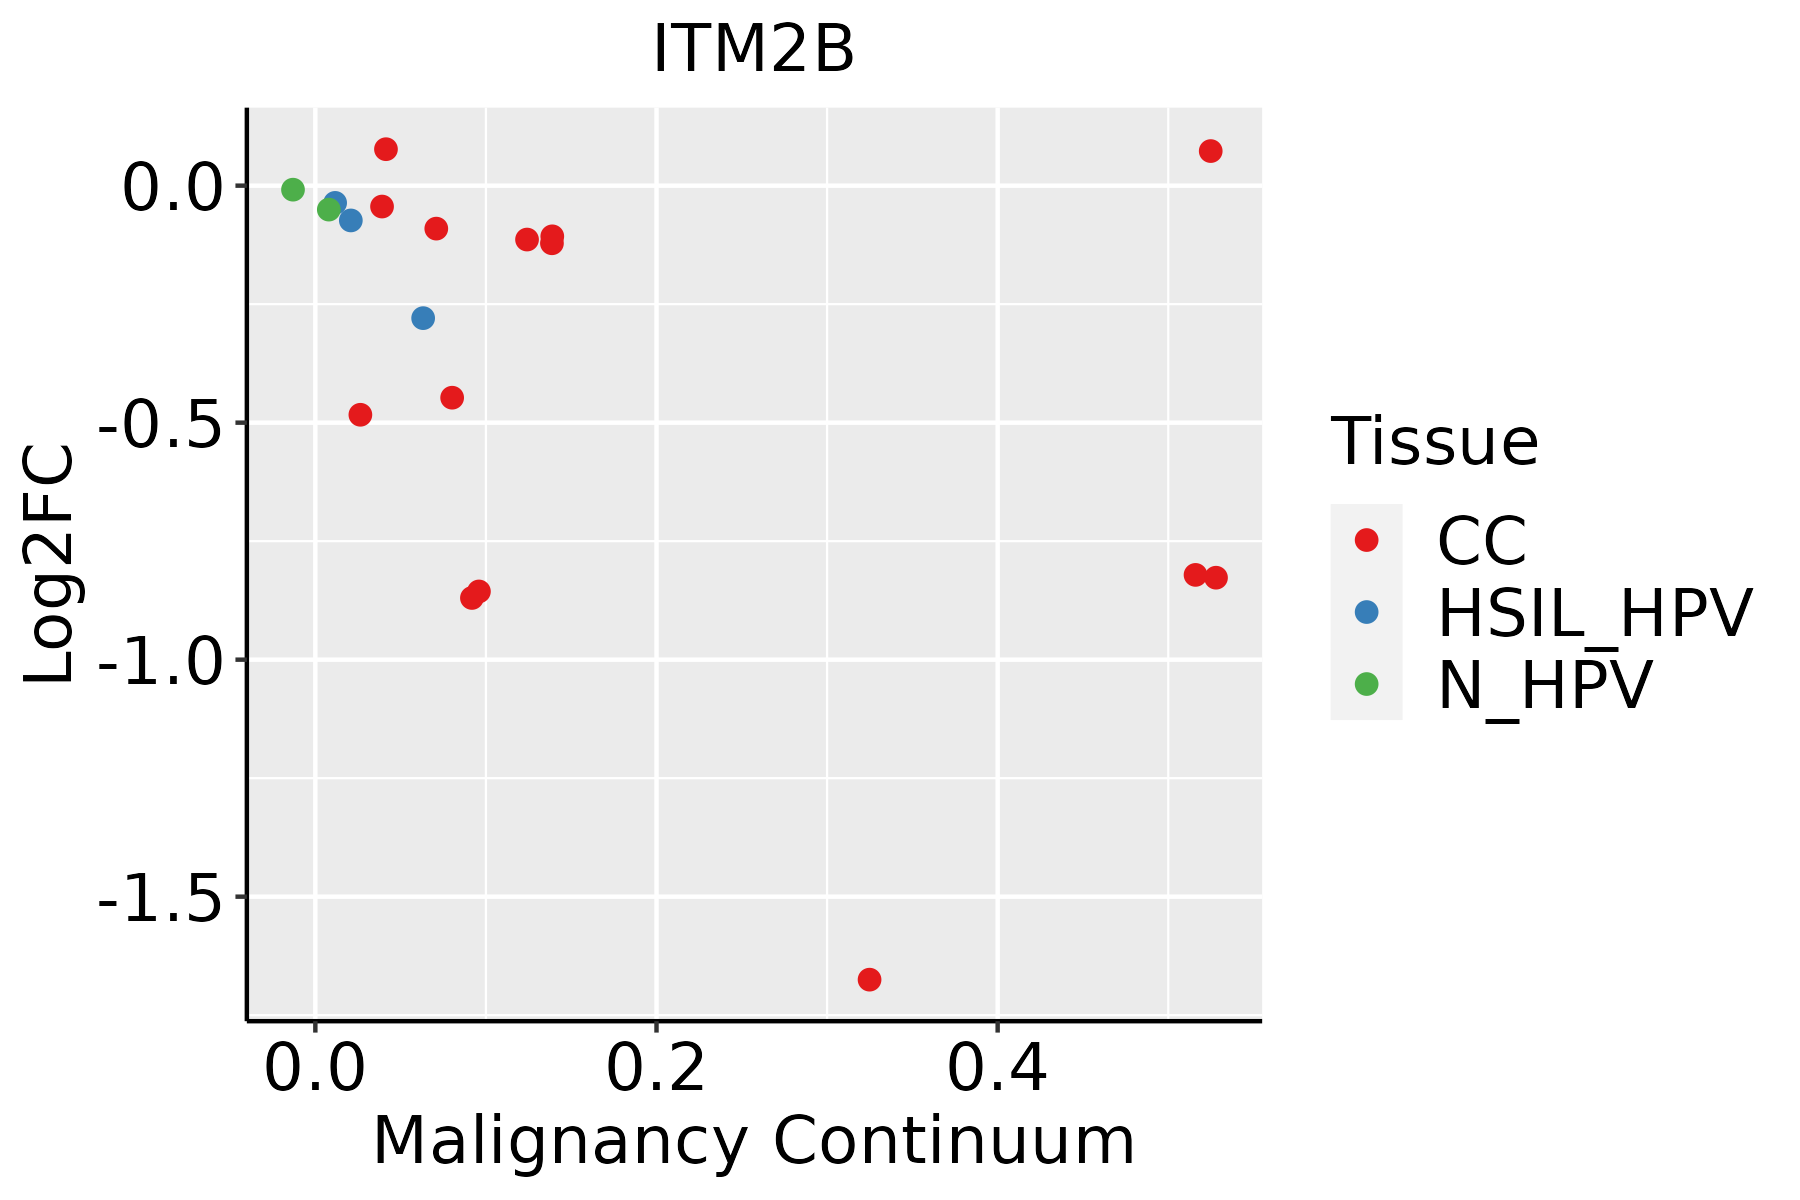 | CC: Cervix cancer |
| HSIL_HPV: HPV-infected high-grade squamous intraepithelial lesions | ||
| N_HPV: HPV-infected normal cervix | ||
| Colorectum (GSE201348) | 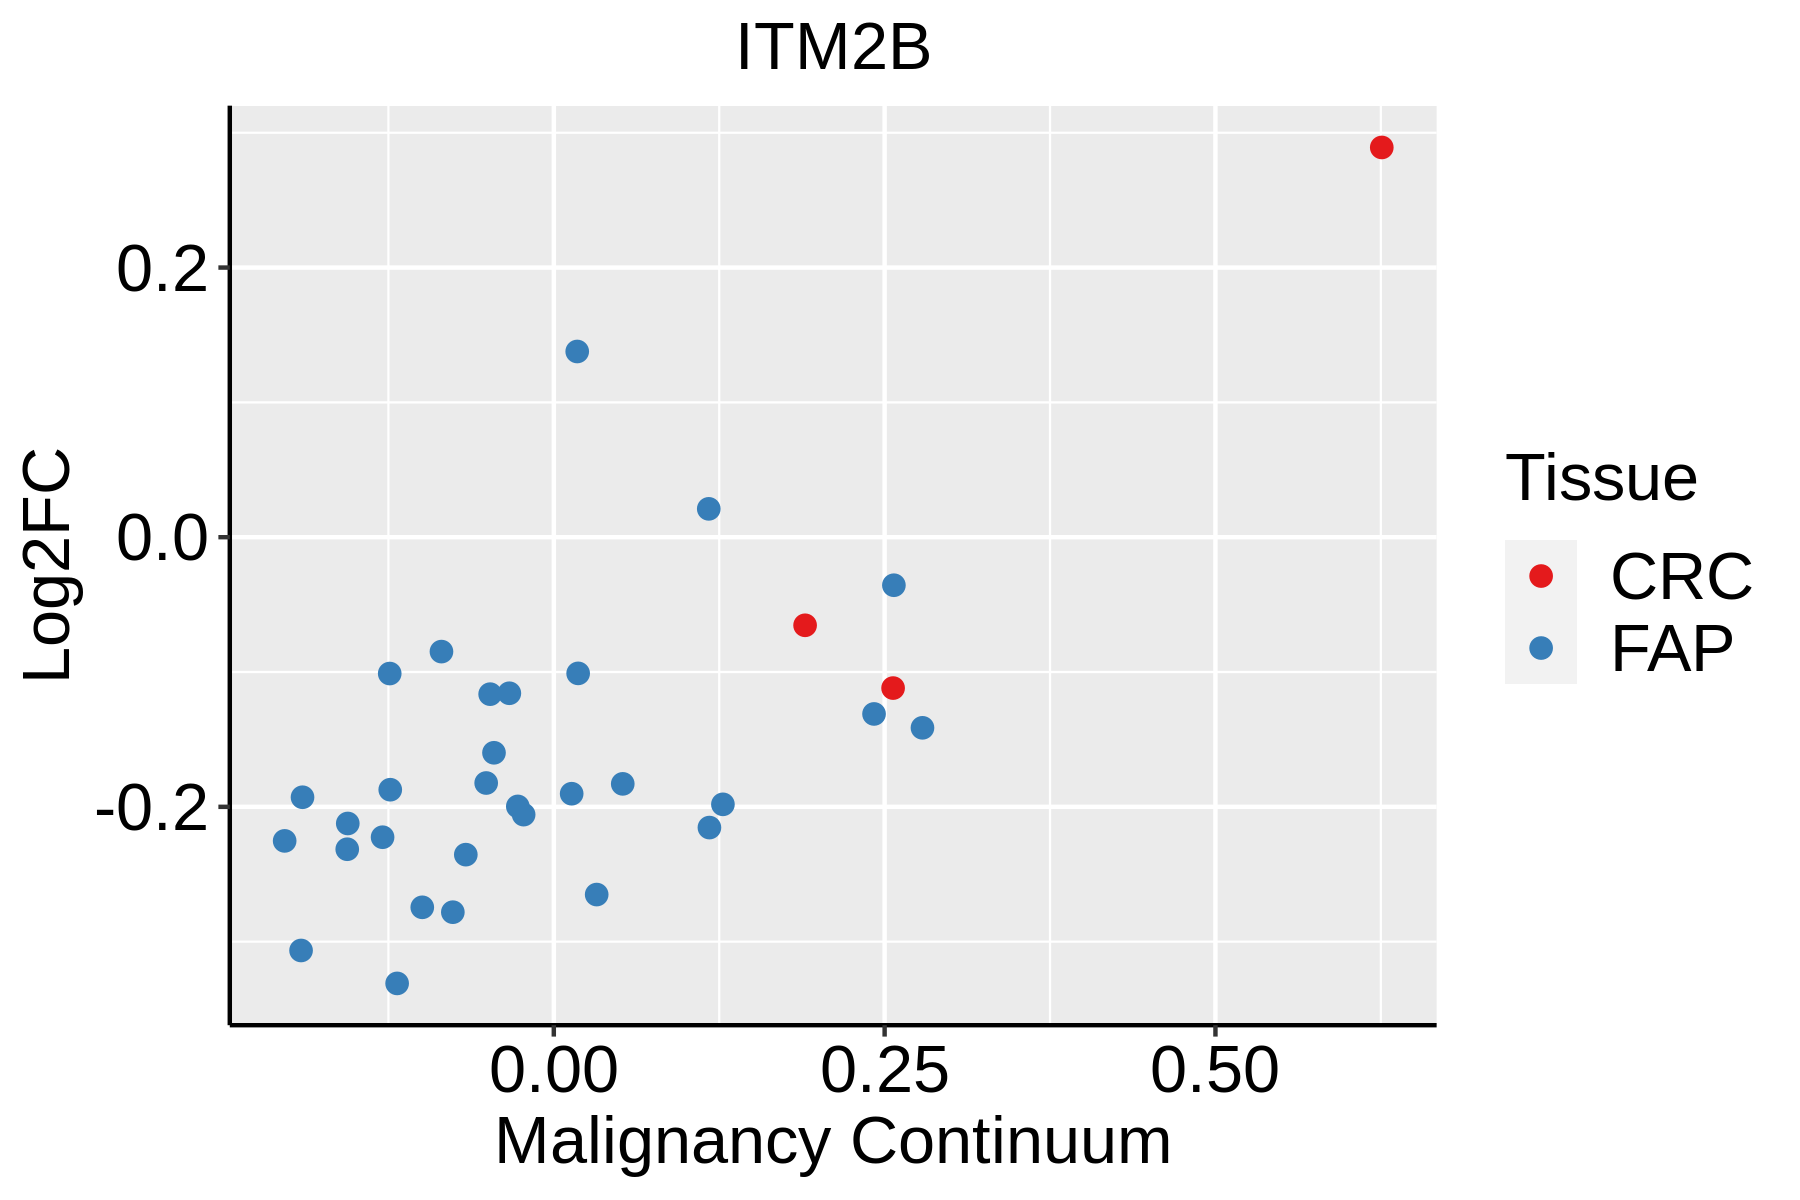 | FAP: Familial adenomatous polyposis |
| CRC: Colorectal cancer | ||
| Colorectum (HTA11) | 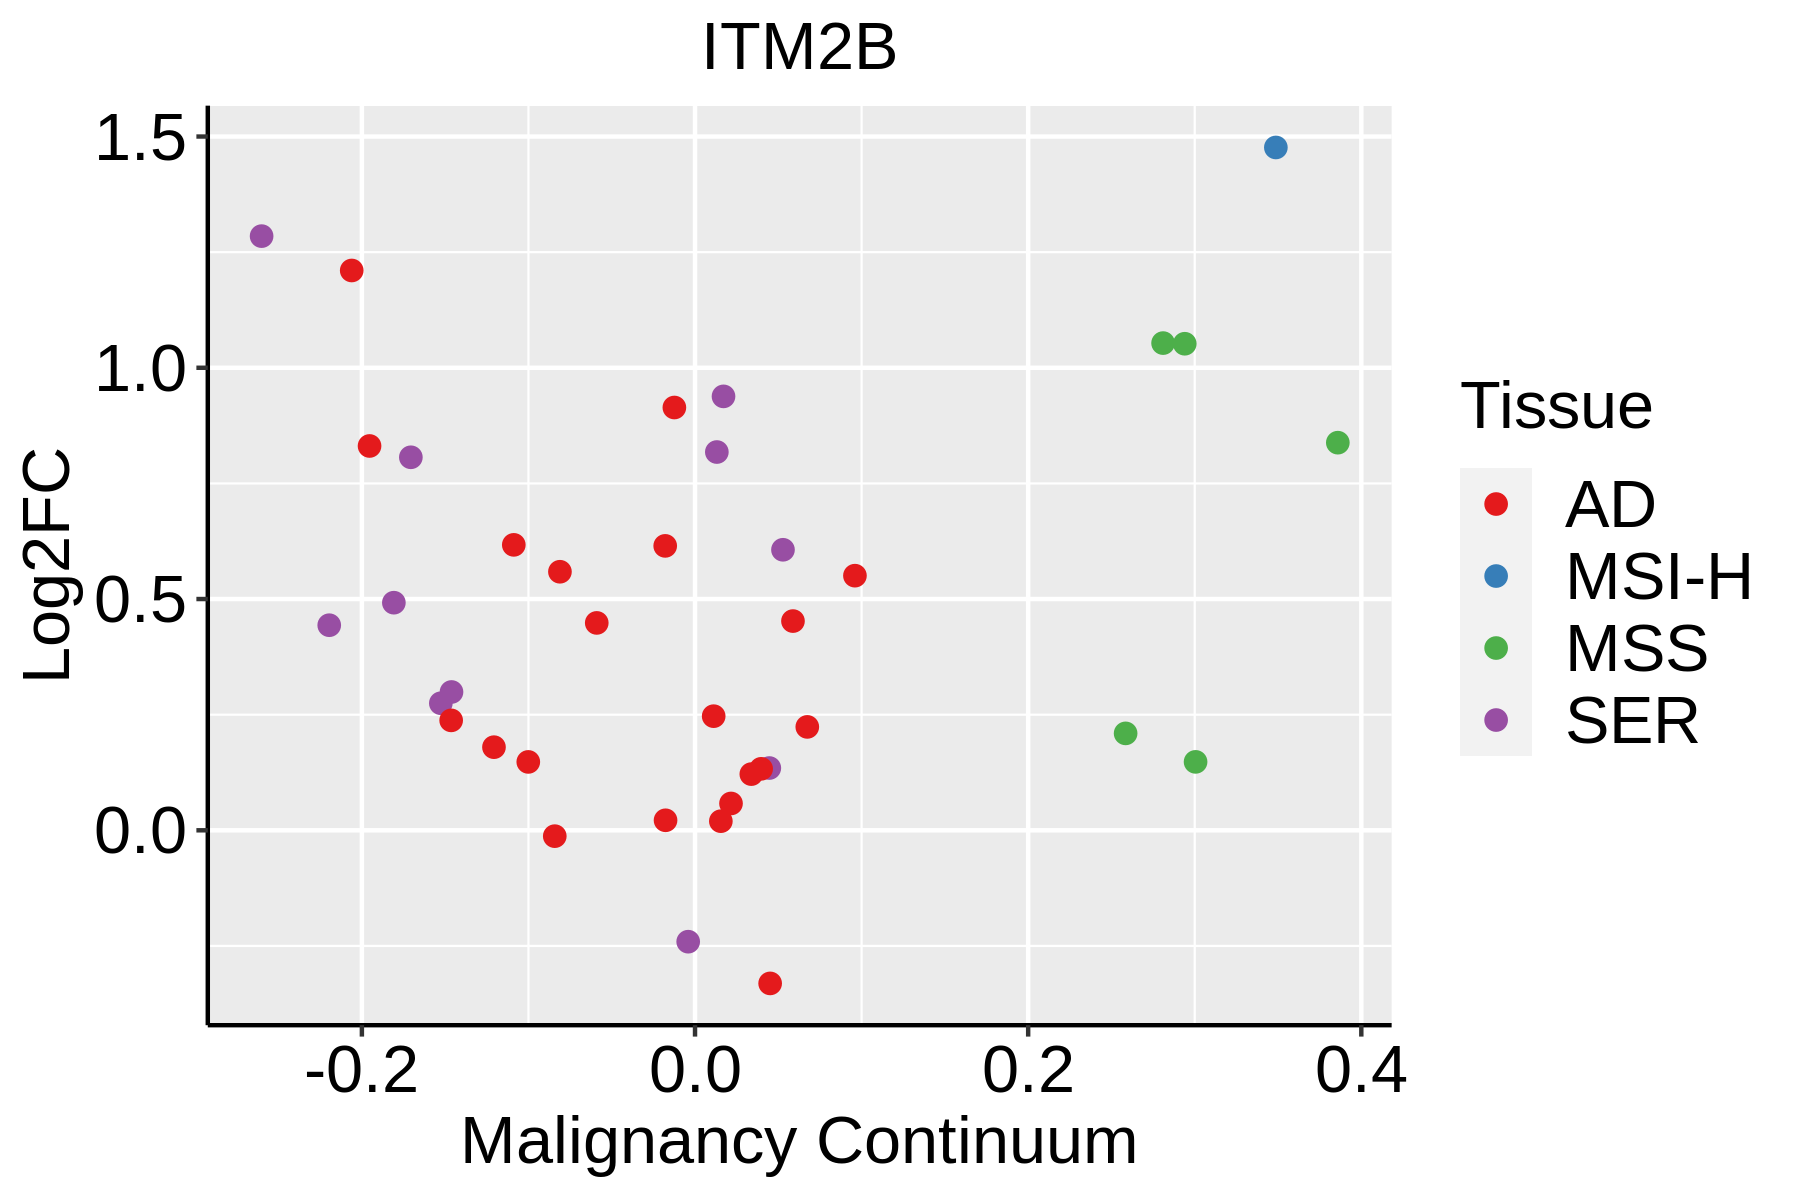 | AD: Adenomas |
| SER: Sessile serrated lesions | ||
| MSI-H: Microsatellite-high colorectal cancer | ||
| MSS: Microsatellite stable colorectal cancer | ||
| Endometrium | 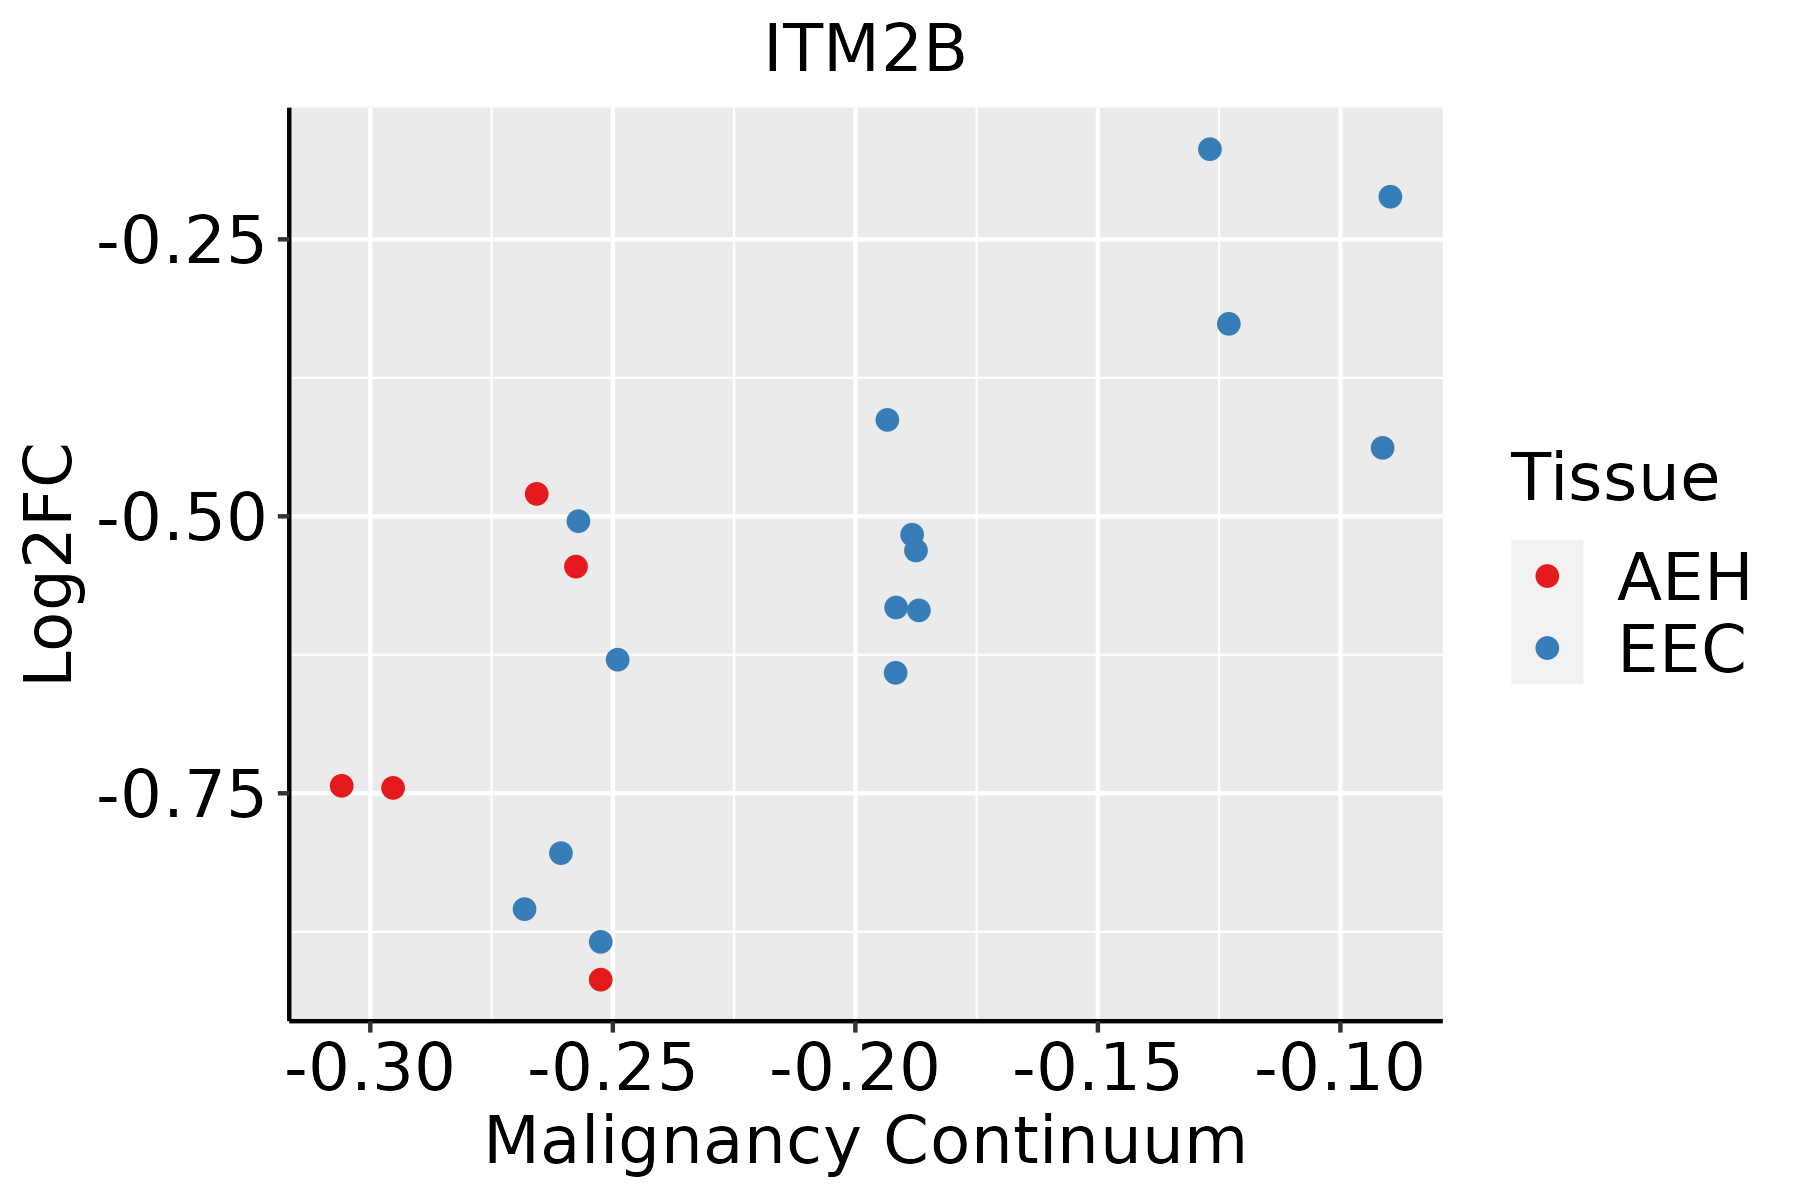 | AEH: Atypical endometrial hyperplasia |
| EEC: Endometrioid Cancer | ||
| Esophagus | 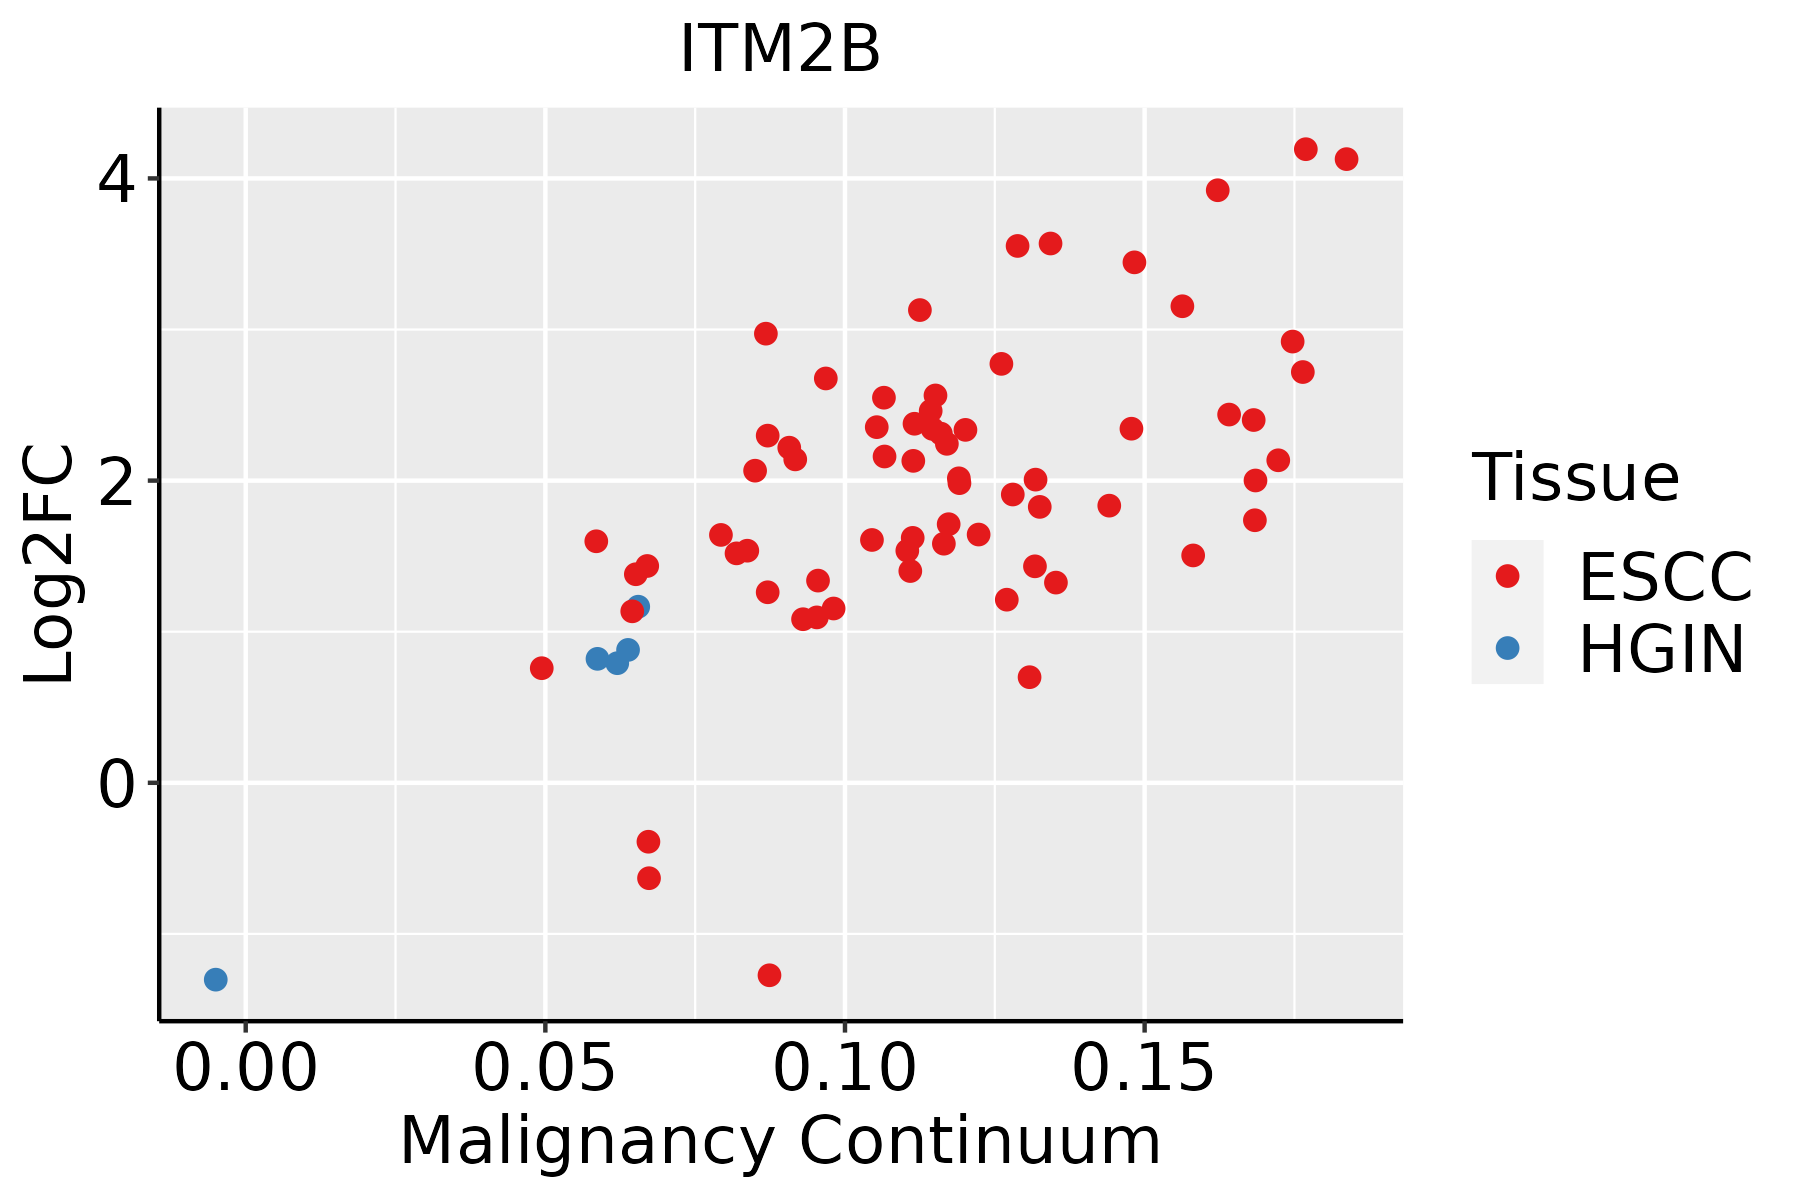 | ESCC: Esophageal squamous cell carcinoma |
| HGIN: High-grade intraepithelial neoplasias | ||
| LGIN: Low-grade intraepithelial neoplasias | ||
| Liver | 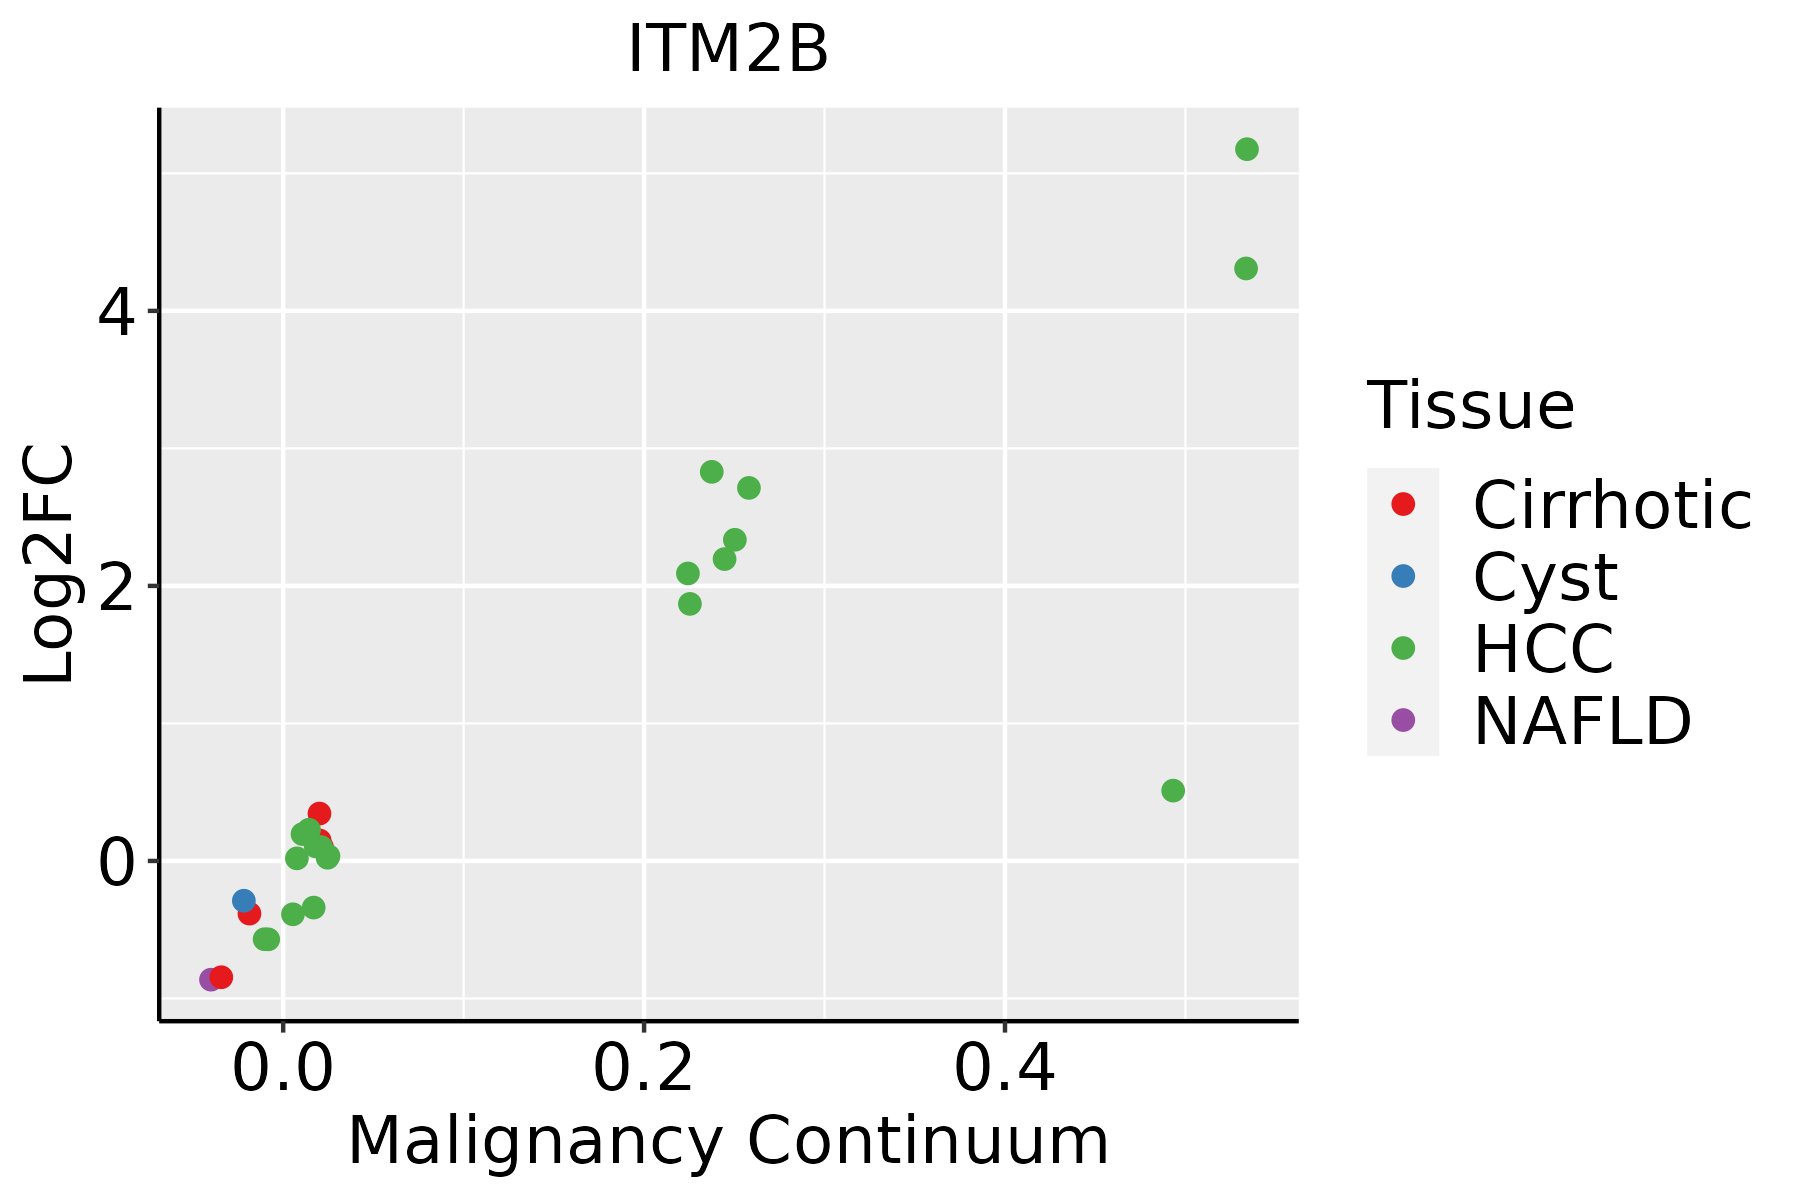 | HCC: Hepatocellular carcinoma |
| NAFLD: Non-alcoholic fatty liver disease | ||
| Lung | 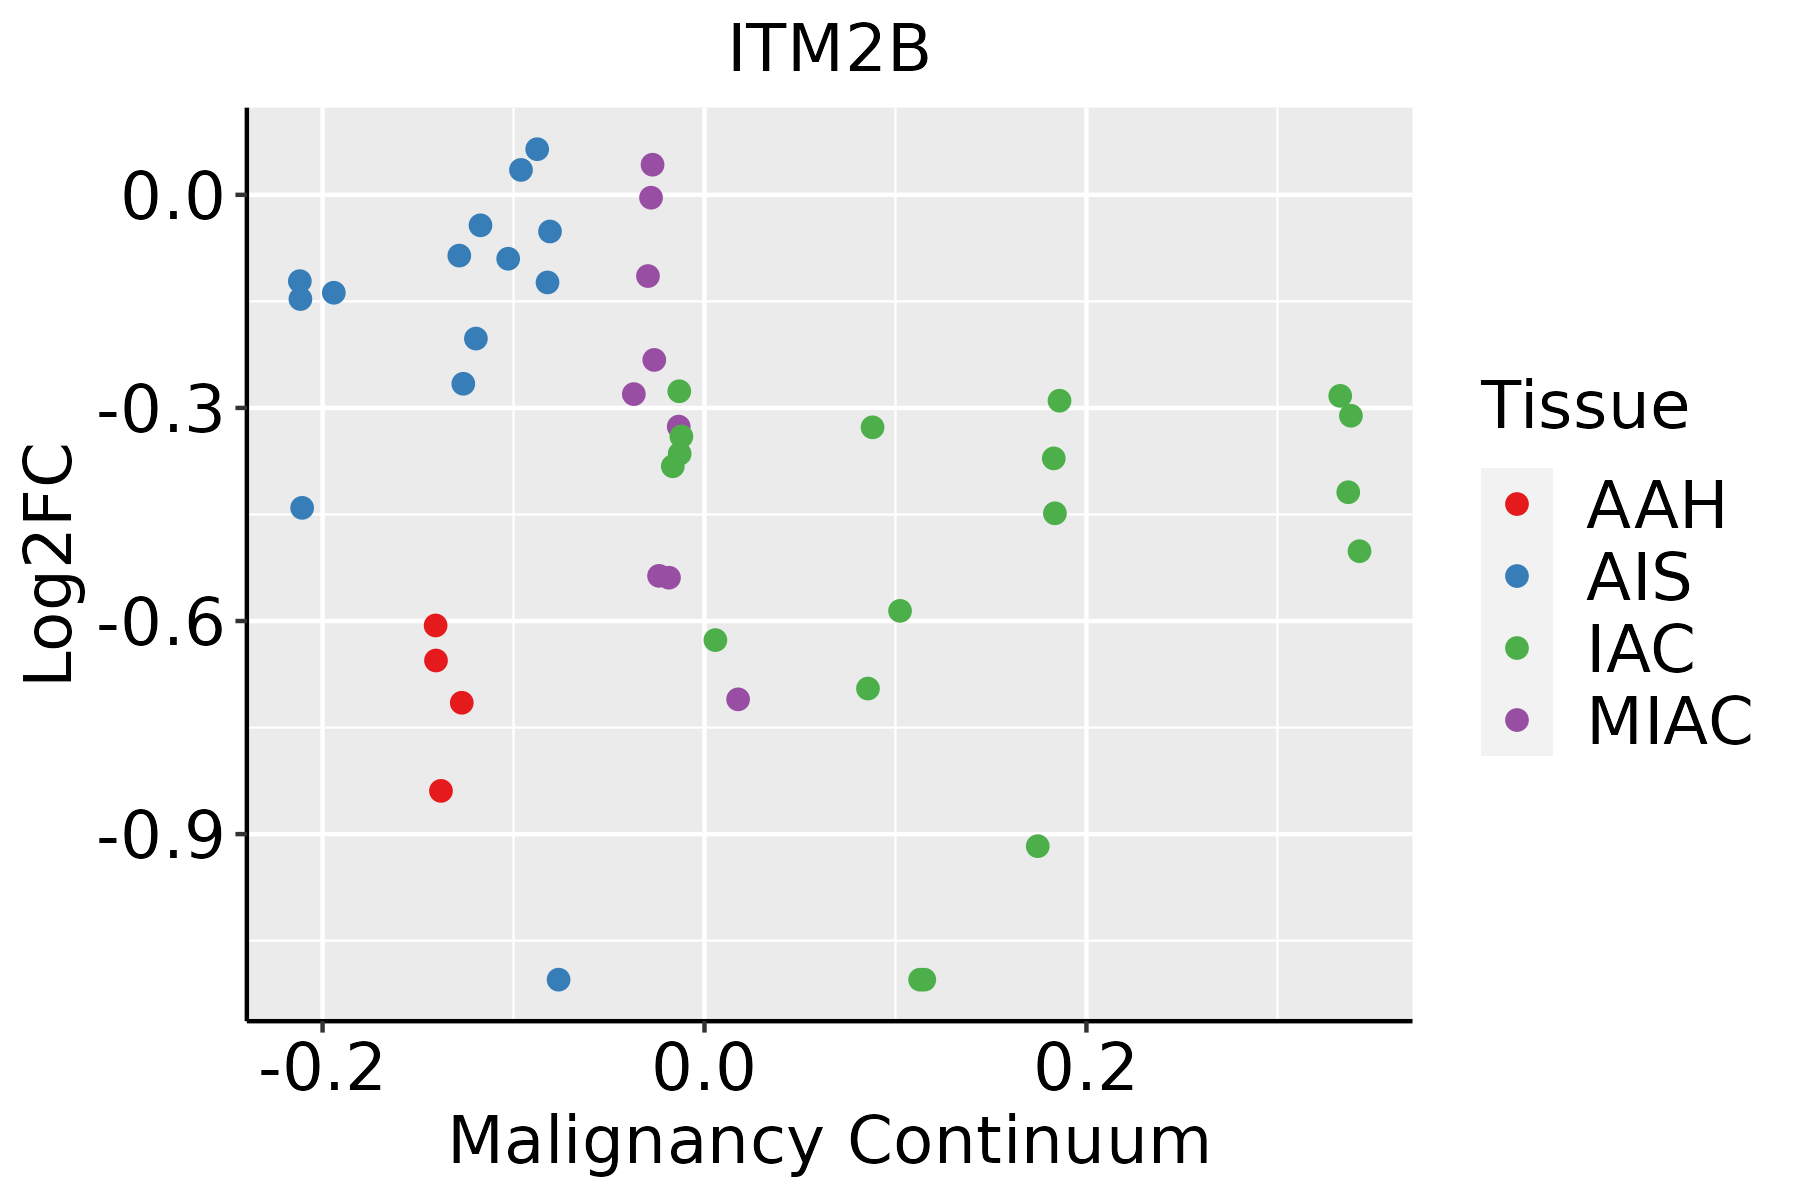 | AAH: Atypical adenomatous hyperplasia |
| AIS: Adenocarcinoma in situ | ||
| IAC: Invasive lung adenocarcinoma | ||
| MIA: Minimally invasive adenocarcinoma | ||
| Oral Cavity | 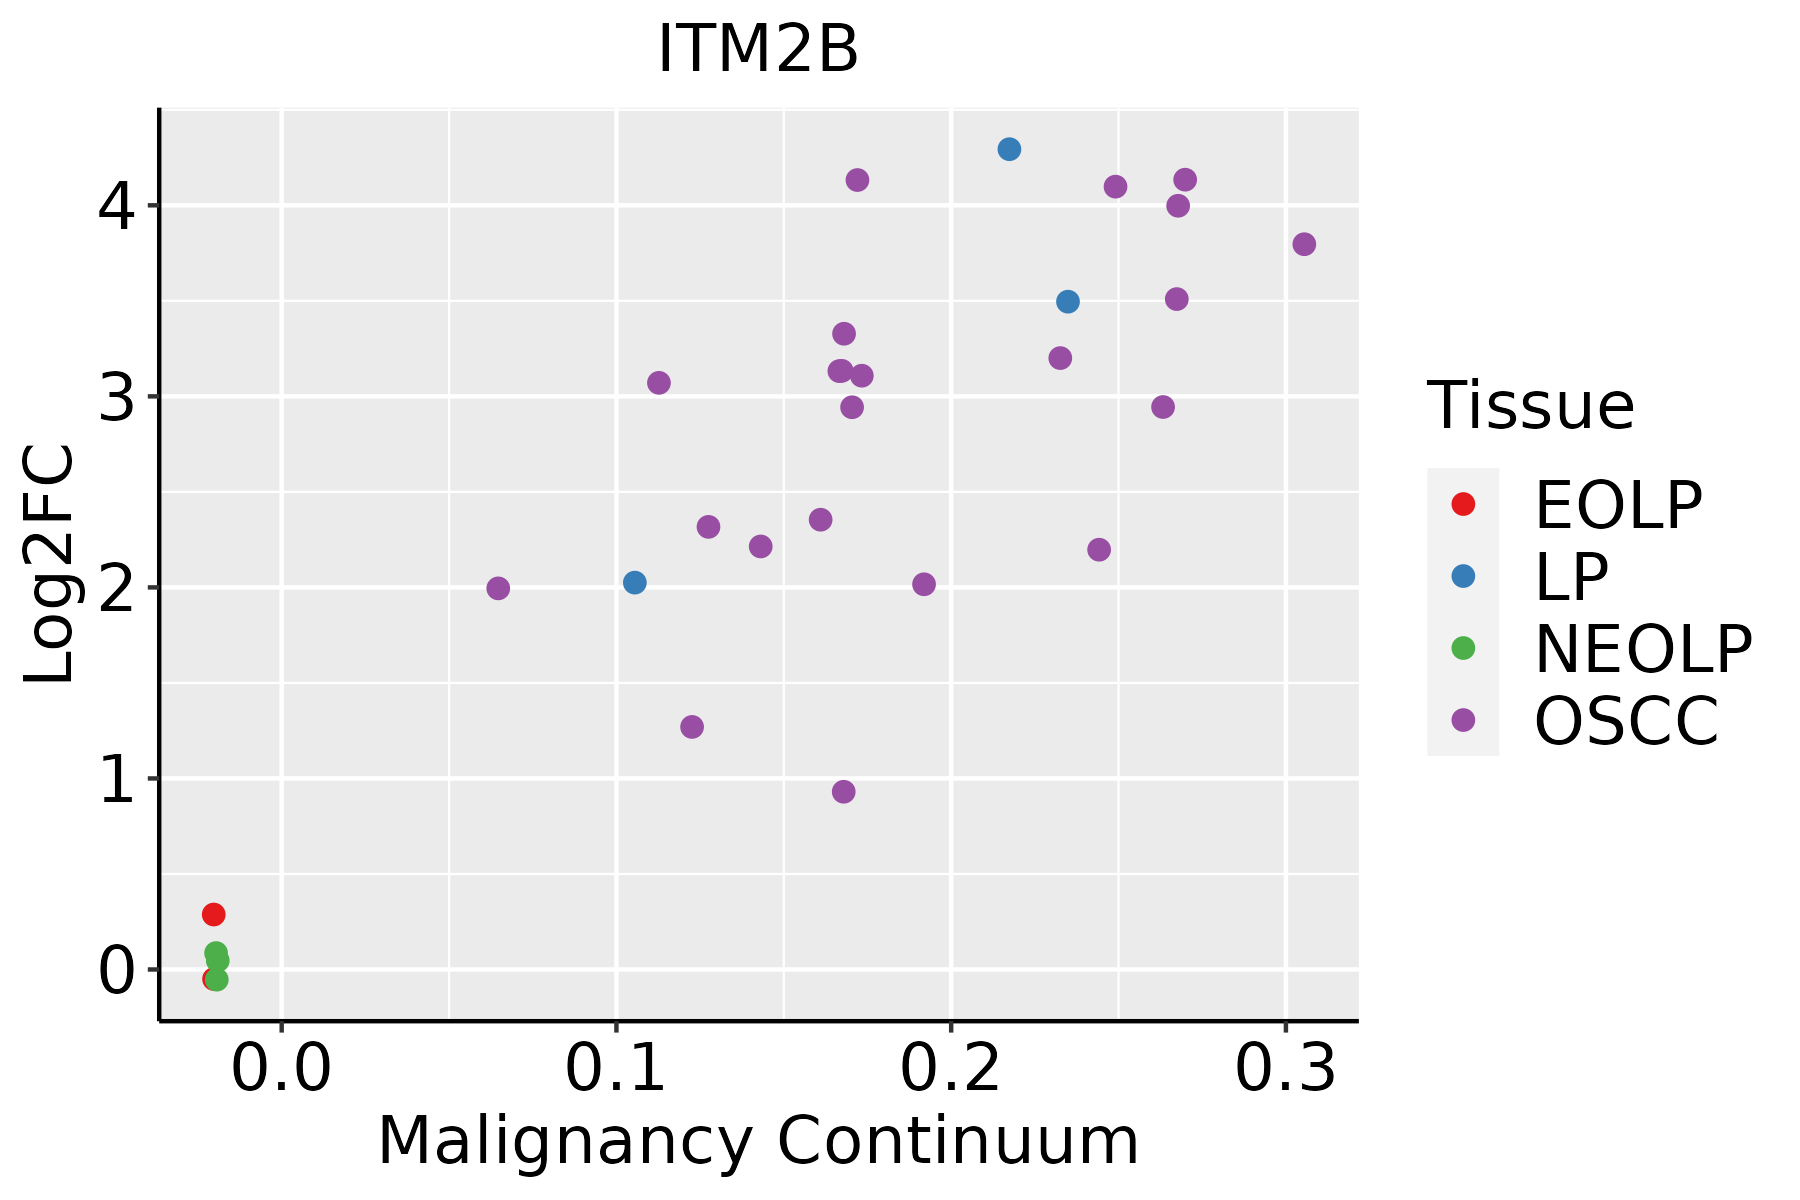 | EOLP: Erosive Oral lichen planus |
| LP: leukoplakia | ||
| NEOLP: Non-erosive oral lichen planus | ||
| OSCC: Oral squamous cell carcinoma | ||
| Prostate | 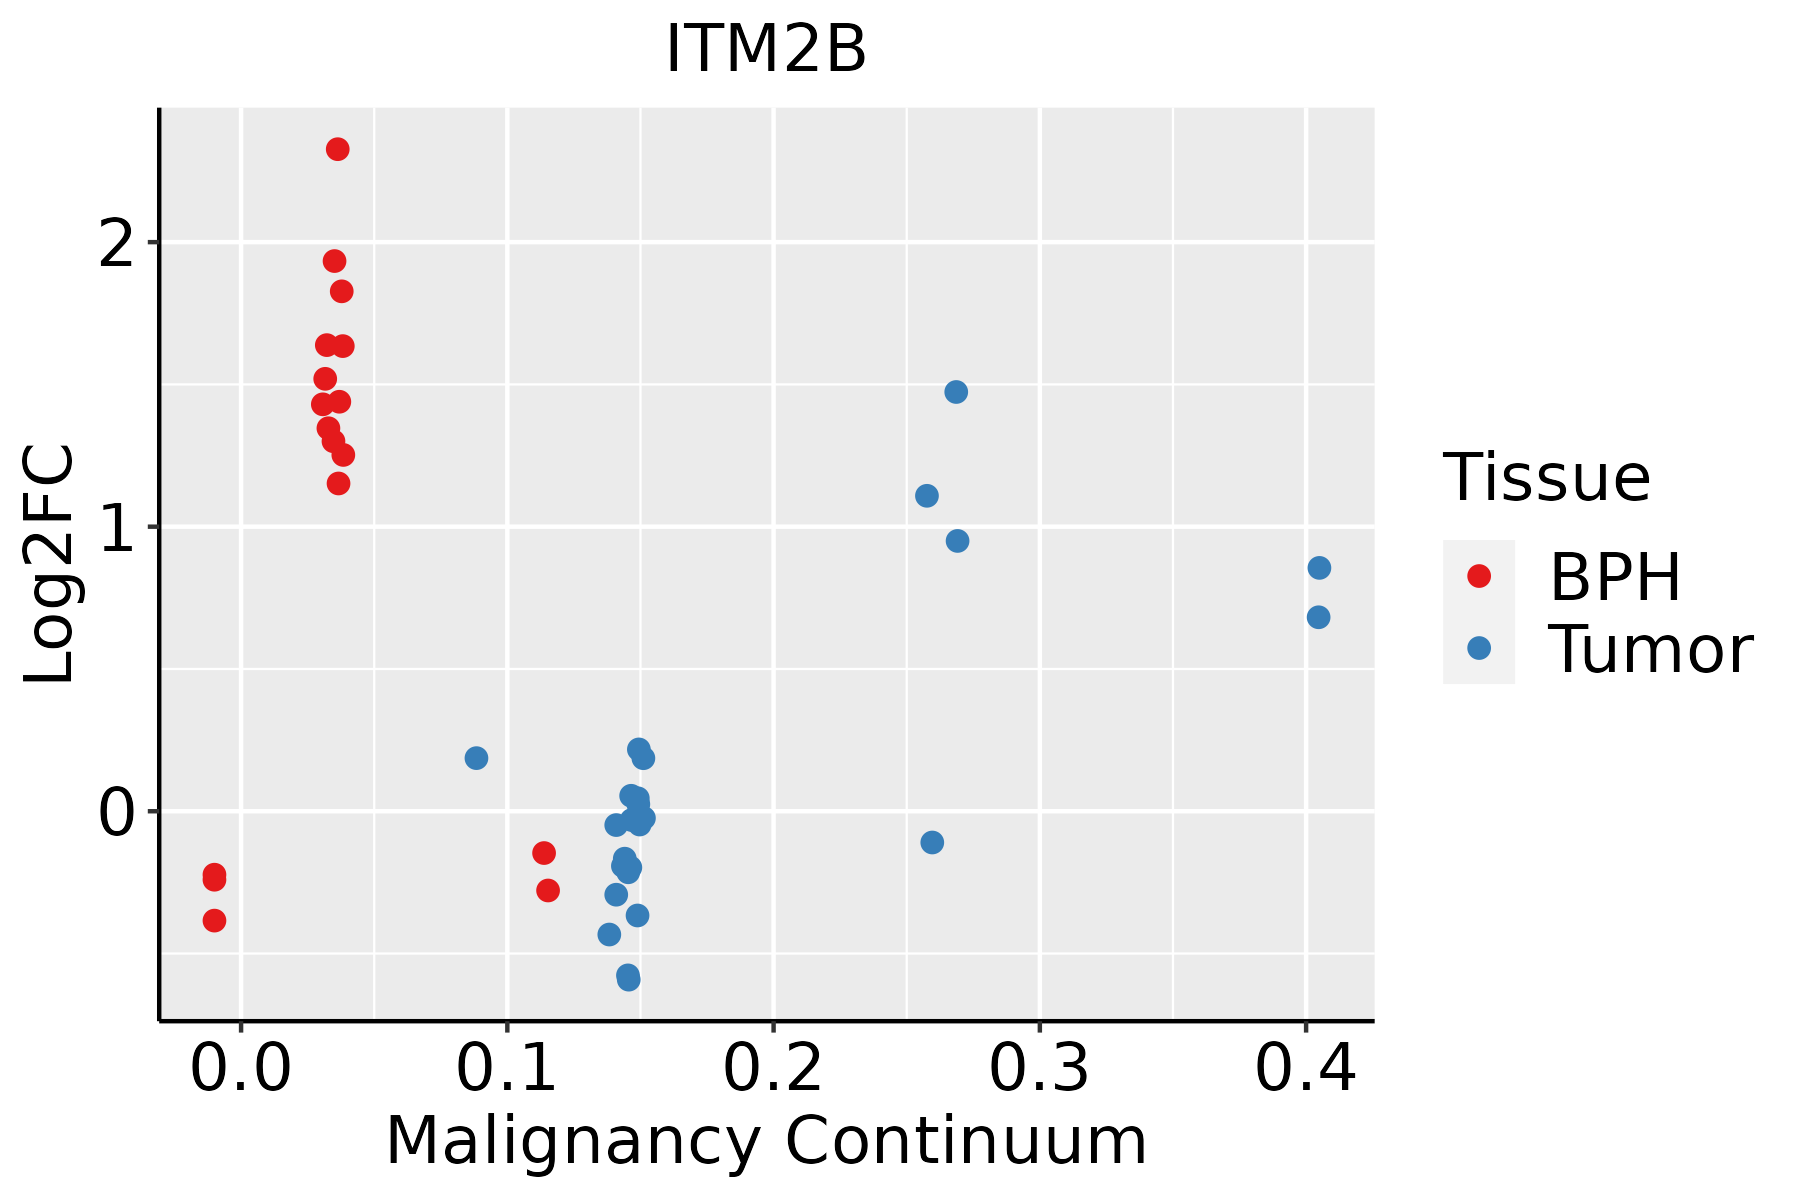 | BPH: Benign Prostatic Hyperplasia |
| Skin | 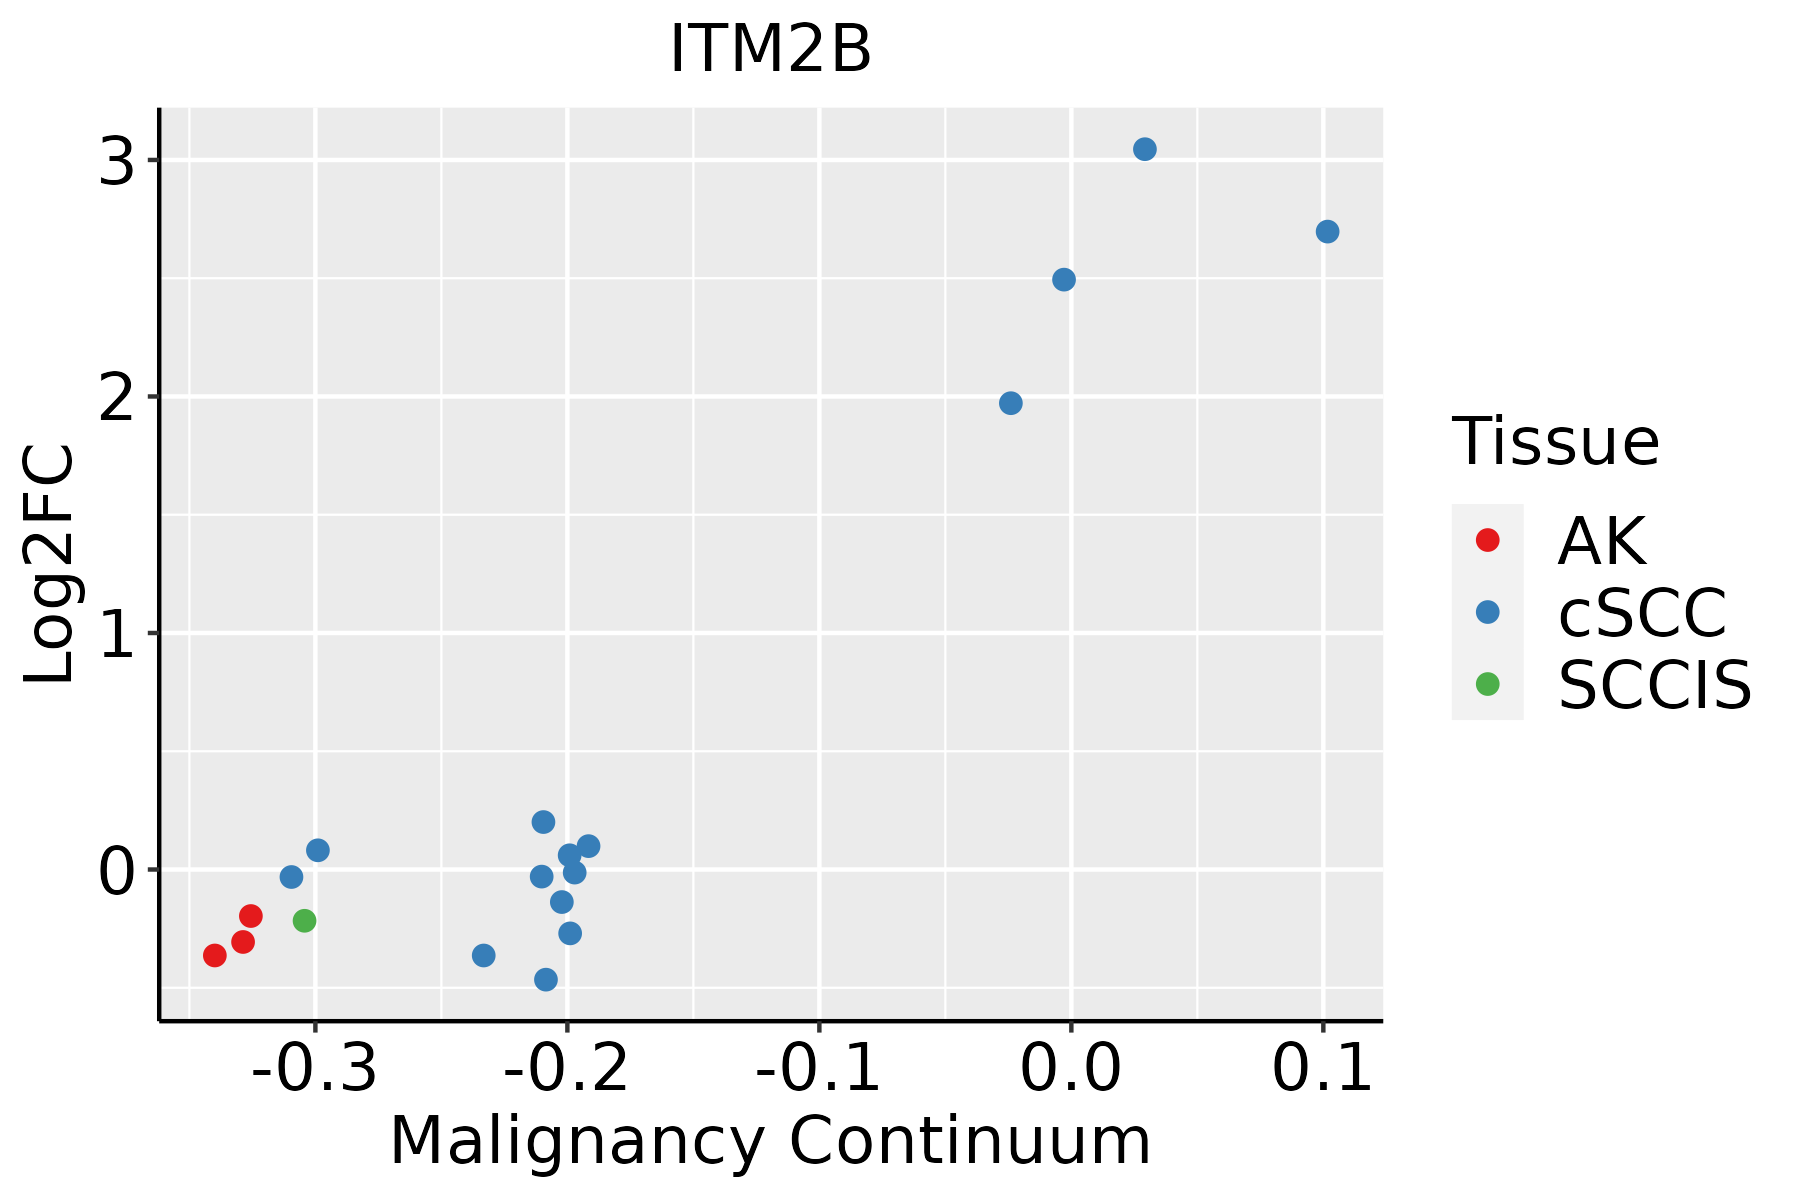 | AK: Actinic keratosis |
| cSCC: Cutaneous squamous cell carcinoma | ||
| SCCIS:squamous cell carcinoma in situ | ||
| Thyroid | 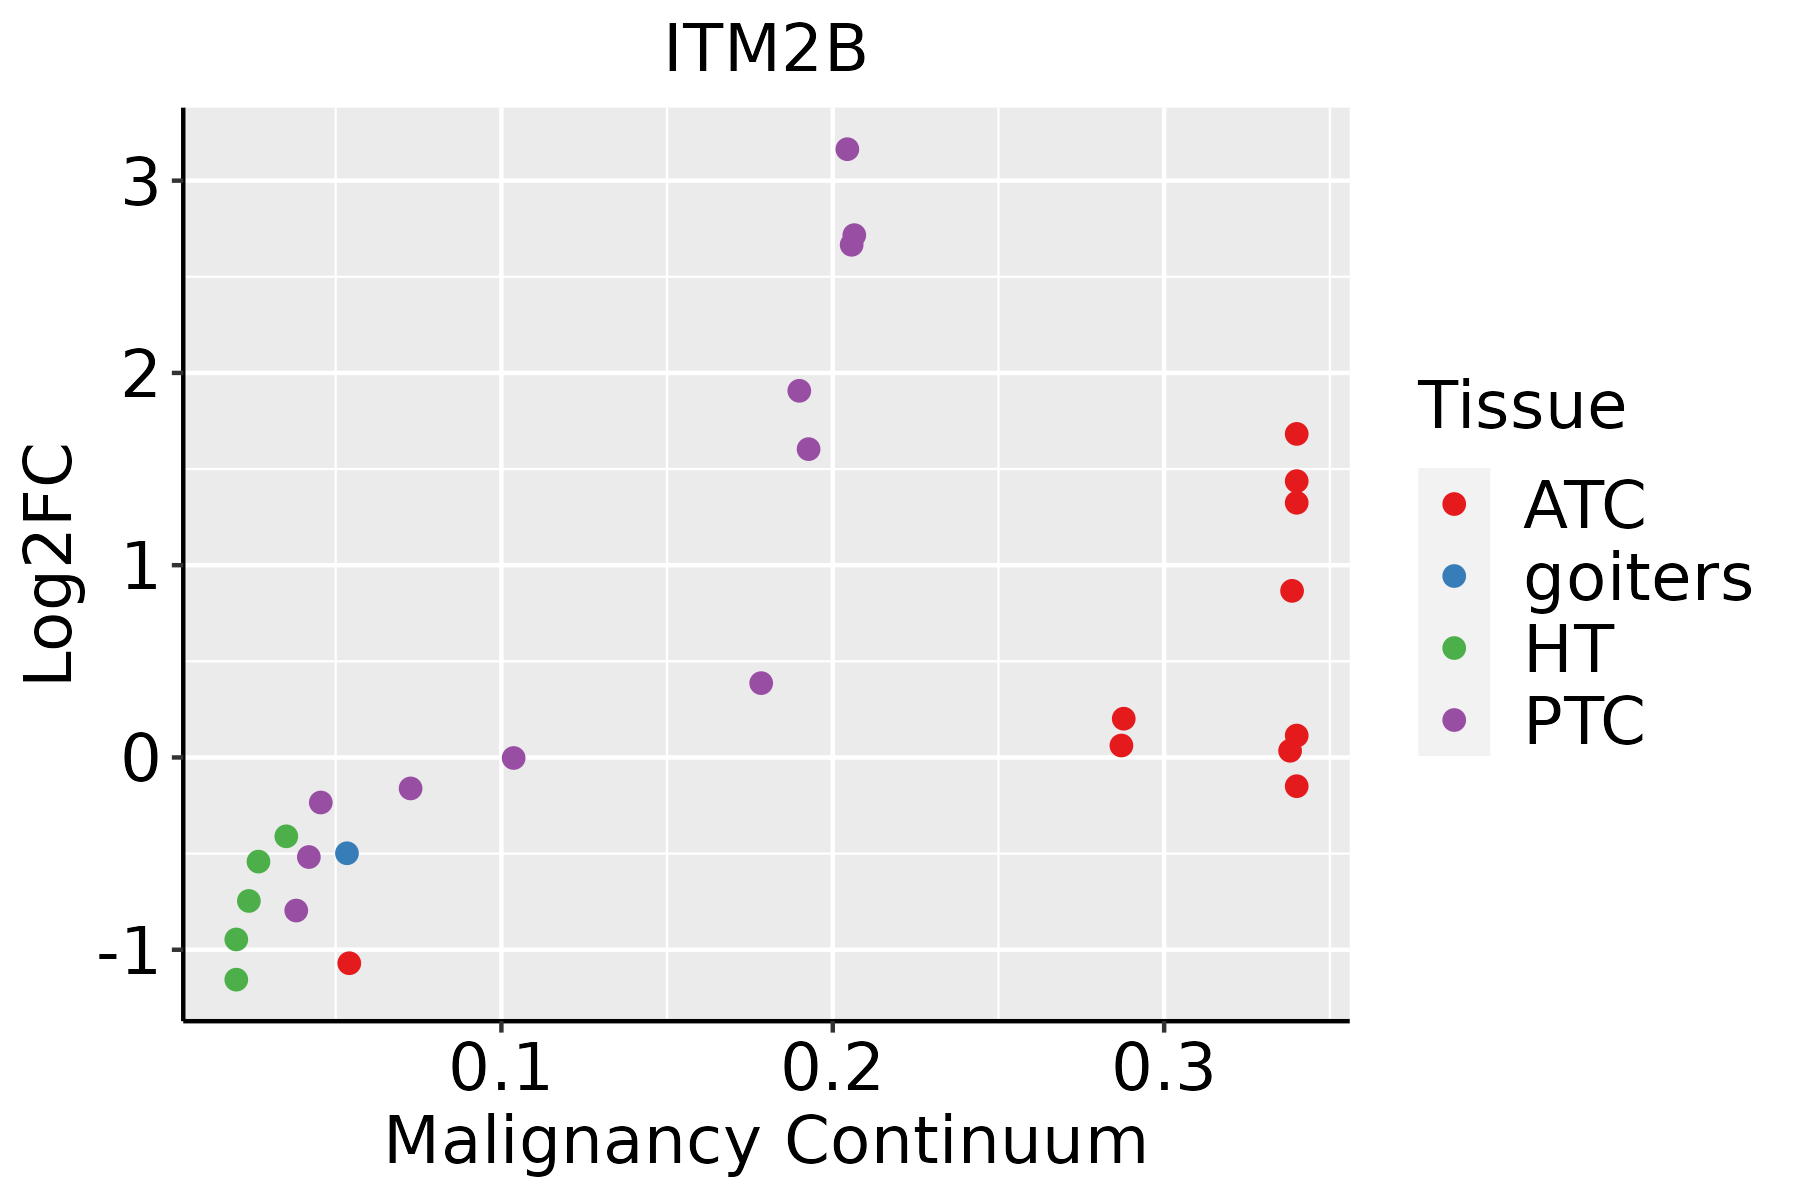 | ATC: Anaplastic thyroid cancer |
| HT: Hashimoto's thyroiditis | ||
| PTC: Papillary thyroid cancer |
| ∗log2FC in expression of this searched gene in stem-like cells from each diseased tissue sample relative to stem-like cells in normal samples in each tissue plotted against the malignancy continuum. Samples are colored based on if they are from different disease stage. |
Top |
Malignant transformation related pathway analysis |
| Find out the enriched GO biological processes and KEGG pathways involved in transition from healthy to precancer to cancer |
| Tissue | Disease Stage | Enriched GO biological Processes |
| Colorectum | AD |  |
| Colorectum | SER |  |
| Colorectum | MSS |  |
| Colorectum | MSI-H |  |
| Colorectum | FAP |  |
| ∗Top 15 enriched GO BP terms are showed in the bar plot of each disease state in each tissue. Each row represents a significant GO biological process which is colored according to the -log10(p.adjust). |
| Page: 1 2 3 4 5 6 7 8 9 |
| GO ID | Tissue | Disease Stage | Description | Gene Ratio | Bg Ratio | pvalue | p.adjust | Count |
| GO:0009101 | Colorectum | FAP | glycoprotein biosynthetic process | 63/2622 | 317/18723 | 2.31e-03 | 1.86e-02 | 63 |
| GO:00091002 | Esophagus | ESCC | glycoprotein metabolic process | 226/8552 | 387/18723 | 2.64e-07 | 3.94e-06 | 226 |
| GO:00091012 | Esophagus | ESCC | glycoprotein biosynthetic process | 181/8552 | 317/18723 | 2.54e-05 | 2.15e-04 | 181 |
| GO:0009100 | Liver | HCC | glycoprotein metabolic process | 193/7958 | 387/18723 | 1.89e-03 | 9.62e-03 | 193 |
| GO:00091001 | Oral cavity | OSCC | glycoprotein metabolic process | 185/7305 | 387/18723 | 2.37e-04 | 1.54e-03 | 185 |
| GO:00091011 | Oral cavity | OSCC | glycoprotein biosynthetic process | 151/7305 | 317/18723 | 1.01e-03 | 5.26e-03 | 151 |
| GO:00429823 | Oral cavity | OSCC | amyloid precursor protein metabolic process | 52/7305 | 95/18723 | 1.33e-03 | 6.62e-03 | 52 |
| GO:004298211 | Oral cavity | LP | amyloid precursor protein metabolic process | 37/4623 | 95/18723 | 1.45e-03 | 1.14e-02 | 37 |
| GO:00429822 | Oral cavity | NEOLP | amyloid precursor protein metabolic process | 20/2005 | 95/18723 | 2.28e-03 | 1.47e-02 | 20 |
| GO:0042982 | Prostate | BPH | amyloid precursor protein metabolic process | 26/3107 | 95/18723 | 5.47e-03 | 2.54e-02 | 26 |
| GO:00429821 | Prostate | Tumor | amyloid precursor protein metabolic process | 29/3246 | 95/18723 | 1.12e-03 | 7.14e-03 | 29 |
| GO:00429824 | Skin | AK | amyloid precursor protein metabolic process | 19/1910 | 95/18723 | 3.08e-03 | 1.92e-02 | 19 |
| GO:00091013 | Thyroid | PTC | glycoprotein biosynthetic process | 123/5968 | 317/18723 | 5.05e-03 | 2.33e-02 | 123 |
| GO:00091003 | Thyroid | PTC | glycoprotein metabolic process | 147/5968 | 387/18723 | 5.87e-03 | 2.64e-02 | 147 |
| GO:000910011 | Thyroid | ATC | glycoprotein metabolic process | 153/6293 | 387/18723 | 7.90e-03 | 3.06e-02 | 153 |
| Page: 1 |
| Pathway ID | Tissue | Disease Stage | Description | Gene Ratio | Bg Ratio | pvalue | p.adjust | qvalue | Count |
| Page: 1 |
Top |
Cell-cell communication analysis |
| Identification of potential cell-cell interactions between two cell types and their ligand-receptor pairs for different disease states |
| Ligand | Receptor | LRpair | Pathway | Tissue | Disease Stage |
| Page: 1 |
Top |
Single-cell gene regulatory network inference analysis |
| Find out the significant the regulons (TFs) and the target genes of each regulon across cell types for different disease states |
| TF | Cell Type | Tissue | Disease Stage | Target Gene | RSS | Regulon Activity |
| ∗The dot plots of a searched regulon are shown for all cell subpopulations in each disease state of each tissue based on the regulon specific score inferred using pySCENIC and by calculating the average expression. |
| Page: 1 |
Top |
Somatic mutation of malignant transformation related genes |
| Annotation of somatic variants for genes involved in malignant transformation |
| Hugo Symbol | Variant Class | Variant Classification | dbSNP RS | HGVSc | HGVSp | HGVSp Short | SWISSPROT | BIOTYPE | SIFT | PolyPhen | Tumor Sample Barcode | Tissue | Histology | Sex | Age | Stage | Therapy Types | Drugs | Outcome |
| ITM2B | SNV | Missense_Mutation | c.367N>C | p.Glu123Gln | p.E123Q | Q9Y287 | protein_coding | tolerated(0.18) | benign(0.017) | TCGA-E2-A1LH-01 | Breast | breast invasive carcinoma | Female | <65 | I/II | Chemotherapy | adriamycin | SD | |
| ITM2B | SNV | Missense_Mutation | c.373N>A | p.Glu125Lys | p.E125K | Q9Y287 | protein_coding | deleterious(0.01) | benign(0.045) | TCGA-EA-A3Y4-01 | Cervix | cervical & endocervical cancer | Female | <65 | I/II | Unknown | Unknown | SD | |
| ITM2B | SNV | Missense_Mutation | c.727C>T | p.Arg243Cys | p.R243C | Q9Y287 | protein_coding | deleterious(0) | benign(0.061) | TCGA-A6-6780-01 | Colorectum | colon adenocarcinoma | Male | >=65 | I/II | Unknown | Unknown | SD | |
| ITM2B | SNV | Missense_Mutation | c.605N>G | p.His202Arg | p.H202R | Q9Y287 | protein_coding | deleterious(0.01) | benign(0.119) | TCGA-AA-3510-01 | Colorectum | colon adenocarcinoma | Male | >=65 | I/II | Unknown | Unknown | SD | |
| ITM2B | SNV | Missense_Mutation | novel | c.709N>C | p.Ile237Leu | p.I237L | Q9Y287 | protein_coding | tolerated(0.41) | benign(0.007) | TCGA-AM-5820-01 | Colorectum | colon adenocarcinoma | Female | <65 | I/II | Unknown | Unknown | SD |
| ITM2B | SNV | Missense_Mutation | c.754C>T | p.Arg252Trp | p.R252W | Q9Y287 | protein_coding | deleterious(0) | possibly_damaging(0.802) | TCGA-AG-A002-01 | Colorectum | rectum adenocarcinoma | Male | <65 | I/II | Unknown | Unknown | SD | |
| ITM2B | SNV | Missense_Mutation | novel | c.320N>T | p.Ala107Val | p.A107V | Q9Y287 | protein_coding | tolerated(0.28) | benign(0) | TCGA-AP-A1DV-01 | Endometrium | uterine corpus endometrioid carcinoma | Female | <65 | I/II | Unknown | Unknown | SD |
| ITM2B | SNV | Missense_Mutation | novel | c.515N>T | p.Ser172Phe | p.S172F | Q9Y287 | protein_coding | deleterious(0) | probably_damaging(0.999) | TCGA-AP-A1DV-01 | Endometrium | uterine corpus endometrioid carcinoma | Female | <65 | I/II | Unknown | Unknown | SD |
| ITM2B | SNV | Missense_Mutation | novel | c.376N>A | p.Glu126Lys | p.E126K | Q9Y287 | protein_coding | tolerated(0.08) | benign(0.033) | TCGA-AX-A2HC-01 | Endometrium | uterine corpus endometrioid carcinoma | Female | <65 | III/IV | Chemotherapy | paclitaxel | PD |
| ITM2B | SNV | Missense_Mutation | novel | c.598N>A | p.His200Asn | p.H200N | Q9Y287 | protein_coding | deleterious(0.01) | possibly_damaging(0.874) | TCGA-AX-A3FS-01 | Endometrium | uterine corpus endometrioid carcinoma | Female | >=65 | I/II | Unknown | Unknown | SD |
| Page: 1 2 3 |
Top |
Related drugs of malignant transformation related genes |
| Identification of chemicals and drugs interact with genes involved in malignant transfromation |
| (DGIdb 4.0) |
| Entrez ID | Symbol | Category | Interaction Types | Drug Claim Name | Drug Name | PMIDs |
| Page: 1 |

Copyright 2023-Present -The University of Texas Health Science Center at Houston |