| Entrez ID | Symbol | Replicates | Species | Organ | Tissue | Adj P-value | Log2FC | Malignancy |
| 3146 | HMGB1 | Dong_P5 | Human | Prostate | Tumor | 7.42e-05 | 2.22e-01 | 0.053 |
| 3146 | HMGB1 | P7 | Human | Prostate | Tumor | 2.93e-28 | 1.00e+00 | -0.1025 |
| 3146 | HMGB1 | P9 | Human | Prostate | Tumor | 3.85e-02 | -2.65e-01 | -0.0285 |
| 3146 | HMGB1 | P10 | Human | Prostate | Tumor | 4.03e-12 | 6.30e-01 | -0.0902 |
| 3146 | HMGB1 | GSM5353215_PA_AUG_PB_1B_S2 | Human | Prostate | Tumor | 2.03e-08 | -8.85e-01 | 0.1557 |
| 3146 | HMGB1 | GSM5353216_PA_PB1A_Pool_1_3_S50_L002 | Human | Prostate | Tumor | 3.35e-08 | -1.00e+00 | 0.159 |
| 3146 | HMGB1 | GSM5353217_PA_PB1A_Pool_2_S107_L004 | Human | Prostate | Tumor | 1.93e-08 | -1.29e+00 | 0.156 |
| 3146 | HMGB1 | GSM5353218_PA_PB1B_Pool_1_2_S74_L003 | Human | Prostate | Tumor | 1.40e-05 | -9.39e-01 | 0.1479 |
| 3146 | HMGB1 | GSM5353220_PA_PB1B_Pool_3_S51_L002 | Human | Prostate | Tumor | 8.58e-12 | -1.15e+00 | 0.1531 |
| 3146 | HMGB1 | GSM5353221_PA_PB2A_Pool_1_3_S25_L001 | Human | Prostate | Tumor | 1.46e-25 | -9.68e-01 | 0.1633 |
| 3146 | HMGB1 | GSM5353222_PA_PB2B_Pool_1_3_S52_L002 | Human | Prostate | Tumor | 1.56e-33 | -9.59e-01 | 0.1608 |
| 3146 | HMGB1 | GSM5353223_PA_PB2B_Pool_2_S26_L001 | Human | Prostate | Tumor | 5.06e-18 | -8.44e-01 | 0.1604 |
| 3146 | HMGB1 | GSM5353224_PA_PR5186_Pool_1_2_3_S27_L001 | Human | Prostate | Tumor | 6.03e-13 | -6.55e-01 | 0.1621 |
| 3146 | HMGB1 | GSM5353225_PA_PR5196-1_Pool_1_2_3_S53_L002 | Human | Prostate | Tumor | 1.15e-13 | -9.87e-01 | 0.1619 |
| 3146 | HMGB1 | GSM5353226_PA_PR5196-2_Pool_1_2_3_S54_L002 | Human | Prostate | Tumor | 5.41e-09 | -9.72e-01 | 0.159 |
| 3146 | HMGB1 | GSM5353227_PA_PR5199-193K_Pool_1_2_3_S55_L002 | Human | Prostate | Tumor | 3.17e-28 | -9.97e-01 | 0.1602 |
| 3146 | HMGB1 | GSM5353228_PA_PR5199-640K_Pool_1_3_S108_L004 | Human | Prostate | Tumor | 1.99e-09 | -1.09e+00 | 0.1537 |
| 3146 | HMGB1 | GSM5353232_PA_PR5249_T1_S3_L001 | Human | Prostate | Tumor | 7.91e-18 | -1.09e+00 | 0.1439 |
| 3146 | HMGB1 | GSM5353236_PA_PR5251_T1_S7_L001 | Human | Prostate | Tumor | 3.11e-18 | -1.09e+00 | 0.1608 |
| 3146 | HMGB1 | GSM5353237_PA_PR5251_T2_S8_L001 | Human | Prostate | Tumor | 1.80e-07 | -8.78e-01 | 0.1622 |
| Tissue | Expression Dynamics | Abbreviation |
| Breast | 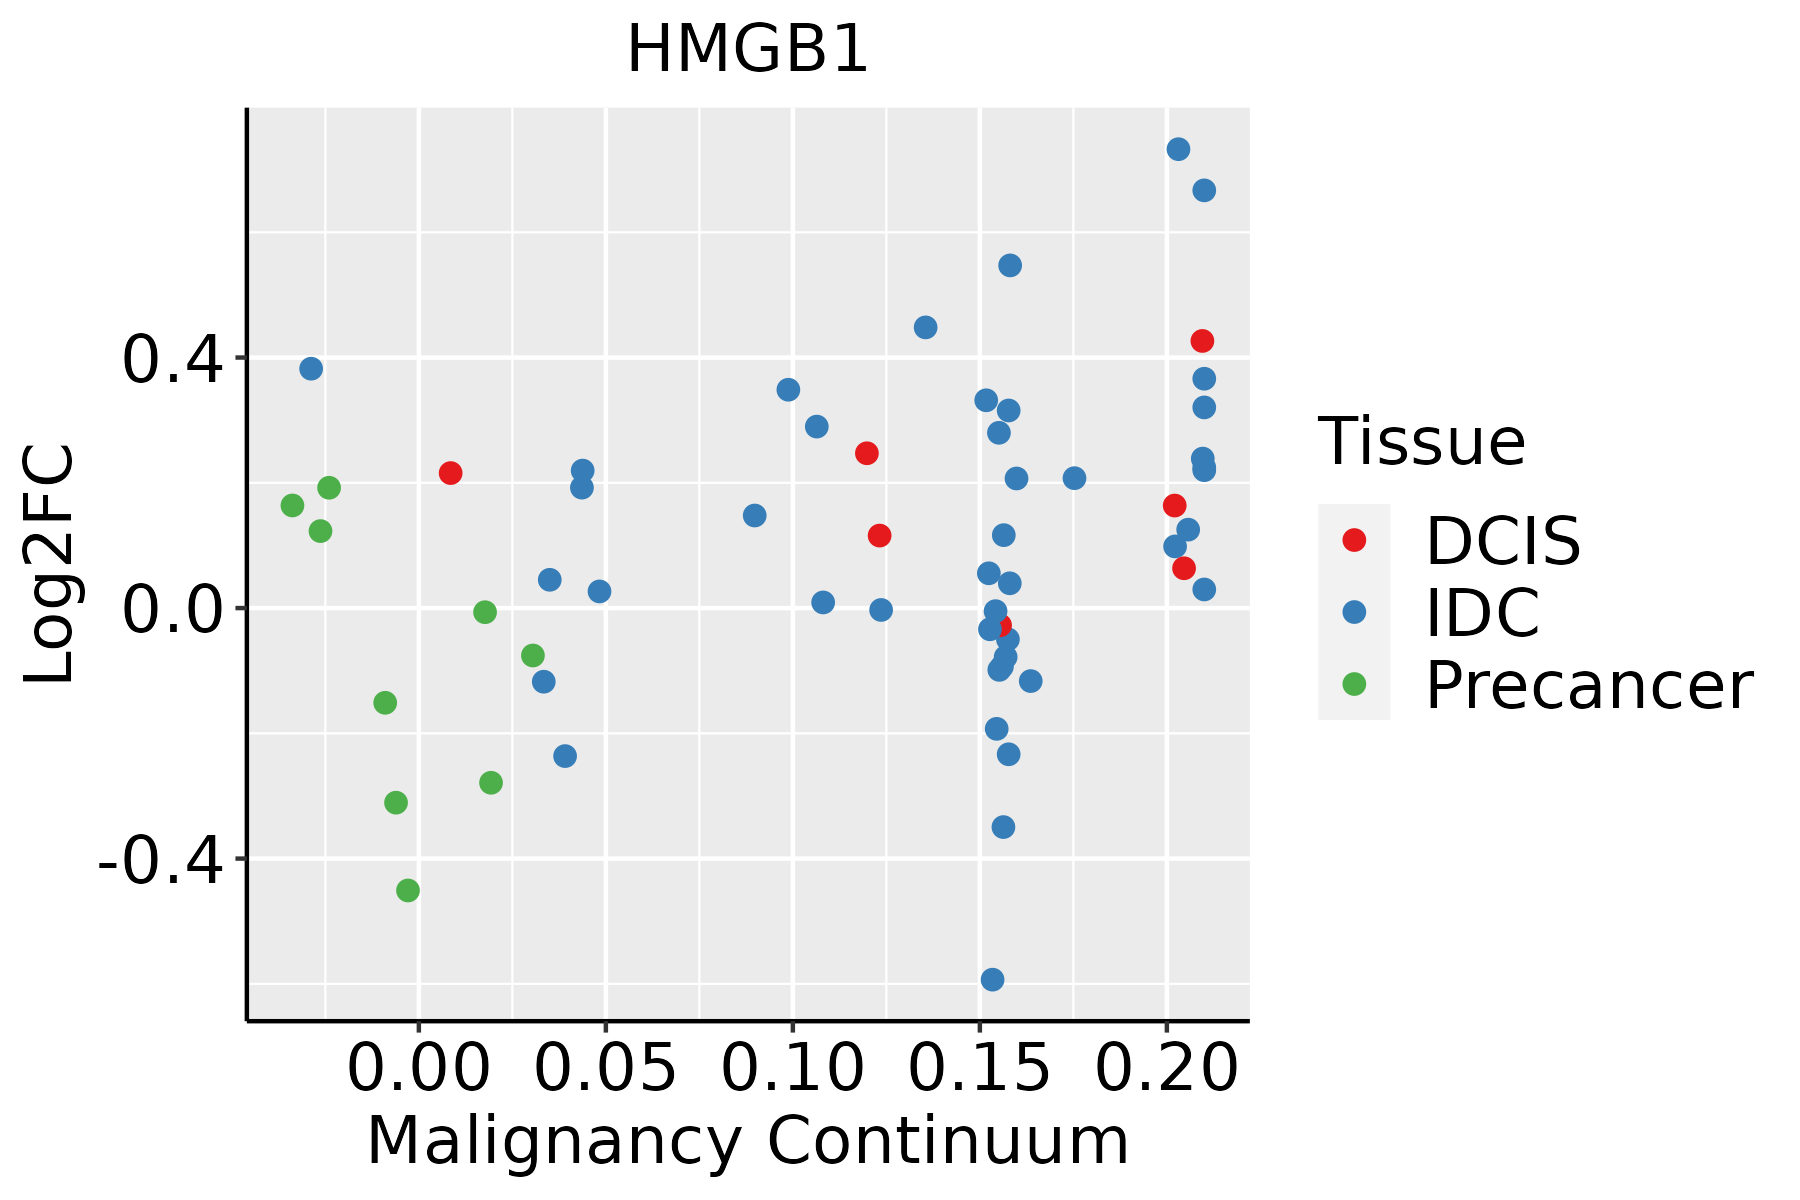 | IDC: Invasive ductal carcinoma |
| DCIS: Ductal carcinoma in situ |
| Precancer(BRCA1-mut): Precancerous lesion from BRCA1 mutation carriers |
| Cervix | 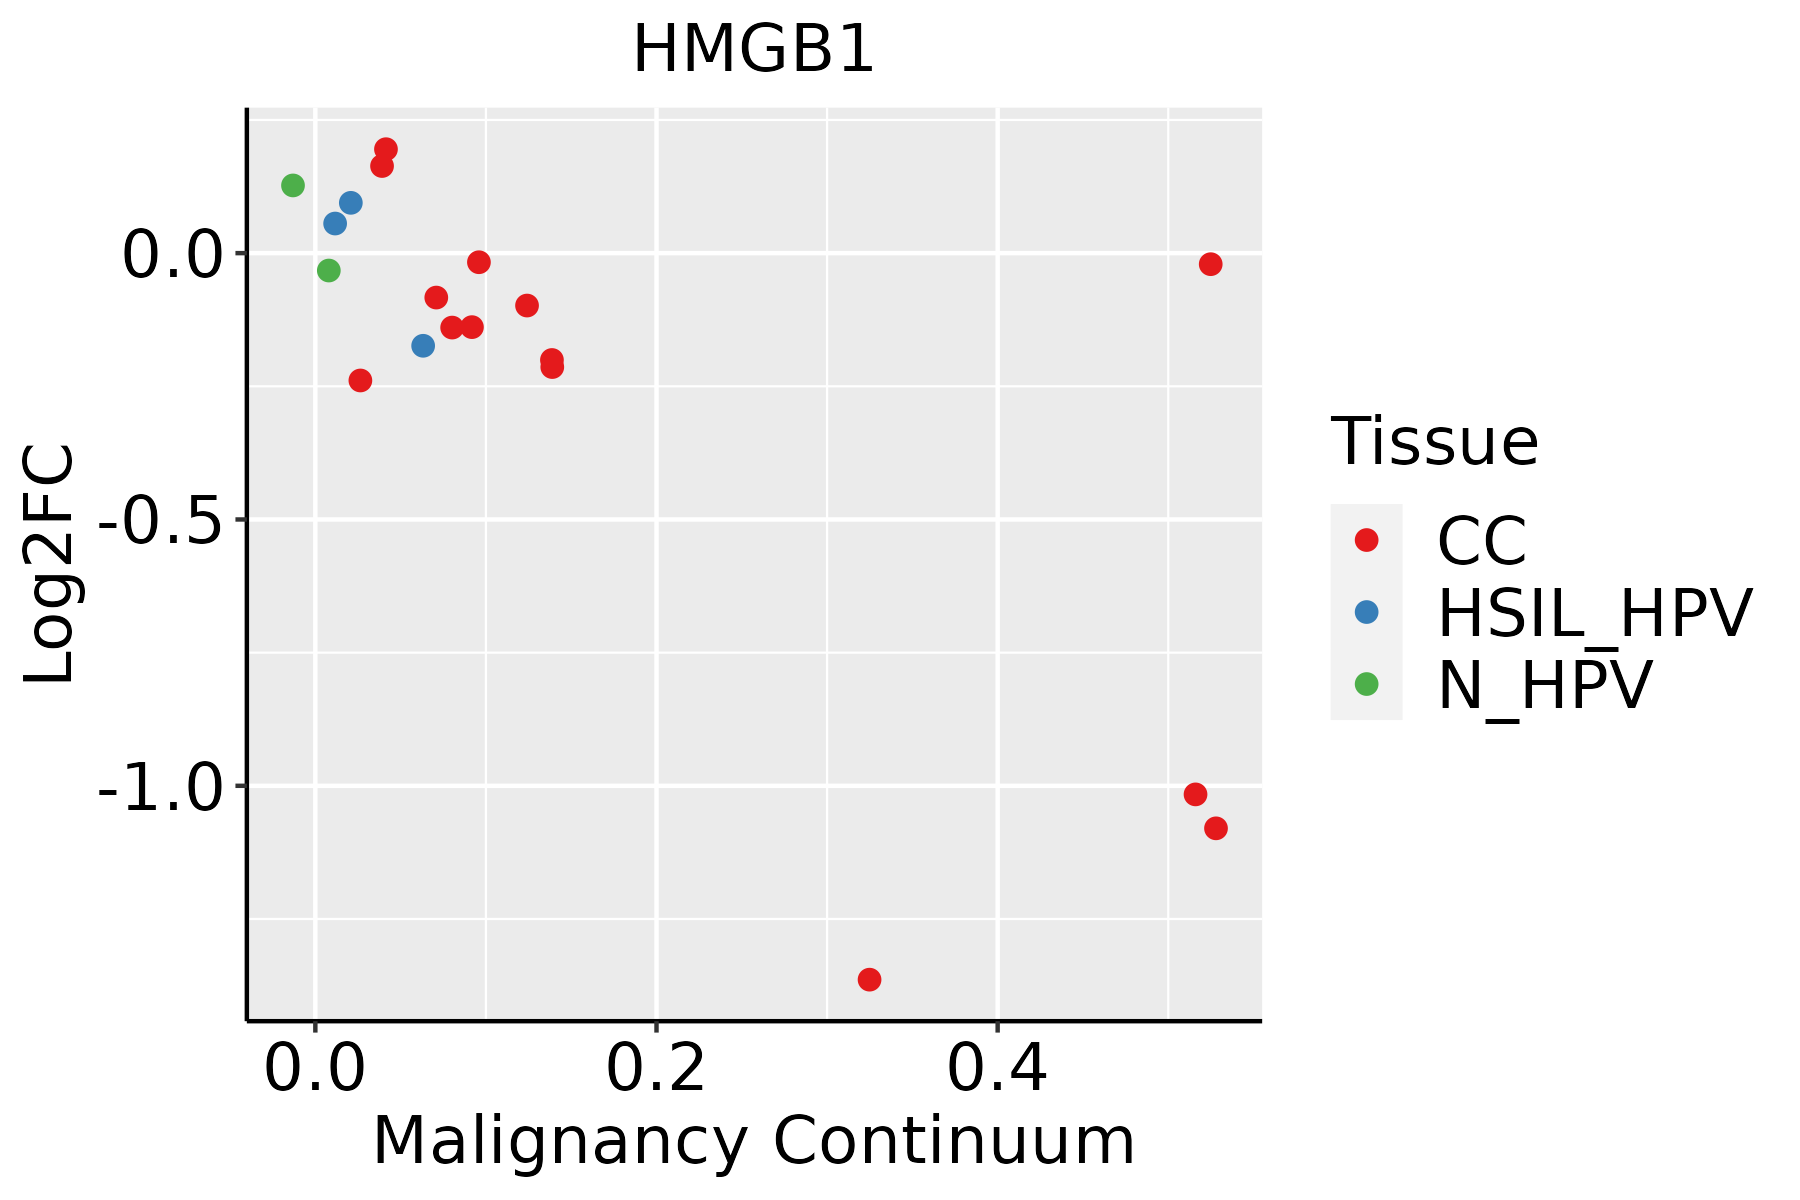 | CC: Cervix cancer |
| HSIL_HPV: HPV-infected high-grade squamous intraepithelial lesions |
| N_HPV: HPV-infected normal cervix |
| Colorectum (GSE201348) |  | FAP: Familial adenomatous polyposis |
| CRC: Colorectal cancer |
| Colorectum (HTA11) |  | AD: Adenomas |
| SER: Sessile serrated lesions |
| MSI-H: Microsatellite-high colorectal cancer |
| MSS: Microsatellite stable colorectal cancer |
| Endometrium | 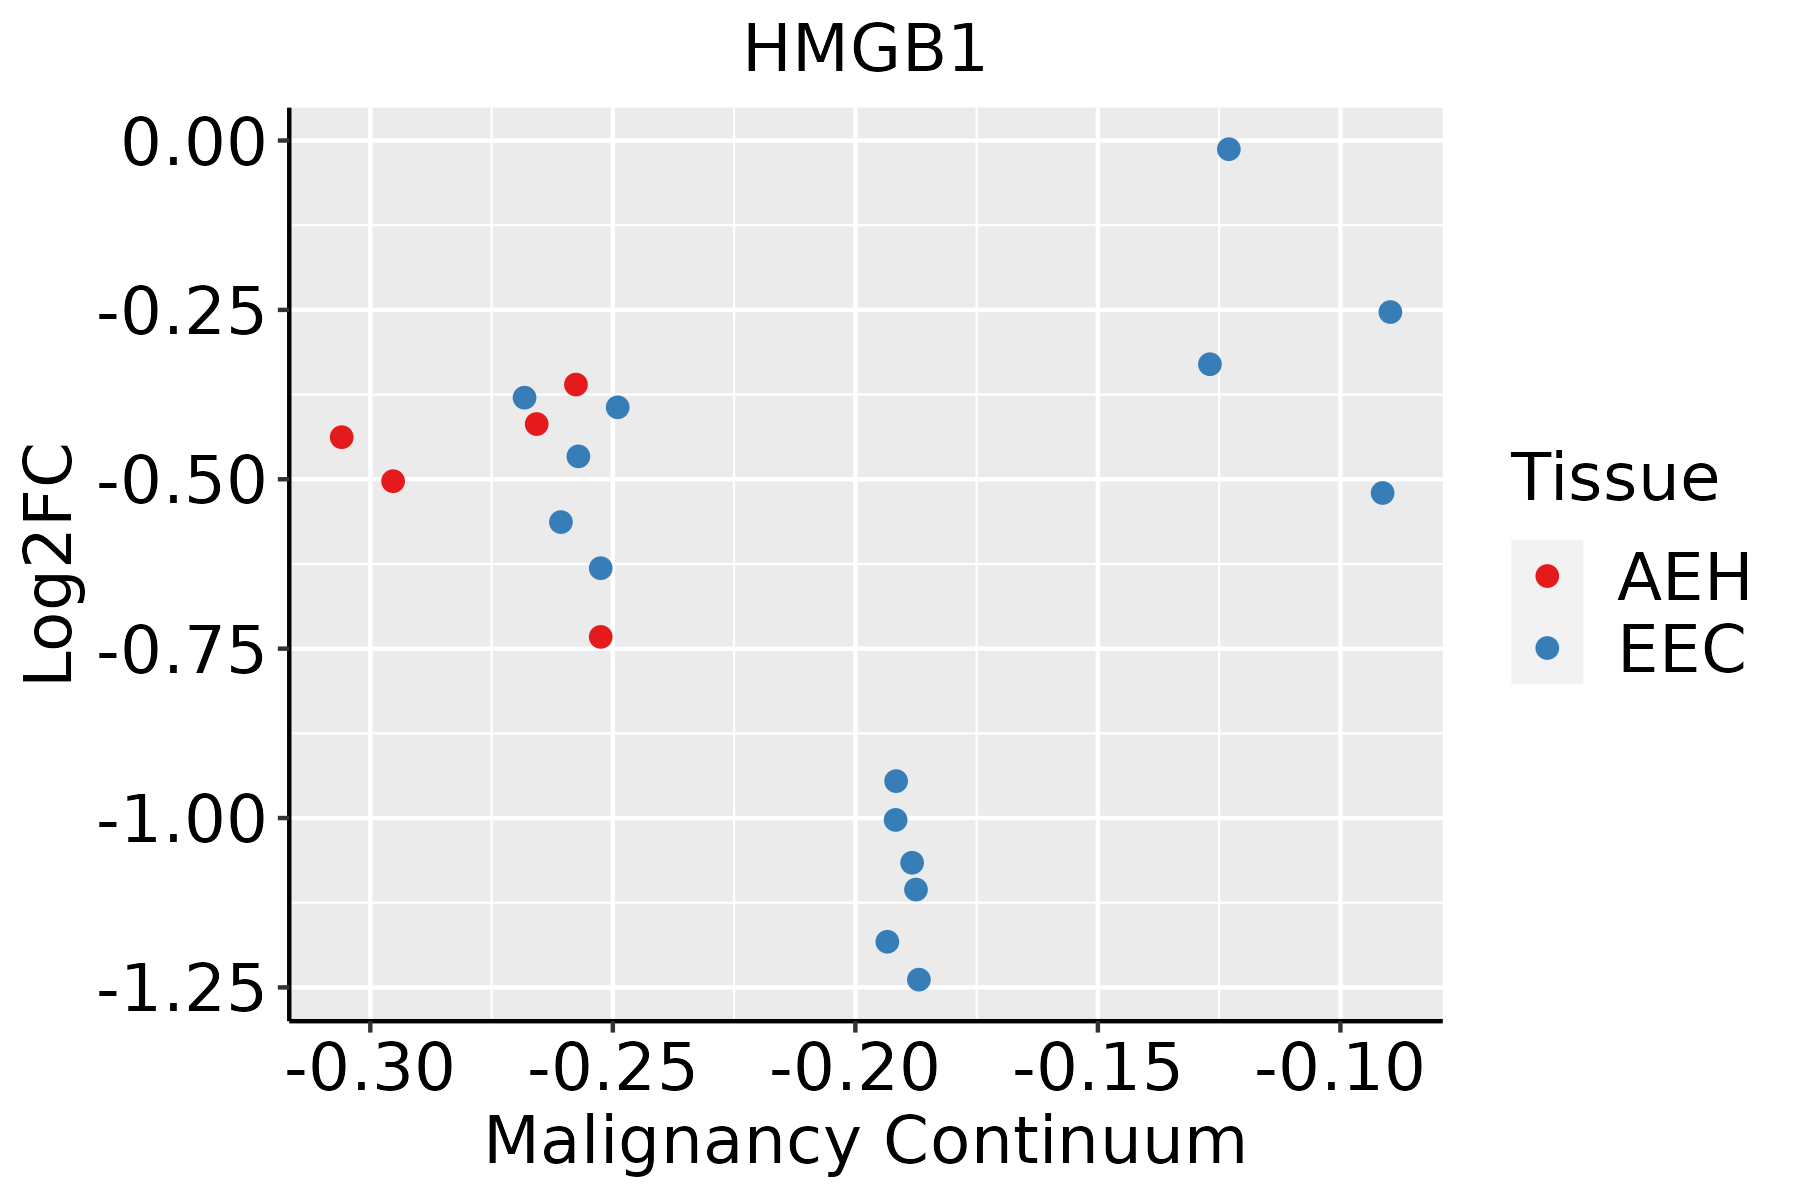 | AEH: Atypical endometrial hyperplasia |
| EEC: Endometrioid Cancer |
| Esophagus |  | ESCC: Esophageal squamous cell carcinoma |
| HGIN: High-grade intraepithelial neoplasias |
| LGIN: Low-grade intraepithelial neoplasias |
| GC | 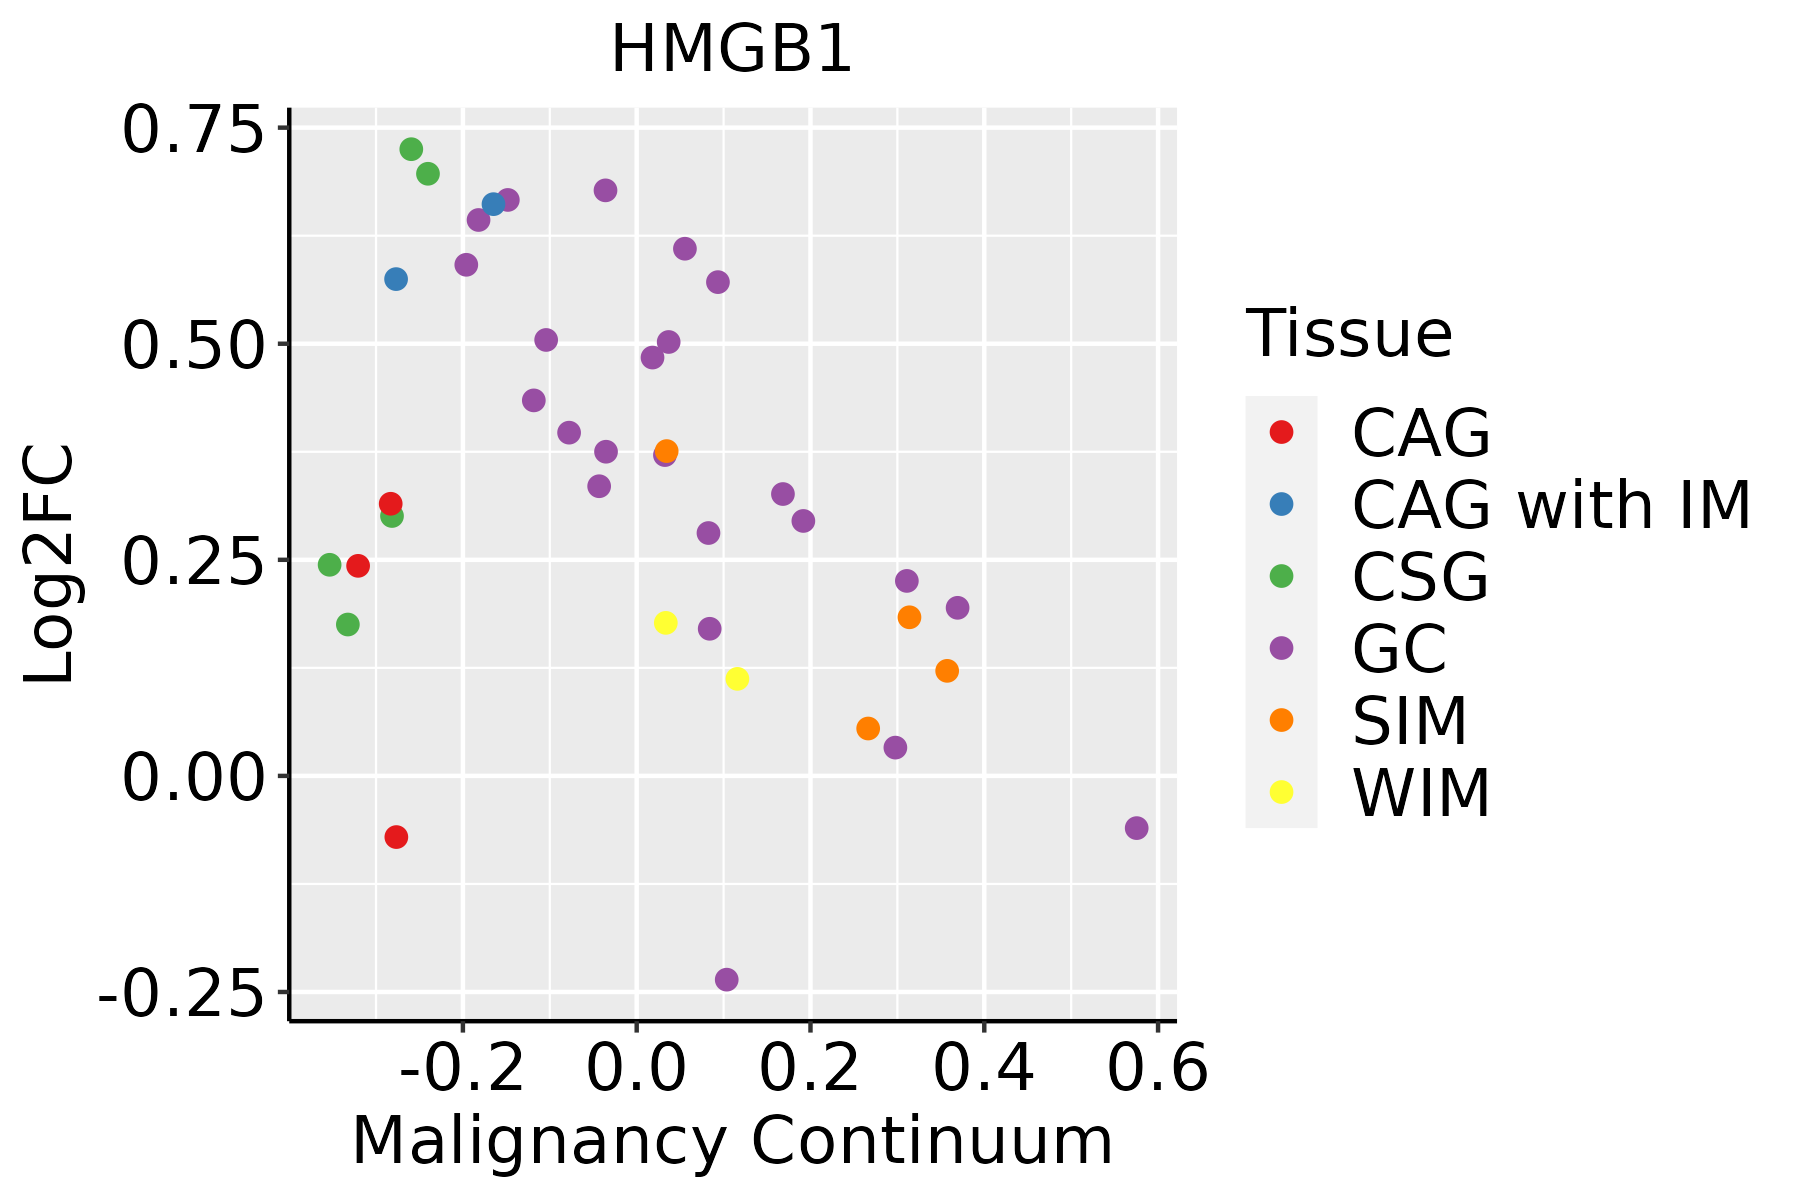 | CAG: Chronic atrophic gastritis |
| CAG with IM: Chronic atrophic gastritis with intestinal metaplasia |
| CSG: Chronic superficial gastritis |
| GC: Gastric cancer |
| SIM: Severe intestinal metaplasia |
| WIM: Wild intestinal metaplasia |
| Liver | 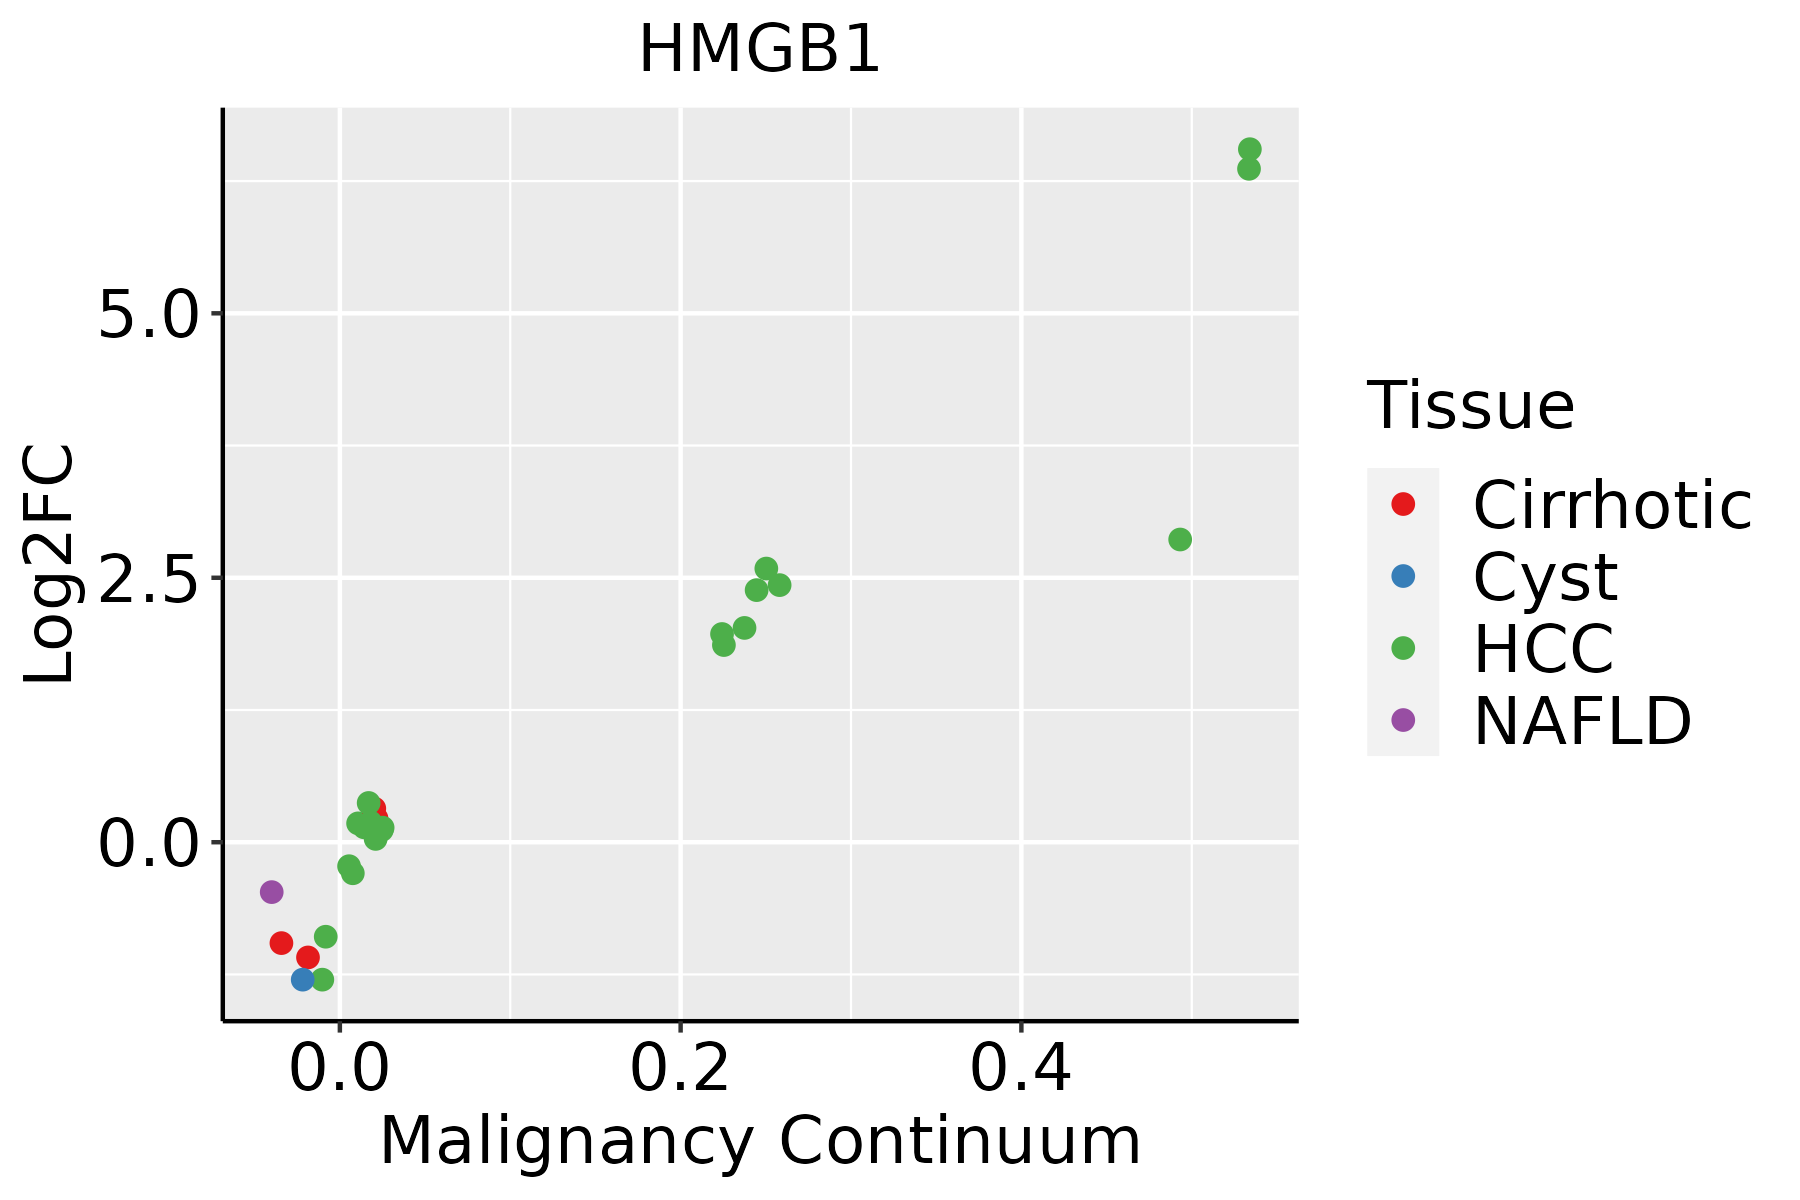 | HCC: Hepatocellular carcinoma |
| NAFLD: Non-alcoholic fatty liver disease |
| Oral Cavity |  | EOLP: Erosive Oral lichen planus |
| LP: leukoplakia |
| NEOLP: Non-erosive oral lichen planus |
| OSCC: Oral squamous cell carcinoma |
| Prostate | 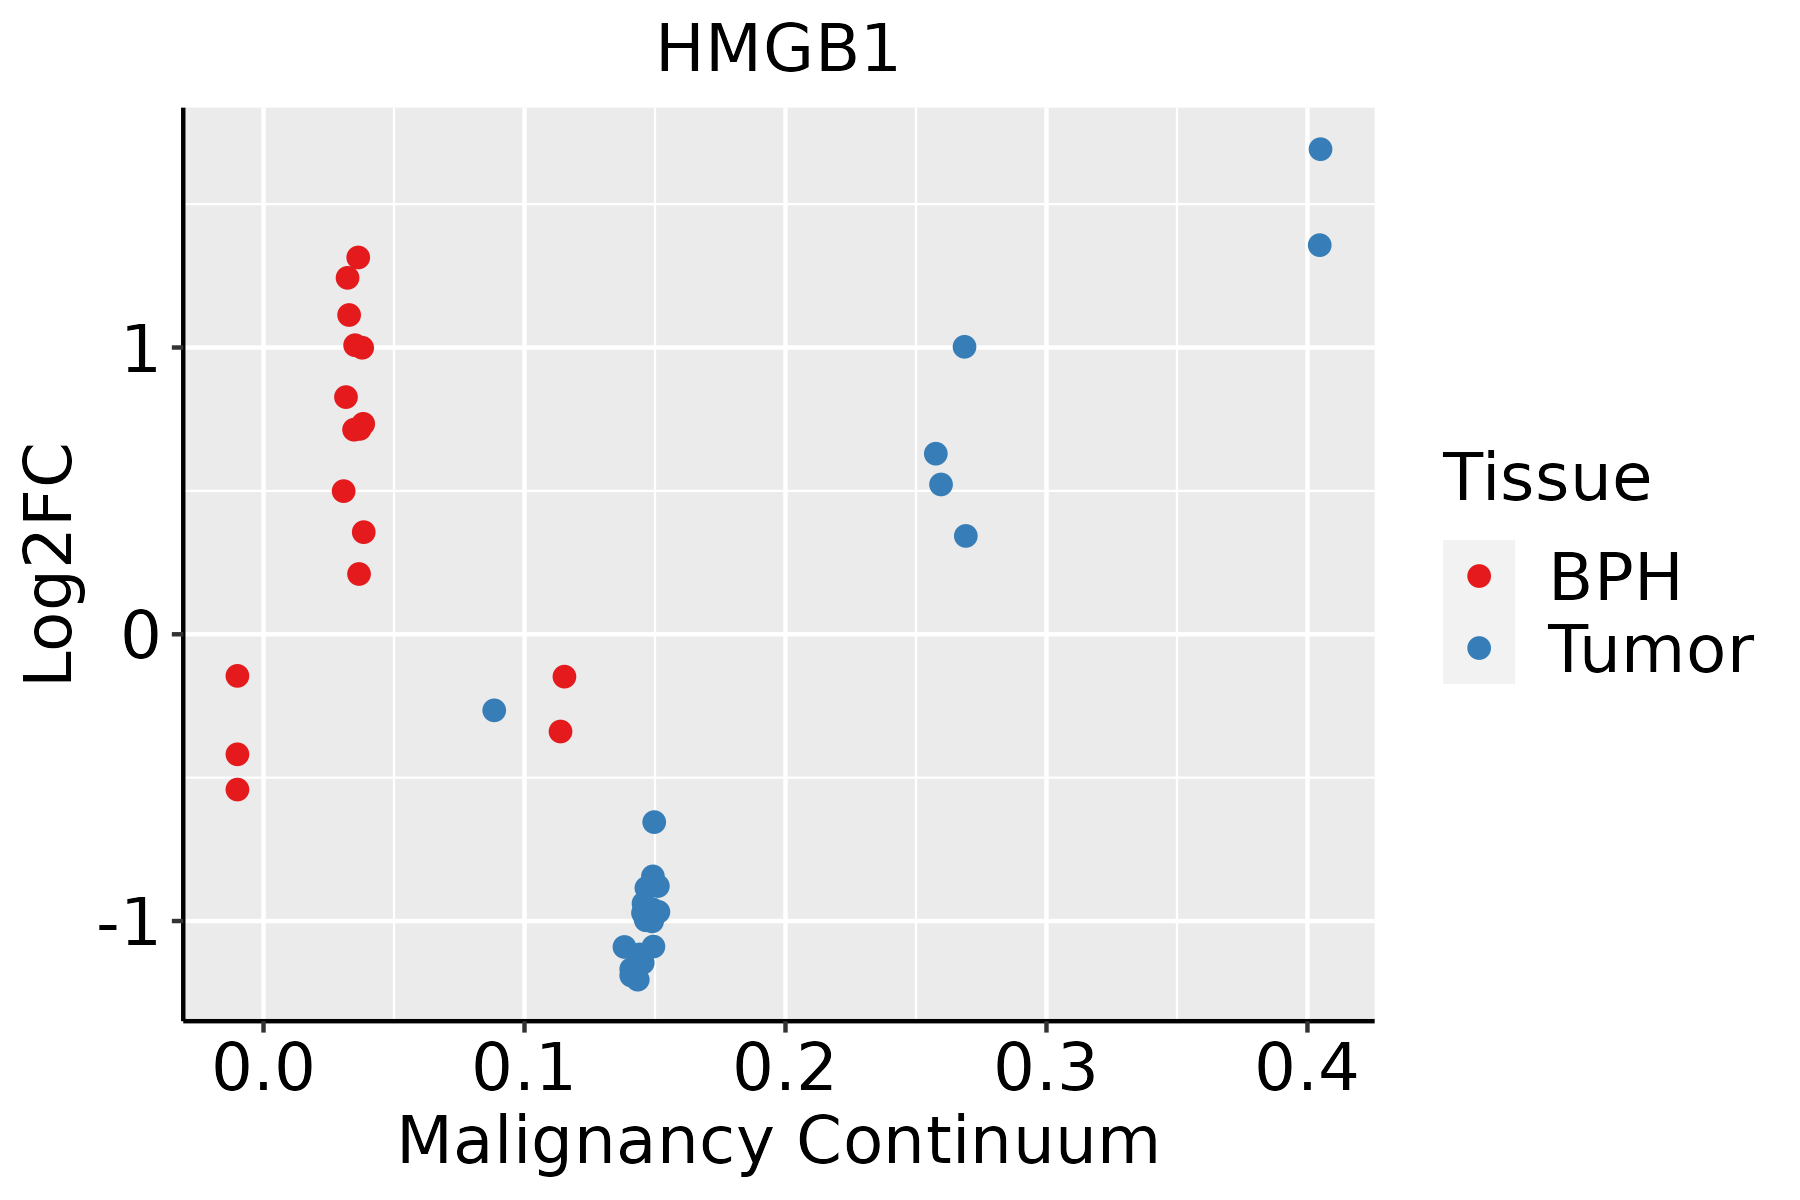 | BPH: Benign Prostatic Hyperplasia |
| Skin |  | AK: Actinic keratosis |
| cSCC: Cutaneous squamous cell carcinoma |
| SCCIS:squamous cell carcinoma in situ |
| Thyroid |  | ATC: Anaplastic thyroid cancer |
| HT: Hashimoto's thyroiditis |
| PTC: Papillary thyroid cancer |
| GO ID | Tissue | Disease Stage | Description | Gene Ratio | Bg Ratio | pvalue | p.adjust | Count |
| GO:00060918 | Breast | Precancer | generation of precursor metabolites and energy | 94/1080 | 490/18723 | 1.54e-25 | 1.64e-22 | 94 |
| GO:00159808 | Breast | Precancer | energy derivation by oxidation of organic compounds | 70/1080 | 318/18723 | 8.33e-23 | 6.37e-20 | 70 |
| GO:00525479 | Breast | Precancer | regulation of peptidase activity | 71/1080 | 461/18723 | 2.72e-14 | 6.94e-12 | 71 |
| GO:00525489 | Breast | Precancer | regulation of endopeptidase activity | 67/1080 | 432/18723 | 1.06e-13 | 2.36e-11 | 67 |
| GO:20001169 | Breast | Precancer | regulation of cysteine-type endopeptidase activity | 43/1080 | 235/18723 | 1.30e-11 | 1.83e-09 | 43 |
| GO:00432819 | Breast | Precancer | regulation of cysteine-type endopeptidase activity involved in apoptotic process | 40/1080 | 209/18723 | 1.59e-11 | 2.07e-09 | 40 |
| GO:00485459 | Breast | Precancer | response to steroid hormone | 53/1080 | 339/18723 | 3.07e-11 | 3.66e-09 | 53 |
| GO:00458629 | Breast | Precancer | positive regulation of proteolysis | 51/1080 | 372/18723 | 7.77e-09 | 5.70e-07 | 51 |
| GO:00319608 | Breast | Precancer | response to corticosteroid | 30/1080 | 167/18723 | 2.50e-08 | 1.65e-06 | 30 |
| GO:00109529 | Breast | Precancer | positive regulation of peptidase activity | 33/1080 | 197/18723 | 3.01e-08 | 1.89e-06 | 33 |
| GO:00975297 | Breast | Precancer | myeloid leukocyte migration | 34/1080 | 220/18723 | 1.42e-07 | 7.82e-06 | 34 |
| GO:00509006 | Breast | Precancer | leukocyte migration | 47/1080 | 369/18723 | 2.82e-07 | 1.39e-05 | 47 |
| GO:00022629 | Breast | Precancer | myeloid cell homeostasis | 27/1080 | 157/18723 | 3.10e-07 | 1.49e-05 | 27 |
| GO:00432808 | Breast | Precancer | positive regulation of cysteine-type endopeptidase activity involved in apoptotic process | 24/1080 | 129/18723 | 3.13e-07 | 1.50e-05 | 24 |
| GO:00513848 | Breast | Precancer | response to glucocorticoid | 26/1080 | 148/18723 | 3.32e-07 | 1.57e-05 | 26 |
| GO:00305956 | Breast | Precancer | leukocyte chemotaxis | 34/1080 | 230/18723 | 4.16e-07 | 1.89e-05 | 34 |
| GO:00109509 | Breast | Precancer | positive regulation of endopeptidase activity | 29/1080 | 179/18723 | 4.23e-07 | 1.90e-05 | 29 |
| GO:00457859 | Breast | Precancer | positive regulation of cell adhesion | 52/1080 | 437/18723 | 5.74e-07 | 2.49e-05 | 52 |
| GO:00603266 | Breast | Precancer | cell chemotaxis | 41/1080 | 310/18723 | 5.99e-07 | 2.55e-05 | 41 |
| GO:00511019 | Breast | Precancer | regulation of DNA binding | 22/1080 | 118/18723 | 9.28e-07 | 3.71e-05 | 22 |
| Hugo Symbol | Variant Class | Variant Classification | dbSNP RS | HGVSc | HGVSp | HGVSp Short | SWISSPROT | BIOTYPE | SIFT | PolyPhen | Tumor Sample Barcode | Tissue | Histology | Sex | Age | Stage | Therapy Types | Drugs | Outcome |
| HMGB1 | SNV | Missense_Mutation | | c.120N>C | p.Glu40Asp | p.E40D | P09429 | protein_coding | deleterious(0.02) | benign(0.105) | TCGA-D8-A1XT-01 | Breast | breast invasive carcinoma | Female | <65 | I/II | Chemotherapy | adriamycin+cyclophosphamide | SD |
| HMGB1 | SNV | Missense_Mutation | | c.131A>C | p.Lys44Thr | p.K44T | P09429 | protein_coding | deleterious(0.02) | possibly_damaging(0.784) | TCGA-A6-6780-01 | Colorectum | colon adenocarcinoma | Male | >=65 | I/II | Unknown | Unknown | SD |
| HMGB1 | SNV | Missense_Mutation | | c.624A>T | p.Glu208Asp | p.E208D | P09429 | protein_coding | tolerated_low_confidence(0.26) | benign(0) | TCGA-AA-3821-01 | Colorectum | colon adenocarcinoma | Female | >=65 | I/II | Unknown | Unknown | SD |
| HMGB1 | SNV | Missense_Mutation | | c.443C>G | p.Ala148Gly | p.A148G | P09429 | protein_coding | deleterious(0.01) | probably_damaging(0.983) | TCGA-AA-A010-01 | Colorectum | colon adenocarcinoma | Female | <65 | I/II | Chemotherapy | folinic | CR |
| HMGB1 | SNV | Missense_Mutation | novel | c.377C>T | p.Ala126Val | p.A126V | P09429 | protein_coding | deleterious(0.03) | benign(0.221) | TCGA-A5-A2K5-01 | Endometrium | uterine corpus endometrioid carcinoma | Female | >=65 | I/II | Unknown | Unknown | SD |
| HMGB1 | SNV | Missense_Mutation | novel | c.168G>T | p.Glu56Asp | p.E56D | P09429 | protein_coding | deleterious(0.04) | benign(0.105) | TCGA-AP-A1E0-01 | Endometrium | uterine corpus endometrioid carcinoma | Female | <65 | III/IV | Chemotherapy | paclitaxel | SD |
| HMGB1 | SNV | Missense_Mutation | | c.253N>G | p.Thr85Ala | p.T85A | P09429 | protein_coding | tolerated(0.15) | benign(0.009) | TCGA-B5-A11E-01 | Endometrium | uterine corpus endometrioid carcinoma | Female | <65 | I/II | Unknown | Unknown | SD |
| HMGB1 | SNV | Missense_Mutation | novel | c.23N>G | p.Lys8Arg | p.K8R | P09429 | protein_coding | deleterious(0.02) | benign(0.358) | TCGA-B5-A1MR-01 | Endometrium | uterine corpus endometrioid carcinoma | Female | >=65 | III/IV | Unknown | Unknown | SD |
| HMGB1 | SNV | Missense_Mutation | novel | c.25N>T | p.Pro9Ser | p.P9S | P09429 | protein_coding | deleterious(0.04) | possibly_damaging(0.573) | TCGA-B5-A3FC-01 | Endometrium | uterine corpus endometrioid carcinoma | Female | <65 | I/II | Unknown | Unknown | SD |
| HMGB1 | SNV | Missense_Mutation | | c.488G>A | p.Arg163Gln | p.R163Q | P09429 | protein_coding | tolerated(0.16) | benign(0.193) | TCGA-BS-A0UV-01 | Endometrium | uterine corpus endometrioid carcinoma | Female | <65 | III/IV | Unknown | Unknown | SD |
| Entrez ID | Symbol | Category | Interaction Types | Drug Claim Name | Drug Name | PMIDs |
| 3146 | HMGB1 | DRUGGABLE GENOME, CELL SURFACE, TRANSCRIPTION FACTOR | | PREDNISOLONE | PREDNISOLONE | 18447956 |
| 3146 | HMGB1 | DRUGGABLE GENOME, CELL SURFACE, TRANSCRIPTION FACTOR | | AUTOLOGOUS DENDRITIC CELLS | | 16997859 |
| 3146 | HMGB1 | DRUGGABLE GENOME, CELL SURFACE, TRANSCRIPTION FACTOR | | ADJUVANT | | 15161015 |
| 3146 | HMGB1 | DRUGGABLE GENOME, CELL SURFACE, TRANSCRIPTION FACTOR | | SALINE | SODIUM CHLORIDE | 17334244 |
| 3146 | HMGB1 | DRUGGABLE GENOME, CELL SURFACE, TRANSCRIPTION FACTOR | | DISTAMYCIN | | 9161031 |
| 3146 | HMGB1 | DRUGGABLE GENOME, CELL SURFACE, TRANSCRIPTION FACTOR | | GP100 | | 16968820 |
| 3146 | HMGB1 | DRUGGABLE GENOME, CELL SURFACE, TRANSCRIPTION FACTOR | | CHLORAMPHENICOL | CHLORAMPHENICOL | 9931456 |
| 3146 | HMGB1 | DRUGGABLE GENOME, CELL SURFACE, TRANSCRIPTION FACTOR | | EGCG | EPIGALOCATECHIN GALLATE | 17987129 |
| 3146 | HMGB1 | DRUGGABLE GENOME, CELL SURFACE, TRANSCRIPTION FACTOR | | MART1 | | 16968820 |
| 3146 | HMGB1 | DRUGGABLE GENOME, CELL SURFACE, TRANSCRIPTION FACTOR | | AMPICILLIN | AMPICILLIN | 9931456 |


