Schematic overview of the cellular and molecular mechanisms involved in the cancer progression, including the proposed cellular and molecular mechanisms in cancer cells trajectory. AT1: alveolar type 1 cells; AT2: alveolar type 2 cells; AAH: atypical adenomatous hyperplasia; AIS: adenocarcinoma in situ; MIA: minimally invasive adenocarcinoma; IA: invasive adenocarcinoma; EMT: epithelial-mesenchymal transition

Home

Download

Statistics

Help

Contact

Center for Computational Systems Medicine
leaf

Gene summary

leaf

Malignant transformation analysis

leaf

Malignant transformation related pathway analysis

leaf

Cell-cell communication analysis

leaf

Single-cell gene regulatory network inference analysis

leaf

Somatic mutation of malignant transformation related genes

leaf

Related drugs of malignant transformation related genes

Gene: DDX17

Gene summary for DDX17

check button Gene summary.

Gene informationSpeciesHuman
Gene symbol

DDX17

Gene ID

10521

Gene nameDEAD-box helicase 17
Gene AliasP72
Cytomap22q13.1
Gene Typeprotein-coding
GO ID

GO:0000375

UniProtAcc

A0A1W2PQ51


Top

Malignant transformation analysis

check button Identification of the aberrant gene expression in precancerous and cancerous lesions by comparing the gene expression of stem-like cells in diseased tissues with normal stem cells
check button Malignant transformation involving gene list.
Entrez IDSymbolReplicatesSpeciesOrganTissueAdj P-valueLog2FCMalignancy
10521DDX17P2_cSCCHumanSkincSCC1.83e-167.91e-01-0.024
10521DDX17P4_cSCCHumanSkincSCC4.58e-196.02e-01-0.00290000000000005
10521DDX17P10_cSCCHumanSkincSCC8.09e-311.18e+000.1017
10521DDX17cSCC_p7HumanSkincSCC4.33e-021.20e-01-0.2332
10521DDX17cSCC_p8HumanSkincSCC3.21e-052.72e-02-0.1971
10521DDX17cSCC_p9HumanSkincSCC8.21e-03-1.81e-02-0.1991
10521DDX17Adj_PTCwithHT_6HumanThyroidHT2.07e-24-7.72e-010.02
10521DDX17Adj_PTCwithHT_8HumanThyroidHT1.58e-15-7.38e-010.0267
10521DDX17PTCwithHT_1HumanThyroidHT7.91e-11-8.72e-010.0238
10521DDX17PTCwithHT_6HumanThyroidHT8.86e-23-7.65e-010.02
10521DDX17PTCwithHT_8HumanThyroidHT6.48e-14-6.46e-010.0351
10521DDX17PTCwithoutHT_2HumanThyroidPTC7.99e-21-7.65e-010.0419
10521DDX17PTCwithoutHT_7HumanThyroidPTC8.54e-07-7.85e-010.0381
10521DDX17male-WTAHumanThyroidPTC3.78e-655.88e-010.1037
10521DDX17PTC01HumanThyroidPTC1.45e-106.21e-010.1899
10521DDX17PTC03HumanThyroidPTC3.73e-121.33e+000.1784
10521DDX17PTC04HumanThyroidPTC2.70e-681.71e+000.1927
10521DDX17PTC05HumanThyroidPTC3.06e-251.79e+000.2065
10521DDX17PTC06HumanThyroidPTC1.41e-672.34e+000.2057
10521DDX17PTC07HumanThyroidPTC7.26e-861.90e+000.2044
Page: 1 2 3 4 5 6 7 8 9 10 11 12 13 14 15 

check button Transcriptomic changes along malignancy continuum.
TissueExpression DynamicsAbbreviation
BreastThe image shows the transcriptomic changes along malignancy continuum.log2FC in expression of this searched gene in stem-like cells from each diseased tissue sample relative to stem-like cells in normal samples in each tissue plotted against the malignancy continuum. Samples are colored based on if they are from different disease stage.
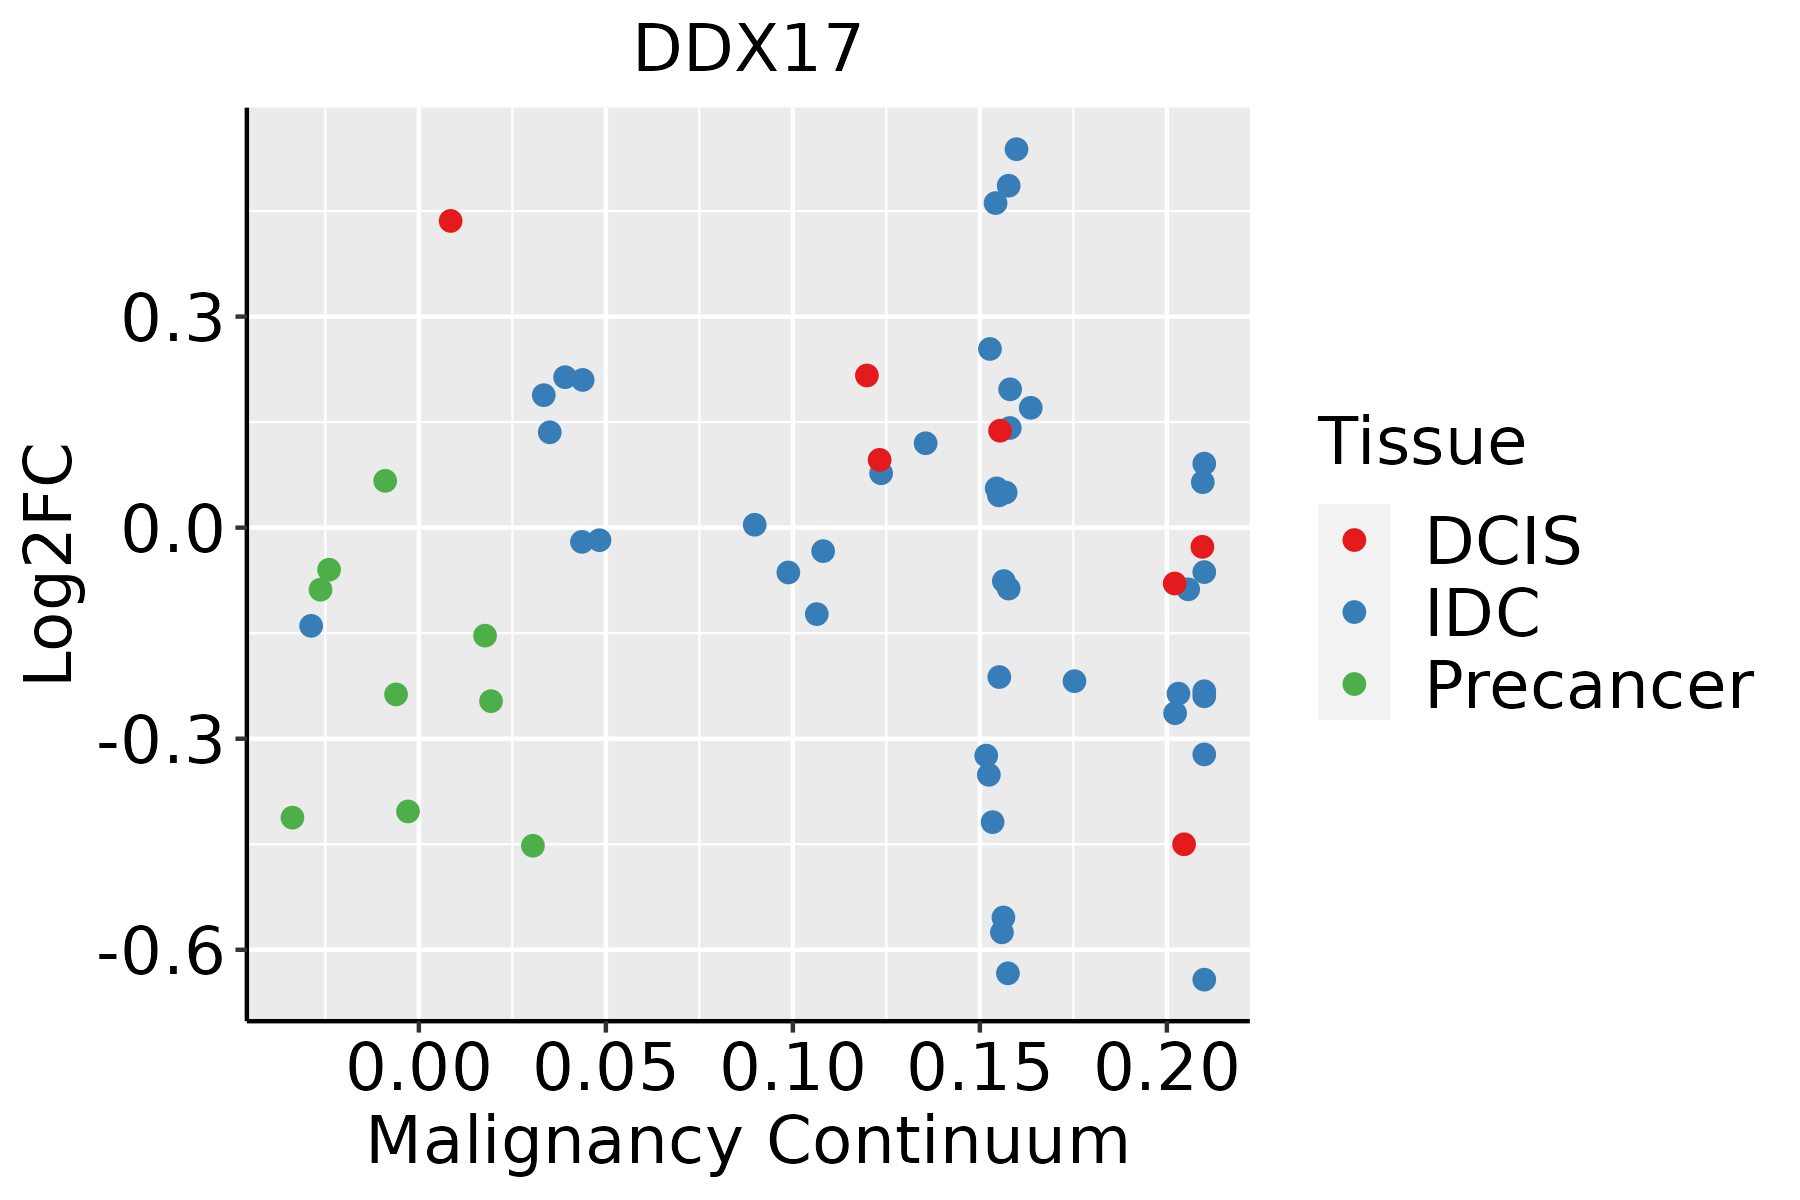
IDC: Invasive ductal carcinoma
DCIS: Ductal carcinoma in situ
Precancer(BRCA1-mut): Precancerous lesion from BRCA1 mutation carriers
Colorectum (GSE201348)The image shows the transcriptomic changes along malignancy continuum.log2FC in expression of this searched gene in stem-like cells from each diseased tissue sample relative to stem-like cells in normal samples in each tissue plotted against the malignancy continuum. Samples are colored based on if they are from different disease stage.FAP: Familial adenomatous polyposis
CRC: Colorectal cancer
Colorectum (HTA11)The image shows the transcriptomic changes along malignancy continuum.log2FC in expression of this searched gene in stem-like cells from each diseased tissue sample relative to stem-like cells in normal samples in each tissue plotted against the malignancy continuum. Samples are colored based on if they are from different disease stage.AD: Adenomas
SER: Sessile serrated lesions
MSI-H: Microsatellite-high colorectal cancer
MSS: Microsatellite stable colorectal cancer
EndometriumThe image shows the transcriptomic changes along malignancy continuum.log2FC in expression of this searched gene in stem-like cells from each diseased tissue sample relative to stem-like cells in normal samples in each tissue plotted against the malignancy continuum. Samples are colored based on if they are from different disease stage.
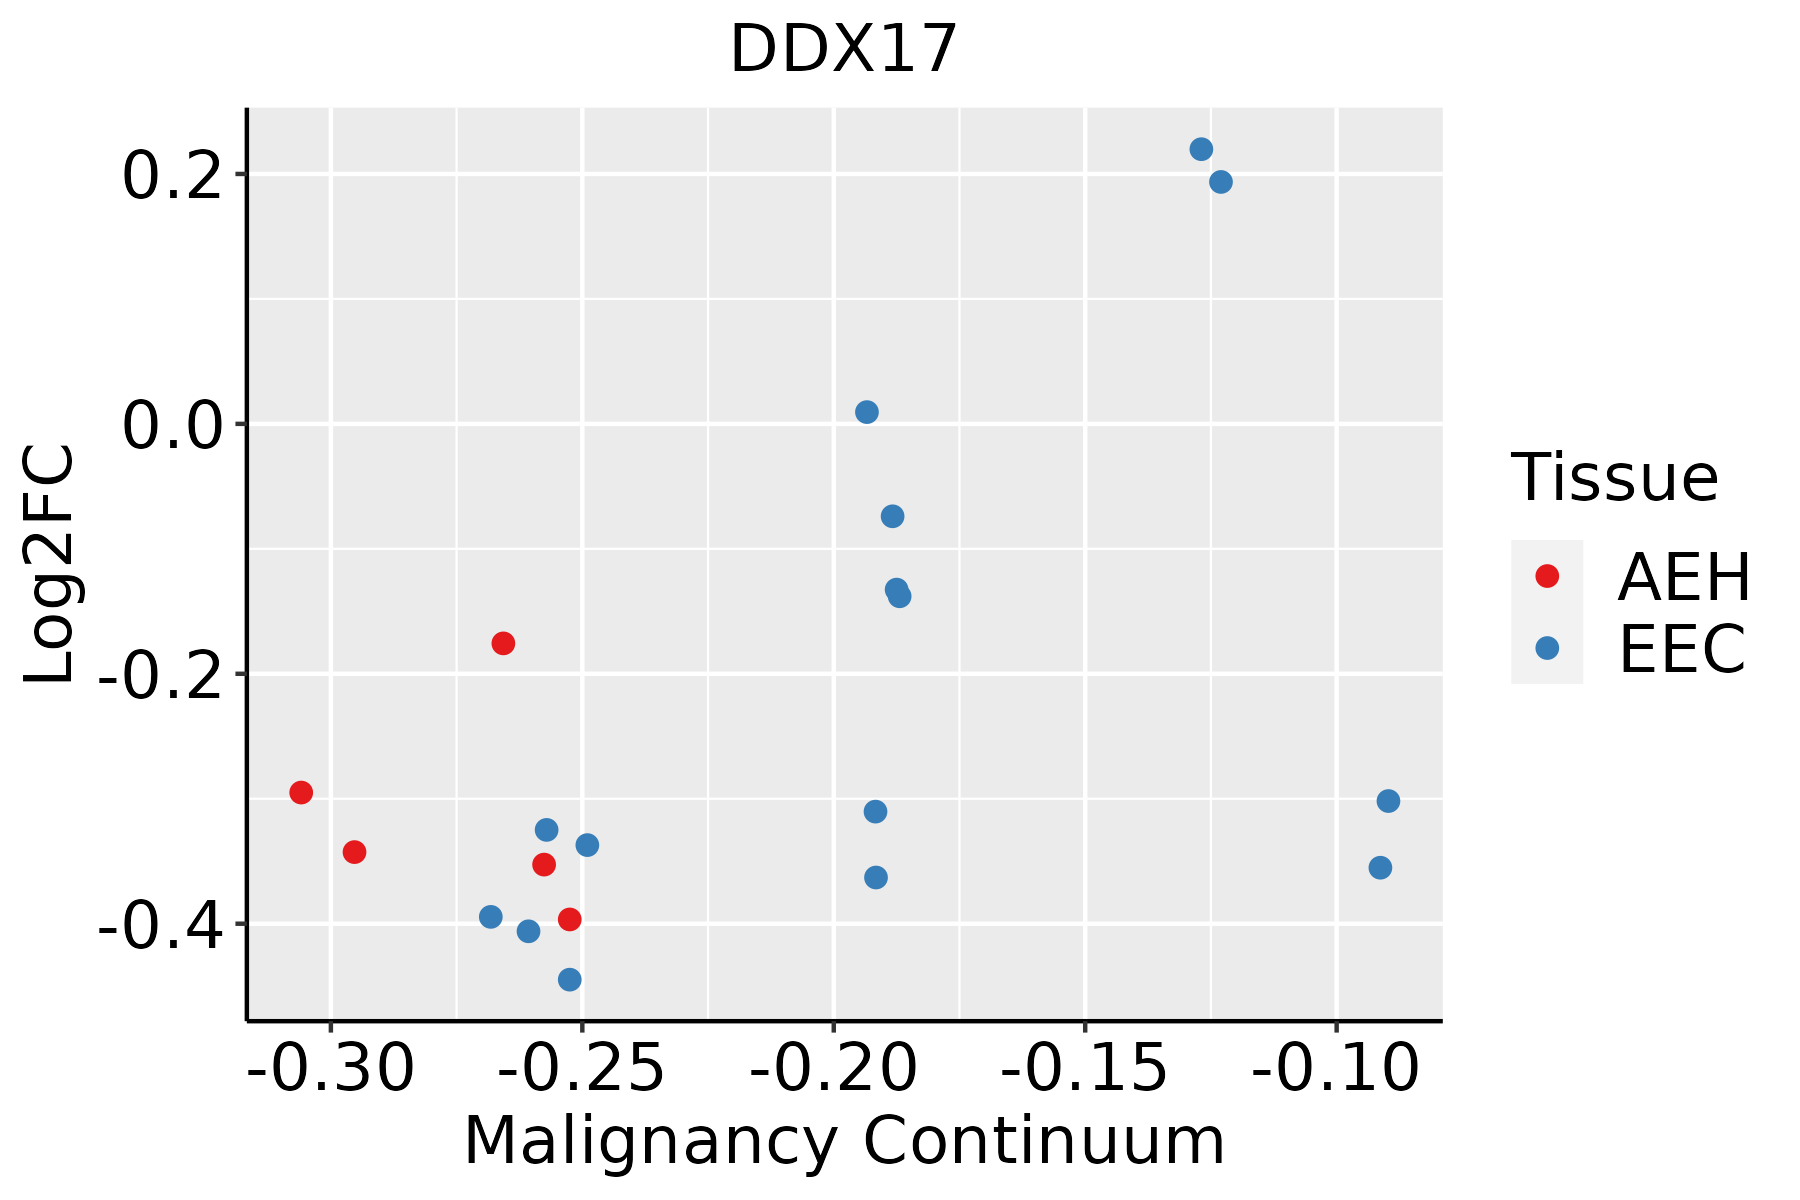
AEH: Atypical endometrial hyperplasia
EEC: Endometrioid Cancer
EsophagusThe image shows the transcriptomic changes along malignancy continuum.log2FC in expression of this searched gene in stem-like cells from each diseased tissue sample relative to stem-like cells in normal samples in each tissue plotted against the malignancy continuum. Samples are colored based on if they are from different disease stage.
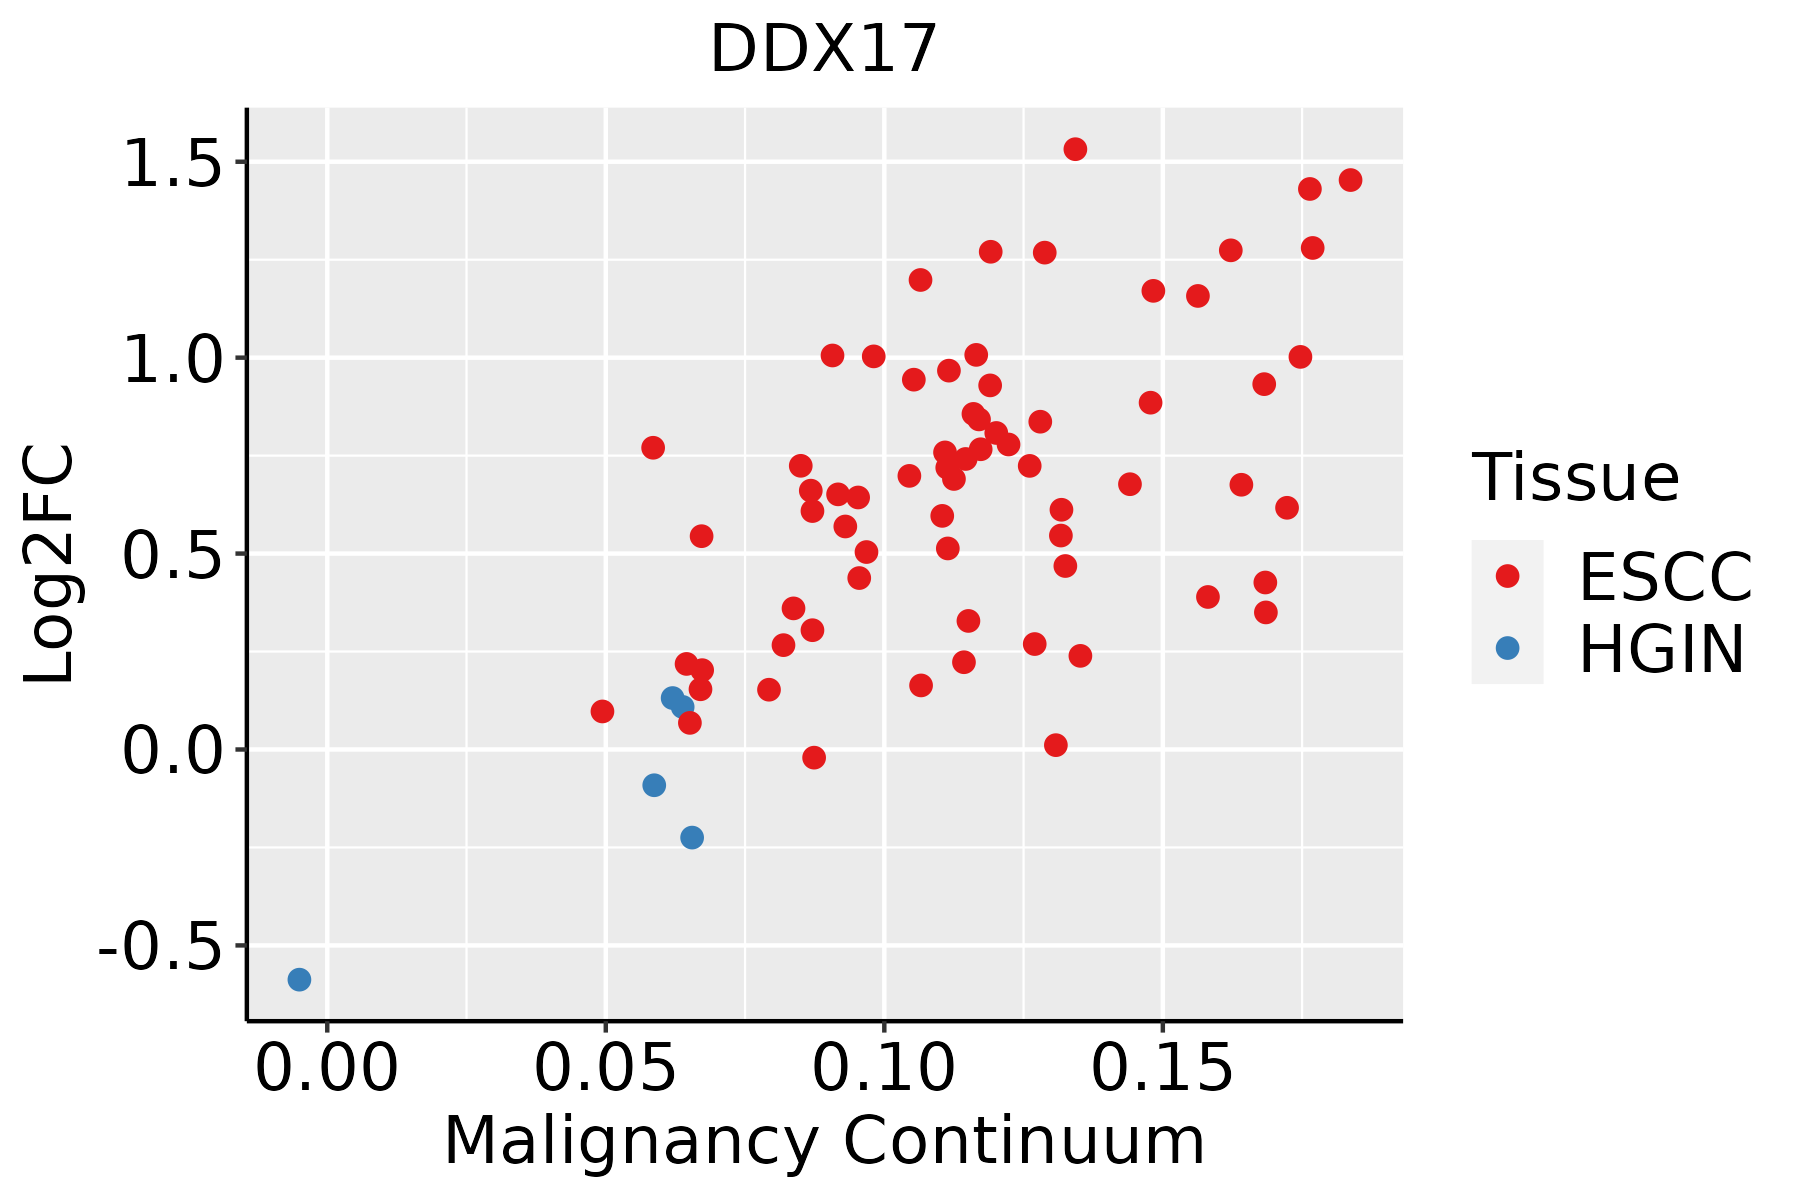
ESCC: Esophageal squamous cell carcinoma
HGIN: High-grade intraepithelial neoplasias
LGIN: Low-grade intraepithelial neoplasias
LiverThe image shows the transcriptomic changes along malignancy continuum.log2FC in expression of this searched gene in stem-like cells from each diseased tissue sample relative to stem-like cells in normal samples in each tissue plotted against the malignancy continuum. Samples are colored based on if they are from different disease stage.
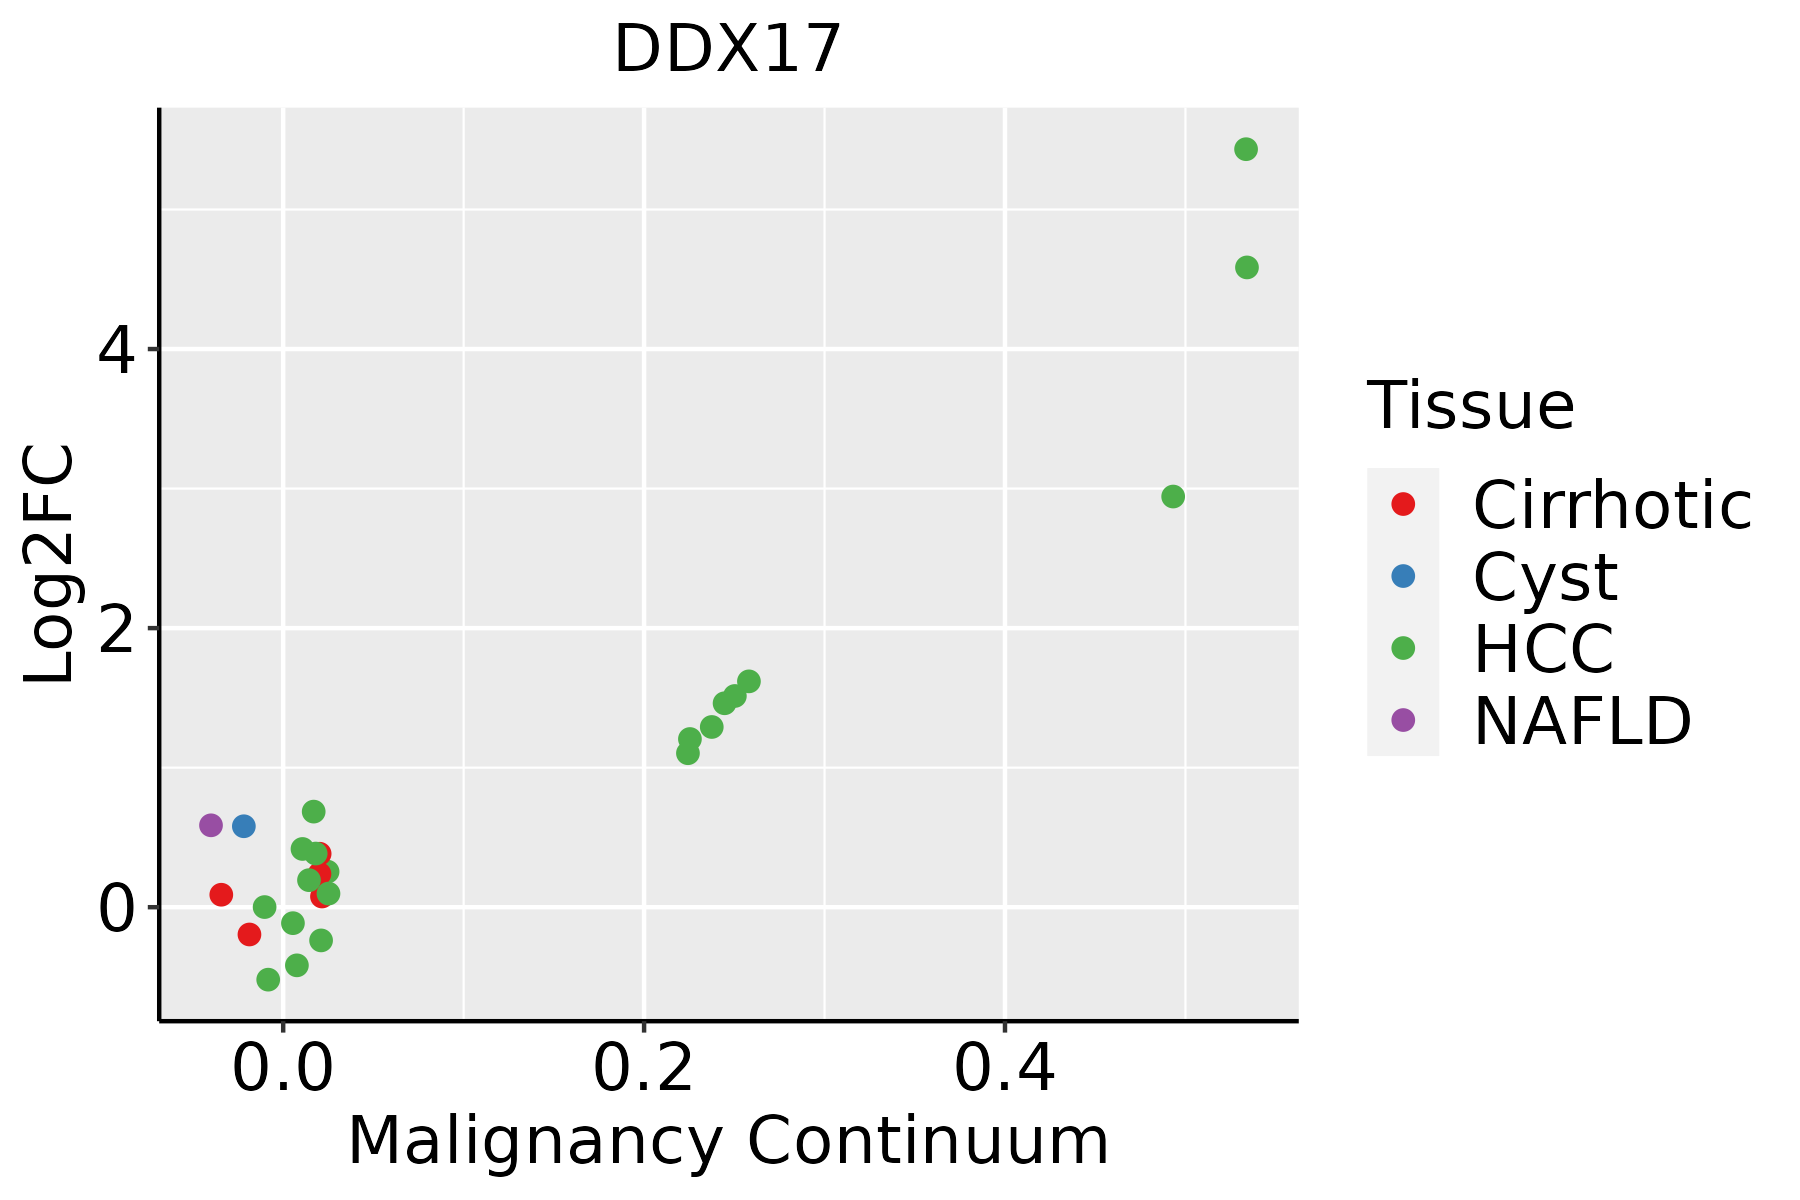
HCC: Hepatocellular carcinoma
NAFLD: Non-alcoholic fatty liver disease
LungThe image shows the transcriptomic changes along malignancy continuum.log2FC in expression of this searched gene in stem-like cells from each diseased tissue sample relative to stem-like cells in normal samples in each tissue plotted against the malignancy continuum. Samples are colored based on if they are from different disease stage.AAH: Atypical adenomatous hyperplasia
AIS: Adenocarcinoma in situ
IAC: Invasive lung adenocarcinoma
MIA: Minimally invasive adenocarcinoma
Oral CavityThe image shows the transcriptomic changes along malignancy continuum.log2FC in expression of this searched gene in stem-like cells from each diseased tissue sample relative to stem-like cells in normal samples in each tissue plotted against the malignancy continuum. Samples are colored based on if they are from different disease stage.EOLP: Erosive Oral lichen planus
LP: leukoplakia
NEOLP: Non-erosive oral lichen planus
OSCC: Oral squamous cell carcinoma
ProstateThe image shows the transcriptomic changes along malignancy continuum.log2FC in expression of this searched gene in stem-like cells from each diseased tissue sample relative to stem-like cells in normal samples in each tissue plotted against the malignancy continuum. Samples are colored based on if they are from different disease stage.BPH: Benign Prostatic Hyperplasia
SkinThe image shows the transcriptomic changes along malignancy continuum.log2FC in expression of this searched gene in stem-like cells from each diseased tissue sample relative to stem-like cells in normal samples in each tissue plotted against the malignancy continuum. Samples are colored based on if they are from different disease stage.
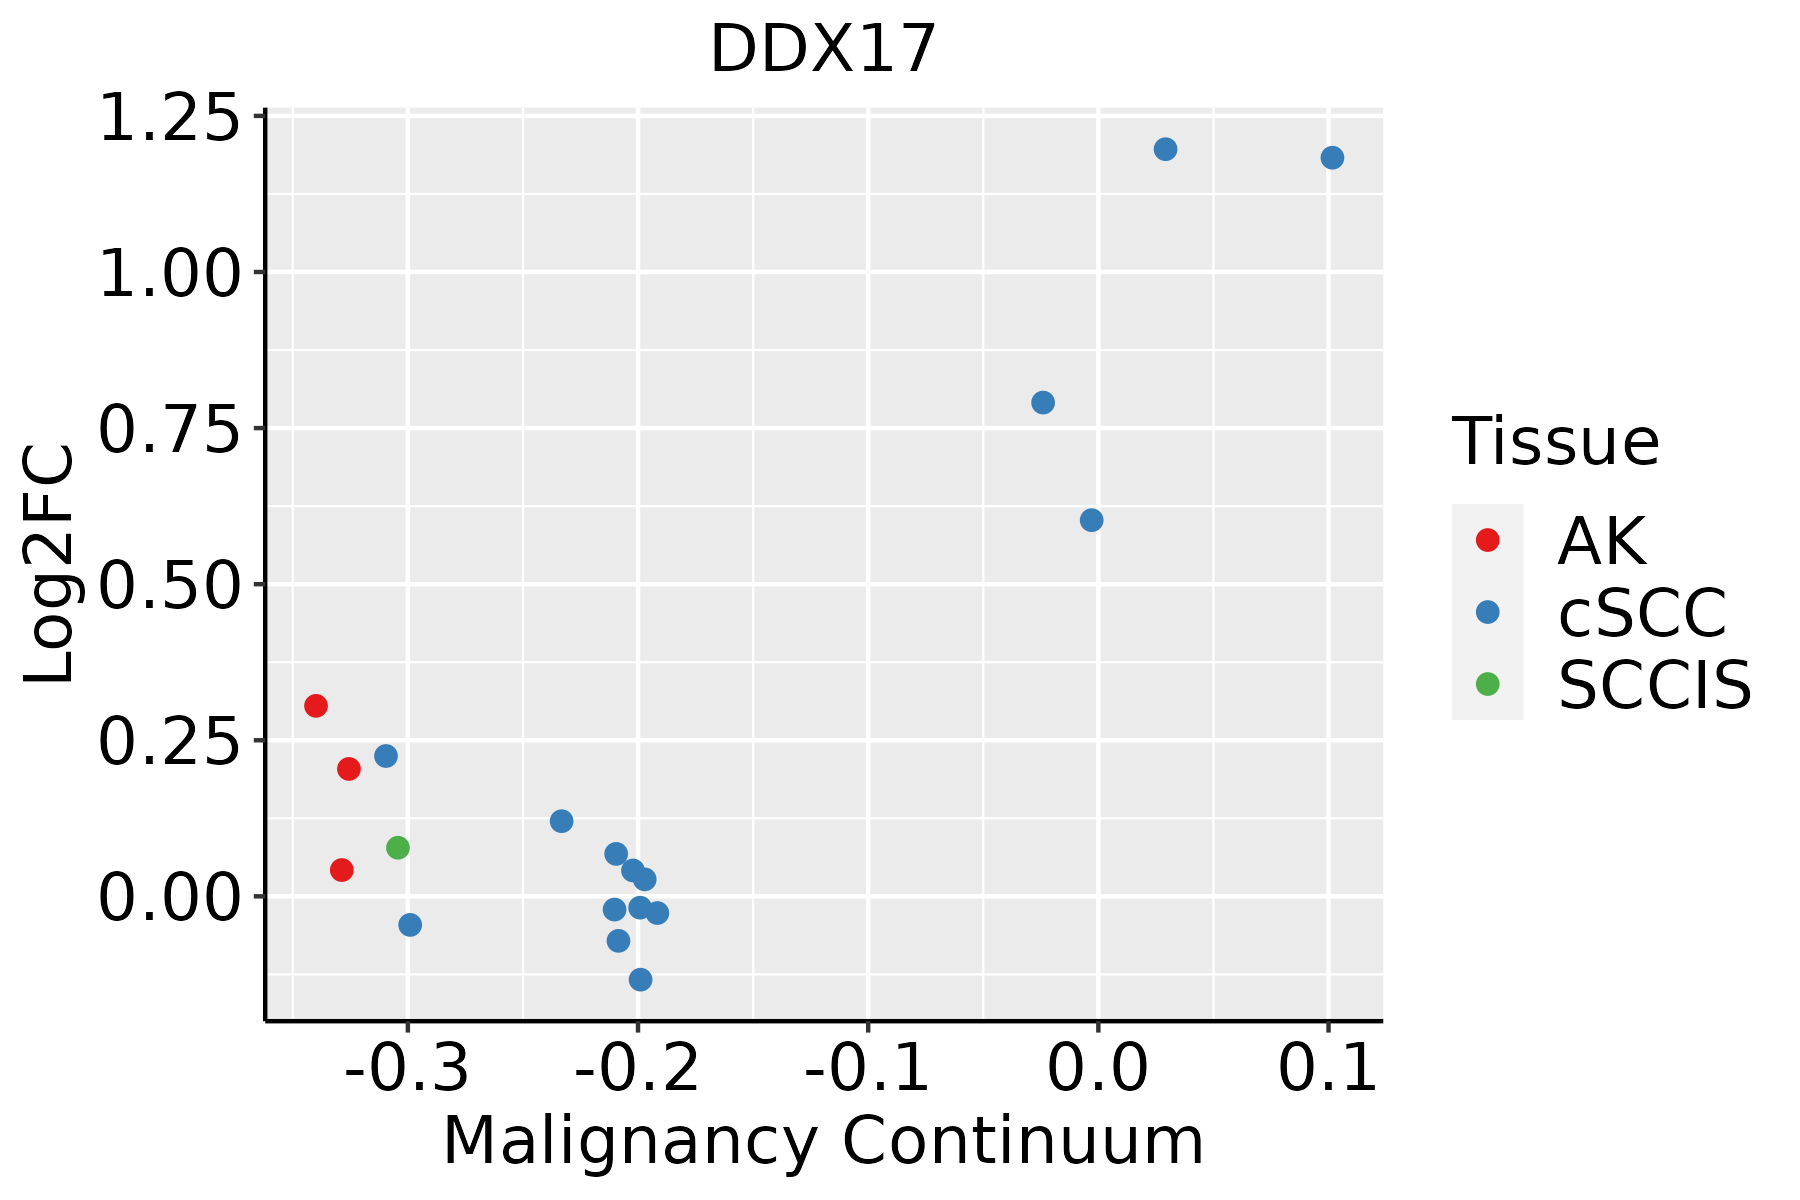
AK: Actinic keratosis
cSCC: Cutaneous squamous cell carcinoma
SCCIS:squamous cell carcinoma in situ
ThyroidThe image shows the transcriptomic changes along malignancy continuum.log2FC in expression of this searched gene in stem-like cells from each diseased tissue sample relative to stem-like cells in normal samples in each tissue plotted against the malignancy continuum. Samples are colored based on if they are from different disease stage.
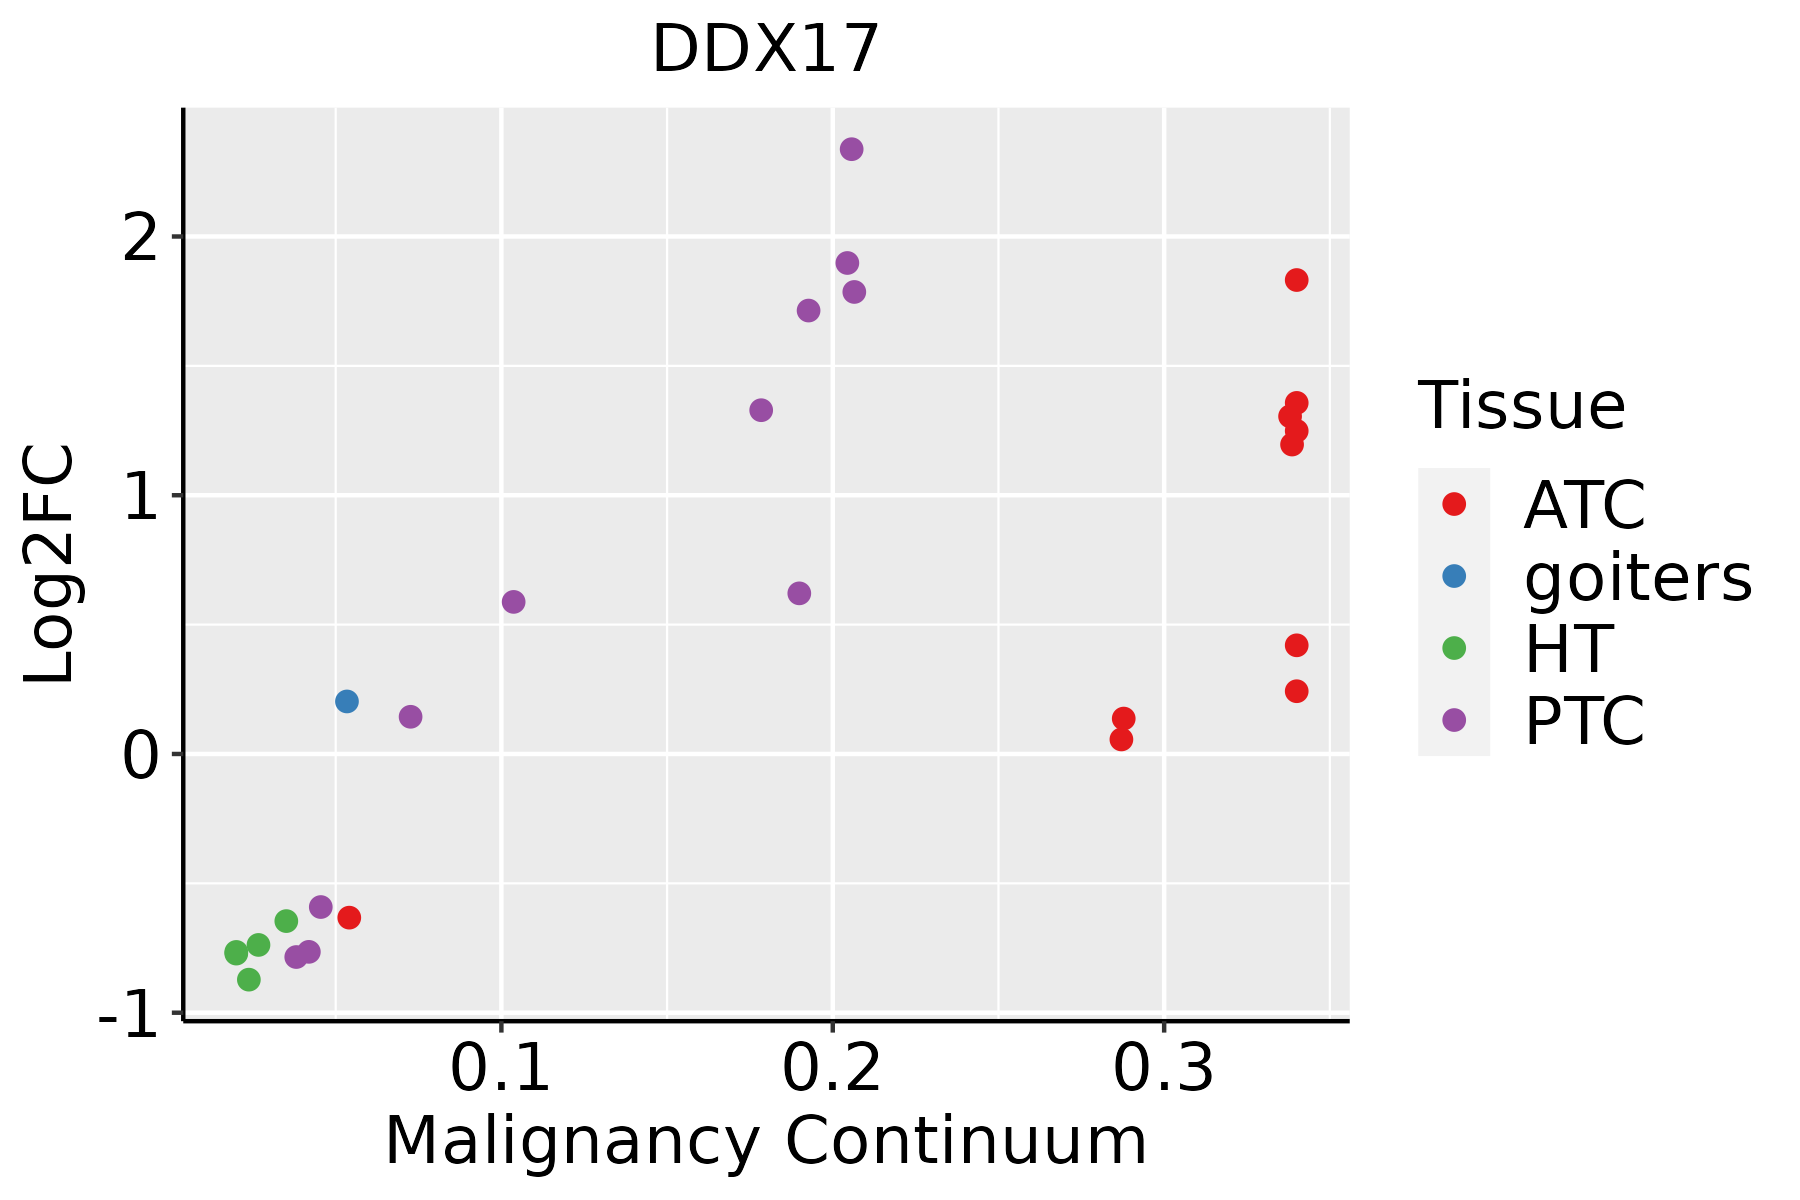
ATC: Anaplastic thyroid cancer
HT: Hashimoto's thyroiditis
PTC: Papillary thyroid cancer
∗log2FC in expression of this searched gene in stem-like cells from each diseased tissue sample relative to stem-like cells in normal samples in each tissue plotted against the malignancy continuum. Samples are colored based on if they are from different disease stage.

Top

Malignant transformation related pathway analysis

check buttonFind out the enriched GO biological processes and KEGG pathways involved in transition from healthy to precancer to cancer
check button Figure of enriched GO biological processes.
TissueDisease StageEnriched GO biological Processes
ColorectumADGO analysis - Figure of enriched GO biological processes: Top 15 enriched GO BP terms are showed in the bar plot of each disease state in each tissue. Each row represents a significant GO biological process which is colored according to the -log10(p.adjust).
ColorectumSERGO analysis - Figure of enriched GO biological processes: Top 15 enriched GO BP terms are showed in the bar plot of each disease state in each tissue. Each row represents a significant GO biological process which is colored according to the -log10(p.adjust).
ColorectumMSSGO analysis - Figure of enriched GO biological processes: Top 15 enriched GO BP terms are showed in the bar plot of each disease state in each tissue. Each row represents a significant GO biological process which is colored according to the -log10(p.adjust).
ColorectumMSI-HGO analysis - Figure of enriched GO biological processes: Top 15 enriched GO BP terms are showed in the bar plot of each disease state in each tissue. Each row represents a significant GO biological process which is colored according to the -log10(p.adjust).
ColorectumFAPGO analysis - Figure of enriched GO biological processes: Top 15 enriched GO BP terms are showed in the bar plot of each disease state in each tissue. Each row represents a significant GO biological process which is colored according to the -log10(p.adjust).
∗Top 15 enriched GO BP terms are showed in the bar plot of each disease state in each tissue. Each row represents a significant GO biological process which is colored according to the -log10(p.adjust).
Page: 1 2 3 4 5 6 7 8 9 

check button Enriched GO biological processes.
GO IDTissueDisease StageDescriptionGene RatioBg Ratiopvaluep.adjustCount
GO:00226139BreastPrecancerribonucleoprotein complex biogenesis79/1080463/187232.11e-181.03e-1579
GO:00422549BreastPrecancerribosome biogenesis52/1080299/187237.35e-131.51e-1052
GO:00083809BreastPrecancerRNA splicing65/1080434/187231.27e-122.53e-1065
GO:00434849BreastPrecancerregulation of RNA splicing34/1080148/187232.66e-124.75e-1034
GO:00003759BreastPrecancerRNA splicing, via transesterification reactions52/1080324/187231.74e-112.22e-0952
GO:00485459BreastPrecancerresponse to steroid hormone53/1080339/187233.07e-113.66e-0953
GO:00003779BreastPrecancerRNA splicing, via transesterification reactions with bulged adenosine as nucleophile51/1080320/187233.55e-114.04e-0951
GO:00003989BreastPrecancermRNA splicing, via spliceosome51/1080320/187233.55e-114.04e-0951
GO:00480249BreastPrecancerregulation of mRNA splicing, via spliceosome22/1080101/187235.29e-083.18e-0622
GO:00063646BreastPrecancerrRNA processing35/1080225/187237.90e-084.60e-0635
GO:00160726BreastPrecancerrRNA metabolic process36/1080236/187238.59e-084.84e-0636
GO:19033118BreastPrecancerregulation of mRNA metabolic process38/1080288/187231.63e-065.97e-0538
GO:00506848BreastPrecancerregulation of mRNA processing23/1080137/187233.49e-061.13e-0423
GO:00713838BreastPrecancercellular response to steroid hormone stimulus28/1080204/187231.78e-054.26e-0428
GO:00003808BreastPrecanceralternative mRNA splicing, via spliceosome15/108077/187232.86e-056.37e-0415
GO:00003818BreastPrecancerregulation of alternative mRNA splicing, via spliceosome13/108060/187232.98e-056.58e-0413
GO:00344705BreastPrecancerncRNA processing42/1080395/187239.91e-051.83e-0342
GO:00305217BreastPrecancerandrogen receptor signaling pathway10/108044/187231.61e-042.69e-0310
GO:00305187BreastPrecancerintracellular steroid hormone receptor signaling pathway16/1080116/187231.01e-031.13e-0216
GO:00346604BreastPrecancerncRNA metabolic process45/1080485/187231.15e-031.26e-0245
Page: 1 2 3 4 5 6 7 8 9 10 11 12 13 14 15 16 17 18 19 20 21 22 23 24 25 26 27 28 29 30 31 32 33 34 35 36 37 38 39 40 41 42 

check button Enriched KEGG pathways.
Pathway IDTissueDisease StageDescriptionGene RatioBg Ratiopvaluep.adjustqvalueCount
Page: 1 

Top

Cell-cell communication analysis

check buttonIdentification of potential cell-cell interactions between two cell types and their ligand-receptor pairs for different disease states
LigandReceptorLRpairPathwayTissueDisease Stage
Page: 1 

Top

Single-cell gene regulatory network inference analysis

check buttonFind out the significant the regulons (TFs) and the target genes of each regulon across cell types for different disease states
TFCell TypeTissueDisease StageTarget GeneRSSRegulon Activity
∗The dot plots of a searched regulon are shown for all cell subpopulations in each disease state of each tissue based on the regulon specific score inferred using pySCENIC and by calculating the average expression.
Page: 1 

Top

Somatic mutation of malignant transformation related genes

check buttonAnnotation of somatic variants for genes involved in malignant transformation
Hugo SymbolVariant ClassVariant ClassificationdbSNP RSHGVScHGVSpHGVSp ShortSWISSPROTBIOTYPESIFTPolyPhenTumor Sample BarcodeTissueHistologySexAgeStageTherapy TypesDrugsOutcome
DDX17SNVMissense_Mutationnovelc.793N>Tp.Asp265Tyrp.D265Yprotein_codingtolerated(0.78)benign(0.018)TCGA-A2-A0ER-01Breastbreast invasive carcinomaFemale<65I/IIChemotherapycytoxanSD
DDX17SNVMissense_Mutationnovelc.1427N>Gp.Asp476Glyp.D476Gprotein_codingdeleterious(0)probably_damaging(0.916)TCGA-AQ-A7U7-01Breastbreast invasive carcinomaFemale<65III/IVTargeted Molecular therapyrituximabCR
DDX17SNVMissense_Mutationc.1262C>Ap.Thr421Lysp.T421Kprotein_codingdeleterious(0)probably_damaging(0.999)TCGA-BH-A0H3-01Breastbreast invasive carcinomaFemale<65I/IIUnknownUnknownSD
DDX17SNVMissense_Mutationc.815N>Cp.Arg272Thrp.R272Tprotein_codingdeleterious(0.01)probably_damaging(0.998)TCGA-BH-A1FC-01Breastbreast invasive carcinomaFemale>=65I/IIUnknownUnknownSD
DDX17SNVMissense_Mutationrs762058898c.1963N>Gp.Gln655Glup.Q655Eprotein_codingtolerated_low_confidence(0.14)benign(0.014)TCGA-EW-A1J5-01Breastbreast invasive carcinomaFemale<65I/IIChemotherapyadriamycinSD
DDX17insertionFrame_Shift_Insnovelc.1168_1169insAGCTTp.Ile390LysfsTer6p.I390Kfs*6protein_codingTCGA-A2-A0CP-01Breastbreast invasive carcinomaFemale<65I/IIChemotherapycytoxanSD
DDX17insertionIn_Frame_Insnovelc.1166_1167insAACAAAACAAAACTTAGCp.Asn389delinsLysThrLysGlnAsnLeuAlap.N389delinsKTKQNLAprotein_codingTCGA-A2-A0CP-01Breastbreast invasive carcinomaFemale<65I/IIChemotherapycytoxanSD
DDX17insertionFrame_Shift_Insnovelc.946_947insAGp.Leu316GlnfsTer39p.L316Qfs*39protein_codingTCGA-A8-A07O-01Breastbreast invasive carcinomaFemale<65I/IIChemotherapyCR
DDX17insertionNonsense_Mutationnovelc.945_946insTTGAAATTTTAACATGGTTATGTAAAp.Arg317LysfsTer3p.R317Kfs*3protein_codingTCGA-A8-A07O-01Breastbreast invasive carcinomaFemale<65I/IIChemotherapyCR
DDX17insertionNonsense_Mutationnovelc.942_943insTTGTTGGTCATGTTTTCAGGTTGATCCAACTAATGGp.Thr314_Asn315insLeuLeuValMetPheSerGlyTerSerAsnTerTrpp.T314_N315insLLVMFSG*SN*Wprotein_codingTCGA-AN-A0FN-01Breastbreast invasive carcinomaFemale<65I/IIUnknownUnknownSD
Page: 1 2 3 4 5 6 7 8 9 

Top

Related drugs of malignant transformation related genes

check buttonIdentification of chemicals and drugs interact with genes involved in malignant transfromation
(DGIdb 4.0)
Entrez IDSymbolCategoryInteraction TypesDrug Claim NameDrug NamePMIDs
Page: 1