
|
|||||
|
 | |
| |
| |
| |
| |
| |
|
Gene: TOMM20 |
Gene summary for TOMM20 |
| Gene information | Species | Human | Gene symbol | TOMM20 | Gene ID | 9804 |
| Gene name | translocase of outer mitochondrial membrane 20 | |
| Gene Alias | MAS20 | |
| Cytomap | 1q42.3 | |
| Gene Type | protein-coding | GO ID | GO:0001101 | UniProtAcc | A0A024R3W2 |
Top |
Malignant transformation analysis |
| Identification of the aberrant gene expression in precancerous and cancerous lesions by comparing the gene expression of stem-like cells in diseased tissues with normal stem cells |
| Entrez ID | Symbol | Replicates | Species | Organ | Tissue | Adj P-value | Log2FC | Malignancy |
| 9804 | TOMM20 | ATC09 | Human | Thyroid | ATC | 5.07e-10 | -1.46e-01 | 0.2871 |
| 9804 | TOMM20 | ATC11 | Human | Thyroid | ATC | 1.67e-03 | 3.93e-01 | 0.3386 |
| 9804 | TOMM20 | ATC12 | Human | Thyroid | ATC | 6.61e-10 | 4.18e-01 | 0.34 |
| 9804 | TOMM20 | ATC13 | Human | Thyroid | ATC | 1.45e-16 | 7.03e-01 | 0.34 |
| 9804 | TOMM20 | ATC1 | Human | Thyroid | ATC | 2.41e-08 | -6.53e-02 | 0.2878 |
| 9804 | TOMM20 | ATC2 | Human | Thyroid | ATC | 1.82e-15 | 1.80e+00 | 0.34 |
| 9804 | TOMM20 | ATC3 | Human | Thyroid | ATC | 3.09e-08 | 2.19e-01 | 0.338 |
| 9804 | TOMM20 | ATC4 | Human | Thyroid | ATC | 3.37e-15 | 6.35e-01 | 0.34 |
| 9804 | TOMM20 | ATC5 | Human | Thyroid | ATC | 1.44e-20 | 8.04e-01 | 0.34 |
| Page: 1 2 3 4 5 6 7 8 9 10 11 12 13 |
| Tissue | Expression Dynamics | Abbreviation |
| Breast | 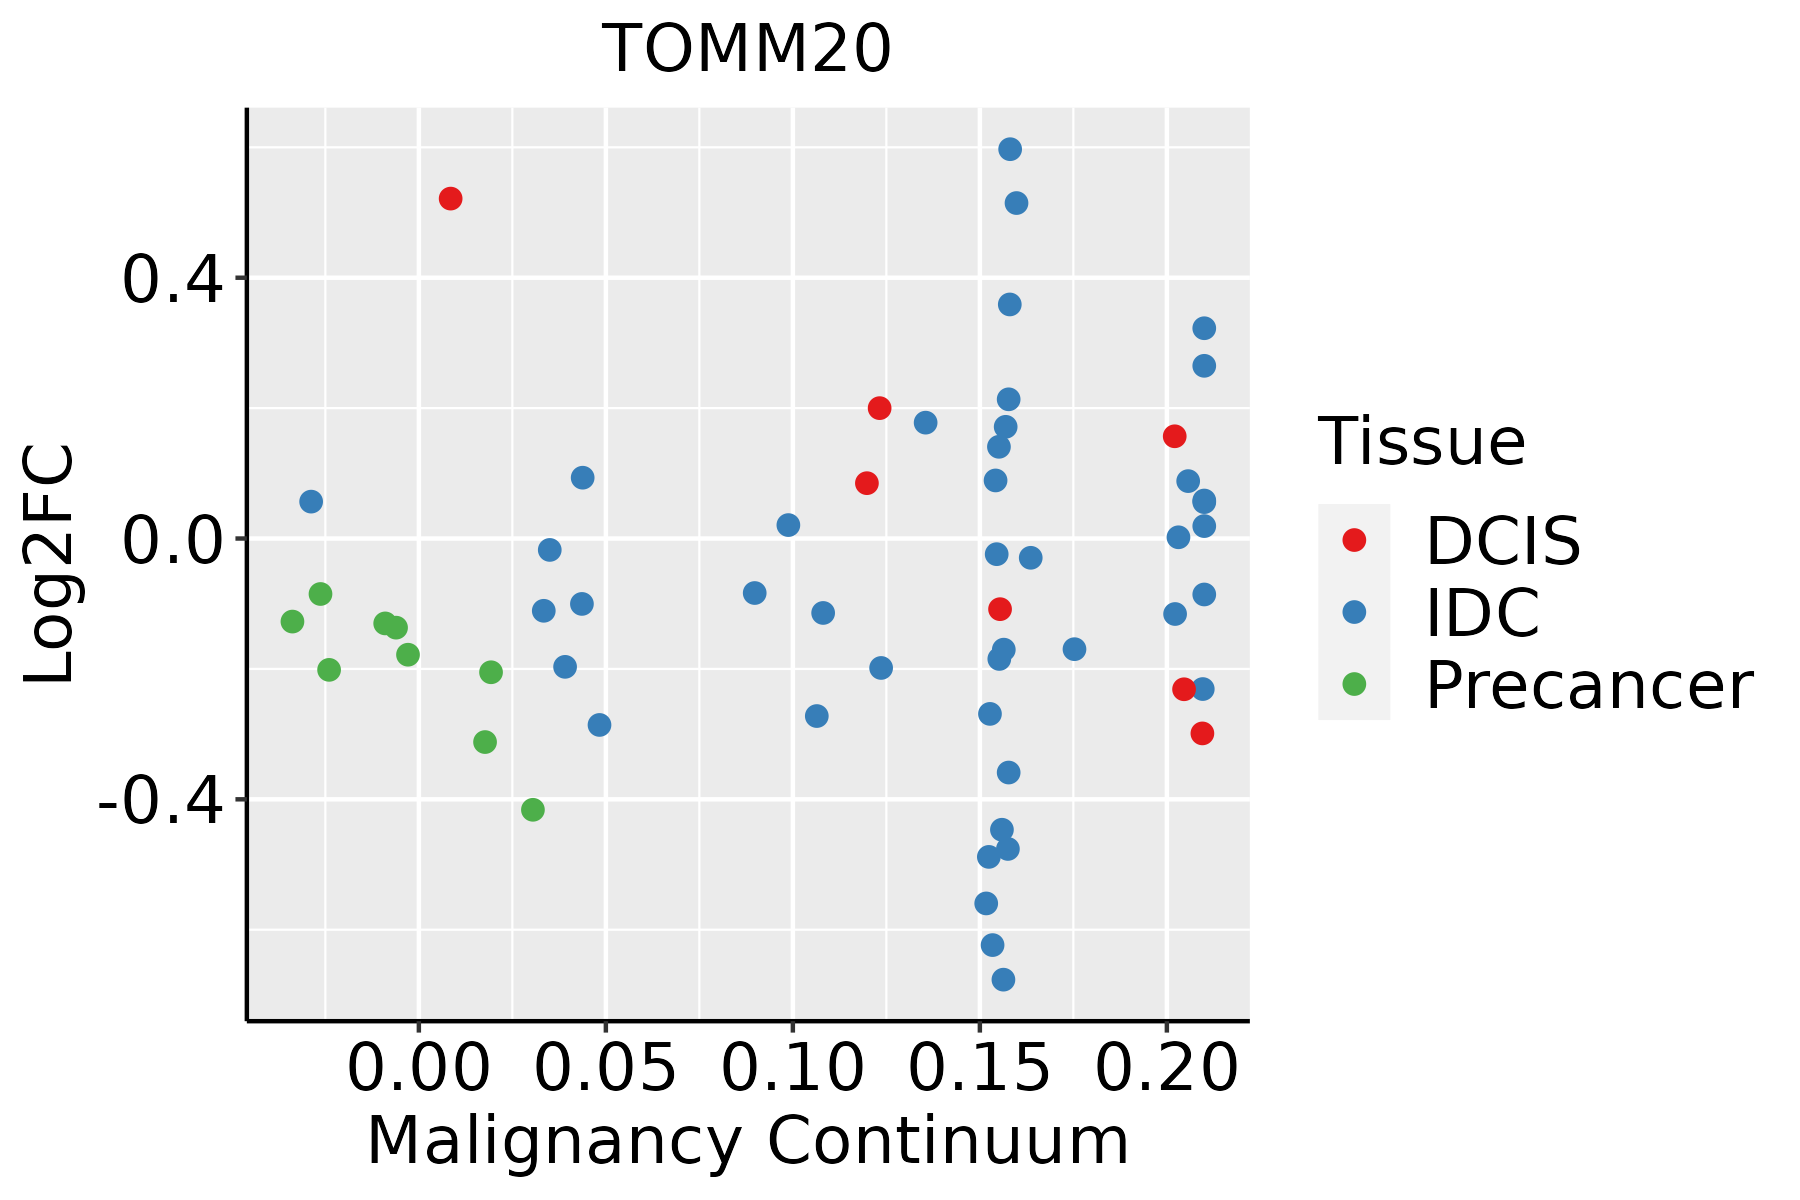 | IDC: Invasive ductal carcinoma |
| DCIS: Ductal carcinoma in situ | ||
| Precancer(BRCA1-mut): Precancerous lesion from BRCA1 mutation carriers | ||
| Cervix | 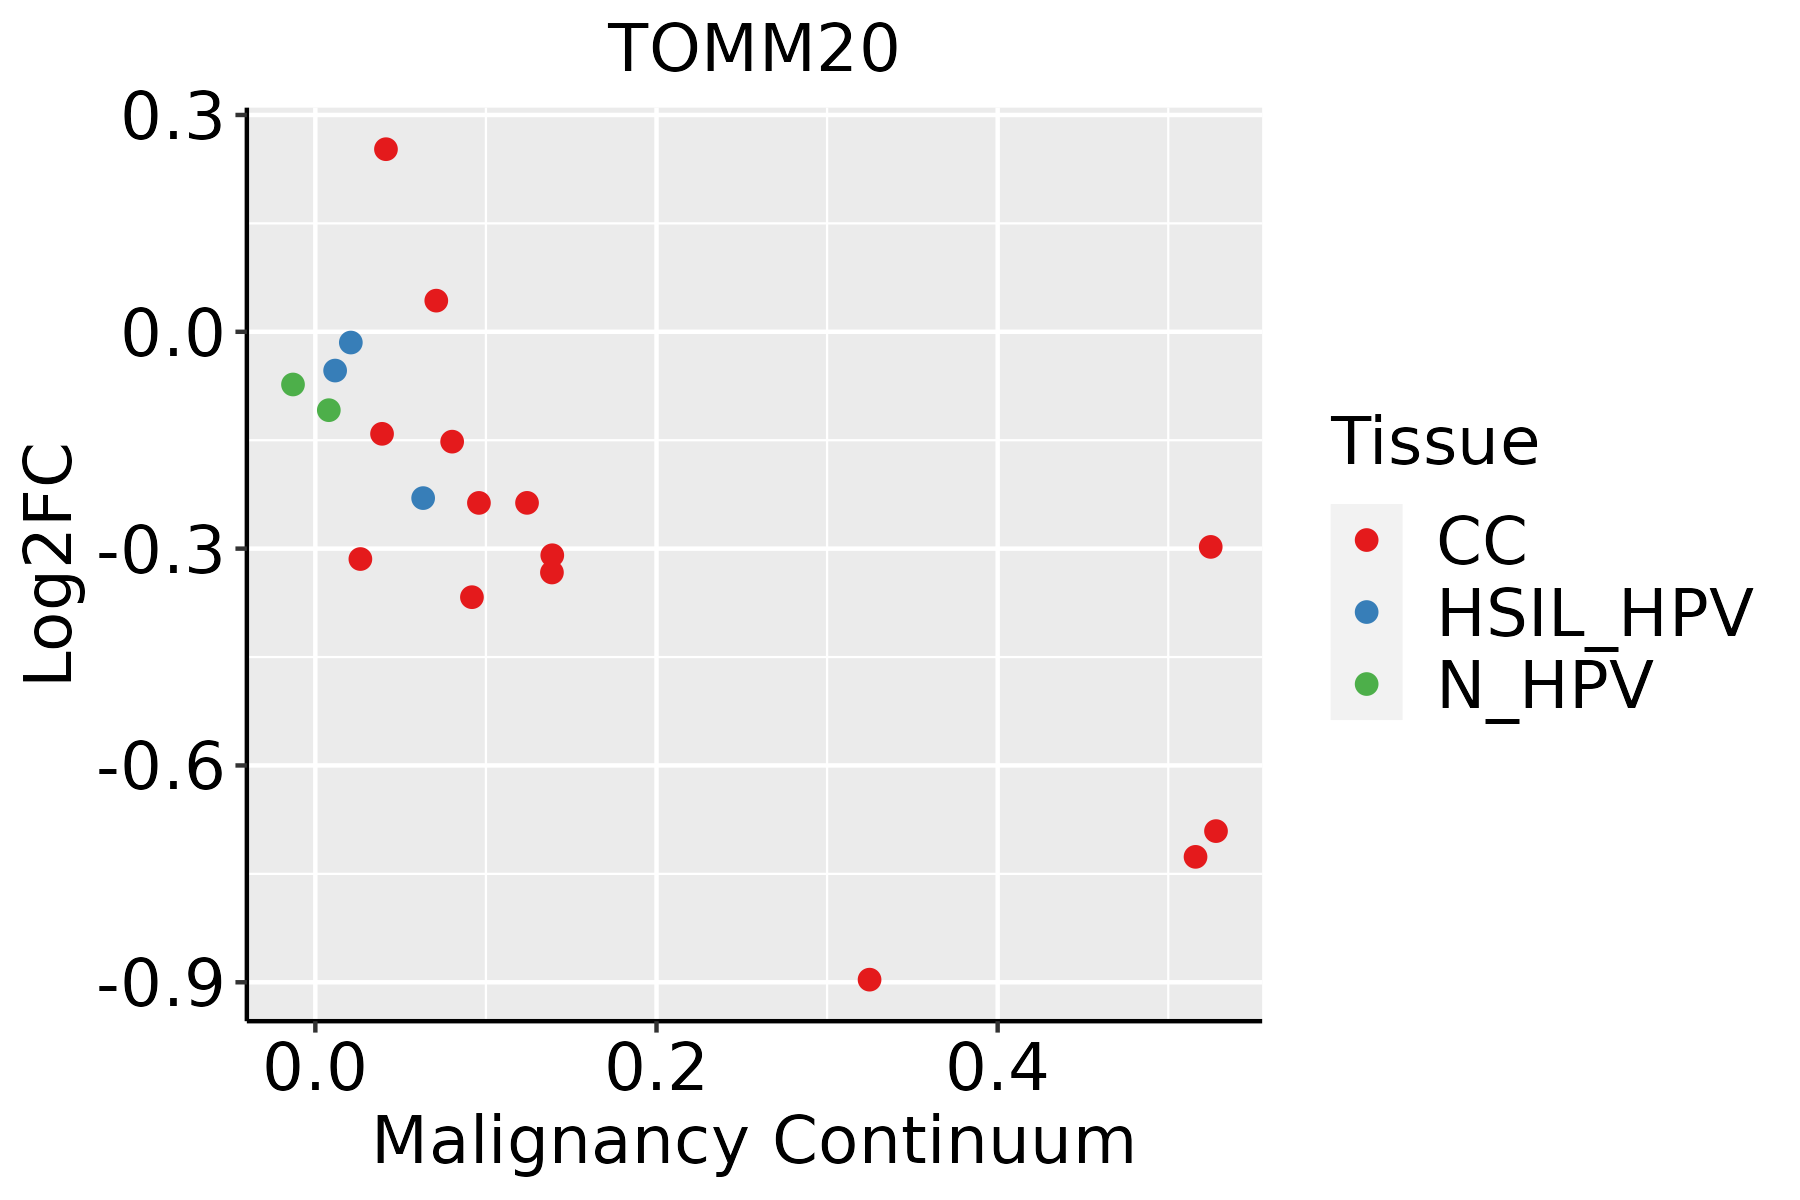 | CC: Cervix cancer |
| HSIL_HPV: HPV-infected high-grade squamous intraepithelial lesions | ||
| N_HPV: HPV-infected normal cervix | ||
| Colorectum (GSE201348) | 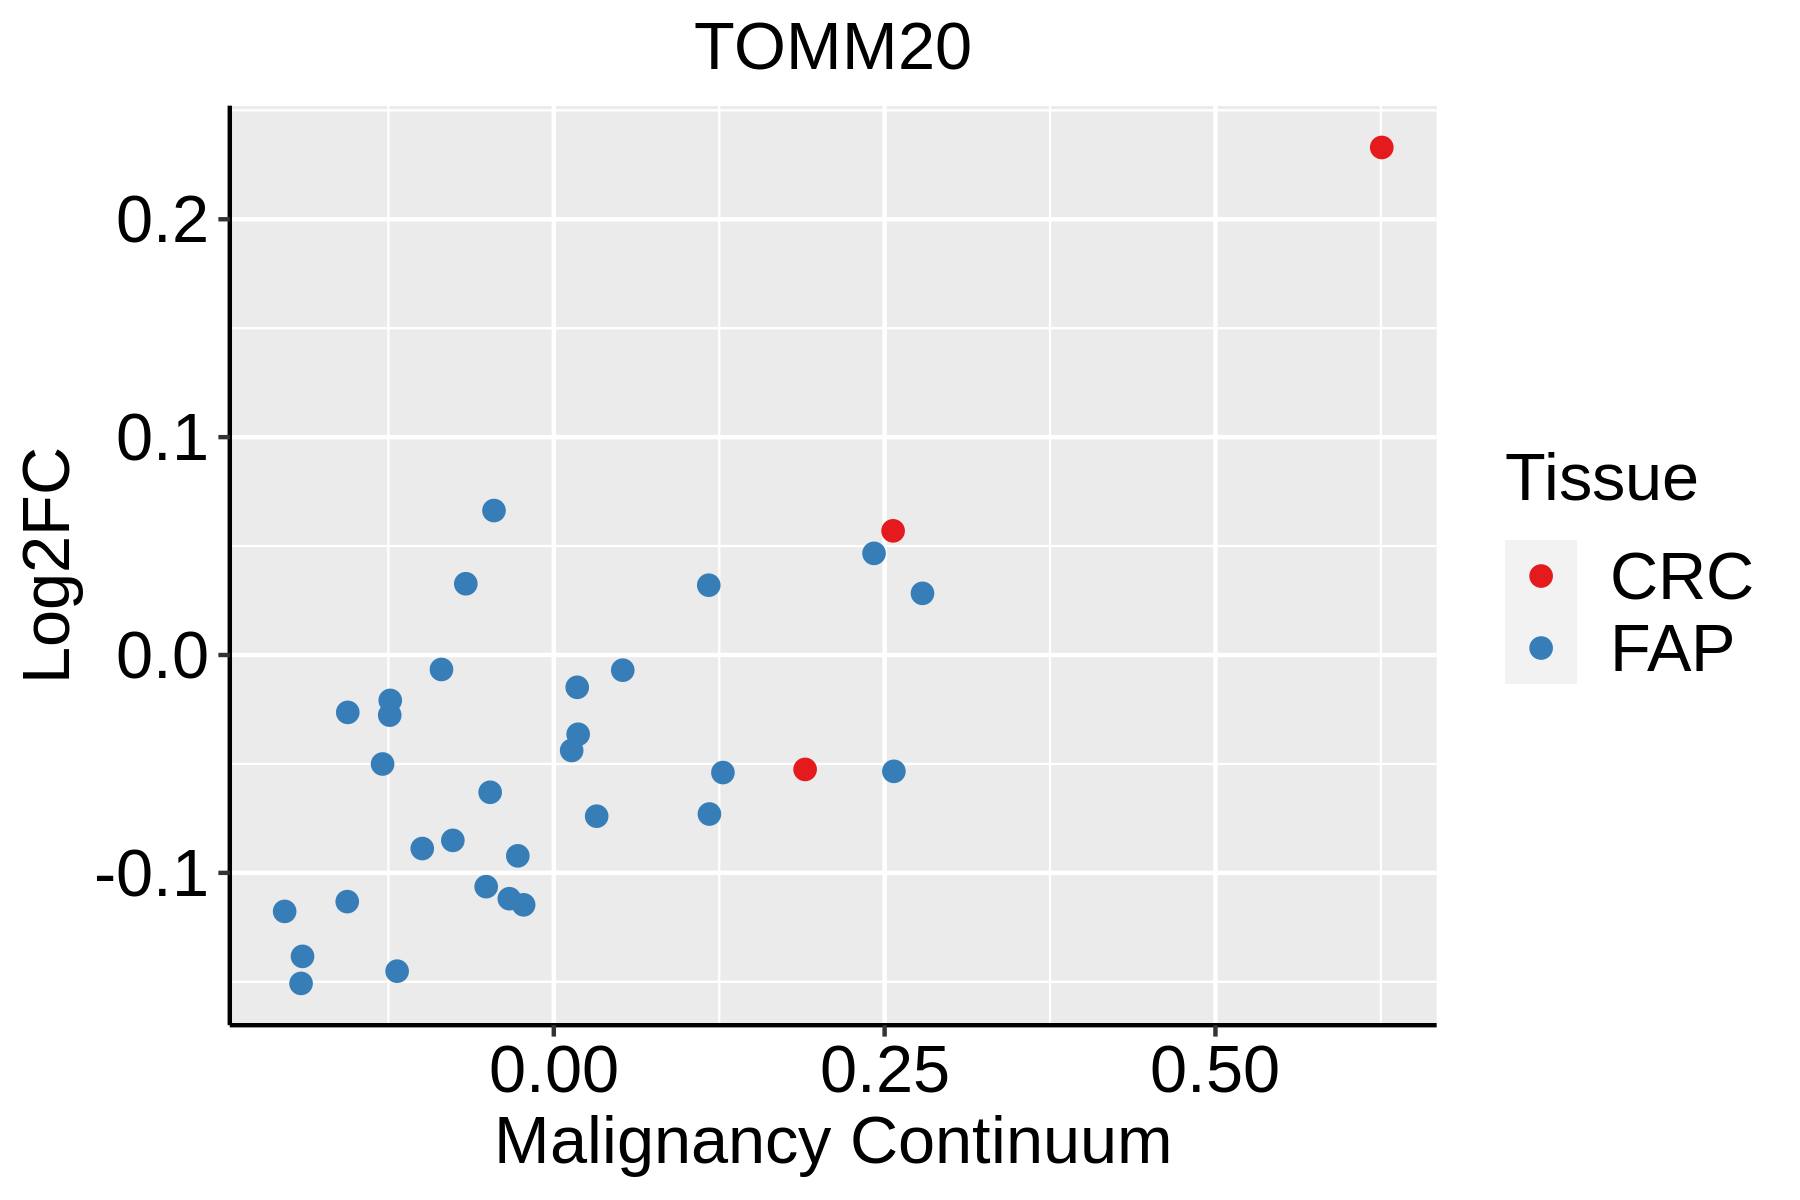 | FAP: Familial adenomatous polyposis |
| CRC: Colorectal cancer | ||
| Colorectum (HTA11) |  | AD: Adenomas |
| SER: Sessile serrated lesions | ||
| MSI-H: Microsatellite-high colorectal cancer | ||
| MSS: Microsatellite stable colorectal cancer | ||
| Endometrium | 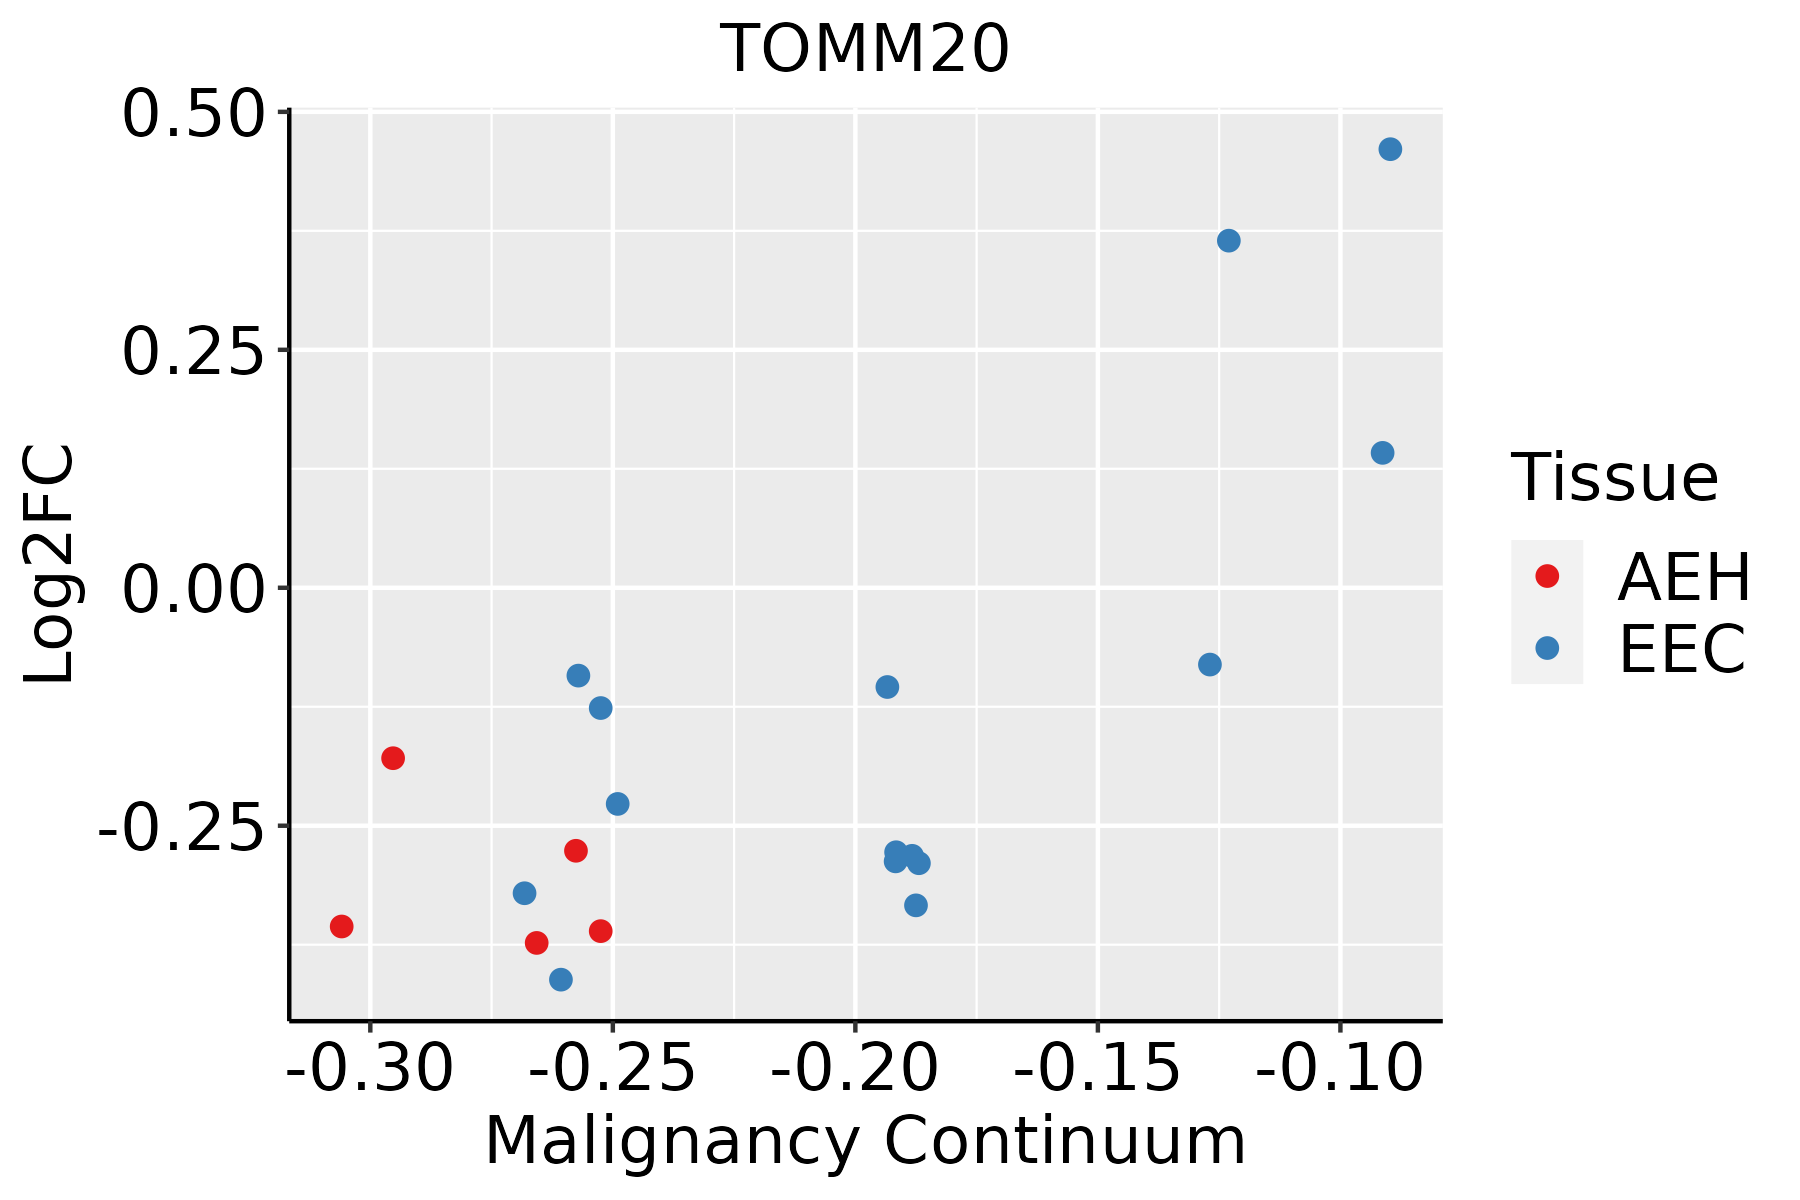 | AEH: Atypical endometrial hyperplasia |
| EEC: Endometrioid Cancer | ||
| Esophagus | 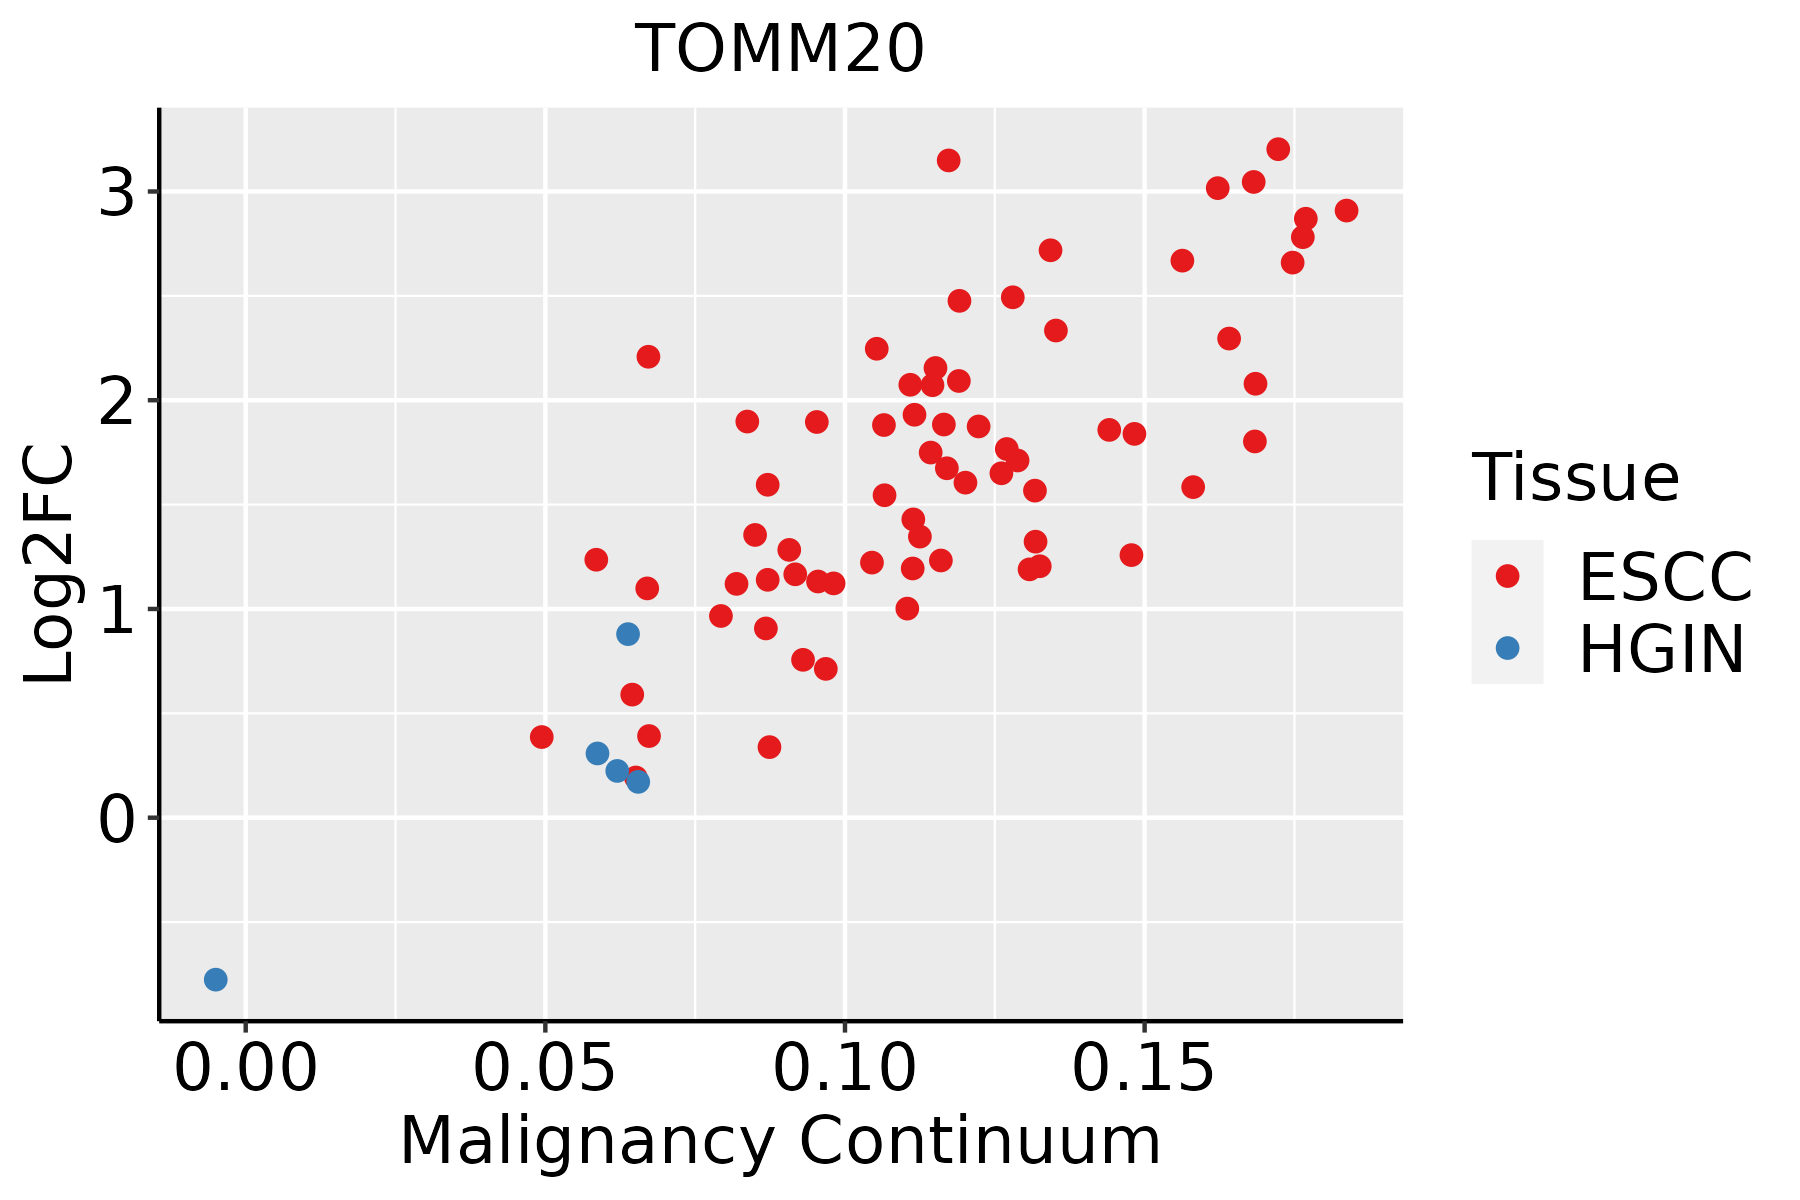 | ESCC: Esophageal squamous cell carcinoma |
| HGIN: High-grade intraepithelial neoplasias | ||
| LGIN: Low-grade intraepithelial neoplasias | ||
| Liver |  | HCC: Hepatocellular carcinoma |
| NAFLD: Non-alcoholic fatty liver disease | ||
| Oral Cavity | 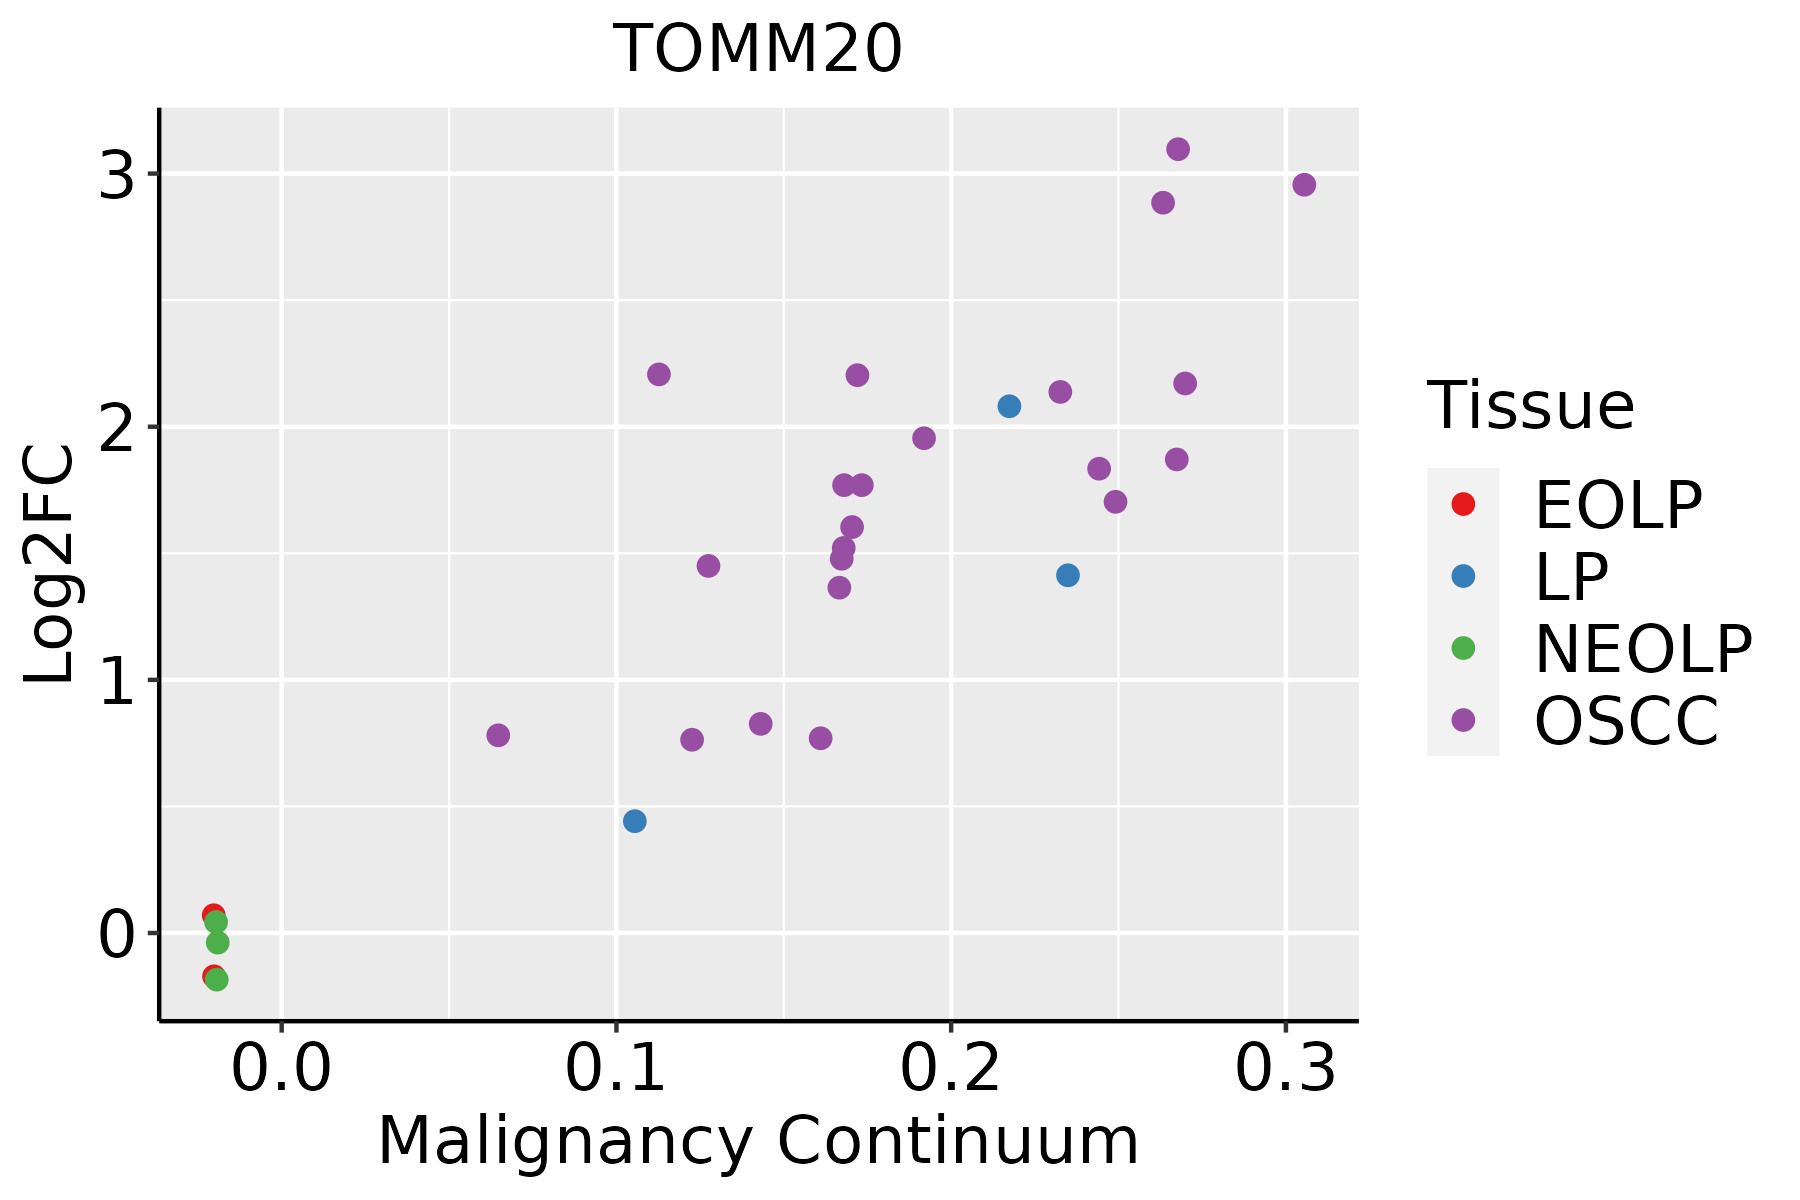 | EOLP: Erosive Oral lichen planus |
| LP: leukoplakia | ||
| NEOLP: Non-erosive oral lichen planus | ||
| OSCC: Oral squamous cell carcinoma | ||
| Prostate | 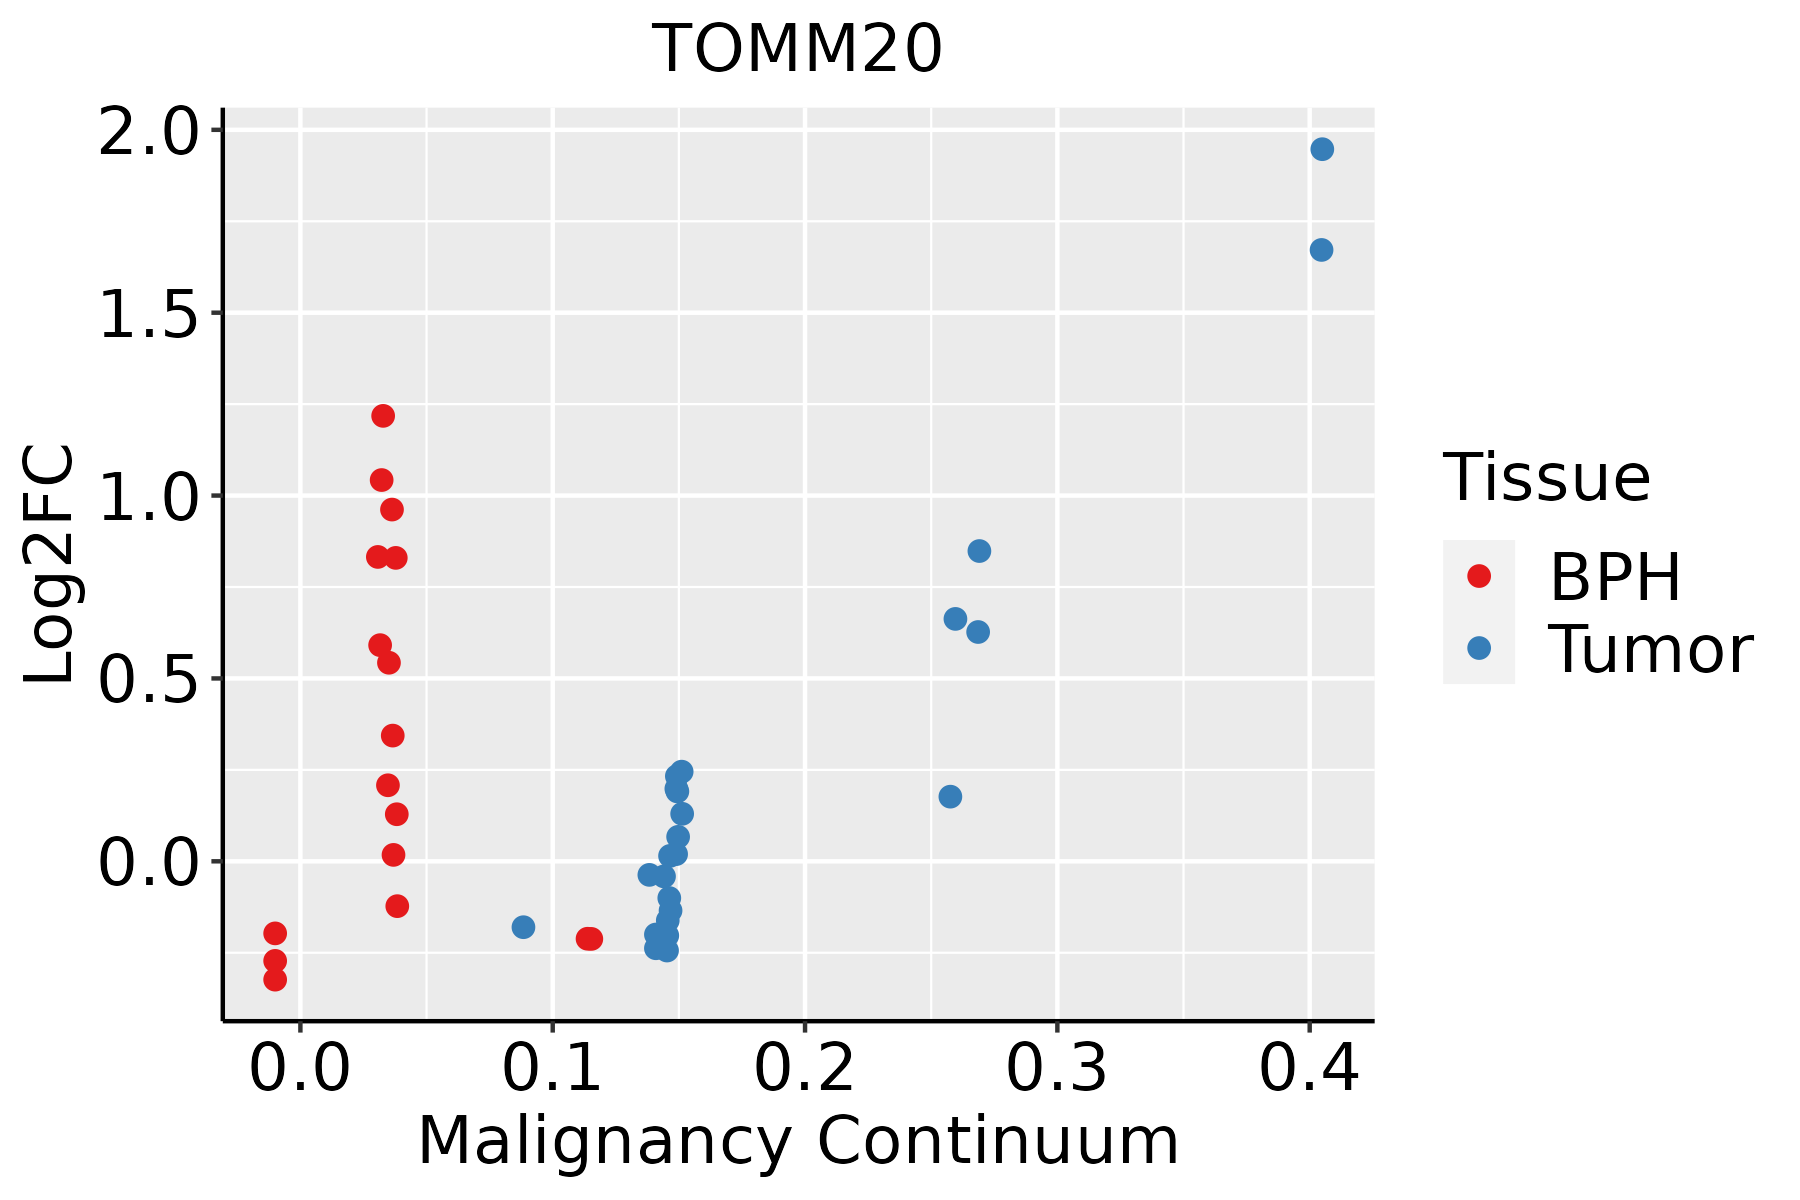 | BPH: Benign Prostatic Hyperplasia |
| Skin | 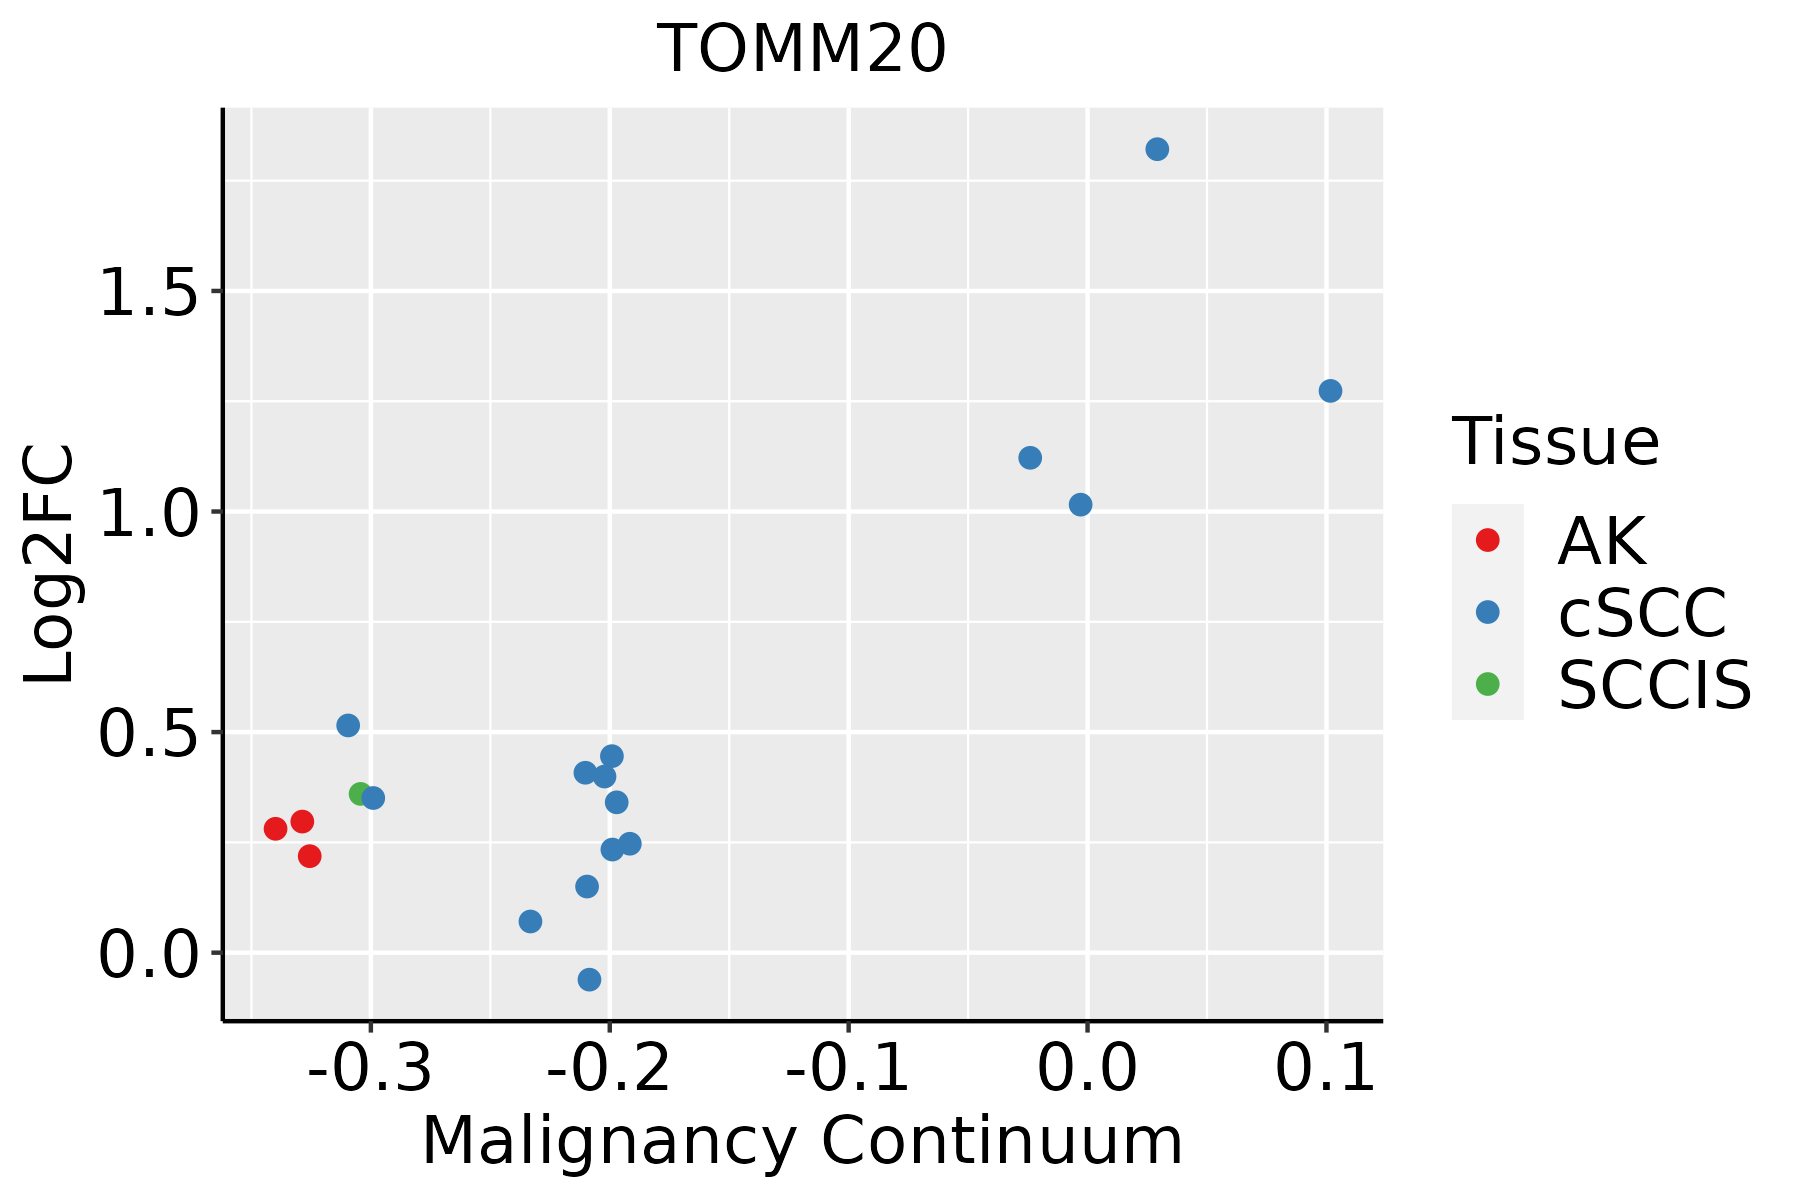 | AK: Actinic keratosis |
| cSCC: Cutaneous squamous cell carcinoma | ||
| SCCIS:squamous cell carcinoma in situ | ||
| Thyroid | 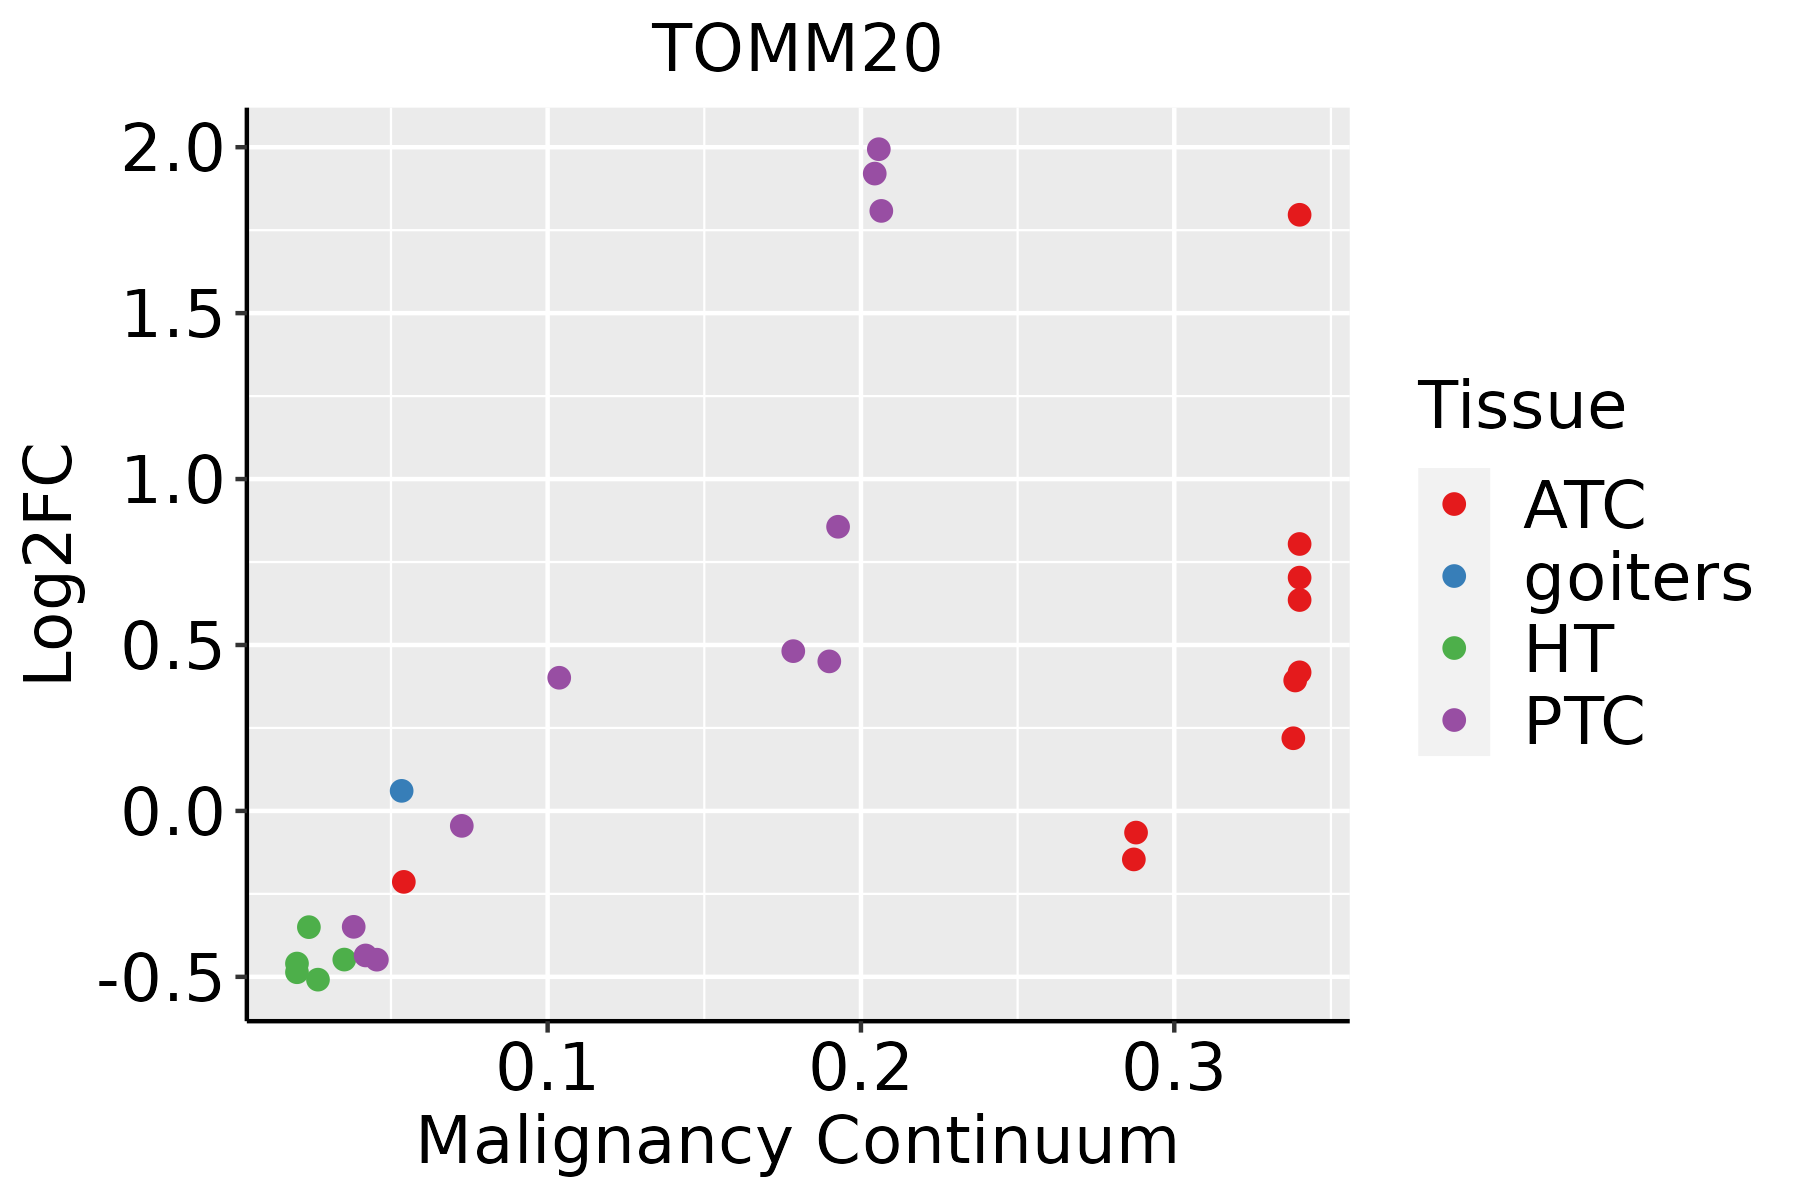 | ATC: Anaplastic thyroid cancer |
| HT: Hashimoto's thyroiditis | ||
| PTC: Papillary thyroid cancer |
| ∗log2FC in expression of this searched gene in stem-like cells from each diseased tissue sample relative to stem-like cells in normal samples in each tissue plotted against the malignancy continuum. Samples are colored based on if they are from different disease stage. |
Top |
Malignant transformation related pathway analysis |
| Find out the enriched GO biological processes and KEGG pathways involved in transition from healthy to precancer to cancer |
| Tissue | Disease Stage | Enriched GO biological Processes |
| Colorectum | AD |  |
| Colorectum | SER |  |
| Colorectum | MSS |  |
| Colorectum | MSI-H |  |
| Colorectum | FAP |  |
| ∗Top 15 enriched GO BP terms are showed in the bar plot of each disease state in each tissue. Each row represents a significant GO biological process which is colored according to the -log10(p.adjust). |
| Page: 1 2 3 4 5 6 7 8 9 |
| GO ID | Tissue | Disease Stage | Description | Gene Ratio | Bg Ratio | pvalue | p.adjust | Count |
| GO:000683913 | Breast | IDC | mitochondrial transport | 51/1434 | 254/18723 | 1.54e-10 | 1.83e-08 | 51 |
| GO:199054214 | Breast | IDC | mitochondrial transmembrane transport | 25/1434 | 102/18723 | 1.39e-07 | 7.74e-06 | 25 |
| GO:007058513 | Breast | IDC | protein localization to mitochondrion | 23/1434 | 125/18723 | 6.92e-05 | 1.40e-03 | 23 |
| GO:007265513 | Breast | IDC | establishment of protein localization to mitochondrion | 22/1434 | 120/18723 | 1.04e-04 | 1.97e-03 | 22 |
| GO:000660514 | Breast | IDC | protein targeting | 43/1434 | 314/18723 | 1.44e-04 | 2.53e-03 | 43 |
| GO:007259413 | Breast | IDC | establishment of protein localization to organelle | 51/1434 | 422/18723 | 7.94e-04 | 9.55e-03 | 51 |
| GO:000662613 | Breast | IDC | protein targeting to mitochondrion | 17/1434 | 100/18723 | 1.47e-03 | 1.50e-02 | 17 |
| GO:007180612 | Breast | IDC | protein transmembrane transport | 12/1434 | 59/18723 | 1.49e-03 | 1.50e-02 | 12 |
| GO:000640313 | Breast | IDC | RNA localization | 27/1434 | 201/18723 | 3.04e-03 | 2.60e-02 | 27 |
| GO:000110112 | Breast | IDC | response to acid chemical | 20/1434 | 135/18723 | 3.28e-03 | 2.75e-02 | 20 |
| GO:00432003 | Breast | IDC | response to amino acid | 17/1434 | 116/18723 | 7.13e-03 | 4.92e-02 | 17 |
| GO:000683923 | Breast | DCIS | mitochondrial transport | 51/1390 | 254/18723 | 5.04e-11 | 6.79e-09 | 51 |
| GO:199054222 | Breast | DCIS | mitochondrial transmembrane transport | 25/1390 | 102/18723 | 7.63e-08 | 4.45e-06 | 25 |
| GO:007058522 | Breast | DCIS | protein localization to mitochondrion | 23/1390 | 125/18723 | 4.28e-05 | 9.05e-04 | 23 |
| GO:007265522 | Breast | DCIS | establishment of protein localization to mitochondrion | 22/1390 | 120/18723 | 6.60e-05 | 1.31e-03 | 22 |
| GO:000660523 | Breast | DCIS | protein targeting | 43/1390 | 314/18723 | 7.17e-05 | 1.41e-03 | 43 |
| GO:007259423 | Breast | DCIS | establishment of protein localization to organelle | 51/1390 | 422/18723 | 3.91e-04 | 5.40e-03 | 51 |
| GO:000662622 | Breast | DCIS | protein targeting to mitochondrion | 17/1390 | 100/18723 | 1.05e-03 | 1.15e-02 | 17 |
| GO:007180621 | Breast | DCIS | protein transmembrane transport | 12/1390 | 59/18723 | 1.14e-03 | 1.22e-02 | 12 |
| GO:000640322 | Breast | DCIS | RNA localization | 27/1390 | 201/18723 | 1.97e-03 | 1.84e-02 | 27 |
| Page: 1 2 3 4 5 6 7 8 9 10 11 12 13 14 15 16 17 18 19 20 21 |
| Pathway ID | Tissue | Disease Stage | Description | Gene Ratio | Bg Ratio | pvalue | p.adjust | qvalue | Count |
| Page: 1 |
Top |
Cell-cell communication analysis |
| Identification of potential cell-cell interactions between two cell types and their ligand-receptor pairs for different disease states |
| Ligand | Receptor | LRpair | Pathway | Tissue | Disease Stage |
| Page: 1 |
Top |
Single-cell gene regulatory network inference analysis |
| Find out the significant the regulons (TFs) and the target genes of each regulon across cell types for different disease states |
| TF | Cell Type | Tissue | Disease Stage | Target Gene | RSS | Regulon Activity |
| ∗The dot plots of a searched regulon are shown for all cell subpopulations in each disease state of each tissue based on the regulon specific score inferred using pySCENIC and by calculating the average expression. |
| Page: 1 |
Top |
Somatic mutation of malignant transformation related genes |
| Annotation of somatic variants for genes involved in malignant transformation |
| Hugo Symbol | Variant Class | Variant Classification | dbSNP RS | HGVSc | HGVSp | HGVSp Short | SWISSPROT | BIOTYPE | SIFT | PolyPhen | Tumor Sample Barcode | Tissue | Histology | Sex | Age | Stage | Therapy Types | Drugs | Outcome |
| TOMM20 | SNV | Missense_Mutation | novel | c.102N>A | p.Phe34Leu | p.F34L | Q15388 | protein_coding | tolerated(0.06) | benign(0.086) | TCGA-AJ-A5DW-01 | Endometrium | uterine corpus endometrioid carcinoma | Female | <65 | I/II | Unknown | Unknown | SD |
| TOMM20 | SNV | Missense_Mutation | novel | c.299N>T | p.Cys100Phe | p.C100F | Q15388 | protein_coding | deleterious(0.01) | possibly_damaging(0.646) | TCGA-NJ-A4YQ-01 | Lung | lung adenocarcinoma | Female | >=65 | I/II | Unknown | Unknown | SD |
| TOMM20 | SNV | Missense_Mutation | novel | c.86N>A | p.Arg29Gln | p.R29Q | Q15388 | protein_coding | tolerated(0.08) | benign(0.148) | TCGA-D6-A6EN-01 | Oral cavity | head & neck squamous cell carcinoma | Male | >=65 | III/IV | Unknown | Unknown | SD |
| TOMM20 | SNV | Missense_Mutation | c.28N>A | p.Ala10Thr | p.A10T | Q15388 | protein_coding | deleterious(0.03) | possibly_damaging(0.836) | TCGA-D7-A4YY-01 | Stomach | stomach adenocarcinoma | Male | <65 | III/IV | Chemotherapy | 5-fluorouracil | SD |
| Page: 1 |
Top |
Related drugs of malignant transformation related genes |
| Identification of chemicals and drugs interact with genes involved in malignant transfromation |
| (DGIdb 4.0) |
| Entrez ID | Symbol | Category | Interaction Types | Drug Claim Name | Drug Name | PMIDs |
| Page: 1 |

Copyright 2023-Present -The University of Texas Health Science Center at Houston |