| Entrez ID | Symbol | Replicates | Species | Organ | Tissue | Adj P-value | Log2FC | Malignancy |
| 6500 | SKP1 | GSM5353225_PA_PR5196-1_Pool_1_2_3_S53_L002 | Human | Prostate | Tumor | 9.07e-03 | -5.08e-01 | 0.1619 |
| 6500 | SKP1 | GSM5353226_PA_PR5196-2_Pool_1_2_3_S54_L002 | Human | Prostate | Tumor | 3.18e-03 | -6.92e-01 | 0.159 |
| 6500 | SKP1 | GSM5353227_PA_PR5199-193K_Pool_1_2_3_S55_L002 | Human | Prostate | Tumor | 2.02e-10 | -6.02e-01 | 0.1602 |
| 6500 | SKP1 | GSM5353228_PA_PR5199-640K_Pool_1_3_S108_L004 | Human | Prostate | Tumor | 1.24e-06 | -7.61e-01 | 0.1537 |
| 6500 | SKP1 | GSM5353232_PA_PR5249_T1_S3_L001 | Human | Prostate | Tumor | 2.32e-07 | -7.47e-01 | 0.1439 |
| 6500 | SKP1 | GSM5353236_PA_PR5251_T1_S7_L001 | Human | Prostate | Tumor | 3.47e-04 | -5.61e-01 | 0.1608 |
| 6500 | SKP1 | GSM5353240_PA_PR5254_T1_S15_L001 | Human | Prostate | Tumor | 4.79e-22 | -7.05e-01 | 0.1575 |
| 6500 | SKP1 | GSM5353243_PA_PR5261_T1_S23_L002 | Human | Prostate | Tumor | 1.42e-30 | -6.73e-01 | 0.1545 |
| 6500 | SKP1 | GSM5353244_PA_PR5261_T2_S24_L002 | Human | Prostate | Tumor | 3.56e-26 | -8.05e-01 | 0.1569 |
| 6500 | SKP1 | GSM5353247_PA_PR5269_3_S27_L002 | Human | Prostate | Tumor | 3.08e-03 | -8.20e-01 | 0.1532 |
| 6500 | SKP1 | GSM5353248_PA_PR5269_4_S28_L002 | Human | Prostate | Tumor | 4.32e-05 | -8.58e-01 | 0.1541 |
| 6500 | SKP1 | P1_S1_AK | Human | Skin | AK | 3.46e-08 | -8.15e-02 | -0.3399 |
| 6500 | SKP1 | P2_S3_AK | Human | Skin | AK | 5.51e-08 | -1.37e-01 | -0.3287 |
| 6500 | SKP1 | P4_S8_cSCC | Human | Skin | cSCC | 2.88e-13 | 2.10e-02 | -0.3095 |
| 6500 | SKP1 | P5_S10_cSCC | Human | Skin | cSCC | 2.05e-23 | -2.11e-01 | -0.299 |
| 6500 | SKP1 | P1_cSCC | Human | Skin | cSCC | 3.11e-59 | 2.00e+00 | 0.0292 |
| 6500 | SKP1 | P2_cSCC | Human | Skin | cSCC | 6.23e-53 | 1.55e+00 | -0.024 |
| 6500 | SKP1 | P4_cSCC | Human | Skin | cSCC | 4.86e-50 | 1.54e+00 | -0.00290000000000005 |
| 6500 | SKP1 | P10_cSCC | Human | Skin | cSCC | 9.92e-69 | 2.40e+00 | 0.1017 |
| 6500 | SKP1 | cSCC_p1 | Human | Skin | cSCC | 2.99e-03 | 1.50e-01 | -0.1916 |
| Tissue | Expression Dynamics | Abbreviation |
| Breast | 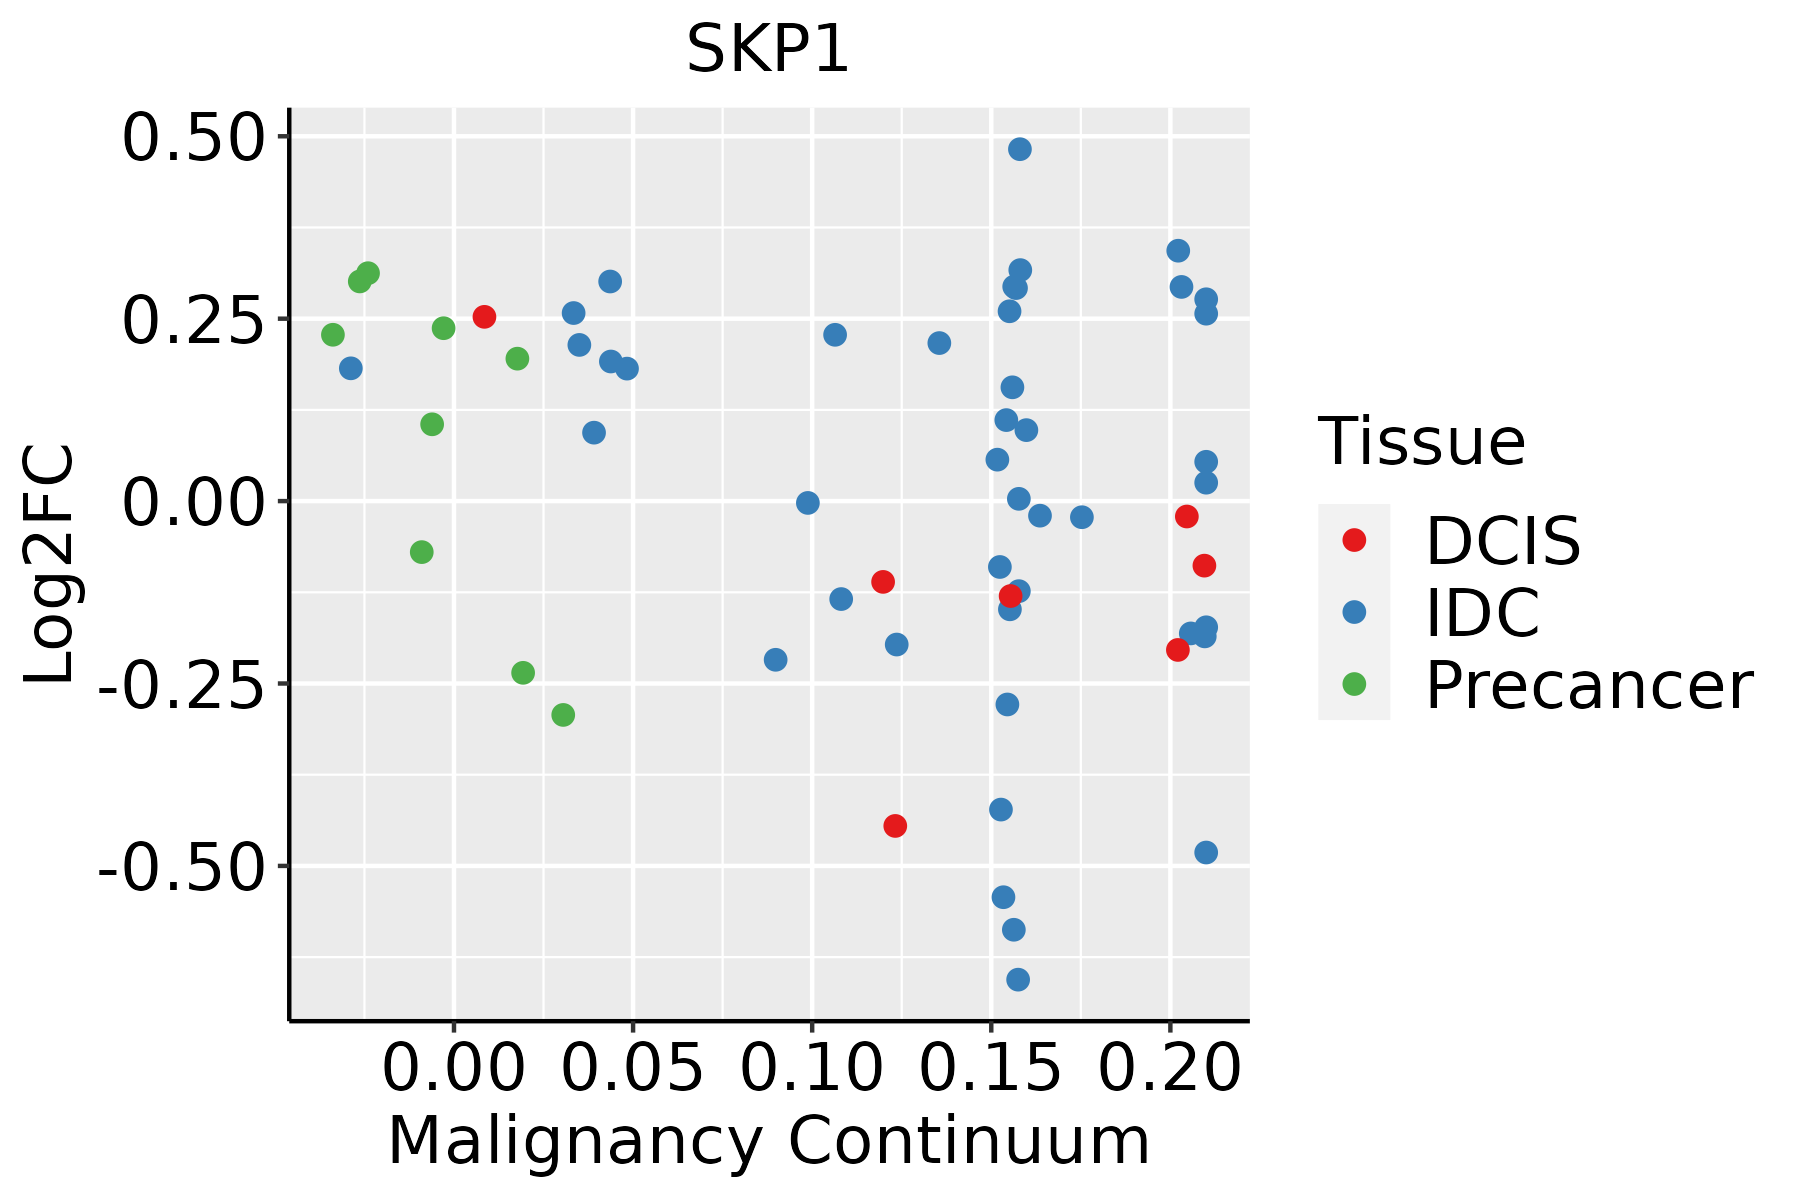 | IDC: Invasive ductal carcinoma |
| DCIS: Ductal carcinoma in situ |
| Precancer(BRCA1-mut): Precancerous lesion from BRCA1 mutation carriers |
| Cervix | 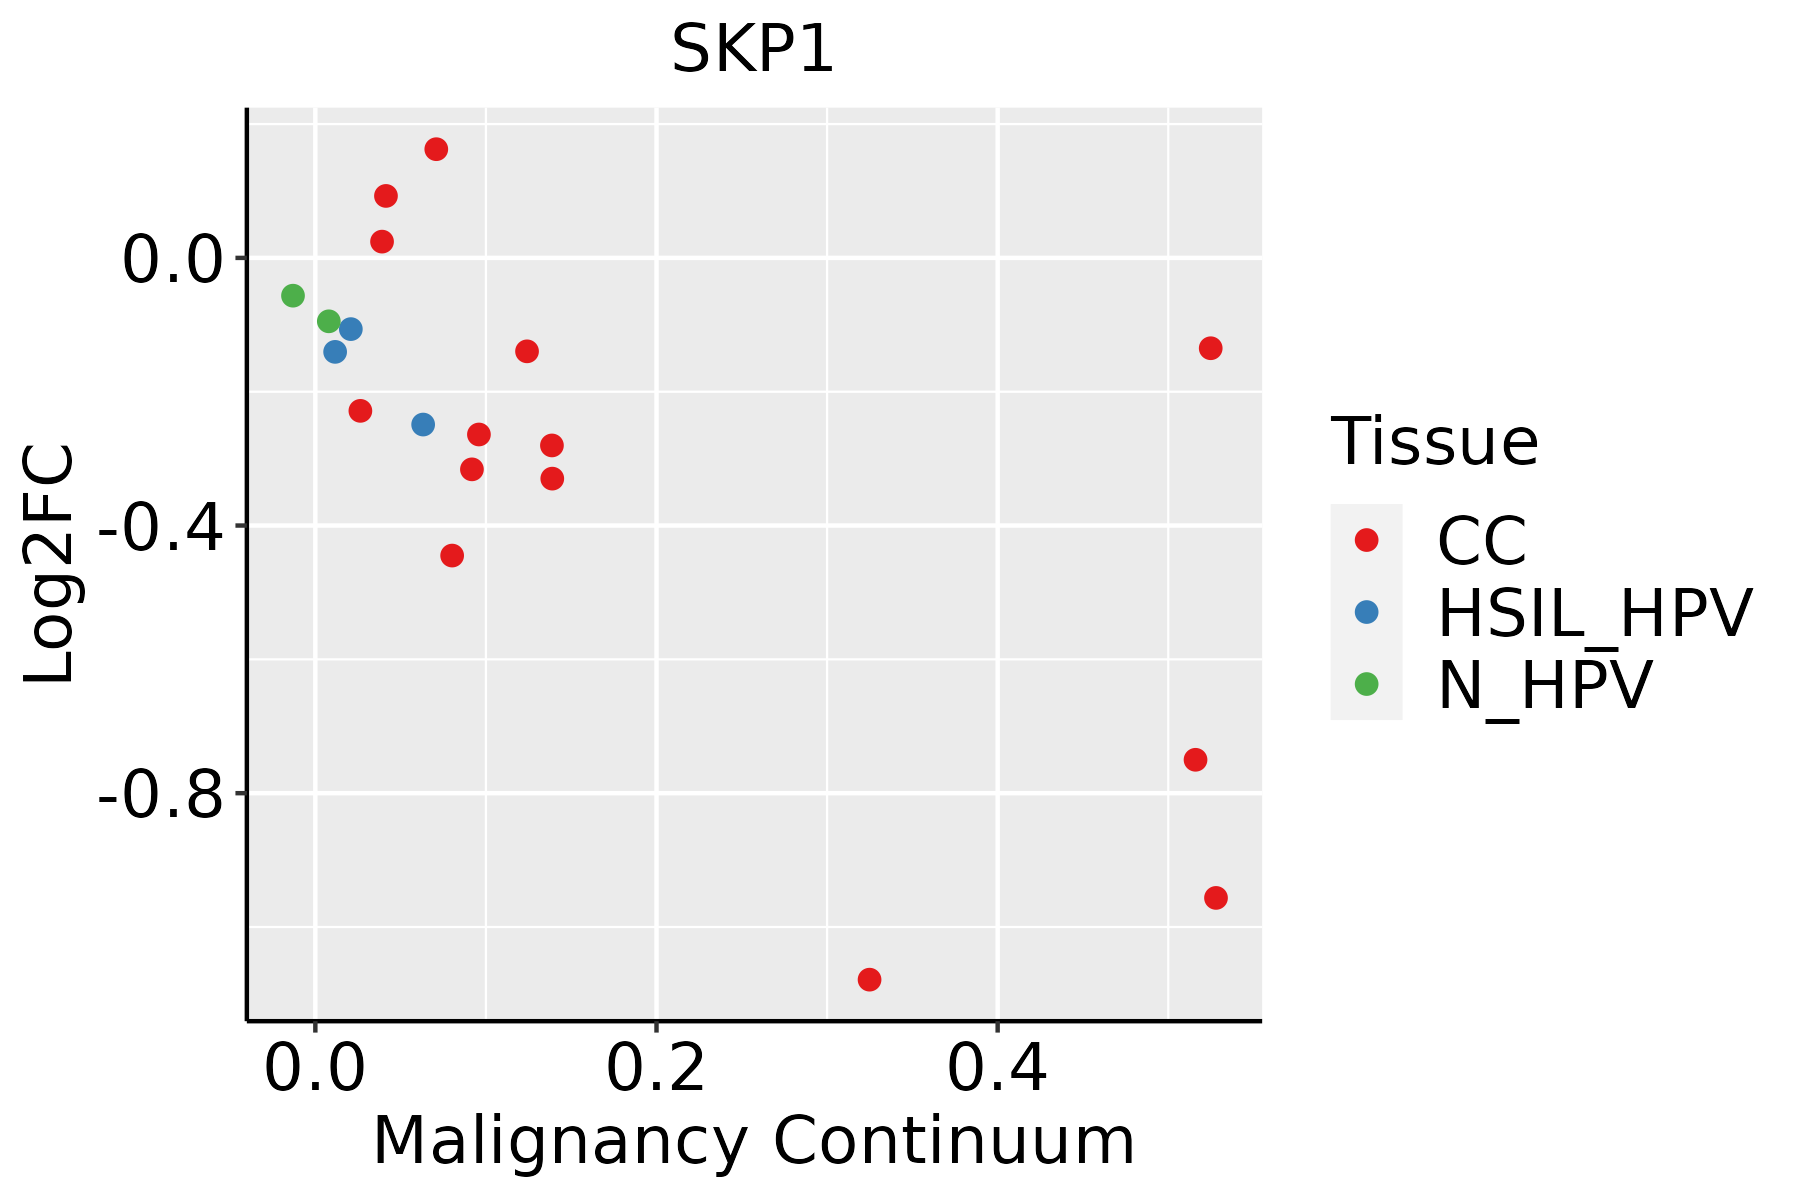 | CC: Cervix cancer |
| HSIL_HPV: HPV-infected high-grade squamous intraepithelial lesions |
| N_HPV: HPV-infected normal cervix |
| Colorectum (GSE201348) |  | FAP: Familial adenomatous polyposis |
| CRC: Colorectal cancer |
| Colorectum (HTA11) |  | AD: Adenomas |
| SER: Sessile serrated lesions |
| MSI-H: Microsatellite-high colorectal cancer |
| MSS: Microsatellite stable colorectal cancer |
| Endometrium | 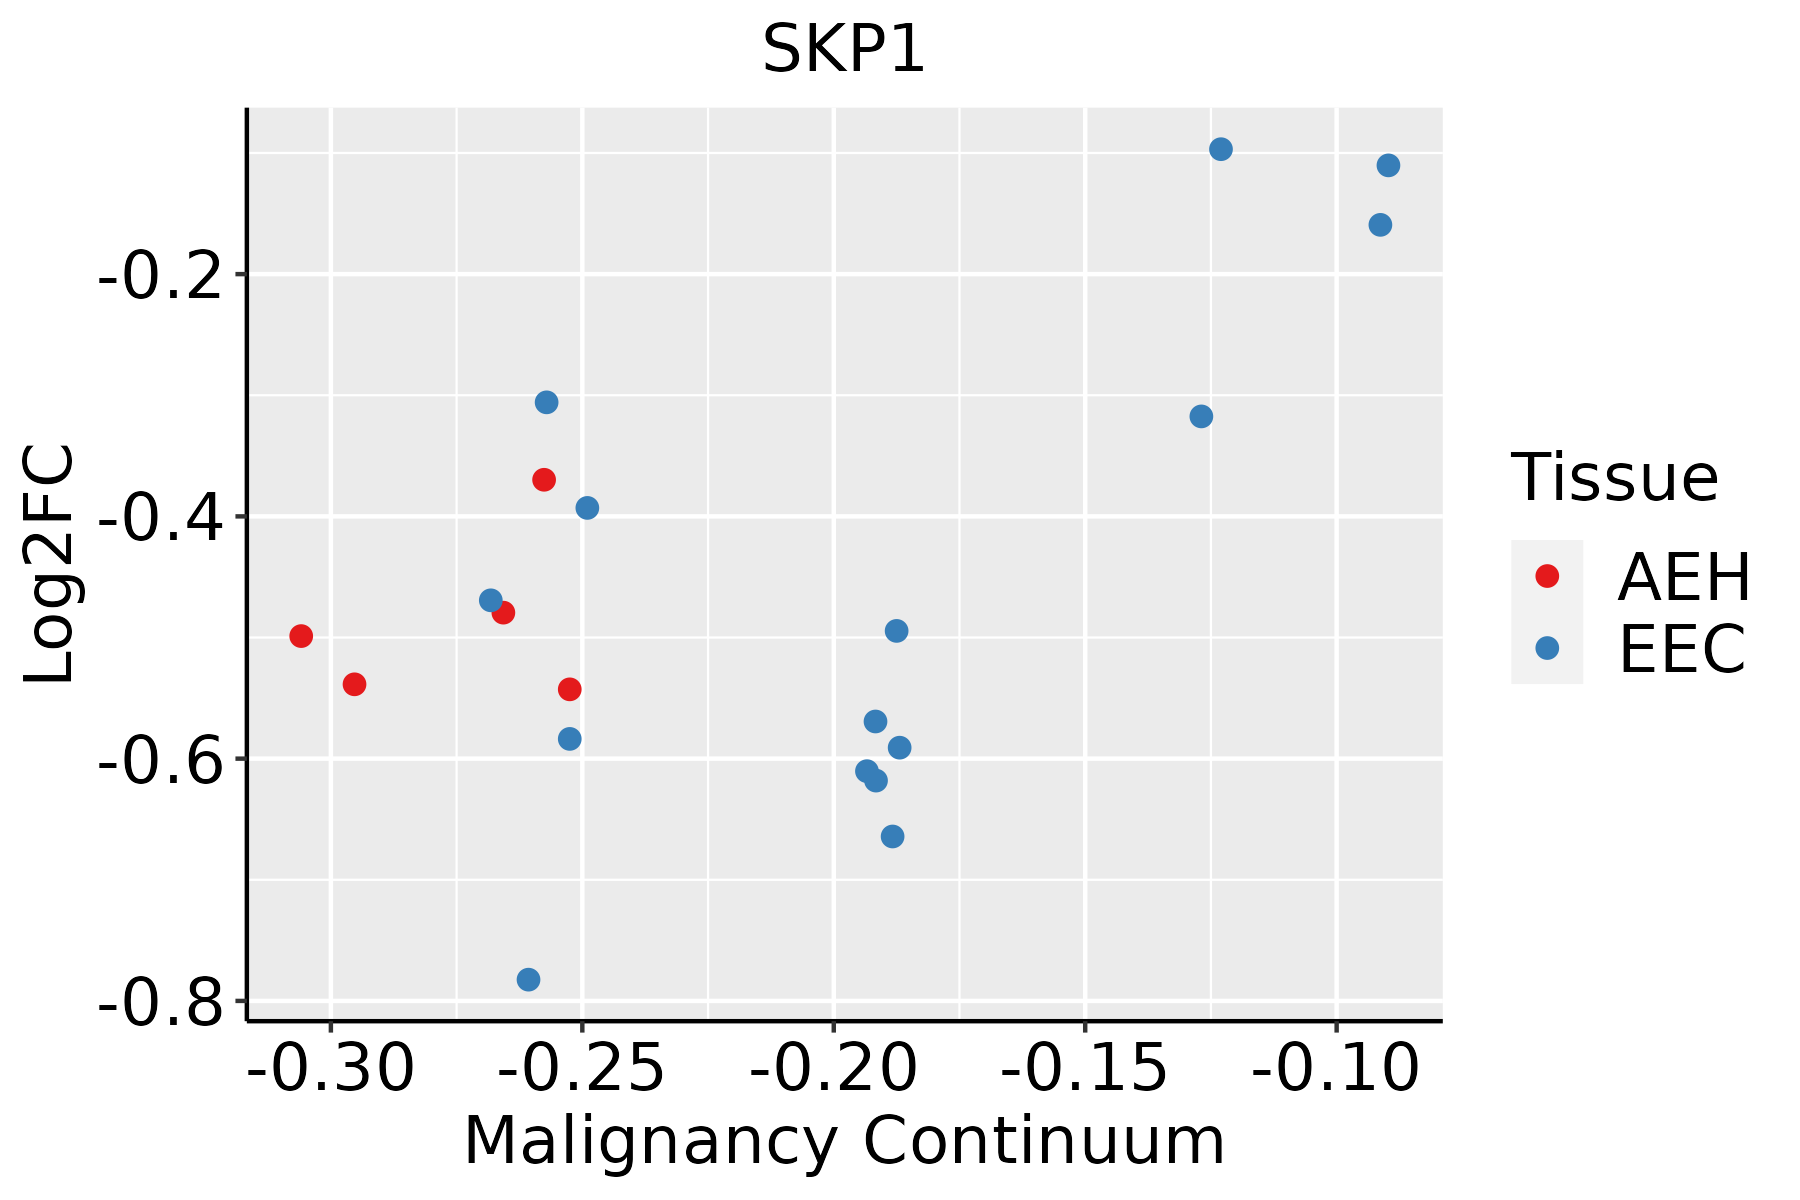 | AEH: Atypical endometrial hyperplasia |
| EEC: Endometrioid Cancer |
| Esophagus |  | ESCC: Esophageal squamous cell carcinoma |
| HGIN: High-grade intraepithelial neoplasias |
| LGIN: Low-grade intraepithelial neoplasias |
| Liver |  | HCC: Hepatocellular carcinoma |
| NAFLD: Non-alcoholic fatty liver disease |
| Oral Cavity |  | EOLP: Erosive Oral lichen planus |
| LP: leukoplakia |
| NEOLP: Non-erosive oral lichen planus |
| OSCC: Oral squamous cell carcinoma |
| Prostate | 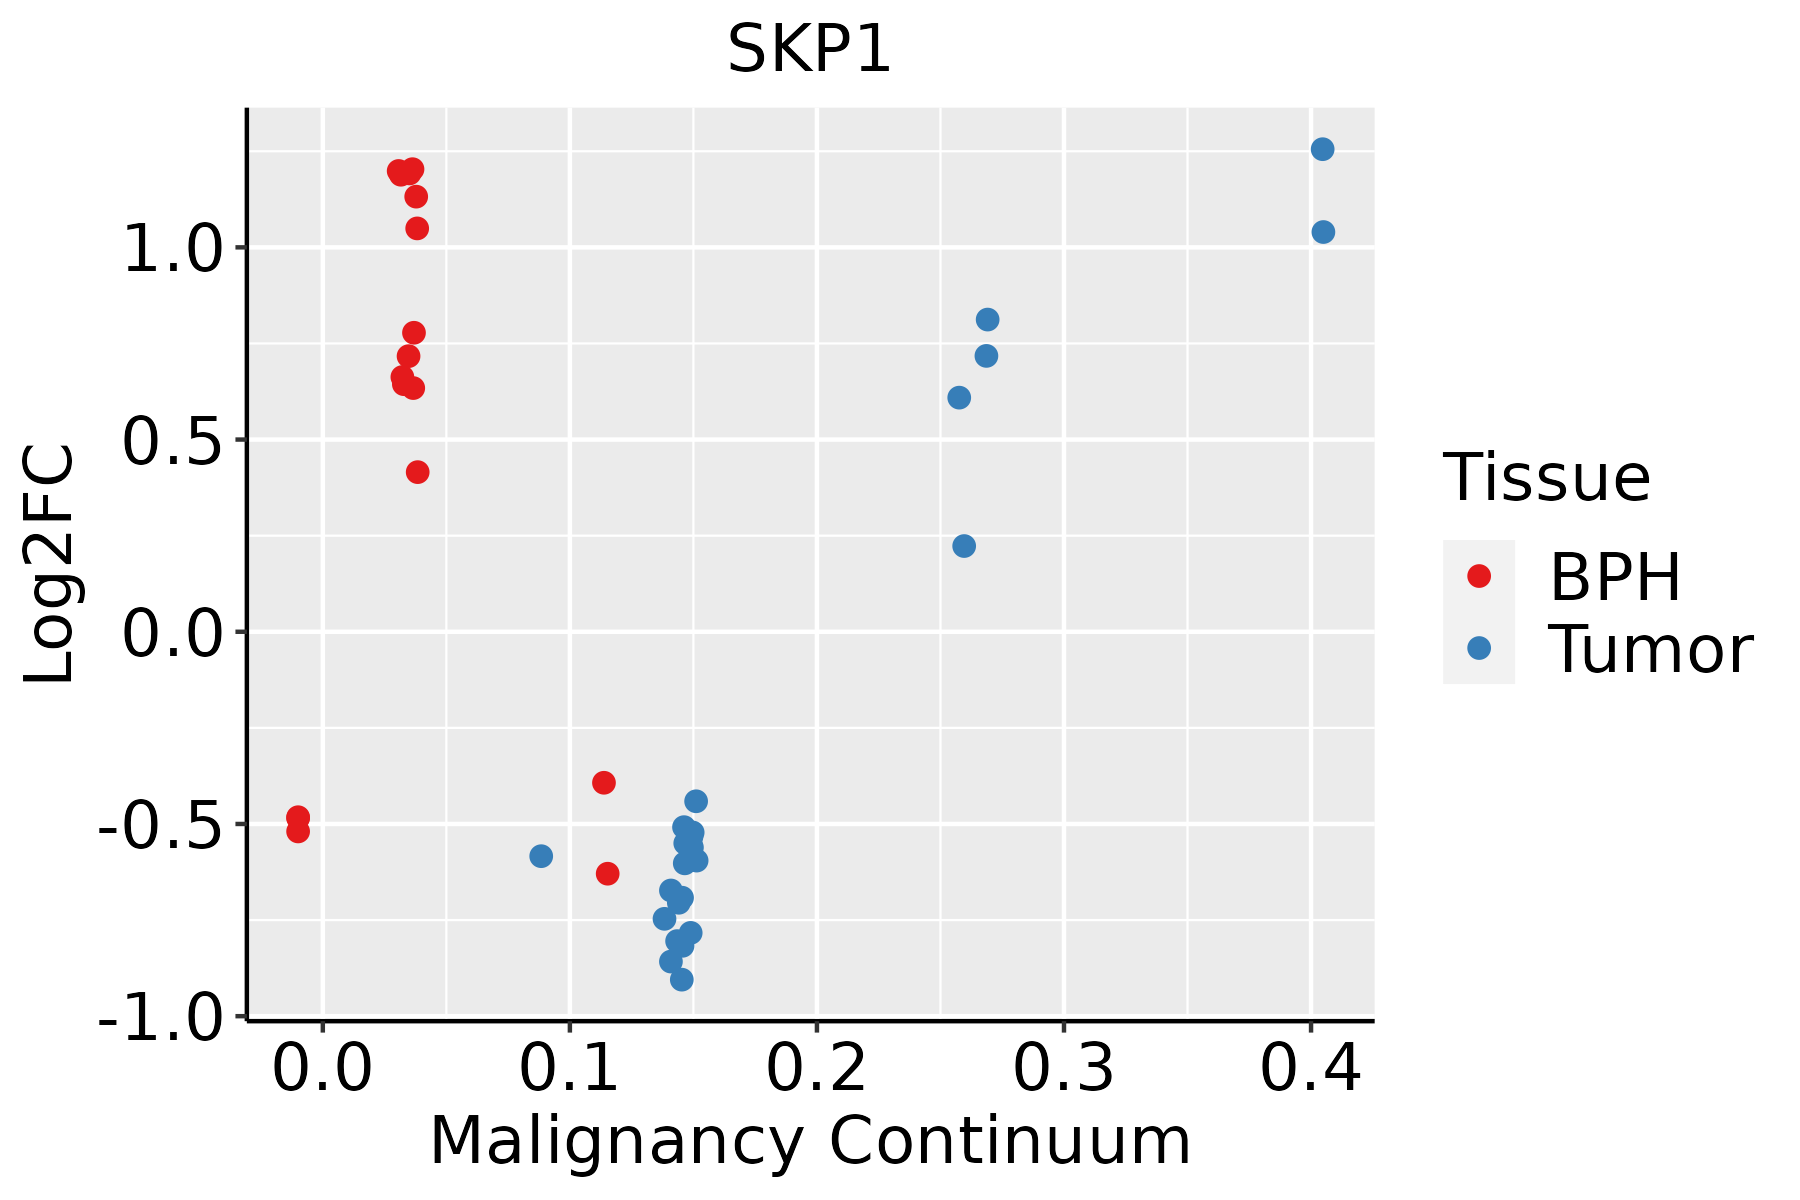 | BPH: Benign Prostatic Hyperplasia |
| Skin |  | AK: Actinic keratosis |
| cSCC: Cutaneous squamous cell carcinoma |
| SCCIS:squamous cell carcinoma in situ |
| Thyroid |  | ATC: Anaplastic thyroid cancer |
| HT: Hashimoto's thyroiditis |
| PTC: Papillary thyroid cancer |
| GO ID | Tissue | Disease Stage | Description | Gene Ratio | Bg Ratio | pvalue | p.adjust | Count |
| GO:19033209 | Breast | Precancer | regulation of protein modification by small protein conjugation or removal | 38/1080 | 242/18723 | 1.71e-08 | 1.17e-06 | 38 |
| GO:00313969 | Breast | Precancer | regulation of protein ubiquitination | 33/1080 | 210/18723 | 1.45e-07 | 7.82e-06 | 33 |
| GO:00104989 | Breast | Precancer | proteasomal protein catabolic process | 58/1080 | 490/18723 | 1.54e-07 | 8.05e-06 | 58 |
| GO:00451859 | Breast | Precancer | maintenance of protein location | 19/1080 | 94/18723 | 1.43e-06 | 5.35e-05 | 19 |
| GO:00512358 | Breast | Precancer | maintenance of location | 40/1080 | 327/18723 | 5.85e-06 | 1.71e-04 | 40 |
| GO:00516519 | Breast | Precancer | maintenance of location in cell | 30/1080 | 214/18723 | 5.91e-06 | 1.71e-04 | 30 |
| GO:00325076 | Breast | Precancer | maintenance of protein location in cell | 14/1080 | 65/18723 | 1.59e-05 | 3.89e-04 | 14 |
| GO:00725954 | Breast | Precancer | maintenance of protein localization in organelle | 10/1080 | 42/18723 | 1.06e-04 | 1.93e-03 | 10 |
| GO:19046668 | Breast | Precancer | regulation of ubiquitin protein ligase activity | 7/1080 | 23/18723 | 2.26e-04 | 3.42e-03 | 7 |
| GO:00431619 | Breast | Precancer | proteasome-mediated ubiquitin-dependent protein catabolic process | 42/1080 | 412/18723 | 2.49e-04 | 3.72e-03 | 42 |
| GO:00514386 | Breast | Precancer | regulation of ubiquitin-protein transferase activity | 10/1080 | 53/18723 | 7.88e-04 | 9.29e-03 | 10 |
| GO:001049814 | Breast | IDC | proteasomal protein catabolic process | 75/1434 | 490/18723 | 5.59e-09 | 4.41e-07 | 75 |
| GO:190332014 | Breast | IDC | regulation of protein modification by small protein conjugation or removal | 43/1434 | 242/18723 | 1.71e-07 | 9.16e-06 | 43 |
| GO:003139614 | Breast | IDC | regulation of protein ubiquitination | 37/1434 | 210/18723 | 1.50e-06 | 6.36e-05 | 37 |
| GO:005165114 | Breast | IDC | maintenance of location in cell | 37/1434 | 214/18723 | 2.39e-06 | 9.35e-05 | 37 |
| GO:004518514 | Breast | IDC | maintenance of protein location | 21/1434 | 94/18723 | 6.69e-06 | 2.05e-04 | 21 |
| GO:004316114 | Breast | IDC | proteasome-mediated ubiquitin-dependent protein catabolic process | 57/1434 | 412/18723 | 9.55e-06 | 2.68e-04 | 57 |
| GO:005123513 | Breast | IDC | maintenance of location | 48/1434 | 327/18723 | 9.90e-06 | 2.77e-04 | 48 |
| GO:003250714 | Breast | IDC | maintenance of protein location in cell | 16/1434 | 65/18723 | 2.29e-05 | 5.51e-04 | 16 |
| GO:007259512 | Breast | IDC | maintenance of protein localization in organelle | 12/1434 | 42/18723 | 4.94e-05 | 1.08e-03 | 12 |
| Pathway ID | Tissue | Disease Stage | Description | Gene Ratio | Bg Ratio | pvalue | p.adjust | qvalue | Count |
| hsa0513218 | Breast | Precancer | Salmonella infection | 49/684 | 249/8465 | 2.92e-09 | 6.15e-08 | 4.71e-08 | 49 |
| hsa0513118 | Breast | Precancer | Shigellosis | 44/684 | 247/8465 | 3.91e-07 | 6.86e-06 | 5.26e-06 | 44 |
| hsa0414118 | Breast | Precancer | Protein processing in endoplasmic reticulum | 33/684 | 174/8465 | 2.78e-06 | 3.83e-05 | 2.94e-05 | 33 |
| hsa0513219 | Breast | Precancer | Salmonella infection | 49/684 | 249/8465 | 2.92e-09 | 6.15e-08 | 4.71e-08 | 49 |
| hsa0513119 | Breast | Precancer | Shigellosis | 44/684 | 247/8465 | 3.91e-07 | 6.86e-06 | 5.26e-06 | 44 |
| hsa0414119 | Breast | Precancer | Protein processing in endoplasmic reticulum | 33/684 | 174/8465 | 2.78e-06 | 3.83e-05 | 2.94e-05 | 33 |
| hsa0513224 | Breast | IDC | Salmonella infection | 55/867 | 249/8465 | 2.07e-08 | 4.49e-07 | 3.36e-07 | 55 |
| hsa0513124 | Breast | IDC | Shigellosis | 47/867 | 247/8465 | 1.78e-05 | 2.00e-04 | 1.49e-04 | 47 |
| hsa0414124 | Breast | IDC | Protein processing in endoplasmic reticulum | 36/867 | 174/8465 | 2.73e-05 | 2.86e-04 | 2.14e-04 | 36 |
| hsa0517014 | Breast | IDC | Human immunodeficiency virus 1 infection | 33/867 | 212/8465 | 9.28e-03 | 4.37e-02 | 3.27e-02 | 33 |
| hsa0513234 | Breast | IDC | Salmonella infection | 55/867 | 249/8465 | 2.07e-08 | 4.49e-07 | 3.36e-07 | 55 |
| hsa0513134 | Breast | IDC | Shigellosis | 47/867 | 247/8465 | 1.78e-05 | 2.00e-04 | 1.49e-04 | 47 |
| hsa0414134 | Breast | IDC | Protein processing in endoplasmic reticulum | 36/867 | 174/8465 | 2.73e-05 | 2.86e-04 | 2.14e-04 | 36 |
| hsa0517015 | Breast | IDC | Human immunodeficiency virus 1 infection | 33/867 | 212/8465 | 9.28e-03 | 4.37e-02 | 3.27e-02 | 33 |
| hsa0513243 | Breast | DCIS | Salmonella infection | 55/846 | 249/8465 | 8.71e-09 | 1.87e-07 | 1.38e-07 | 55 |
| hsa0414143 | Breast | DCIS | Protein processing in endoplasmic reticulum | 36/846 | 174/8465 | 1.60e-05 | 1.91e-04 | 1.41e-04 | 36 |
| hsa0513144 | Breast | DCIS | Shigellosis | 46/846 | 247/8465 | 2.06e-05 | 2.38e-04 | 1.75e-04 | 46 |
| hsa0517024 | Breast | DCIS | Human immunodeficiency virus 1 infection | 33/846 | 212/8465 | 6.49e-03 | 3.22e-02 | 2.37e-02 | 33 |
| hsa0513253 | Breast | DCIS | Salmonella infection | 55/846 | 249/8465 | 8.71e-09 | 1.87e-07 | 1.38e-07 | 55 |
| hsa0414153 | Breast | DCIS | Protein processing in endoplasmic reticulum | 36/846 | 174/8465 | 1.60e-05 | 1.91e-04 | 1.41e-04 | 36 |


