
|
|||||
|
 | |
| |
| |
| |
| |
| |
|
Gene: JMJD1C |
Gene summary for JMJD1C |
| Gene information | Species | Human | Gene symbol | JMJD1C | Gene ID | 221037 |
| Gene name | jumonji domain containing 1C | |
| Gene Alias | KDM3C | |
| Cytomap | 10q21.3 | |
| Gene Type | protein-coding | GO ID | GO:0006139 | UniProtAcc | B7ZLC8 |
Top |
Malignant transformation analysis |
| Identification of the aberrant gene expression in precancerous and cancerous lesions by comparing the gene expression of stem-like cells in diseased tissues with normal stem cells |
| Entrez ID | Symbol | Replicates | Species | Organ | Tissue | Adj P-value | Log2FC | Malignancy |
| 221037 | JMJD1C | Pat06-B | Human | Stomach | GC | 8.65e-53 | 5.21e-01 | -0.1961 |
| 221037 | JMJD1C | Pat07-B | Human | Stomach | GC | 9.73e-04 | 3.48e-01 | 0.0935 |
| 221037 | JMJD1C | Pat09-B | Human | Stomach | GC | 1.41e-02 | 1.52e-01 | -0.0359 |
| 221037 | JMJD1C | Pat10-B | Human | Stomach | GC | 3.98e-04 | 4.29e-01 | 0.084 |
| 221037 | JMJD1C | Pat11-B | Human | Stomach | GC | 4.00e-16 | 4.04e-01 | -0.182 |
| 221037 | JMJD1C | Pat12-B | Human | Stomach | GC | 3.67e-31 | 5.58e-01 | 0.0325 |
| 221037 | JMJD1C | Pat13-B | Human | Stomach | GC | 3.20e-09 | 3.90e-01 | 0.0555 |
| 221037 | JMJD1C | Pat15-B | Human | Stomach | GC | 2.92e-16 | 4.97e-01 | -0.0778 |
| 221037 | JMJD1C | Pat16-B | Human | Stomach | GC | 1.75e-19 | 5.04e-01 | 0.1918 |
| 221037 | JMJD1C | Pat17-B | Human | Stomach | GC | 5.36e-10 | 3.50e-01 | 0.3109 |
| 221037 | JMJD1C | Pat18-B | Human | Stomach | GC | 5.57e-19 | 4.42e-01 | -0.0432 |
| 221037 | JMJD1C | Pat19-B | Human | Stomach | GC | 4.38e-21 | 5.14e-01 | 0.0826 |
| 221037 | JMJD1C | Pat22-B | Human | Stomach | GC | 6.39e-29 | 4.70e-01 | -0.1042 |
| 221037 | JMJD1C | Pat24-B | Human | Stomach | GC | 5.56e-13 | 4.37e-01 | -0.1184 |
| 221037 | JMJD1C | Pat25-A | Human | Stomach | CAG with IM | 7.78e-37 | 4.09e-01 | -0.1648 |
| 221037 | JMJD1C | Pat26-A | Human | Stomach | CSG | 6.39e-34 | 3.11e-01 | -0.2402 |
| 221037 | JMJD1C | Pat28-A | Human | Stomach | CSG | 5.42e-12 | 3.36e-01 | -0.2594 |
| 221037 | JMJD1C | Pat29-A | Human | Stomach | CAG with IM | 1.48e-07 | 3.48e-01 | -0.2769 |
| 221037 | JMJD1C | NAG_1 | Human | Stomach | CSG | 2.78e-03 | 3.68e-01 | -0.3534 |
| 221037 | JMJD1C | NAG_2 | Human | Stomach | CSG | 2.11e-02 | 3.05e-01 | -0.3324 |
| Page: 1 2 3 4 5 6 7 8 9 10 11 12 13 14 15 |
| Tissue | Expression Dynamics | Abbreviation |
| Cervix | 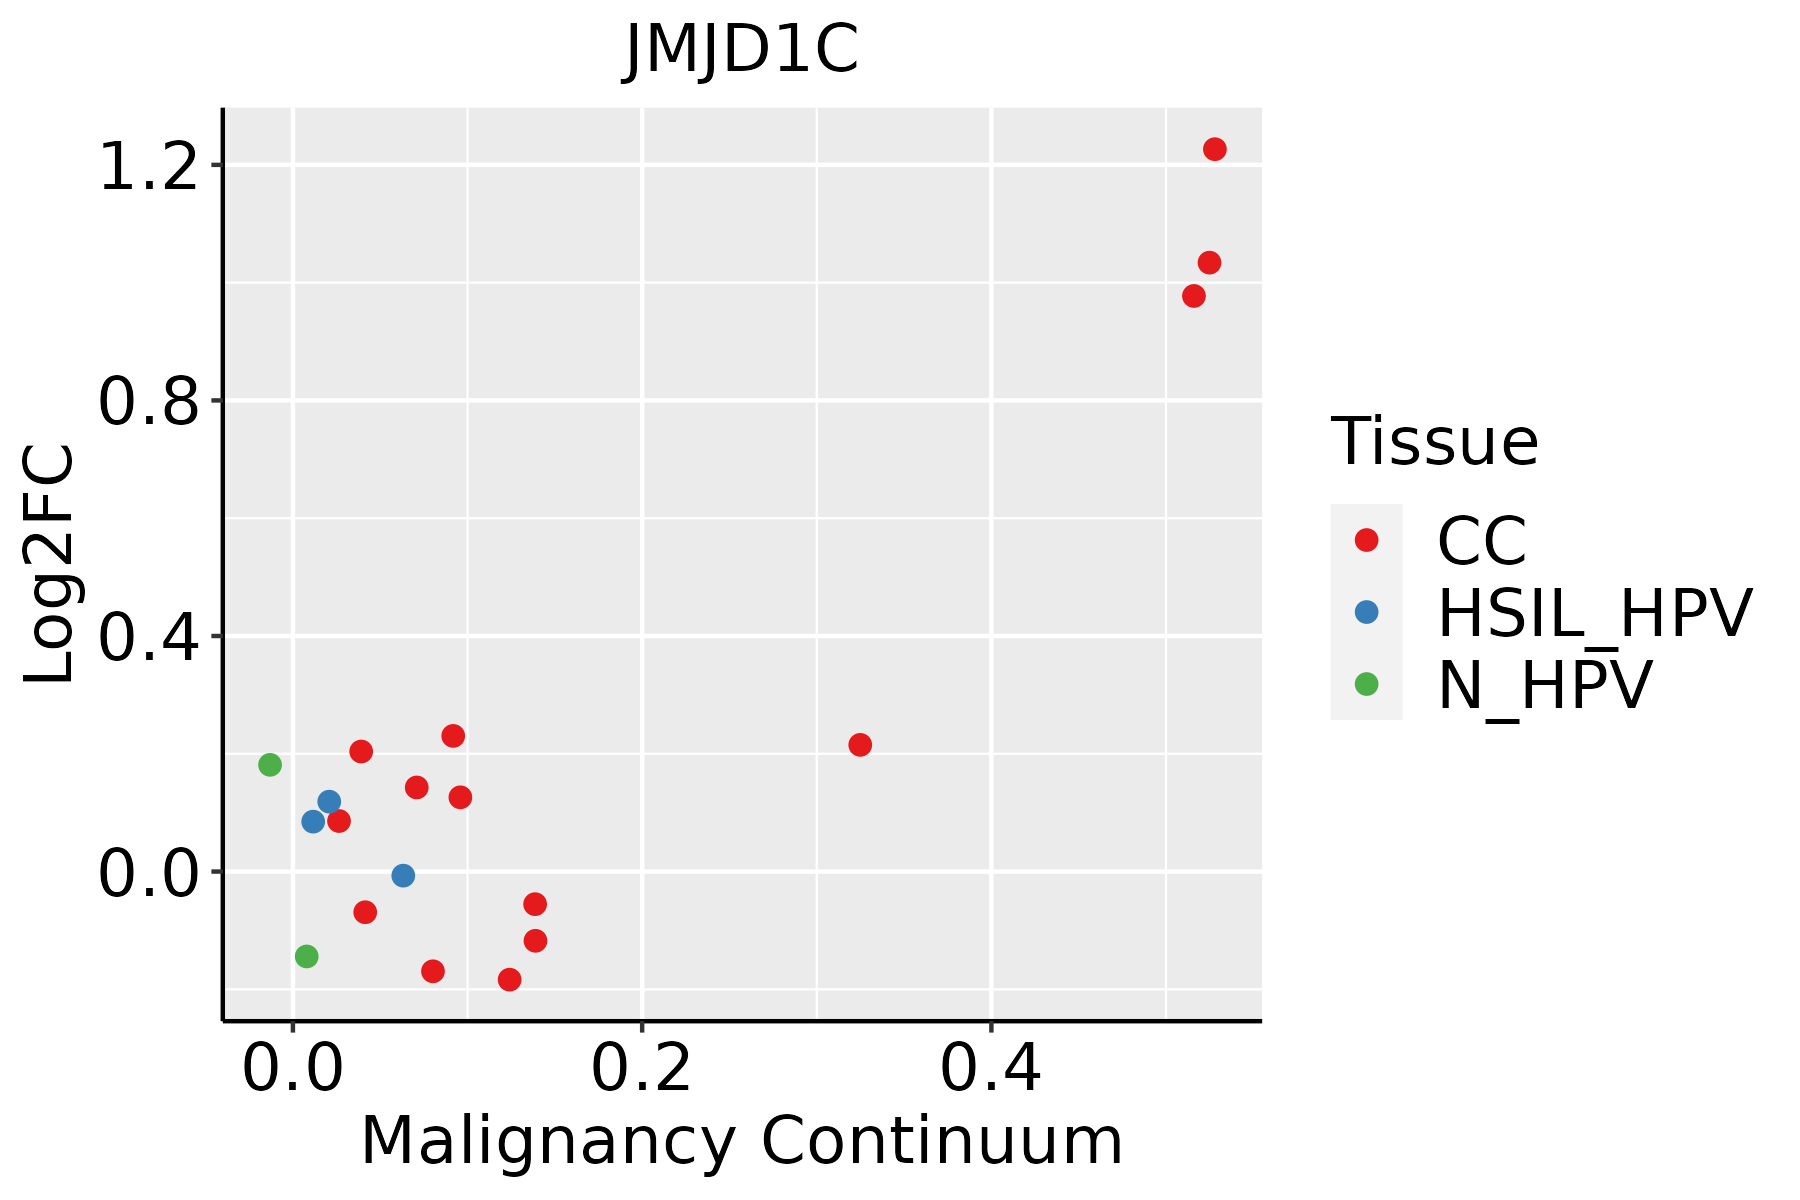 | CC: Cervix cancer |
| HSIL_HPV: HPV-infected high-grade squamous intraepithelial lesions | ||
| N_HPV: HPV-infected normal cervix | ||
| Colorectum (GSE201348) |  | FAP: Familial adenomatous polyposis |
| CRC: Colorectal cancer | ||
| Colorectum (HTA11) |  | AD: Adenomas |
| SER: Sessile serrated lesions | ||
| MSI-H: Microsatellite-high colorectal cancer | ||
| MSS: Microsatellite stable colorectal cancer | ||
| Endometrium |  | AEH: Atypical endometrial hyperplasia |
| EEC: Endometrioid Cancer | ||
| Esophagus |  | ESCC: Esophageal squamous cell carcinoma |
| HGIN: High-grade intraepithelial neoplasias | ||
| LGIN: Low-grade intraepithelial neoplasias | ||
| GC | 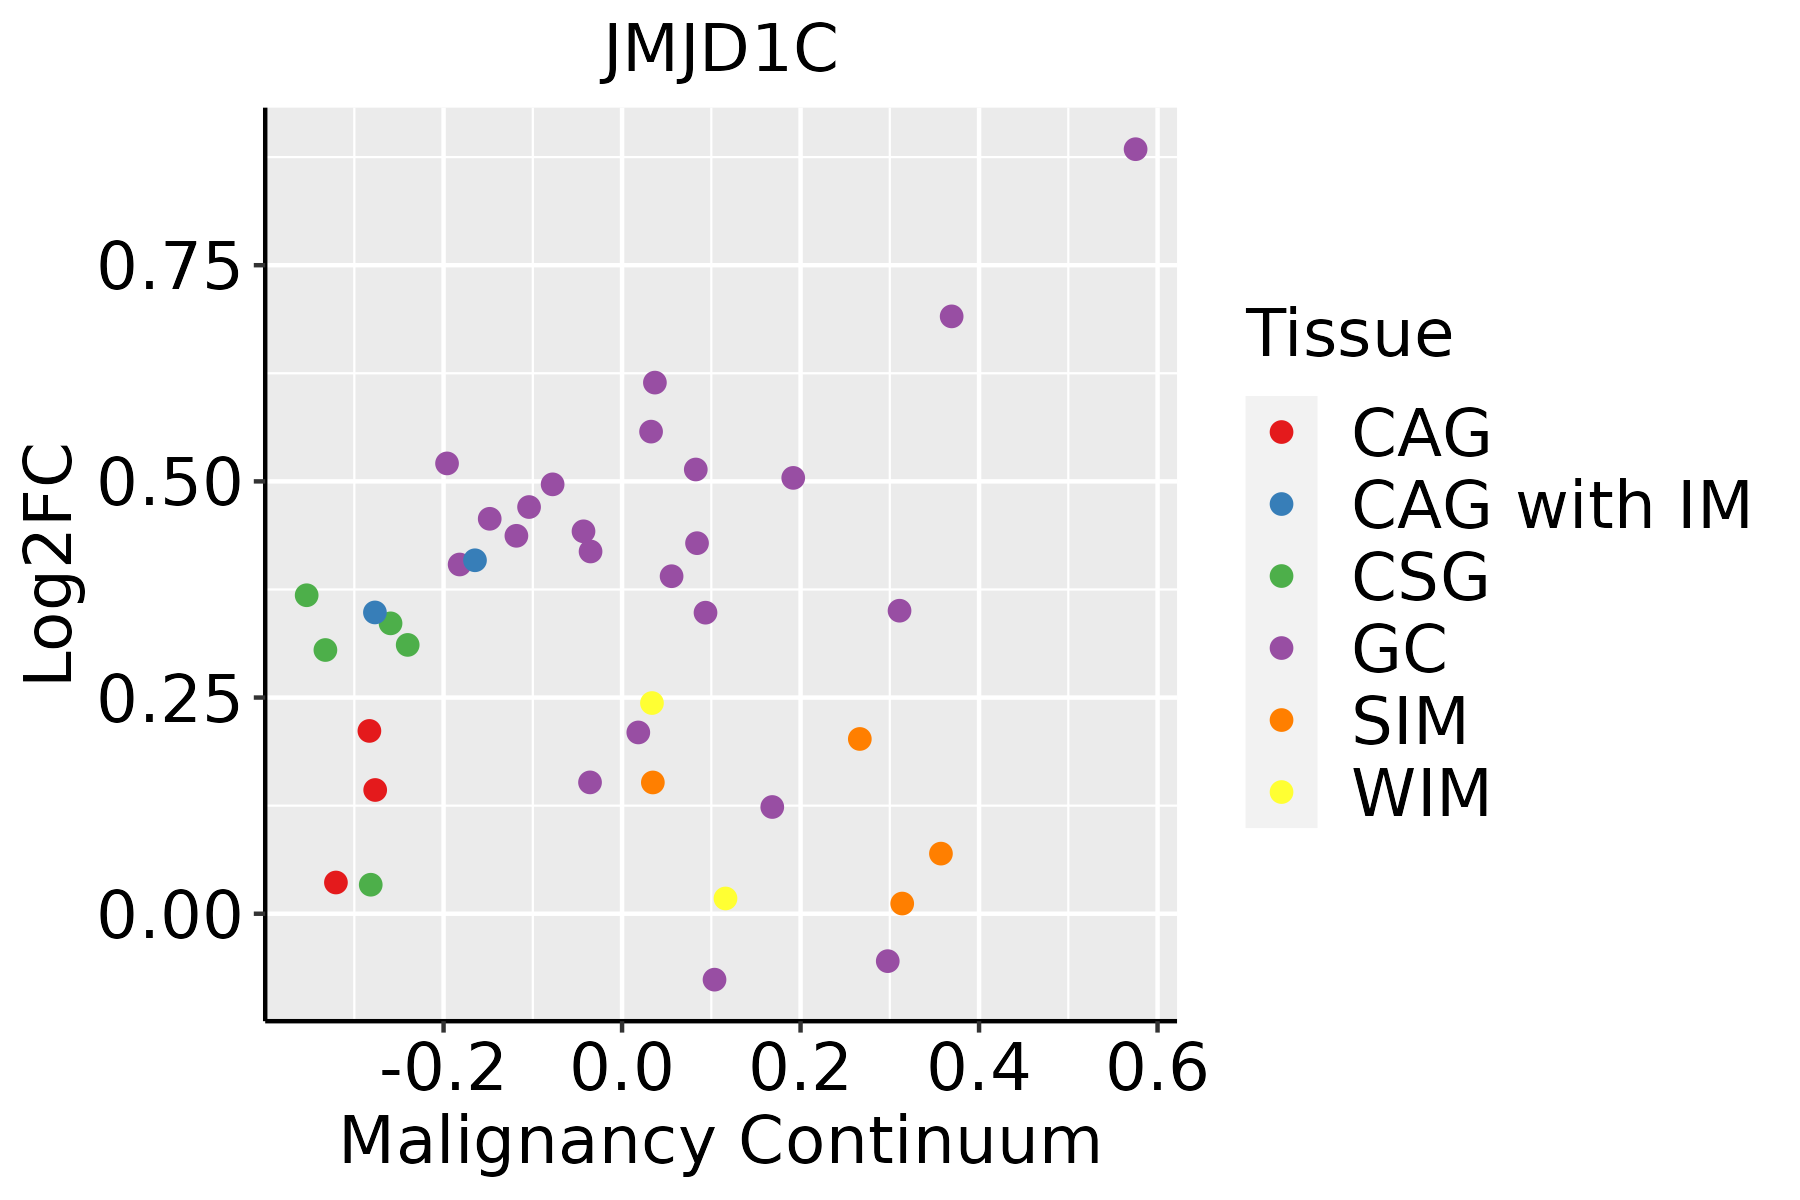 | CAG: Chronic atrophic gastritis |
| CAG with IM: Chronic atrophic gastritis with intestinal metaplasia | ||
| CSG: Chronic superficial gastritis | ||
| GC: Gastric cancer | ||
| SIM: Severe intestinal metaplasia | ||
| WIM: Wild intestinal metaplasia | ||
| Liver | 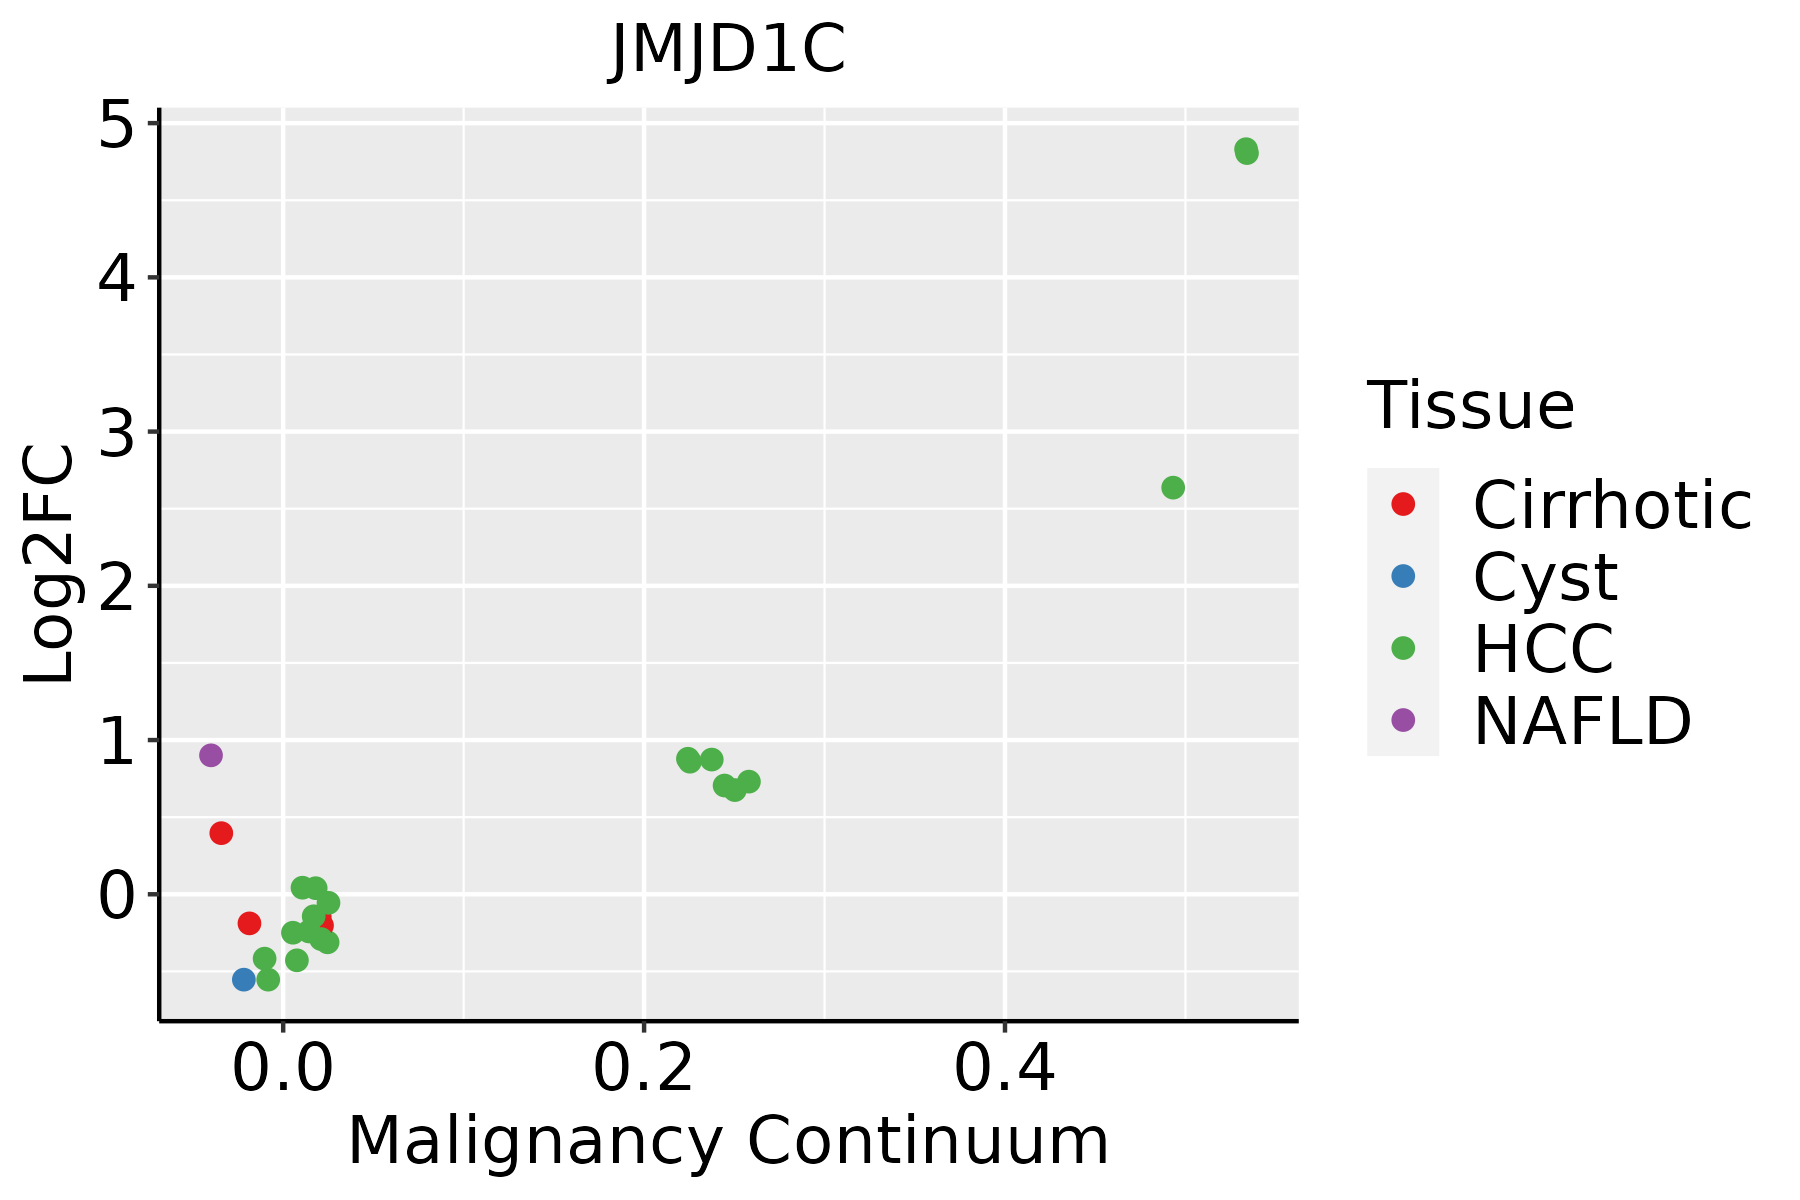 | HCC: Hepatocellular carcinoma |
| NAFLD: Non-alcoholic fatty liver disease | ||
| Lung |  | AAH: Atypical adenomatous hyperplasia |
| AIS: Adenocarcinoma in situ | ||
| IAC: Invasive lung adenocarcinoma | ||
| MIA: Minimally invasive adenocarcinoma | ||
| Oral Cavity |  | EOLP: Erosive Oral lichen planus |
| LP: leukoplakia | ||
| NEOLP: Non-erosive oral lichen planus | ||
| OSCC: Oral squamous cell carcinoma | ||
| Prostate | 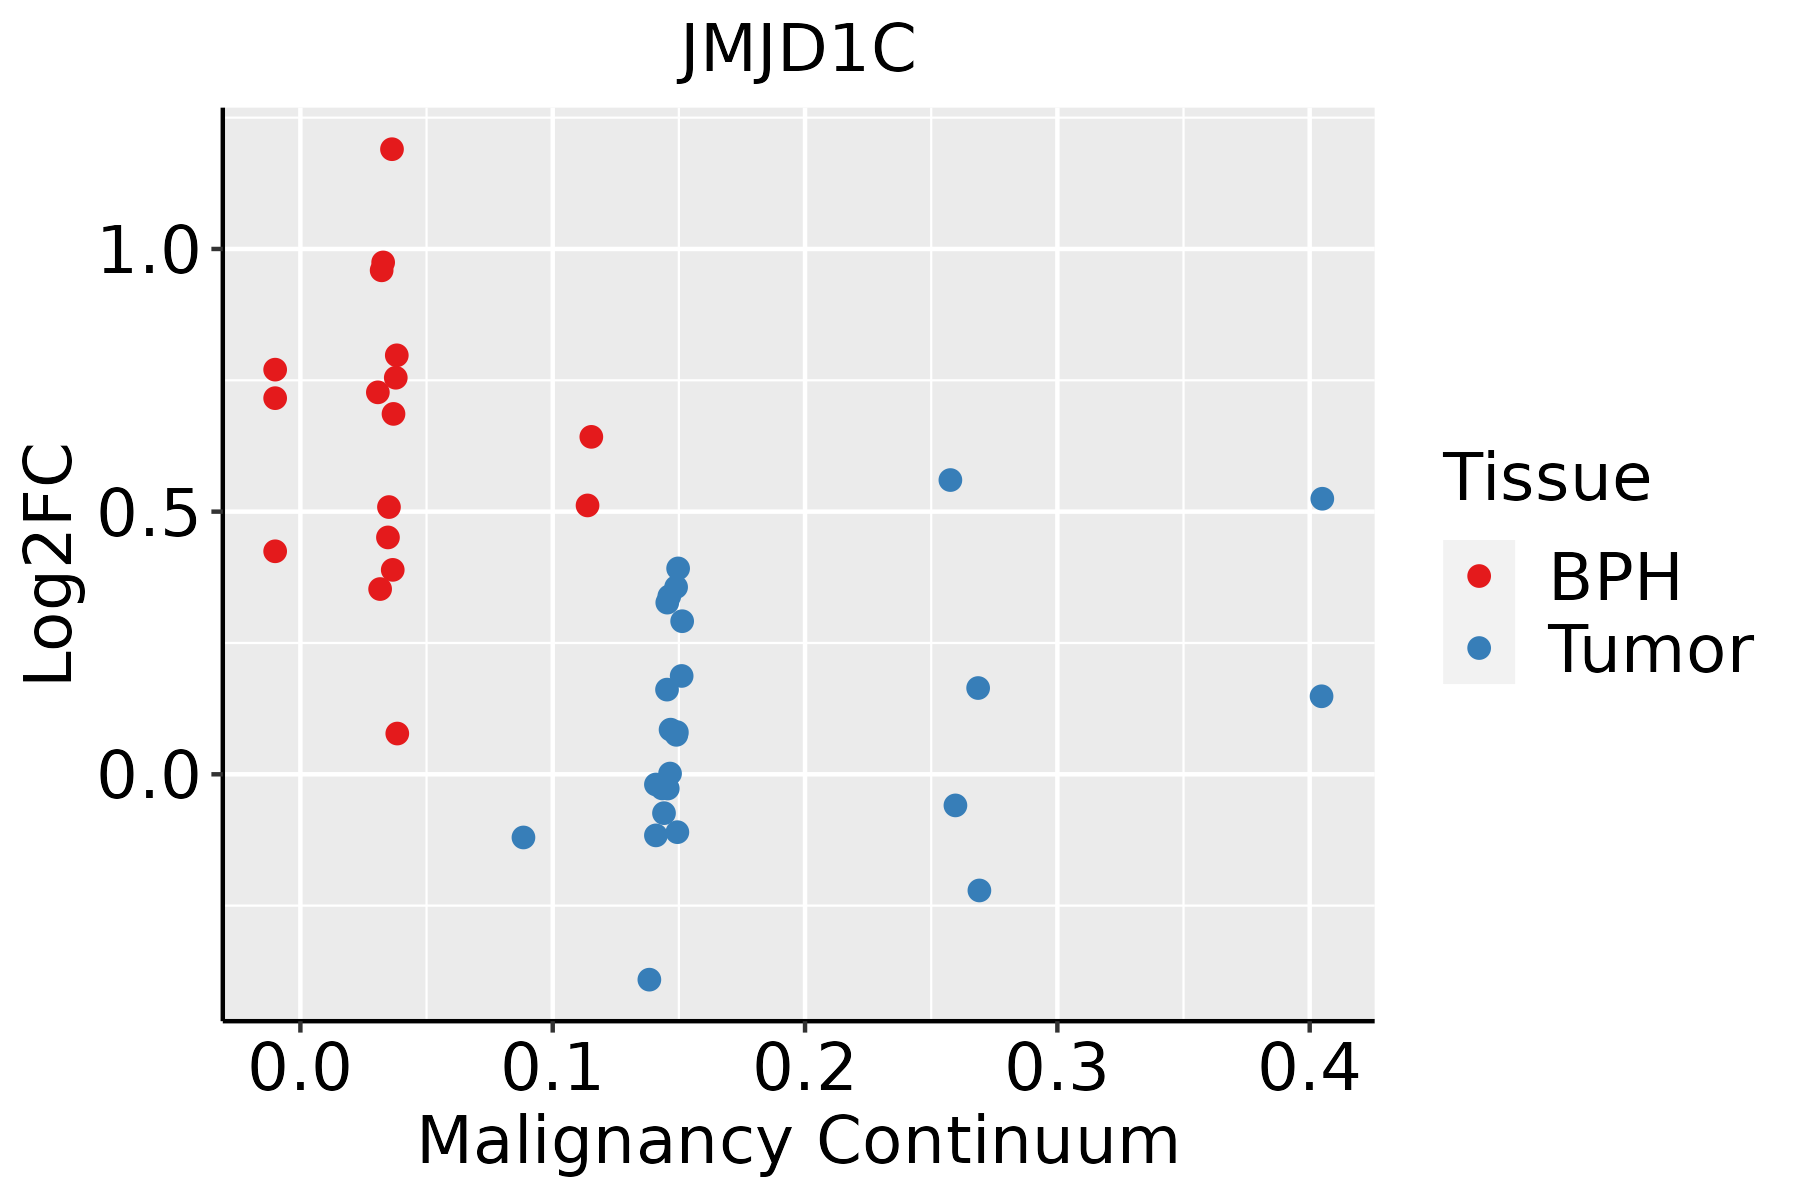 | BPH: Benign Prostatic Hyperplasia |
| Skin | 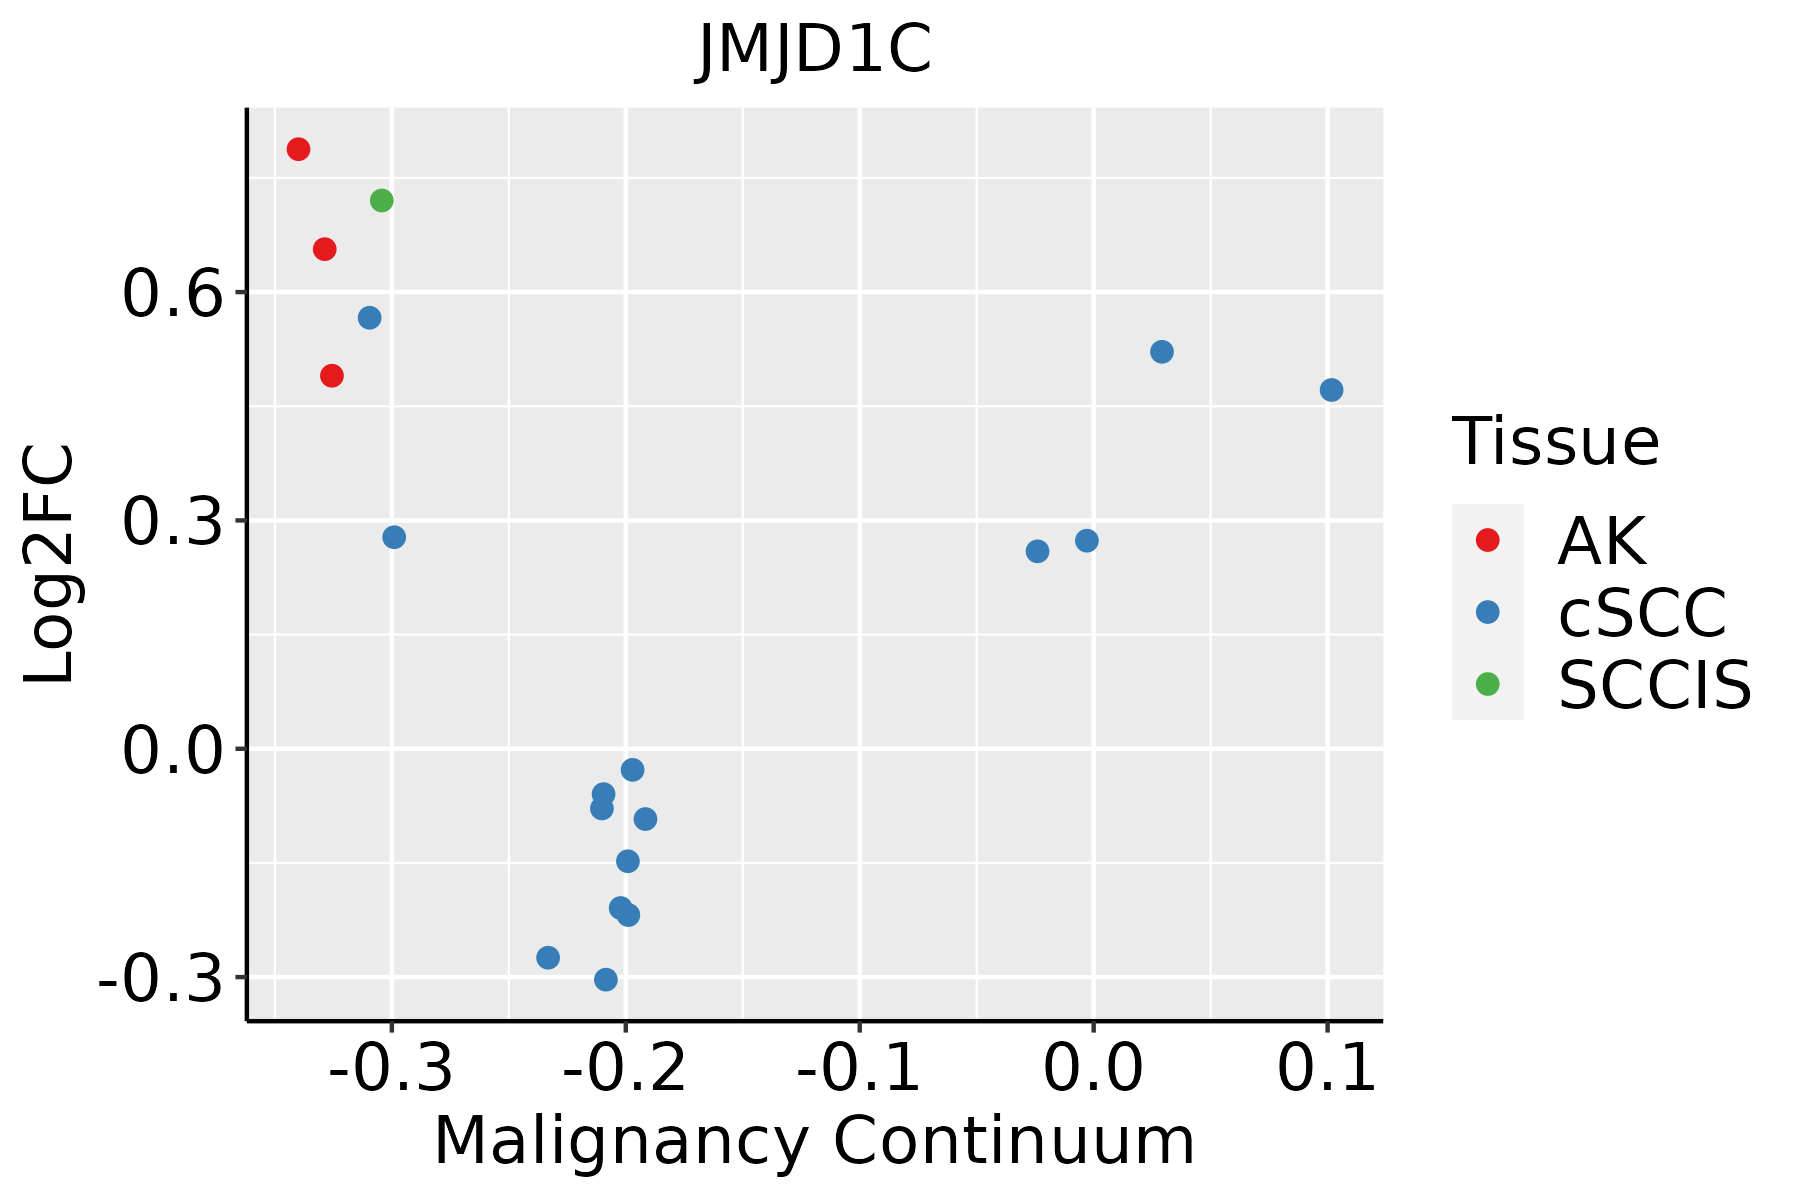 | AK: Actinic keratosis |
| cSCC: Cutaneous squamous cell carcinoma | ||
| SCCIS:squamous cell carcinoma in situ | ||
| Thyroid |  | ATC: Anaplastic thyroid cancer |
| HT: Hashimoto's thyroiditis | ||
| PTC: Papillary thyroid cancer |
| ∗log2FC in expression of this searched gene in stem-like cells from each diseased tissue sample relative to stem-like cells in normal samples in each tissue plotted against the malignancy continuum. Samples are colored based on if they are from different disease stage. |
Top |
Malignant transformation related pathway analysis |
| Find out the enriched GO biological processes and KEGG pathways involved in transition from healthy to precancer to cancer |
| Tissue | Disease Stage | Enriched GO biological Processes |
| Colorectum | AD |  |
| Colorectum | SER |  |
| Colorectum | MSS |  |
| Colorectum | MSI-H |  |
| Colorectum | FAP |  |
| ∗Top 15 enriched GO BP terms are showed in the bar plot of each disease state in each tissue. Each row represents a significant GO biological process which is colored according to the -log10(p.adjust). |
| Page: 1 2 3 4 5 6 7 8 9 |
| GO ID | Tissue | Disease Stage | Description | Gene Ratio | Bg Ratio | pvalue | p.adjust | Count |
| GO:004206010 | Cervix | CC | wound healing | 109/2311 | 422/18723 | 1.84e-14 | 1.57e-11 | 109 |
| GO:005087810 | Cervix | CC | regulation of body fluid levels | 78/2311 | 379/18723 | 3.20e-06 | 8.77e-05 | 78 |
| GO:00165705 | Cervix | CC | histone modification | 84/2311 | 463/18723 | 1.70e-04 | 2.01e-03 | 84 |
| GO:00508176 | Cervix | CC | coagulation | 45/2311 | 222/18723 | 5.08e-04 | 4.94e-03 | 45 |
| GO:00075966 | Cervix | CC | blood coagulation | 44/2311 | 217/18723 | 5.78e-04 | 5.52e-03 | 44 |
| GO:00075996 | Cervix | CC | hemostasis | 44/2311 | 222/18723 | 9.47e-04 | 7.95e-03 | 44 |
| GO:0042060 | Colorectum | AD | wound healing | 128/3918 | 422/18723 | 2.73e-06 | 7.89e-05 | 128 |
| GO:0050878 | Colorectum | AD | regulation of body fluid levels | 108/3918 | 379/18723 | 2.54e-04 | 3.20e-03 | 108 |
| GO:00420601 | Colorectum | SER | wound healing | 97/2897 | 422/18723 | 2.69e-05 | 7.30e-04 | 97 |
| GO:00508781 | Colorectum | SER | regulation of body fluid levels | 81/2897 | 379/18723 | 1.28e-03 | 1.43e-02 | 81 |
| GO:00420602 | Colorectum | MSS | wound healing | 119/3467 | 422/18723 | 5.93e-07 | 2.24e-05 | 119 |
| GO:00508782 | Colorectum | MSS | regulation of body fluid levels | 99/3467 | 379/18723 | 1.40e-04 | 2.07e-03 | 99 |
| GO:0016570 | Colorectum | MSS | histone modification | 113/3467 | 463/18723 | 8.37e-04 | 8.68e-03 | 113 |
| GO:00420603 | Colorectum | MSI-H | wound healing | 47/1319 | 422/18723 | 1.23e-03 | 2.00e-02 | 47 |
| GO:00508783 | Colorectum | MSI-H | regulation of body fluid levels | 41/1319 | 379/18723 | 4.10e-03 | 4.67e-02 | 41 |
| GO:00420604 | Colorectum | FAP | wound healing | 99/2622 | 422/18723 | 9.50e-08 | 6.33e-06 | 99 |
| GO:00165701 | Colorectum | FAP | histone modification | 94/2622 | 463/18723 | 1.06e-04 | 1.76e-03 | 94 |
| GO:00508784 | Colorectum | FAP | regulation of body fluid levels | 79/2622 | 379/18723 | 1.52e-04 | 2.35e-03 | 79 |
| GO:004206016 | Endometrium | AEH | wound healing | 91/2100 | 422/18723 | 4.85e-10 | 4.61e-08 | 91 |
| GO:00075967 | Endometrium | AEH | blood coagulation | 43/2100 | 217/18723 | 1.42e-04 | 1.89e-03 | 43 |
| Page: 1 2 3 4 5 6 7 8 |
| Pathway ID | Tissue | Disease Stage | Description | Gene Ratio | Bg Ratio | pvalue | p.adjust | qvalue | Count |
| hsa05202 | Colorectum | FAP | Transcriptional misregulation in cancer | 45/1404 | 193/8465 | 9.19e-03 | 3.33e-02 | 2.03e-02 | 45 |
| hsa052021 | Colorectum | FAP | Transcriptional misregulation in cancer | 45/1404 | 193/8465 | 9.19e-03 | 3.33e-02 | 2.03e-02 | 45 |
| hsa052028 | Esophagus | ESCC | Transcriptional misregulation in cancer | 116/4205 | 193/8465 | 2.08e-03 | 5.95e-03 | 3.05e-03 | 116 |
| hsa0520213 | Esophagus | ESCC | Transcriptional misregulation in cancer | 116/4205 | 193/8465 | 2.08e-03 | 5.95e-03 | 3.05e-03 | 116 |
| hsa052026 | Lung | IAC | Transcriptional misregulation in cancer | 40/1053 | 193/8465 | 6.90e-04 | 5.90e-03 | 3.92e-03 | 40 |
| hsa0520211 | Lung | IAC | Transcriptional misregulation in cancer | 40/1053 | 193/8465 | 6.90e-04 | 5.90e-03 | 3.92e-03 | 40 |
| hsa052024 | Lung | MIAC | Transcriptional misregulation in cancer | 22/507 | 193/8465 | 2.64e-03 | 2.26e-02 | 1.64e-02 | 22 |
| hsa052025 | Lung | MIAC | Transcriptional misregulation in cancer | 22/507 | 193/8465 | 2.64e-03 | 2.26e-02 | 1.64e-02 | 22 |
| hsa052027 | Prostate | BPH | Transcriptional misregulation in cancer | 53/1718 | 193/8465 | 9.56e-03 | 2.92e-02 | 1.81e-02 | 53 |
| hsa0520212 | Prostate | BPH | Transcriptional misregulation in cancer | 53/1718 | 193/8465 | 9.56e-03 | 2.92e-02 | 1.81e-02 | 53 |
| hsa0520221 | Prostate | Tumor | Transcriptional misregulation in cancer | 59/1791 | 193/8465 | 1.22e-03 | 5.26e-03 | 3.26e-03 | 59 |
| hsa0520231 | Prostate | Tumor | Transcriptional misregulation in cancer | 59/1791 | 193/8465 | 1.22e-03 | 5.26e-03 | 3.26e-03 | 59 |
| Page: 1 |
Top |
Cell-cell communication analysis |
| Identification of potential cell-cell interactions between two cell types and their ligand-receptor pairs for different disease states |
| Ligand | Receptor | LRpair | Pathway | Tissue | Disease Stage |
| Page: 1 |
Top |
Single-cell gene regulatory network inference analysis |
| Find out the significant the regulons (TFs) and the target genes of each regulon across cell types for different disease states |
| TF | Cell Type | Tissue | Disease Stage | Target Gene | RSS | Regulon Activity |
| ∗The dot plots of a searched regulon are shown for all cell subpopulations in each disease state of each tissue based on the regulon specific score inferred using pySCENIC and by calculating the average expression. |
| Page: 1 |
Top |
Somatic mutation of malignant transformation related genes |
| Annotation of somatic variants for genes involved in malignant transformation |
| Hugo Symbol | Variant Class | Variant Classification | dbSNP RS | HGVSc | HGVSp | HGVSp Short | SWISSPROT | BIOTYPE | SIFT | PolyPhen | Tumor Sample Barcode | Tissue | Histology | Sex | Age | Stage | Therapy Types | Drugs | Outcome |
| JMJD1C | SNV | Missense_Mutation | novel | c.6095T>A | p.Leu2032His | p.L2032H | Q15652 | protein_coding | deleterious(0.02) | possibly_damaging(0.695) | TCGA-AC-A3QQ-01 | Breast | breast invasive carcinoma | Female | <65 | I/II | Unknown | Unknown | SD |
| JMJD1C | SNV | Missense_Mutation | novel | c.6920N>G | p.Phe2307Cys | p.F2307C | Q15652 | protein_coding | deleterious(0) | probably_damaging(0.999) | TCGA-AN-A046-01 | Breast | breast invasive carcinoma | Female | >=65 | I/II | Unknown | Unknown | SD |
| JMJD1C | SNV | Missense_Mutation | novel | c.5639N>A | p.Ser1880Tyr | p.S1880Y | Q15652 | protein_coding | deleterious(0.01) | possibly_damaging(0.779) | TCGA-AN-A046-01 | Breast | breast invasive carcinoma | Female | >=65 | I/II | Unknown | Unknown | SD |
| JMJD1C | SNV | Missense_Mutation | rs777175851 | c.4045N>A | p.Gly1349Arg | p.G1349R | Q15652 | protein_coding | tolerated_low_confidence(0.38) | benign(0.003) | TCGA-AN-A046-01 | Breast | breast invasive carcinoma | Female | >=65 | I/II | Unknown | Unknown | SD |
| JMJD1C | SNV | Missense_Mutation | c.949T>A | p.Ser317Thr | p.S317T | Q15652 | protein_coding | deleterious(0.01) | probably_damaging(0.979) | TCGA-AQ-A04J-01 | Breast | breast invasive carcinoma | Female | <65 | I/II | Chemotherapy | cytoxan | SD | |
| JMJD1C | SNV | Missense_Mutation | c.6956N>A | p.Ala2319Asp | p.A2319D | Q15652 | protein_coding | deleterious(0) | probably_damaging(0.999) | TCGA-AR-A24U-01 | Breast | breast invasive carcinoma | Female | <65 | I/II | Chemotherapy | doxorubicin | SD | |
| JMJD1C | SNV | Missense_Mutation | c.4813N>T | p.Asp1605Tyr | p.D1605Y | Q15652 | protein_coding | deleterious(0) | possibly_damaging(0.855) | TCGA-B6-A0RS-01 | Breast | breast invasive carcinoma | Female | <65 | I/II | Unknown | Unknown | PD | |
| JMJD1C | SNV | Missense_Mutation | c.352N>A | p.Glu118Lys | p.E118K | Q15652 | protein_coding | deleterious(0.03) | benign(0.202) | TCGA-BH-A0EA-01 | Breast | breast invasive carcinoma | Female | >=65 | I/II | Chemotherapy | taxotere | CR | |
| JMJD1C | SNV | Missense_Mutation | novel | c.7435G>A | p.Glu2479Lys | p.E2479K | Q15652 | protein_coding | deleterious(0.01) | possibly_damaging(0.472) | TCGA-BH-A2L8-01 | Breast | breast invasive carcinoma | Female | <65 | I/II | Chemotherapy | cytoxan | CR |
| JMJD1C | SNV | Missense_Mutation | c.302C>T | p.Ser101Leu | p.S101L | Q15652 | protein_coding | deleterious(0.03) | benign(0.09) | TCGA-D8-A1J8-01 | Breast | breast invasive carcinoma | Female | >=65 | I/II | Hormone Therapy | nolvadex | SD |
| Page: 1 2 3 4 5 6 7 8 9 10 11 12 13 14 15 16 17 18 19 20 21 22 23 24 25 26 27 28 29 30 31 32 |
Top |
Related drugs of malignant transformation related genes |
| Identification of chemicals and drugs interact with genes involved in malignant transfromation |
| (DGIdb 4.0) |
| Entrez ID | Symbol | Category | Interaction Types | Drug Claim Name | Drug Name | PMIDs |
| Page: 1 |

Copyright 2023-Present -The University of Texas Health Science Center at Houston |