| Entrez ID | Symbol | Replicates | Species | Organ | Tissue | Adj P-value | Log2FC | Malignancy |
| 5349 | FXYD3 | GSM5353218_PA_PB1B_Pool_1_2_S74_L003 | Human | Prostate | Tumor | 9.56e-03 | -8.71e-01 | 0.1479 |
| 5349 | FXYD3 | GSM5353220_PA_PB1B_Pool_3_S51_L002 | Human | Prostate | Tumor | 1.90e-03 | -8.09e-01 | 0.1531 |
| 5349 | FXYD3 | GSM5353222_PA_PB2B_Pool_1_3_S52_L002 | Human | Prostate | Tumor | 2.27e-02 | -3.69e-01 | 0.1608 |
| 5349 | FXYD3 | GSM5353225_PA_PR5196-1_Pool_1_2_3_S53_L002 | Human | Prostate | Tumor | 2.05e-06 | -7.91e-01 | 0.1619 |
| 5349 | FXYD3 | GSM5353226_PA_PR5196-2_Pool_1_2_3_S54_L002 | Human | Prostate | Tumor | 9.46e-03 | -7.70e-01 | 0.159 |
| 5349 | FXYD3 | GSM5353227_PA_PR5199-193K_Pool_1_2_3_S55_L002 | Human | Prostate | Tumor | 2.65e-09 | -5.97e-01 | 0.1602 |
| 5349 | FXYD3 | GSM5353232_PA_PR5249_T1_S3_L001 | Human | Prostate | Tumor | 5.27e-03 | -8.01e-01 | 0.1439 |
| 5349 | FXYD3 | GSM5353236_PA_PR5251_T1_S7_L001 | Human | Prostate | Tumor | 4.97e-04 | -6.53e-01 | 0.1608 |
| 5349 | FXYD3 | GSM5353240_PA_PR5254_T1_S15_L001 | Human | Prostate | Tumor | 5.34e-03 | -1.53e-01 | 0.1575 |
| 5349 | FXYD3 | GSM5353243_PA_PR5261_T1_S23_L002 | Human | Prostate | Tumor | 6.71e-20 | -4.12e-01 | 0.1545 |
| 5349 | FXYD3 | GSM5353244_PA_PR5261_T2_S24_L002 | Human | Prostate | Tumor | 1.05e-11 | -4.36e-01 | 0.1569 |
| 5349 | FXYD3 | GSM5353247_PA_PR5269_3_S27_L002 | Human | Prostate | Tumor | 2.60e-02 | -8.23e-01 | 0.1532 |
| 5349 | FXYD3 | P1_S1_AK | Human | Skin | AK | 4.70e-03 | 2.22e-01 | -0.3399 |
| 5349 | FXYD3 | P2_S3_AK | Human | Skin | AK | 3.38e-06 | 2.60e-01 | -0.3287 |
| 5349 | FXYD3 | P4_S8_cSCC | Human | Skin | cSCC | 8.31e-25 | 5.41e-01 | -0.3095 |
| 5349 | FXYD3 | P5_S10_cSCC | Human | Skin | cSCC | 2.39e-51 | 8.75e-01 | -0.299 |
| 5349 | FXYD3 | P1_cSCC | Human | Skin | cSCC | 1.62e-89 | 4.13e+00 | 0.0292 |
| 5349 | FXYD3 | P2_cSCC | Human | Skin | cSCC | 6.89e-81 | 2.79e+00 | -0.024 |
| 5349 | FXYD3 | P4_cSCC | Human | Skin | cSCC | 2.43e-94 | 3.03e+00 | -0.00290000000000005 |
| 5349 | FXYD3 | P10_cSCC | Human | Skin | cSCC | 1.45e-68 | 2.52e+00 | 0.1017 |
| Tissue | Expression Dynamics | Abbreviation |
| Breast | 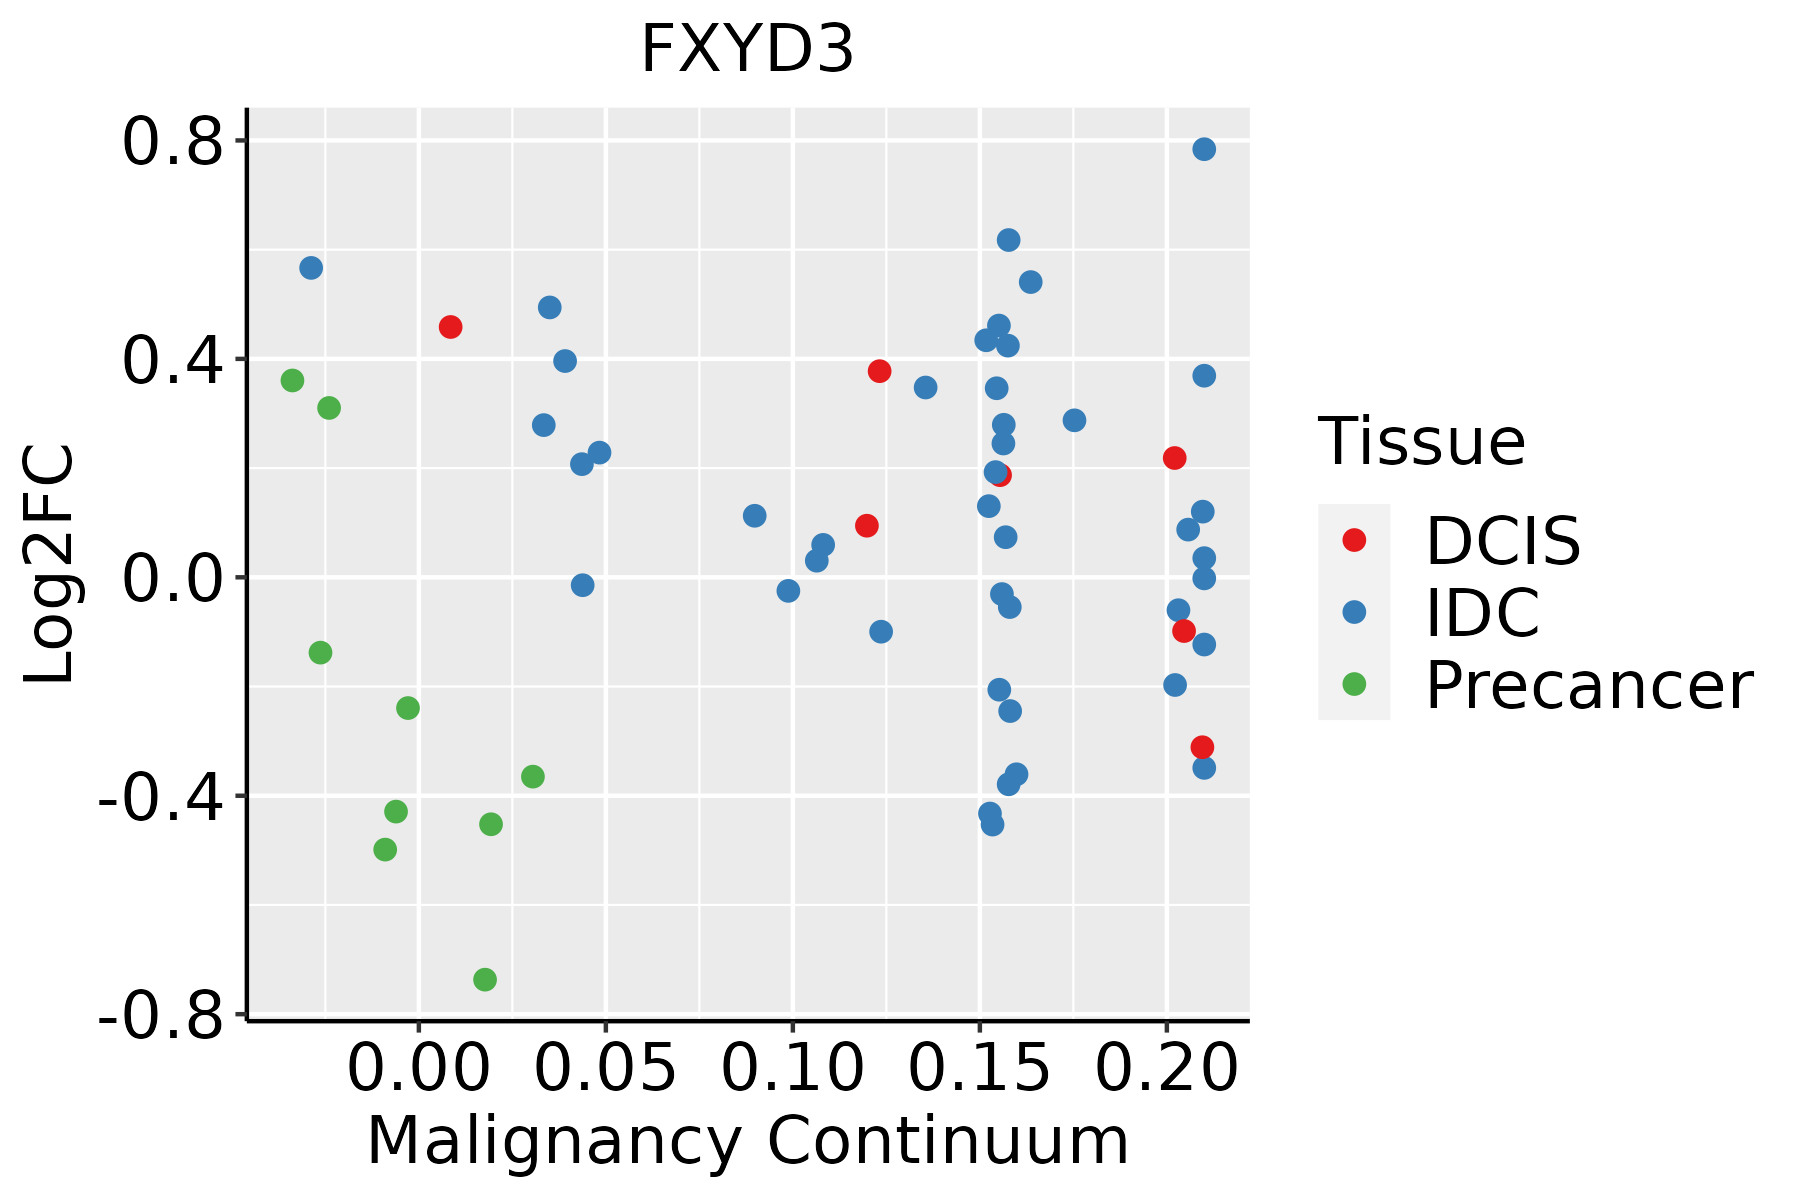 | IDC: Invasive ductal carcinoma |
| DCIS: Ductal carcinoma in situ |
| Precancer(BRCA1-mut): Precancerous lesion from BRCA1 mutation carriers |
| Cervix |  | CC: Cervix cancer |
| HSIL_HPV: HPV-infected high-grade squamous intraepithelial lesions |
| N_HPV: HPV-infected normal cervix |
| Colorectum (GSE201348) |  | FAP: Familial adenomatous polyposis |
| CRC: Colorectal cancer |
| Colorectum (HTA11) |  | AD: Adenomas |
| SER: Sessile serrated lesions |
| MSI-H: Microsatellite-high colorectal cancer |
| MSS: Microsatellite stable colorectal cancer |
| Esophagus | 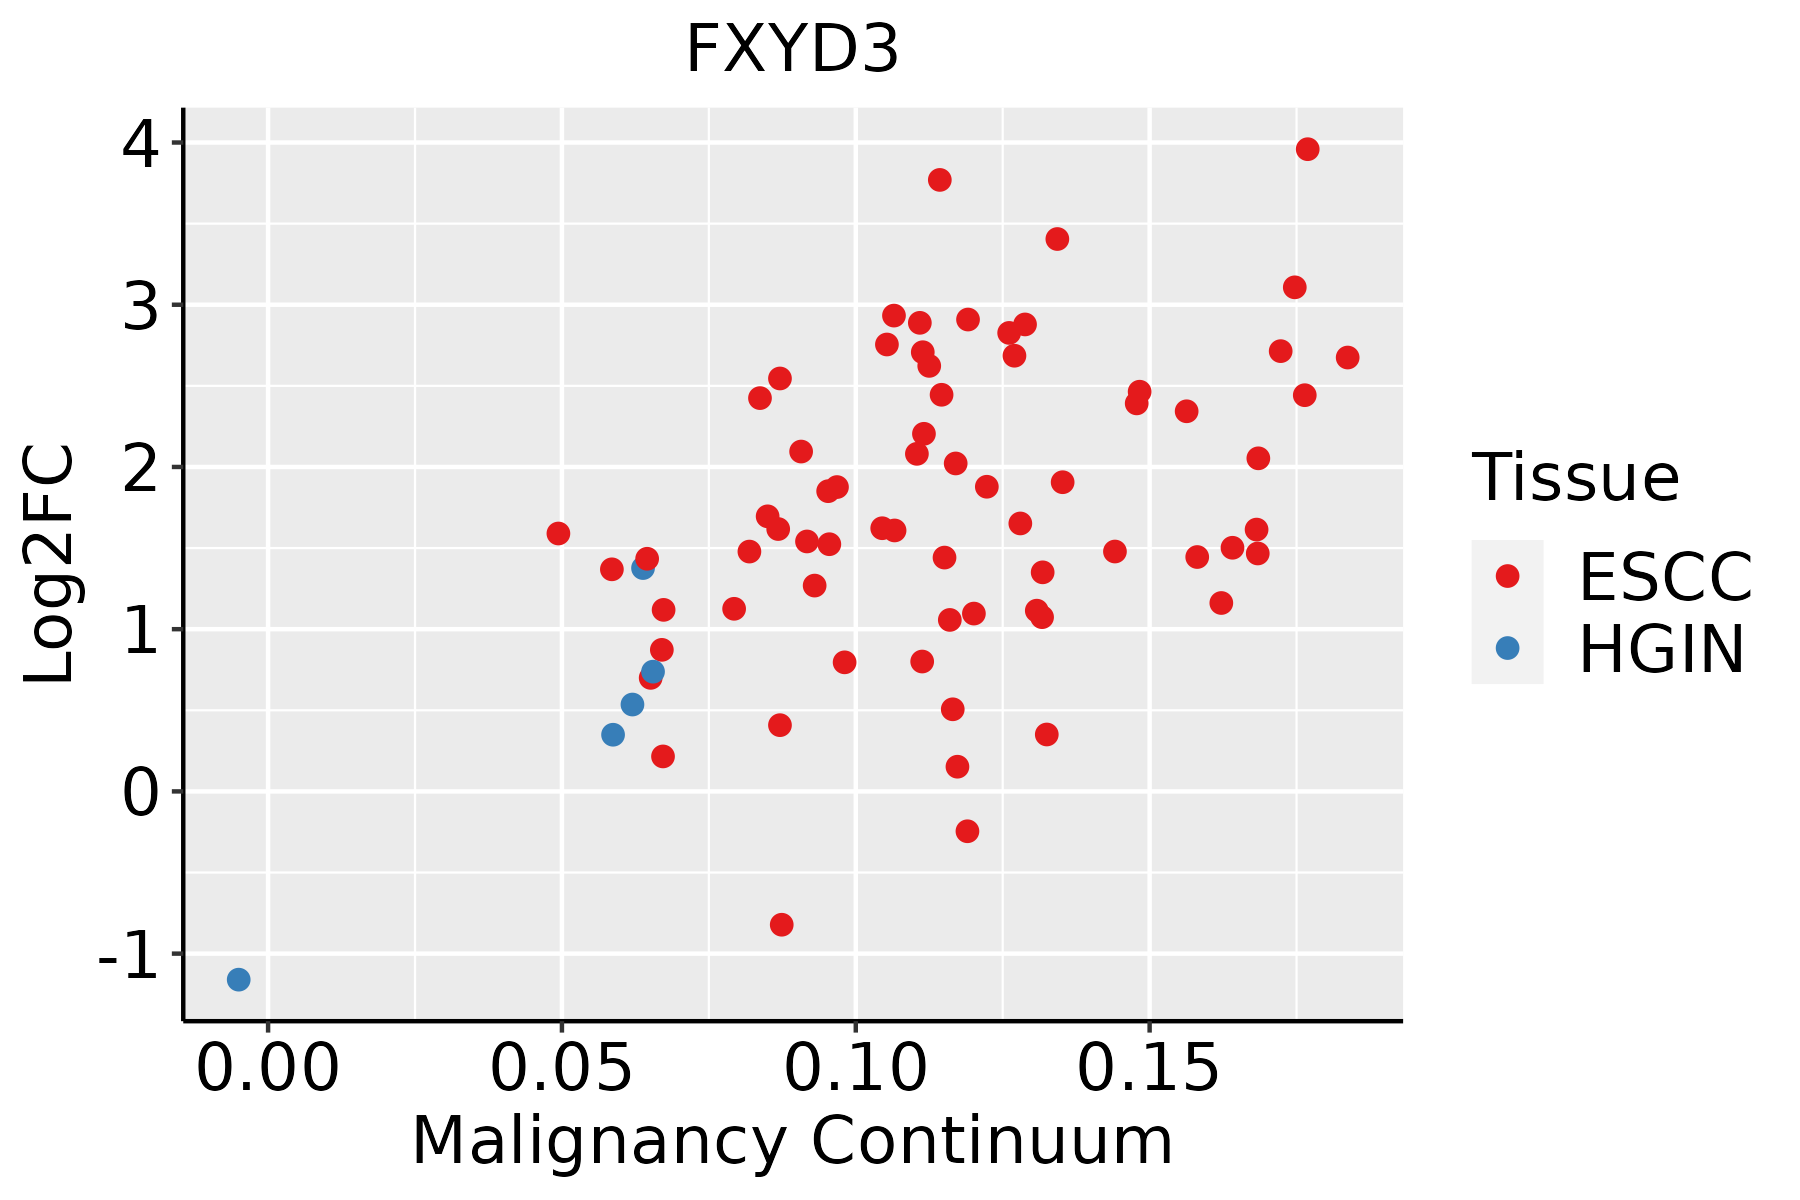 | ESCC: Esophageal squamous cell carcinoma |
| HGIN: High-grade intraepithelial neoplasias |
| LGIN: Low-grade intraepithelial neoplasias |
| GC | 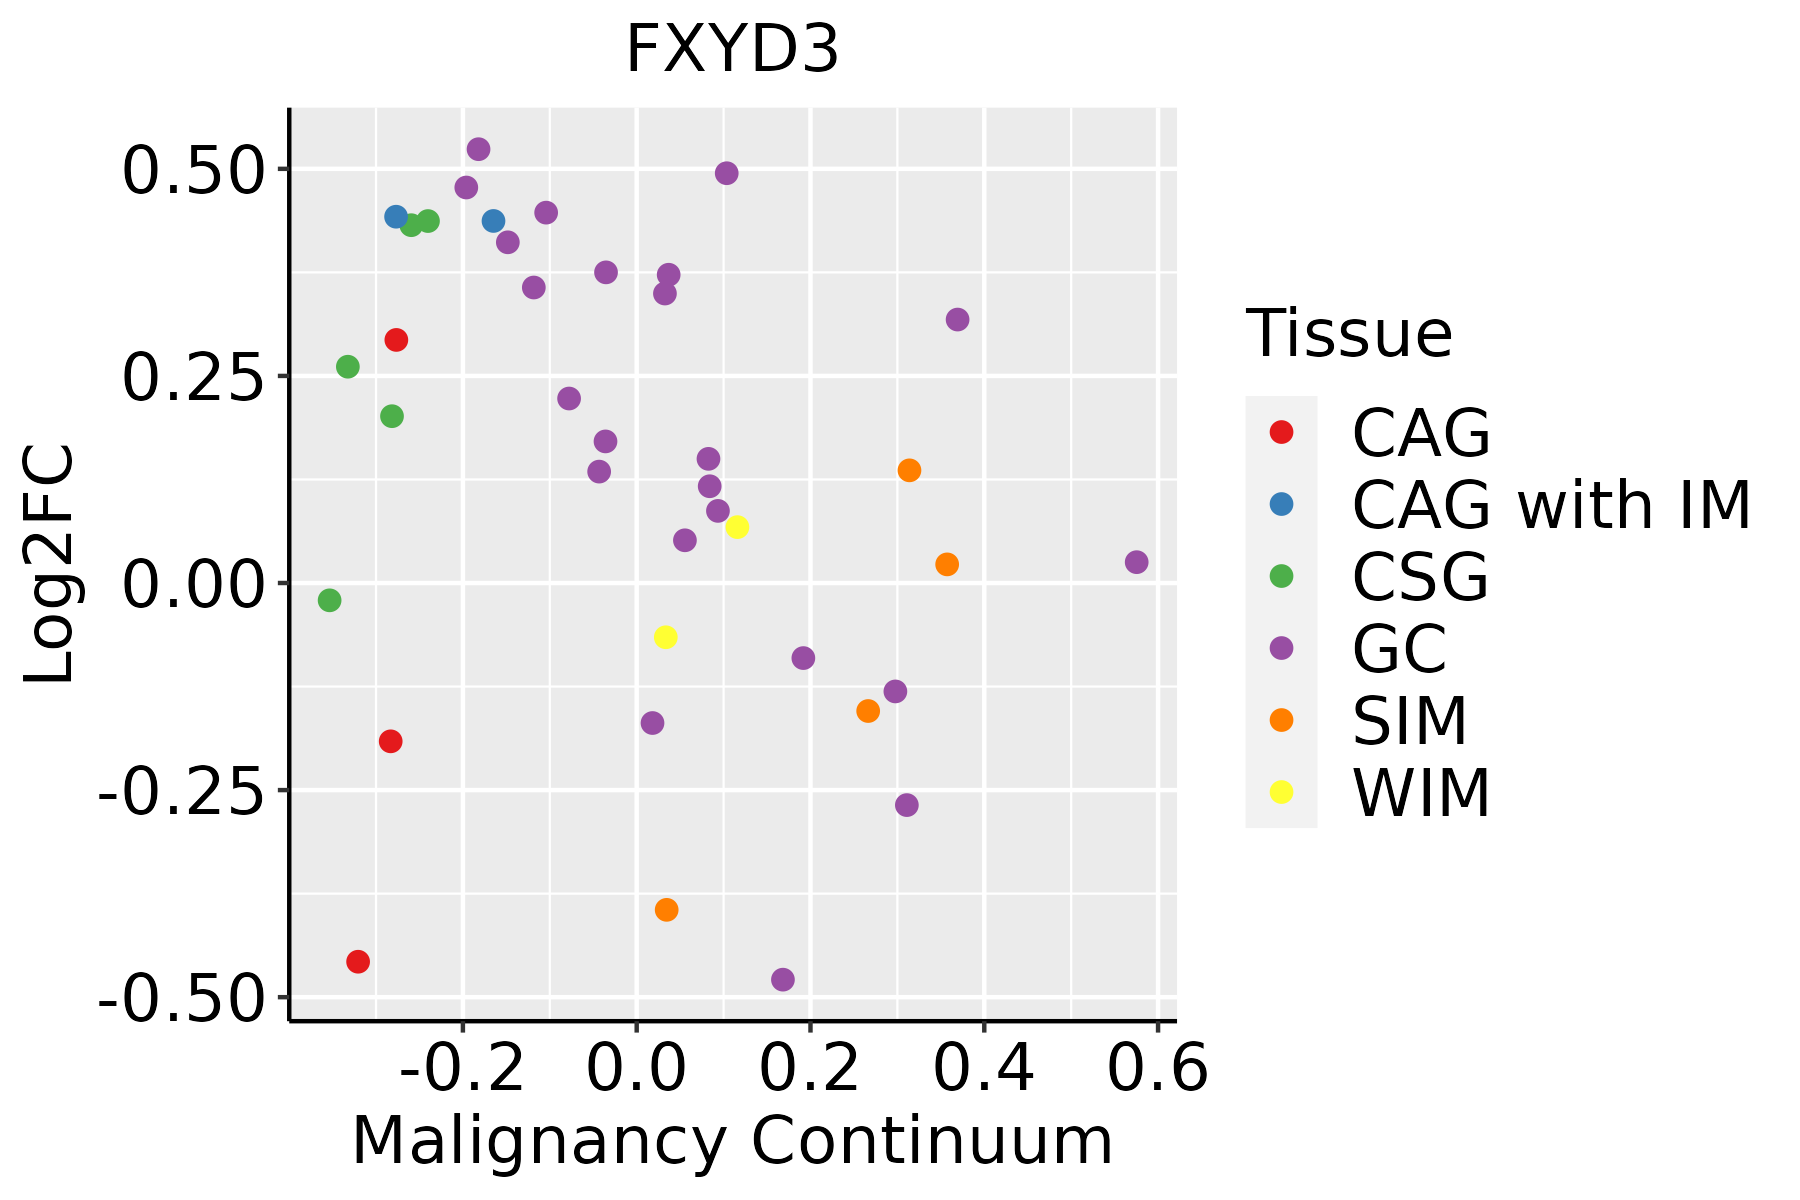 | CAG: Chronic atrophic gastritis |
| CAG with IM: Chronic atrophic gastritis with intestinal metaplasia |
| CSG: Chronic superficial gastritis |
| GC: Gastric cancer |
| SIM: Severe intestinal metaplasia |
| WIM: Wild intestinal metaplasia |
| Lung |  | AAH: Atypical adenomatous hyperplasia |
| AIS: Adenocarcinoma in situ |
| IAC: Invasive lung adenocarcinoma |
| MIA: Minimally invasive adenocarcinoma |
| Oral Cavity | 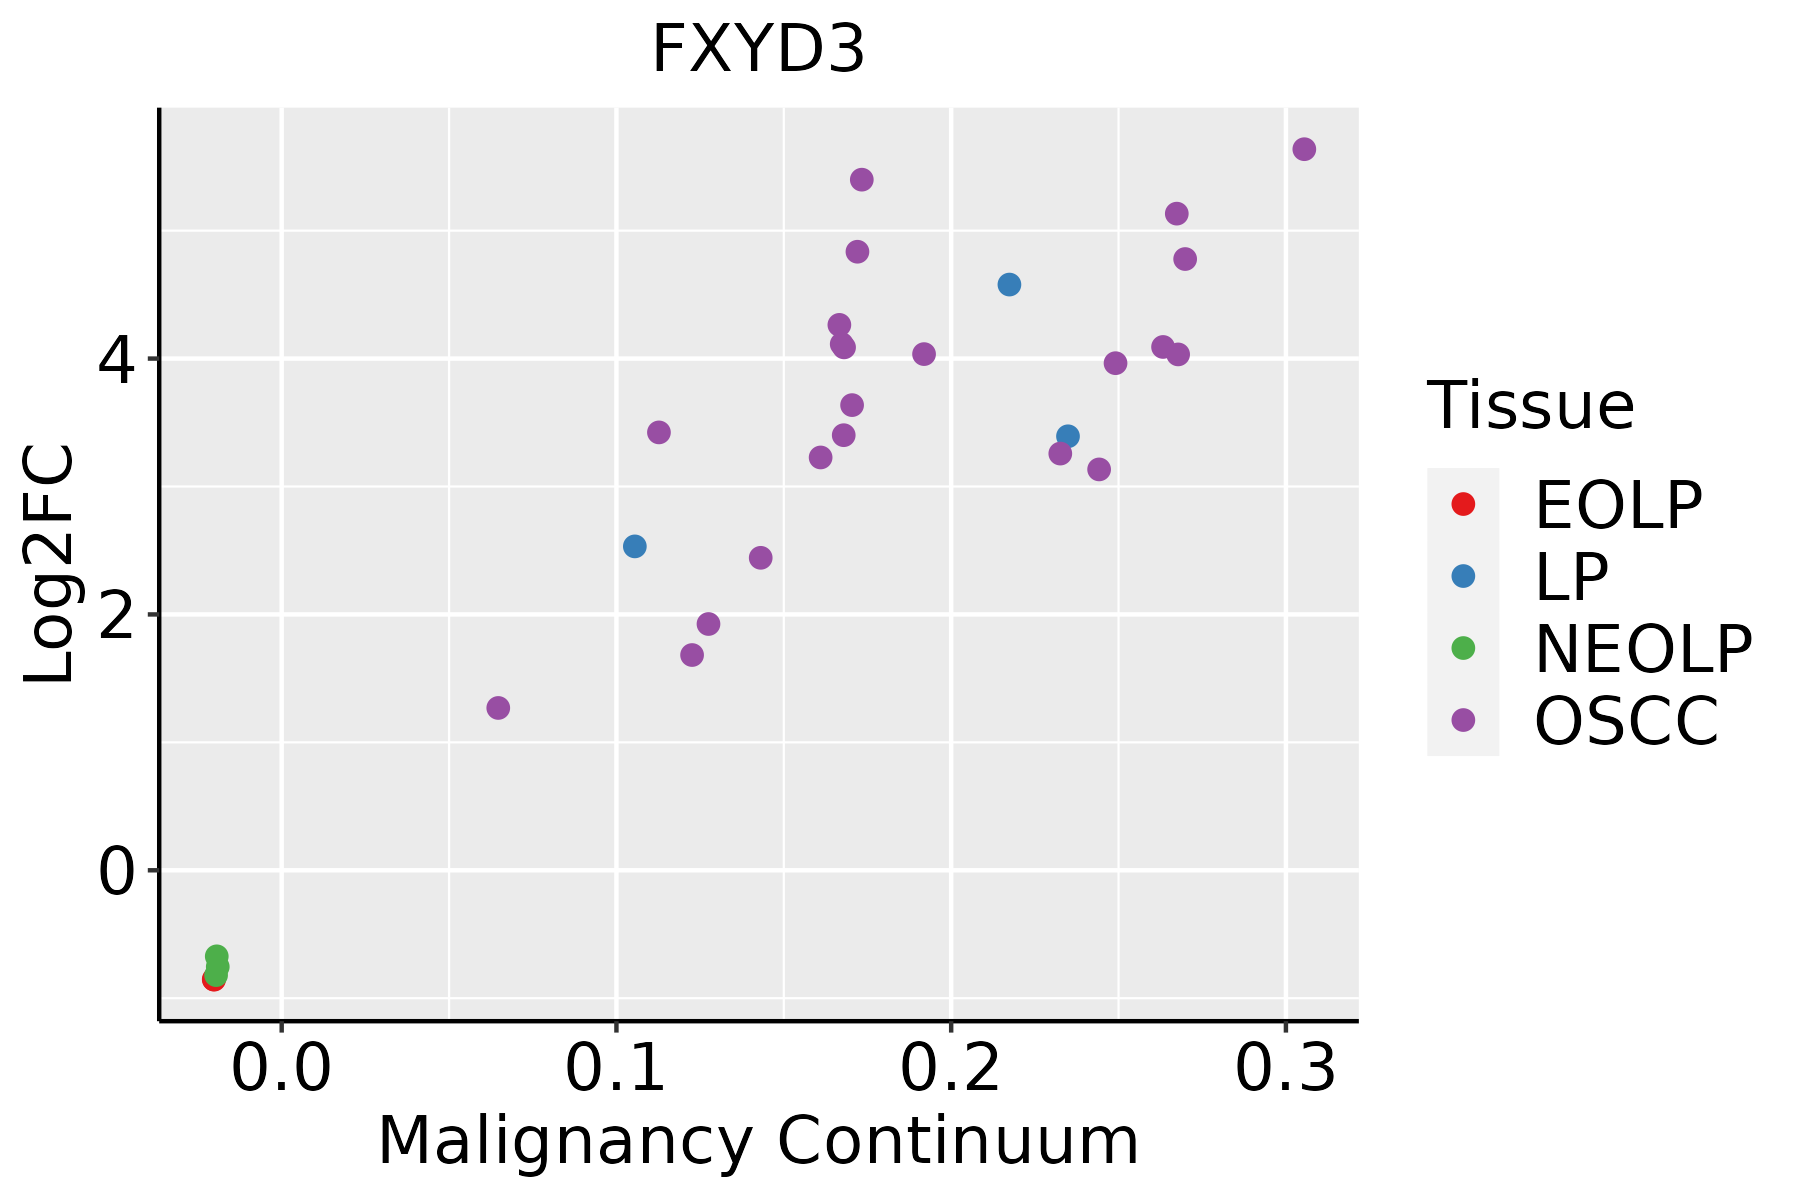 | EOLP: Erosive Oral lichen planus |
| LP: leukoplakia |
| NEOLP: Non-erosive oral lichen planus |
| OSCC: Oral squamous cell carcinoma |
| Prostate | 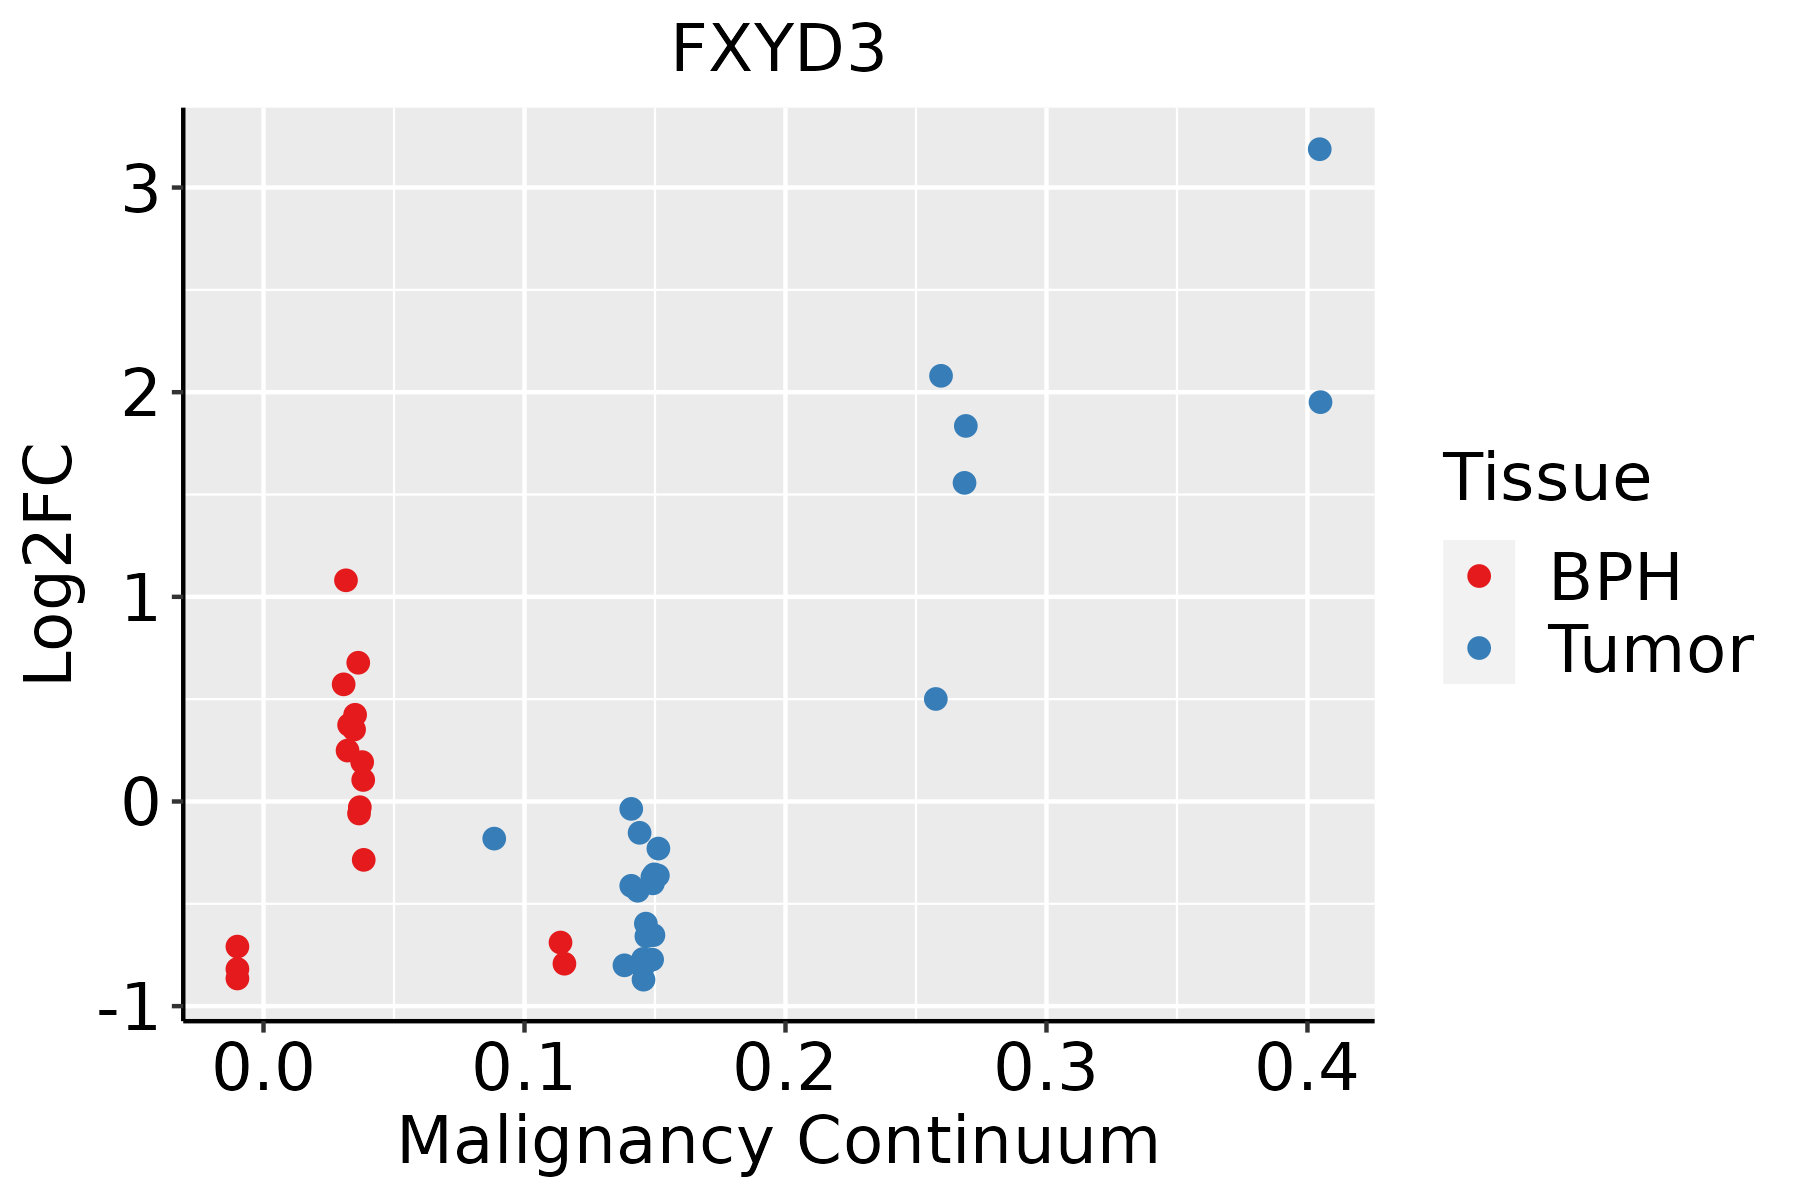 | BPH: Benign Prostatic Hyperplasia |
| Skin | 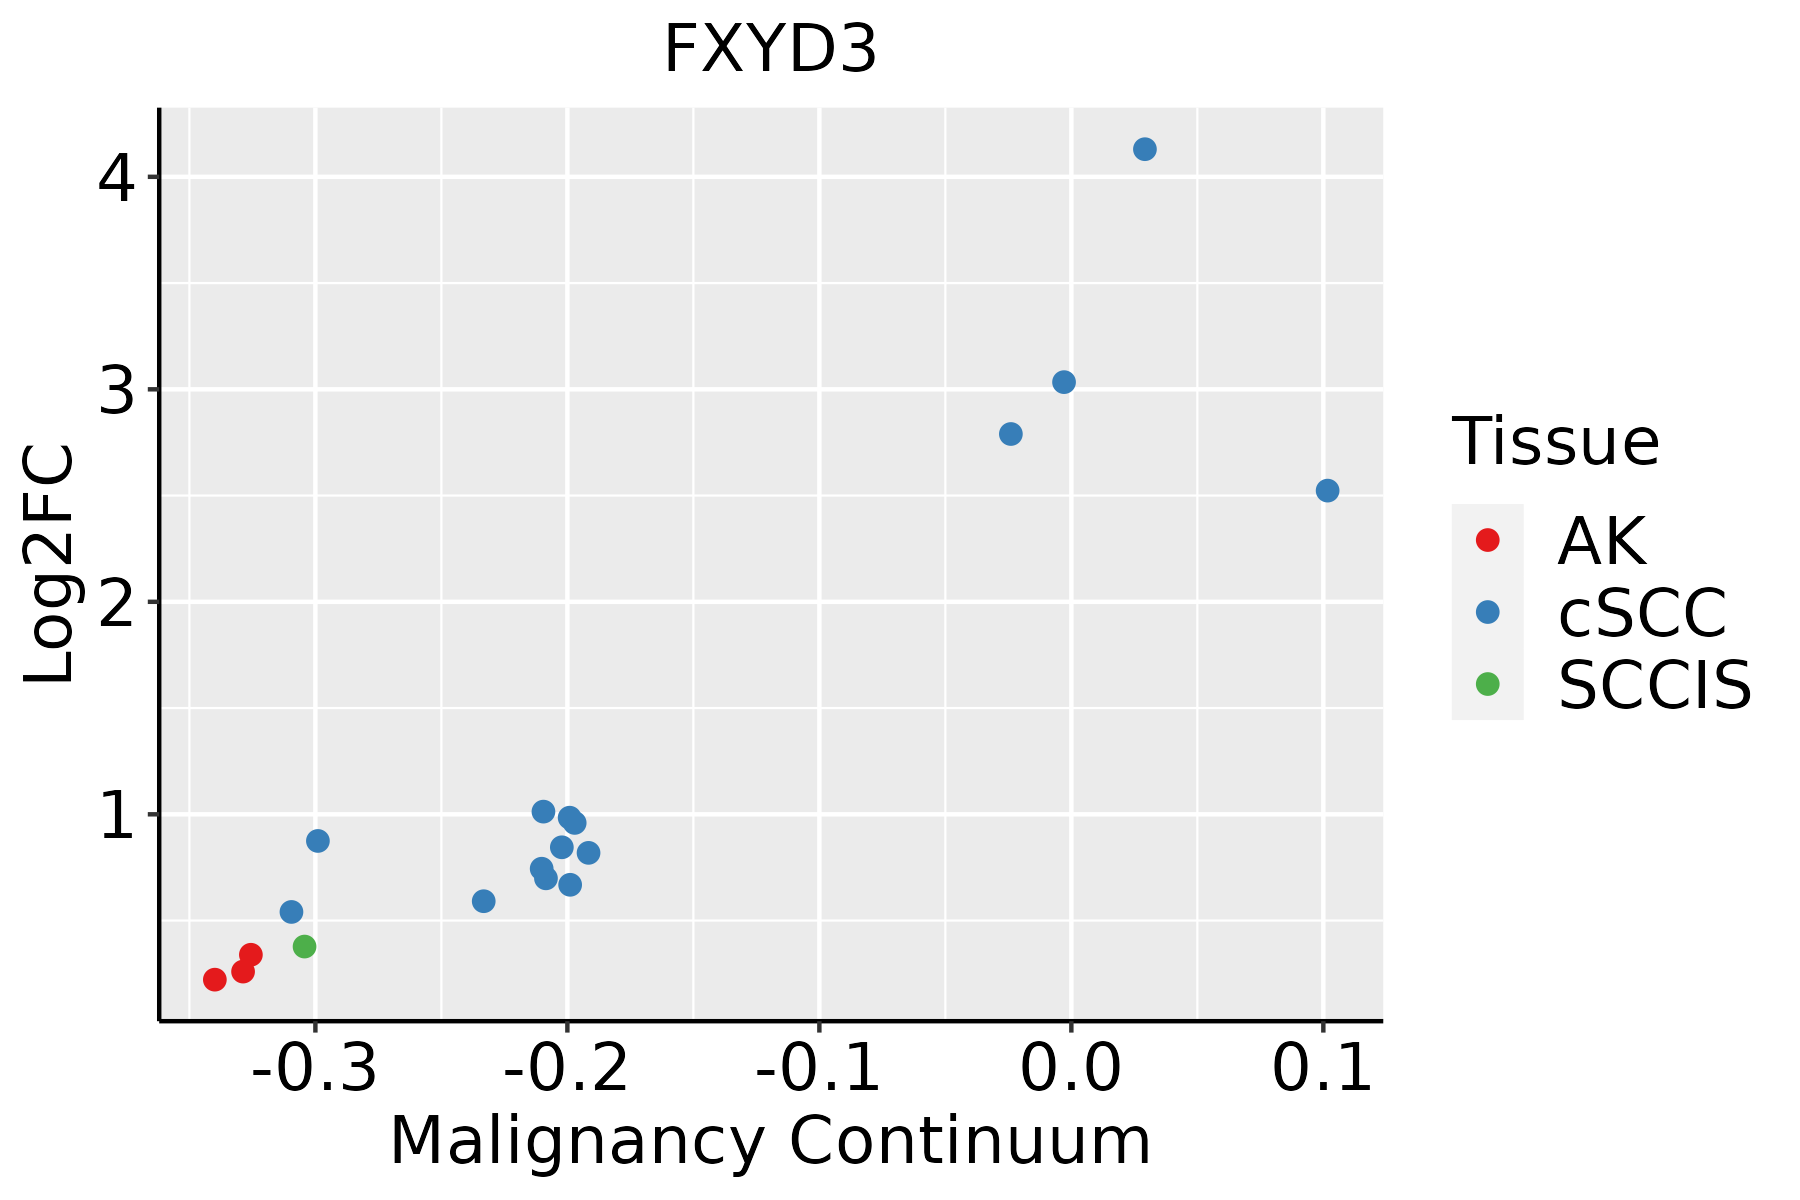 | AK: Actinic keratosis |
| cSCC: Cutaneous squamous cell carcinoma |
| SCCIS:squamous cell carcinoma in situ |
| GO ID | Tissue | Disease Stage | Description | Gene Ratio | Bg Ratio | pvalue | p.adjust | Count |
| GO:00109596 | Breast | Precancer | regulation of metal ion transport | 37/1080 | 406/18723 | 4.07e-03 | 3.22e-02 | 37 |
| GO:00228985 | Breast | Precancer | regulation of transmembrane transporter activity | 27/1080 | 278/18723 | 5.72e-03 | 4.11e-02 | 27 |
| GO:001095913 | Breast | IDC | regulation of metal ion transport | 52/1434 | 406/18723 | 1.76e-04 | 2.97e-03 | 52 |
| GO:002289812 | Breast | IDC | regulation of transmembrane transporter activity | 36/1434 | 278/18723 | 1.35e-03 | 1.40e-02 | 36 |
| GO:00324125 | Breast | IDC | regulation of ion transmembrane transporter activity | 33/1434 | 267/18723 | 4.38e-03 | 3.40e-02 | 33 |
| GO:00324096 | Breast | IDC | regulation of transporter activity | 37/1434 | 310/18723 | 4.77e-03 | 3.66e-02 | 37 |
| GO:001095921 | Breast | DCIS | regulation of metal ion transport | 50/1390 | 406/18723 | 2.86e-04 | 4.22e-03 | 50 |
| GO:002289822 | Breast | DCIS | regulation of transmembrane transporter activity | 35/1390 | 278/18723 | 1.50e-03 | 1.51e-02 | 35 |
| GO:003241212 | Breast | DCIS | regulation of ion transmembrane transporter activity | 32/1390 | 267/18723 | 4.97e-03 | 3.72e-02 | 32 |
| GO:003240912 | Breast | DCIS | regulation of transporter activity | 36/1390 | 310/18723 | 5.05e-03 | 3.74e-02 | 36 |
| GO:19023059 | Cervix | CC | regulation of sodium ion transmembrane transport | 19/2311 | 68/18723 | 4.21e-04 | 4.25e-03 | 19 |
| GO:00020288 | Cervix | CC | regulation of sodium ion transport | 21/2311 | 90/18723 | 2.71e-03 | 1.85e-02 | 21 |
| GO:20006498 | Cervix | CC | regulation of sodium ion transmembrane transporter activity | 15/2311 | 58/18723 | 3.75e-03 | 2.38e-02 | 15 |
| GO:0002028 | Colorectum | AD | regulation of sodium ion transport | 36/3918 | 90/18723 | 2.89e-05 | 5.37e-04 | 36 |
| GO:1902305 | Colorectum | AD | regulation of sodium ion transmembrane transport | 27/3918 | 68/18723 | 3.19e-04 | 3.80e-03 | 27 |
| GO:2000649 | Colorectum | AD | regulation of sodium ion transmembrane transporter activity | 23/3918 | 58/18723 | 8.82e-04 | 8.53e-03 | 23 |
| GO:0015698 | Colorectum | AD | inorganic anion transport | 52/3918 | 180/18723 | 6.83e-03 | 4.22e-02 | 52 |
| GO:00020281 | Colorectum | SER | regulation of sodium ion transport | 28/2897 | 90/18723 | 1.45e-04 | 2.86e-03 | 28 |
| GO:19023051 | Colorectum | SER | regulation of sodium ion transmembrane transport | 21/2897 | 68/18723 | 1.05e-03 | 1.22e-02 | 21 |
| GO:20006491 | Colorectum | SER | regulation of sodium ion transmembrane transporter activity | 18/2897 | 58/18723 | 2.18e-03 | 2.11e-02 | 18 |
| Hugo Symbol | Variant Class | Variant Classification | dbSNP RS | HGVSc | HGVSp | HGVSp Short | SWISSPROT | BIOTYPE | SIFT | PolyPhen | Tumor Sample Barcode | Tissue | Histology | Sex | Age | Stage | Therapy Types | Drugs | Outcome |
| FXYD3 | SNV | Missense_Mutation | | c.292G>C | p.Gly98Arg | p.G98R | Q14802 | protein_coding | deleterious(0) | probably_damaging(1) | TCGA-AC-A2BK-01 | Breast | breast invasive carcinoma | Female | >=65 | III/IV | Chemotherapy | cytoxan | CR |
| FXYD3 | SNV | Missense_Mutation | | c.203N>G | p.Phe68Cys | p.F68C | Q14802 | protein_coding | deleterious(0.01) | possibly_damaging(0.753) | TCGA-C8-A26Z-01 | Breast | breast invasive carcinoma | Female | <65 | I/II | Hormone Therapy | tamoxiphen | CR |
| FXYD3 | SNV | Missense_Mutation | novel | c.310G>T | p.Val104Phe | p.V104F | Q14802 | protein_coding | deleterious(0) | possibly_damaging(0.868) | TCGA-EA-A3HU-01 | Cervix | cervical & endocervical cancer | Female | <65 | I/II | Unknown | Unknown | SD |
| FXYD3 | SNV | Missense_Mutation | novel | c.323T>C | p.Met108Thr | p.M108T | Q14802 | protein_coding | deleterious(0.04) | benign(0.03) | TCGA-CA-6717-01 | Colorectum | colon adenocarcinoma | Male | <65 | I/II | Chemotherapy | oxaliplatin | CR |
| FXYD3 | SNV | Missense_Mutation | novel | c.128C>T | p.Ala43Val | p.A43V | Q14802 | protein_coding | deleterious_low_confidence(0.01) | probably_damaging(0.915) | TCGA-F5-6814-01 | Colorectum | rectum adenocarcinoma | Male | <65 | I/II | Unknown | Unknown | SD |
| FXYD3 | SNV | Missense_Mutation | novel | c.145C>T | p.Leu49Phe | p.L49F | Q14802 | protein_coding | tolerated(0.24) | probably_damaging(0.974) | TCGA-A5-A0G2-01 | Endometrium | uterine corpus endometrioid carcinoma | Female | <65 | III/IV | Unknown | Unknown | SD |
| FXYD3 | SNV | Missense_Mutation | novel | c.257N>A | p.Pro86His | p.P86H | Q14802 | protein_coding | deleterious(0.01) | probably_damaging(0.999) | TCGA-AJ-A5DW-01 | Endometrium | uterine corpus endometrioid carcinoma | Female | <65 | I/II | Unknown | Unknown | SD |
| FXYD3 | SNV | Missense_Mutation | | c.274N>T | p.His92Tyr | p.H92Y | Q14802 | protein_coding | tolerated(0.17) | benign(0.013) | TCGA-AX-A1C4-01 | Endometrium | uterine corpus endometrioid carcinoma | Female | <65 | I/II | Unknown | Unknown | SD |
| FXYD3 | SNV | Missense_Mutation | novel | c.257N>A | p.Pro86His | p.P86H | Q14802 | protein_coding | deleterious(0.01) | probably_damaging(0.999) | TCGA-AX-A2HC-01 | Endometrium | uterine corpus endometrioid carcinoma | Female | <65 | III/IV | Chemotherapy | paclitaxel | PD |
| FXYD3 | SNV | Missense_Mutation | novel | c.248A>C | p.Lys83Thr | p.K83T | Q14802 | protein_coding | deleterious(0.02) | probably_damaging(0.976) | TCGA-BK-A6W3-01 | Endometrium | uterine corpus endometrioid carcinoma | Female | <65 | I/II | Unknown | Unknown | SD |


