
|
|||||
|
 | |
| |
| |
| |
| |
| |
|
Gene: TM4SF1 |
Gene summary for TM4SF1 |
| Gene information | Species | Human | Gene symbol | TM4SF1 | Gene ID | 4071 |
| Gene name | transmembrane 4 L six family member 1 | |
| Gene Alias | H-L6 | |
| Cytomap | 3q25.1 | |
| Gene Type | protein-coding | GO ID | GO:0008150 | UniProtAcc | P30408 |
Top |
Malignant transformation analysis |
| Identification of the aberrant gene expression in precancerous and cancerous lesions by comparing the gene expression of stem-like cells in diseased tissues with normal stem cells |
| Entrez ID | Symbol | Replicates | Species | Organ | Tissue | Adj P-value | Log2FC | Malignancy |
| 4071 | TM4SF1 | Dong_P3 | Human | Prostate | Tumor | 1.01e-38 | -9.51e-01 | 0.0278 |
| 4071 | TM4SF1 | Dong_P4 | Human | Prostate | Tumor | 9.27e-08 | -7.43e-01 | 0.0292 |
| 4071 | TM4SF1 | Dong_P5 | Human | Prostate | Tumor | 7.00e-59 | -8.26e-01 | 0.053 |
| 4071 | TM4SF1 | Dong_P6 | Human | Prostate | Tumor | 2.41e-17 | -9.26e-01 | 0.0371 |
| 4071 | TM4SF1 | P7 | Human | Prostate | Tumor | 3.78e-06 | 6.12e-01 | -0.1025 |
| 4071 | TM4SF1 | P9 | Human | Prostate | Tumor | 7.31e-13 | -7.71e-01 | -0.0285 |
| 4071 | TM4SF1 | P10 | Human | Prostate | Tumor | 2.79e-29 | 1.39e+00 | -0.0902 |
| 4071 | TM4SF1 | GSM5353215_PA_AUG_PB_1B_S2 | Human | Prostate | Tumor | 1.79e-16 | -1.64e+00 | 0.1557 |
| 4071 | TM4SF1 | GSM5353216_PA_PB1A_Pool_1_3_S50_L002 | Human | Prostate | Tumor | 3.01e-13 | -1.57e+00 | 0.159 |
| 4071 | TM4SF1 | GSM5353217_PA_PB1A_Pool_2_S107_L004 | Human | Prostate | Tumor | 5.19e-07 | -1.41e+00 | 0.156 |
| 4071 | TM4SF1 | GSM5353218_PA_PB1B_Pool_1_2_S74_L003 | Human | Prostate | Tumor | 1.02e-12 | -1.65e+00 | 0.1479 |
| 4071 | TM4SF1 | GSM5353220_PA_PB1B_Pool_3_S51_L002 | Human | Prostate | Tumor | 1.49e-14 | -1.64e+00 | 0.1531 |
| 4071 | TM4SF1 | GSM5353221_PA_PB2A_Pool_1_3_S25_L001 | Human | Prostate | Tumor | 3.63e-27 | -1.24e+00 | 0.1633 |
| 4071 | TM4SF1 | GSM5353222_PA_PB2B_Pool_1_3_S52_L002 | Human | Prostate | Tumor | 3.61e-36 | -1.24e+00 | 0.1608 |
| 4071 | TM4SF1 | GSM5353223_PA_PB2B_Pool_2_S26_L001 | Human | Prostate | Tumor | 2.21e-26 | -1.34e+00 | 0.1604 |
| 4071 | TM4SF1 | GSM5353224_PA_PR5186_Pool_1_2_3_S27_L001 | Human | Prostate | Tumor | 5.19e-17 | -9.82e-01 | 0.1621 |
| 4071 | TM4SF1 | GSM5353225_PA_PR5196-1_Pool_1_2_3_S53_L002 | Human | Prostate | Tumor | 1.39e-11 | -1.07e+00 | 0.1619 |
| 4071 | TM4SF1 | GSM5353226_PA_PR5196-2_Pool_1_2_3_S54_L002 | Human | Prostate | Tumor | 1.29e-11 | -1.31e+00 | 0.159 |
| 4071 | TM4SF1 | GSM5353227_PA_PR5199-193K_Pool_1_2_3_S55_L002 | Human | Prostate | Tumor | 3.86e-29 | -1.26e+00 | 0.1602 |
| 4071 | TM4SF1 | GSM5353228_PA_PR5199-640K_Pool_1_3_S108_L004 | Human | Prostate | Tumor | 3.32e-07 | -1.37e+00 | 0.1537 |
| Page: 1 2 3 4 5 6 7 8 9 10 11 12 13 14 15 16 |
| Tissue | Expression Dynamics | Abbreviation |
| Breast | 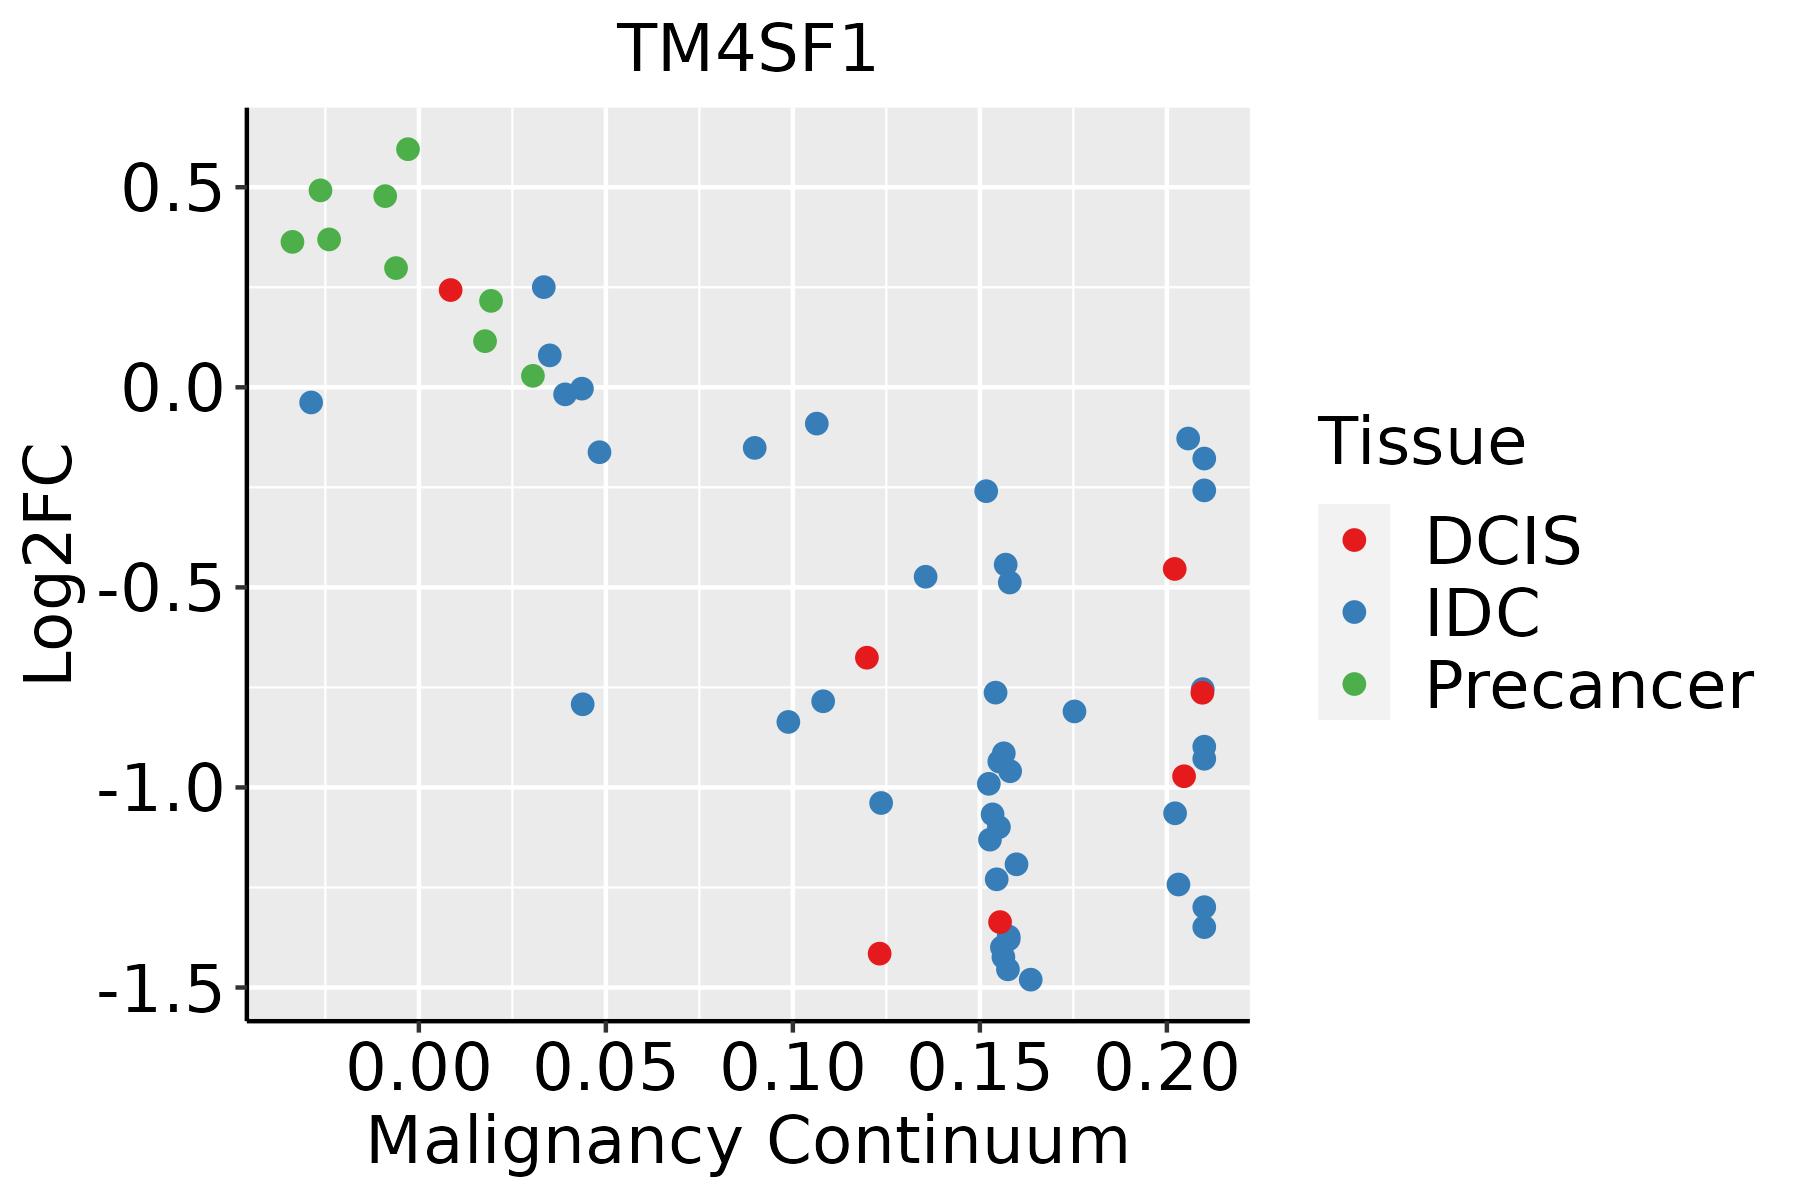 | IDC: Invasive ductal carcinoma |
| DCIS: Ductal carcinoma in situ | ||
| Precancer(BRCA1-mut): Precancerous lesion from BRCA1 mutation carriers | ||
| Cervix |  | CC: Cervix cancer |
| HSIL_HPV: HPV-infected high-grade squamous intraepithelial lesions | ||
| N_HPV: HPV-infected normal cervix | ||
| Colorectum (GSE201348) | 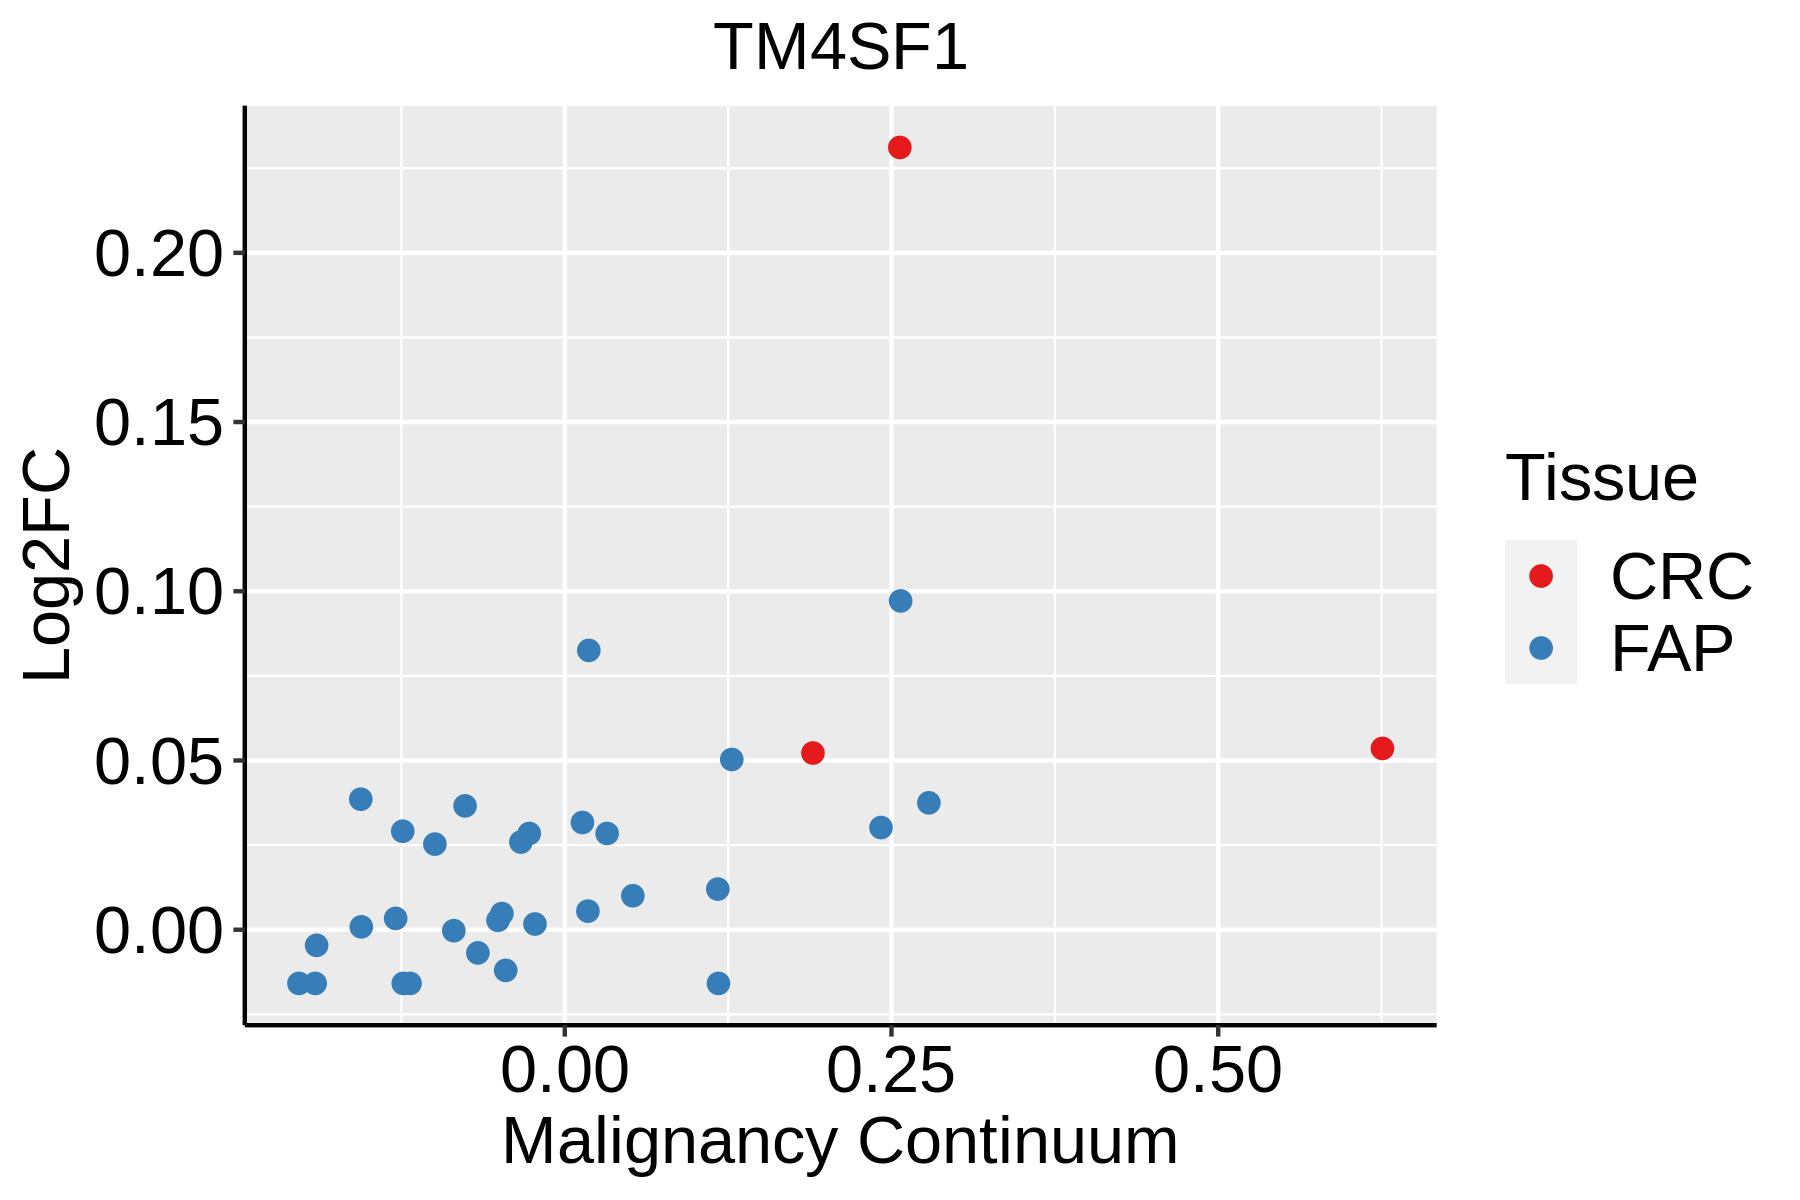 | FAP: Familial adenomatous polyposis |
| CRC: Colorectal cancer | ||
| Colorectum (HTA11) |  | AD: Adenomas |
| SER: Sessile serrated lesions | ||
| MSI-H: Microsatellite-high colorectal cancer | ||
| MSS: Microsatellite stable colorectal cancer | ||
| Endometrium | 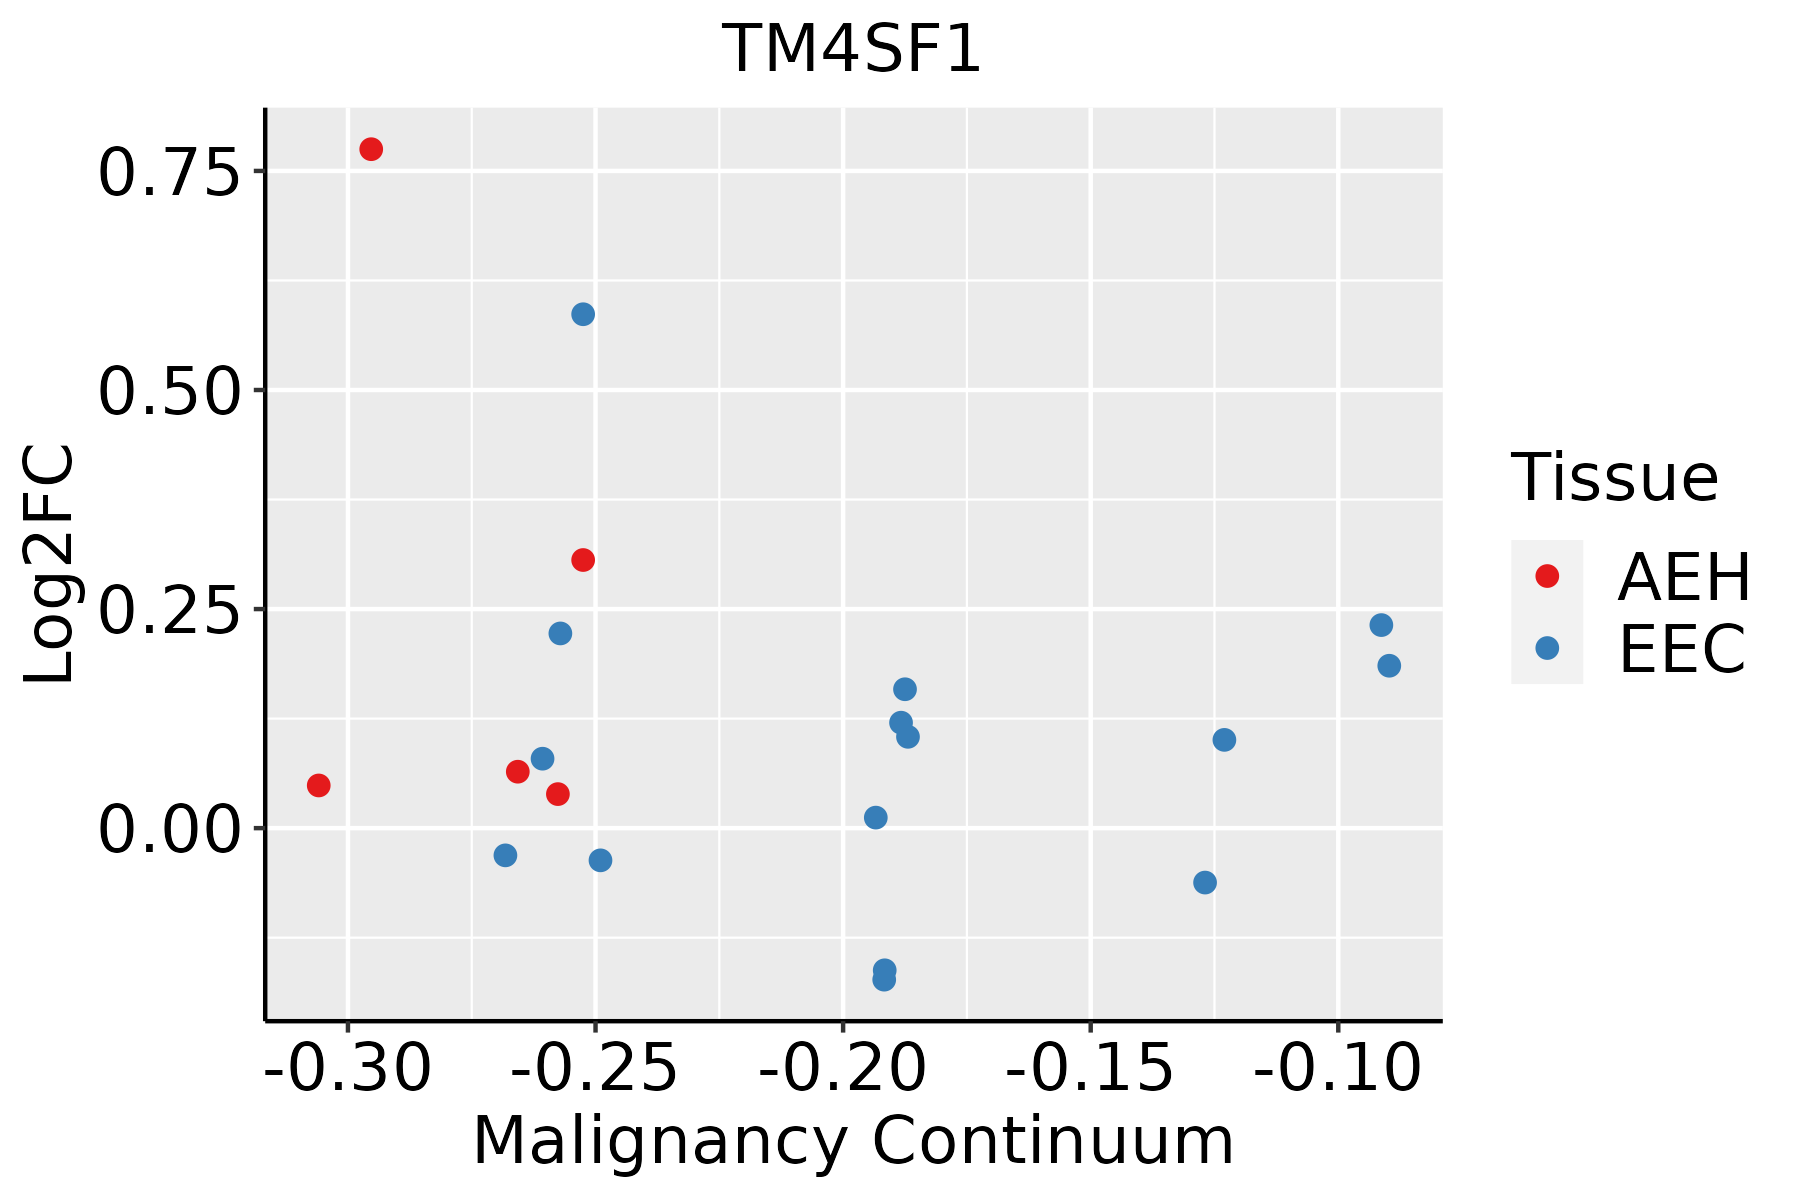 | AEH: Atypical endometrial hyperplasia |
| EEC: Endometrioid Cancer | ||
| Esophagus | 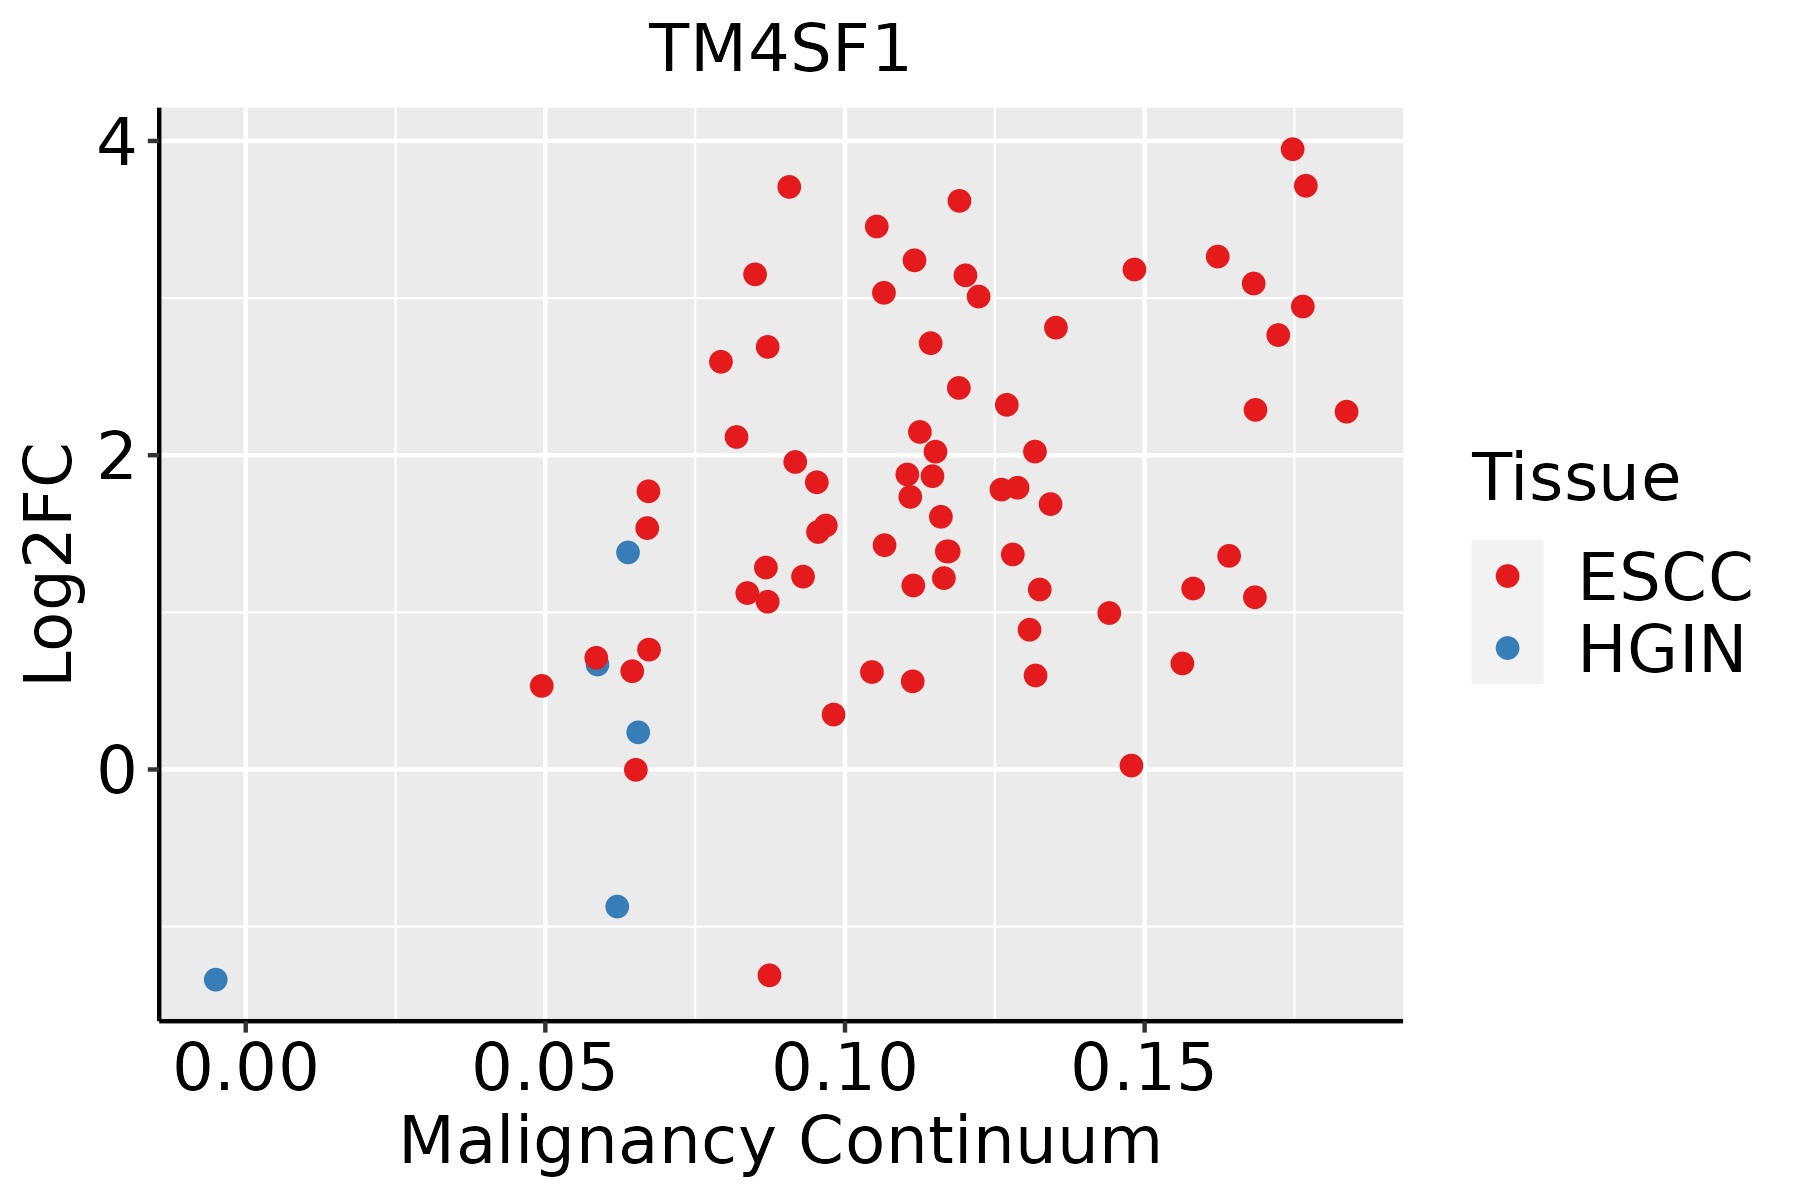 | ESCC: Esophageal squamous cell carcinoma |
| HGIN: High-grade intraepithelial neoplasias | ||
| LGIN: Low-grade intraepithelial neoplasias | ||
| GC | 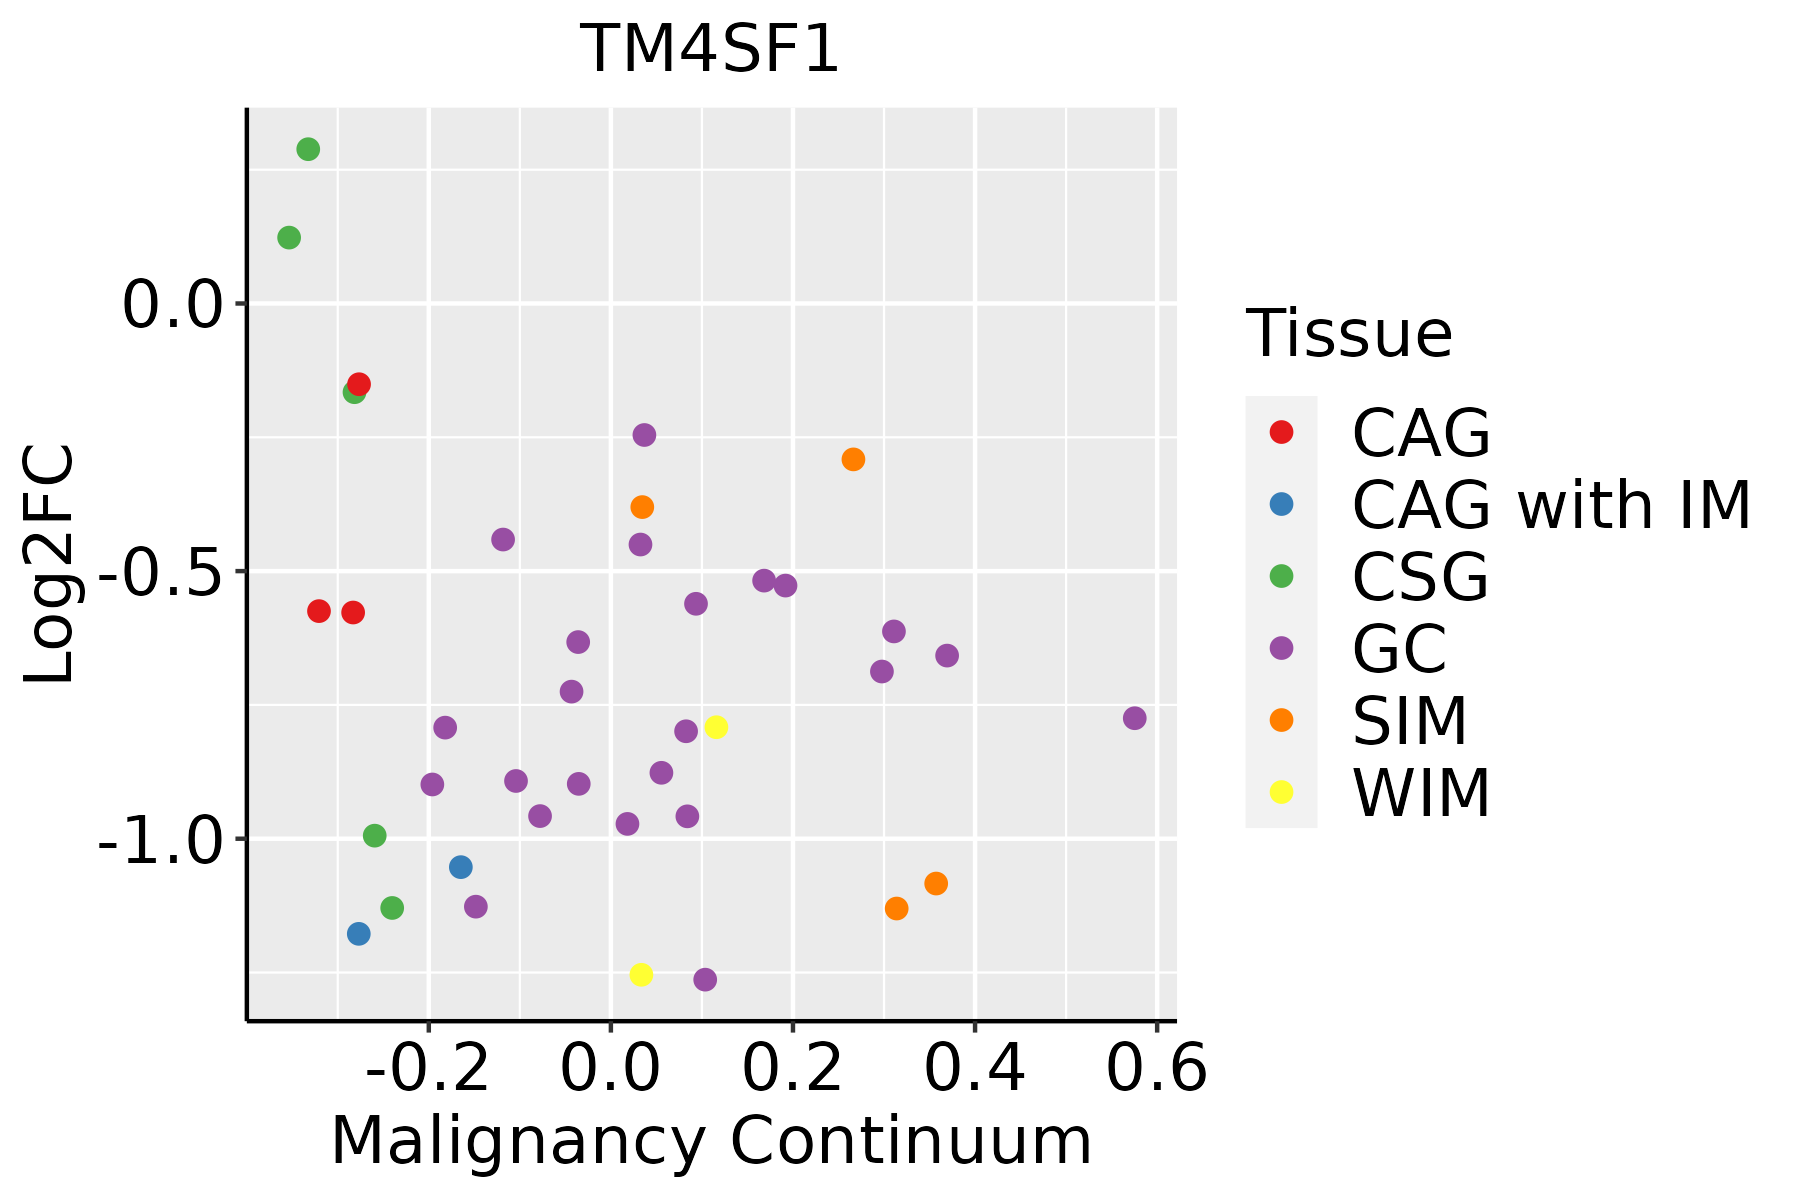 | CAG: Chronic atrophic gastritis |
| CAG with IM: Chronic atrophic gastritis with intestinal metaplasia | ||
| CSG: Chronic superficial gastritis | ||
| GC: Gastric cancer | ||
| SIM: Severe intestinal metaplasia | ||
| WIM: Wild intestinal metaplasia | ||
| Liver |  | HCC: Hepatocellular carcinoma |
| NAFLD: Non-alcoholic fatty liver disease | ||
| Lung |  | AAH: Atypical adenomatous hyperplasia |
| AIS: Adenocarcinoma in situ | ||
| IAC: Invasive lung adenocarcinoma | ||
| MIA: Minimally invasive adenocarcinoma | ||
| Oral Cavity | 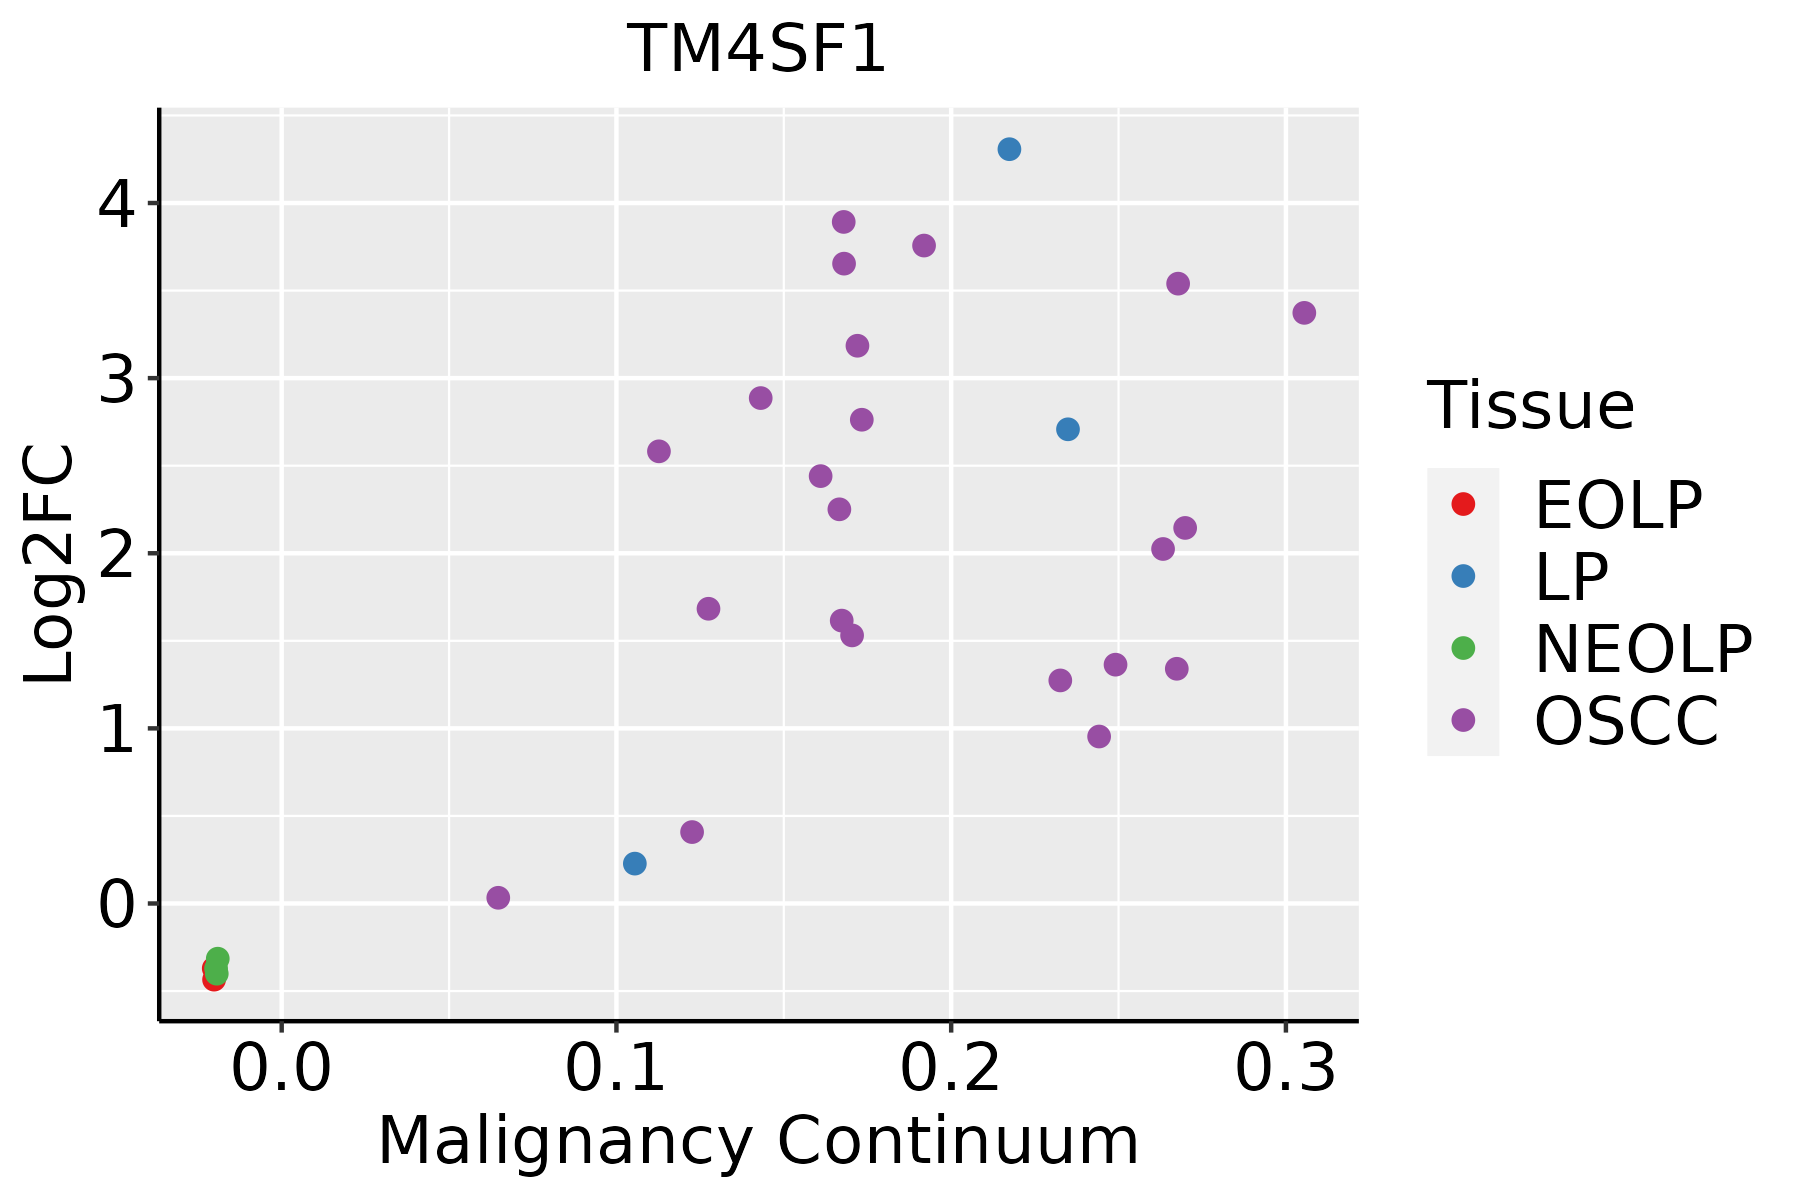 | EOLP: Erosive Oral lichen planus |
| LP: leukoplakia | ||
| NEOLP: Non-erosive oral lichen planus | ||
| OSCC: Oral squamous cell carcinoma | ||
| Prostate |  | BPH: Benign Prostatic Hyperplasia |
| Skin |  | AK: Actinic keratosis |
| cSCC: Cutaneous squamous cell carcinoma | ||
| SCCIS:squamous cell carcinoma in situ | ||
| Thyroid | 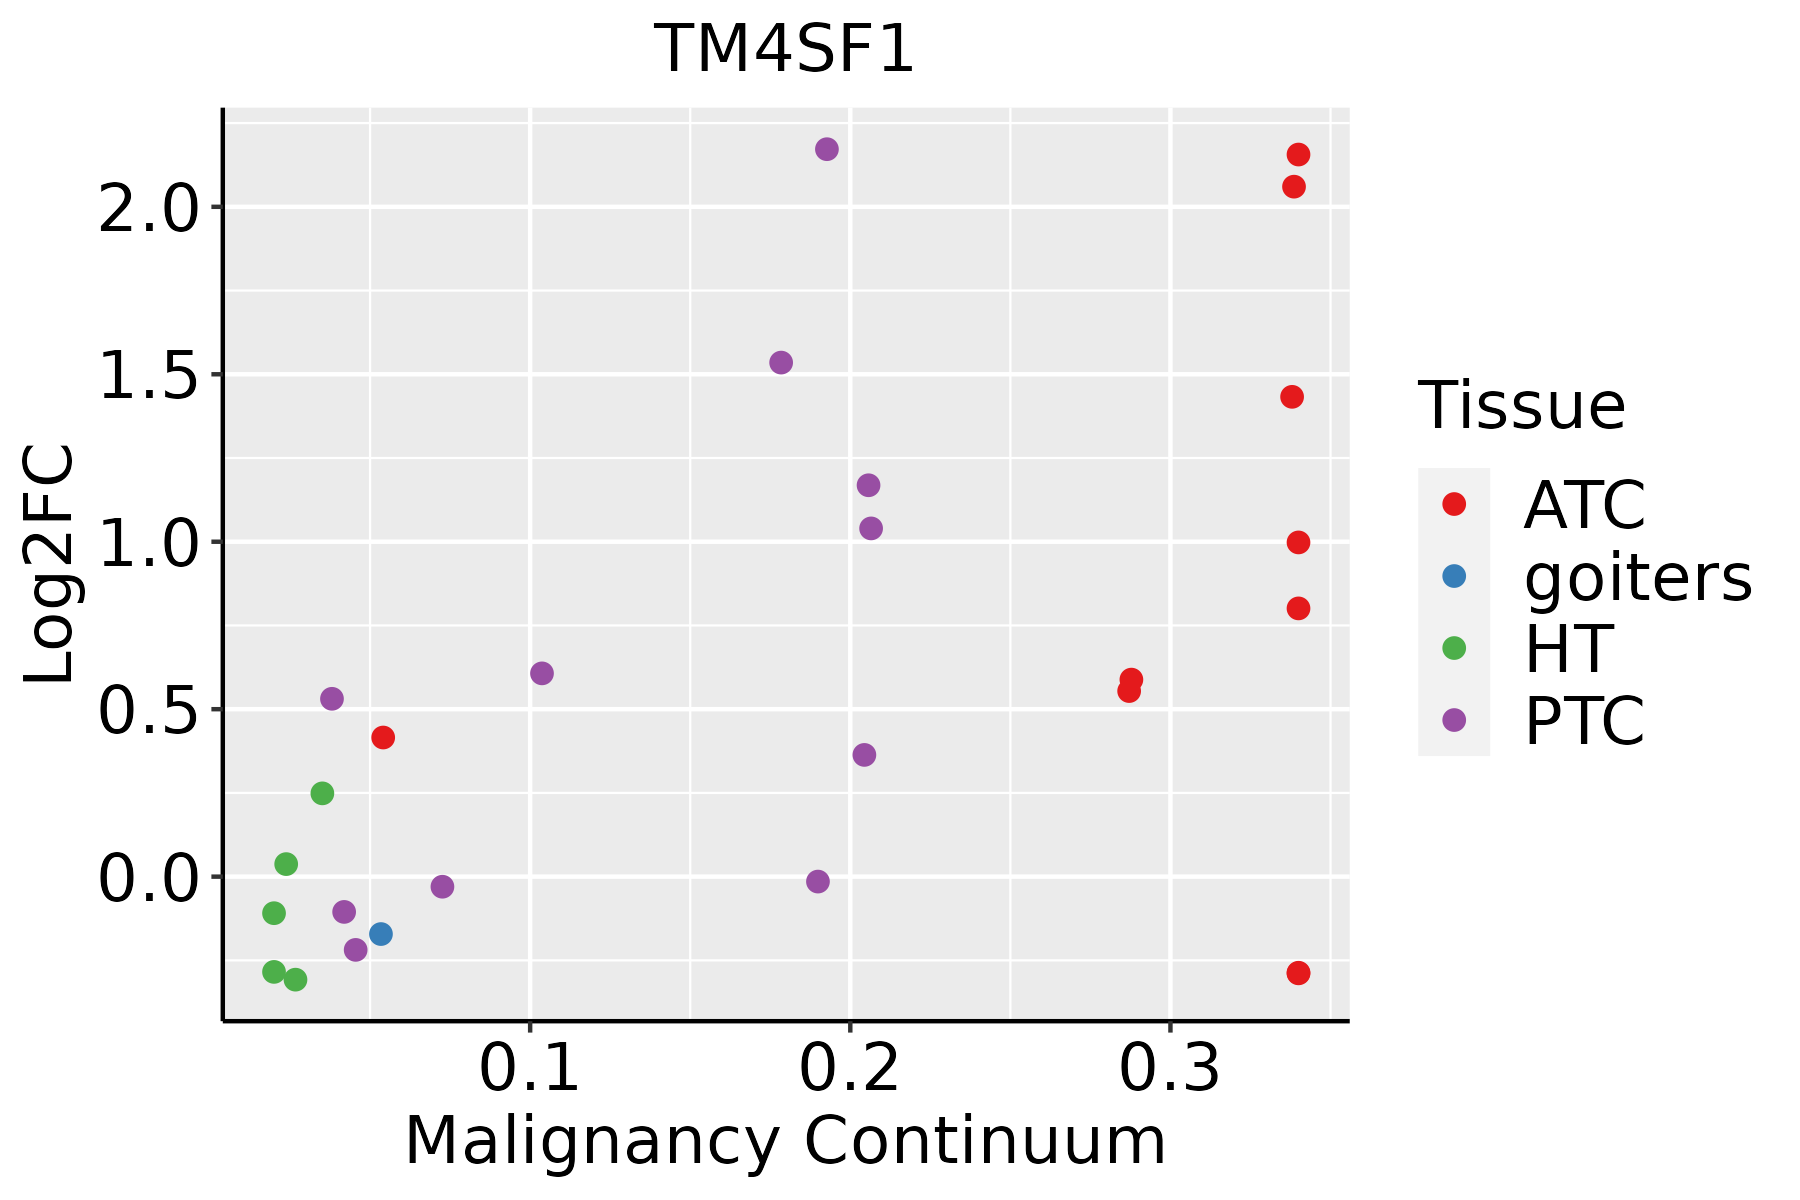 | ATC: Anaplastic thyroid cancer |
| HT: Hashimoto's thyroiditis | ||
| PTC: Papillary thyroid cancer |
| ∗log2FC in expression of this searched gene in stem-like cells from each diseased tissue sample relative to stem-like cells in normal samples in each tissue plotted against the malignancy continuum. Samples are colored based on if they are from different disease stage. |
Top |
Malignant transformation related pathway analysis |
| Find out the enriched GO biological processes and KEGG pathways involved in transition from healthy to precancer to cancer |
| Tissue | Disease Stage | Enriched GO biological Processes |
| Colorectum | AD |  |
| Colorectum | SER |  |
| Colorectum | MSS |  |
| Colorectum | MSI-H |  |
| Colorectum | FAP |  |
| ∗Top 15 enriched GO BP terms are showed in the bar plot of each disease state in each tissue. Each row represents a significant GO biological process which is colored according to the -log10(p.adjust). |
| Page: 1 2 3 4 5 6 7 8 9 |
| GO ID | Tissue | Disease Stage | Description | Gene Ratio | Bg Ratio | pvalue | p.adjust | Count |
| Page: 1 |
| Pathway ID | Tissue | Disease Stage | Description | Gene Ratio | Bg Ratio | pvalue | p.adjust | qvalue | Count |
| Page: 1 |
Top |
Cell-cell communication analysis |
| Identification of potential cell-cell interactions between two cell types and their ligand-receptor pairs for different disease states |
| Ligand | Receptor | LRpair | Pathway | Tissue | Disease Stage |
| Page: 1 |
Top |
Single-cell gene regulatory network inference analysis |
| Find out the significant the regulons (TFs) and the target genes of each regulon across cell types for different disease states |
| TF | Cell Type | Tissue | Disease Stage | Target Gene | RSS | Regulon Activity |
| ∗The dot plots of a searched regulon are shown for all cell subpopulations in each disease state of each tissue based on the regulon specific score inferred using pySCENIC and by calculating the average expression. |
| Page: 1 |
Top |
Somatic mutation of malignant transformation related genes |
| Annotation of somatic variants for genes involved in malignant transformation |
| Hugo Symbol | Variant Class | Variant Classification | dbSNP RS | HGVSc | HGVSp | HGVSp Short | SWISSPROT | BIOTYPE | SIFT | PolyPhen | Tumor Sample Barcode | Tissue | Histology | Sex | Age | Stage | Therapy Types | Drugs | Outcome |
| TM4SF1 | SNV | Missense_Mutation | rs199669677 | c.290N>G | p.Ala97Gly | p.A97G | P30408 | protein_coding | deleterious(0) | possibly_damaging(0.565) | TCGA-A2-A04Q-01 | Breast | breast invasive carcinoma | Female | <65 | I/II | Chemotherapy | adriamycin | SD |
| TM4SF1 | SNV | Missense_Mutation | novel | c.122A>C | p.Asn41Thr | p.N41T | P30408 | protein_coding | tolerated(0.06) | benign(0.122) | TCGA-AR-A1AP-01 | Breast | breast invasive carcinoma | Female | >=65 | I/II | Hormone Therapy | anastrozole | SD |
| TM4SF1 | SNV | Missense_Mutation | novel | c.20N>T | p.Ala7Val | p.A7V | P30408 | protein_coding | deleterious(0) | possibly_damaging(0.749) | TCGA-AA-3947-01 | Colorectum | colon adenocarcinoma | Female | <65 | I/II | Unknown | Unknown | SD |
| TM4SF1 | SNV | Missense_Mutation | c.62N>T | p.Cys21Phe | p.C21F | P30408 | protein_coding | deleterious(0) | probably_damaging(0.922) | TCGA-NH-A8F8-01 | Colorectum | colon adenocarcinoma | Male | >=65 | III/IV | Chemotherapy | fluorouracil | PD | |
| TM4SF1 | SNV | Missense_Mutation | novel | c.347C>T | p.Ala116Val | p.A116V | P30408 | protein_coding | tolerated(0.36) | benign(0.026) | TCGA-AJ-A3EK-01 | Endometrium | uterine corpus endometrioid carcinoma | Female | <65 | I/II | Chemotherapy | carboplatin | CR |
| TM4SF1 | SNV | Missense_Mutation | c.289N>T | p.Ala97Ser | p.A97S | P30408 | protein_coding | tolerated(0.09) | benign(0.143) | TCGA-AP-A051-01 | Endometrium | uterine corpus endometrioid carcinoma | Female | >=65 | I/II | Unknown | Unknown | SD | |
| TM4SF1 | SNV | Missense_Mutation | c.86N>G | p.Tyr29Cys | p.Y29C | P30408 | protein_coding | deleterious(0) | probably_damaging(0.977) | TCGA-AP-A0LM-01 | Endometrium | uterine corpus endometrioid carcinoma | Female | <65 | III/IV | Chemotherapy | cisplatin | SD | |
| TM4SF1 | SNV | Missense_Mutation | c.308G>T | p.Gly103Val | p.G103V | P30408 | protein_coding | deleterious(0) | probably_damaging(0.927) | TCGA-AX-A2HC-01 | Endometrium | uterine corpus endometrioid carcinoma | Female | <65 | III/IV | Chemotherapy | paclitaxel | PD | |
| TM4SF1 | SNV | Missense_Mutation | c.229N>T | p.Gly77Cys | p.G77C | P30408 | protein_coding | deleterious(0.04) | probably_damaging(1) | TCGA-B5-A0K9-01 | Endometrium | uterine corpus endometrioid carcinoma | Female | >=65 | I/II | Unknown | Unknown | SD | |
| TM4SF1 | SNV | Missense_Mutation | rs745533363 | c.266C>T | p.Ala89Val | p.A89V | P30408 | protein_coding | deleterious(0.05) | possibly_damaging(0.59) | TCGA-B5-A3FC-01 | Endometrium | uterine corpus endometrioid carcinoma | Female | <65 | I/II | Unknown | Unknown | SD |
| Page: 1 2 3 |
Top |
Related drugs of malignant transformation related genes |
| Identification of chemicals and drugs interact with genes involved in malignant transfromation |
| (DGIdb 4.0) |
| Entrez ID | Symbol | Category | Interaction Types | Drug Claim Name | Drug Name | PMIDs |
| Page: 1 |

Copyright 2023-Present -The University of Texas Health Science Center at Houston |