
|
|||||
|
 | |
| |
| |
| |
| |
| |
|
Gene: SPINT2 |
Gene summary for SPINT2 |
| Gene information | Species | Human | Gene symbol | SPINT2 | Gene ID | 10653 |
| Gene name | serine peptidase inhibitor, Kunitz type 2 | |
| Gene Alias | DIAR3 | |
| Cytomap | 19q13.2 | |
| Gene Type | protein-coding | GO ID | GO:0000003 | UniProtAcc | A0A140VJV6 |
Top |
Malignant transformation analysis |
| Identification of the aberrant gene expression in precancerous and cancerous lesions by comparing the gene expression of stem-like cells in diseased tissues with normal stem cells |
| Entrez ID | Symbol | Replicates | Species | Organ | Tissue | Adj P-value | Log2FC | Malignancy |
| 10653 | SPINT2 | GSM5252134_BPH511PrG_Fcol_3GEX | Human | Prostate | BPH | 1.88e-14 | 9.24e-01 | -0.1433 |
| 10653 | SPINT2 | GSM5252135_BPH511PrPUr_Fcol_3GEX | Human | Prostate | BPH | 1.63e-34 | 1.92e+00 | -0.1833 |
| 10653 | SPINT2 | GSM5252136_BPH556PrGA1_Fcol | Human | Prostate | BPH | 4.75e-02 | 5.62e-01 | -0.23 |
| 10653 | SPINT2 | GSM5252137_BPH556PrGA2_Fcol | Human | Prostate | BPH | 2.68e-10 | 1.15e+00 | -0.23 |
| 10653 | SPINT2 | 047563_1562-all-cells | Human | Prostate | BPH | 1.05e-37 | -6.25e-01 | 0.0791 |
| 10653 | SPINT2 | 048752_1579-all-cells | Human | Prostate | BPH | 1.76e-02 | -1.43e-01 | 0.1008 |
| 10653 | SPINT2 | 052097_1595-all-cells | Human | Prostate | BPH | 9.02e-03 | -2.72e-01 | 0.0972 |
| 10653 | SPINT2 | 052099_1652-all-cells | Human | Prostate | BPH | 1.28e-07 | -3.56e-01 | 0.1038 |
| 10653 | SPINT2 | Dong_P1 | Human | Prostate | Tumor | 7.16e-08 | 9.50e-02 | 0.035 |
| 10653 | SPINT2 | Dong_P3 | Human | Prostate | Tumor | 5.37e-04 | 2.65e-01 | 0.0278 |
| 10653 | SPINT2 | Dong_P4 | Human | Prostate | Tumor | 4.66e-02 | 3.00e-01 | 0.0292 |
| 10653 | SPINT2 | Dong_P5 | Human | Prostate | Tumor | 2.32e-21 | 3.85e-01 | 0.053 |
| 10653 | SPINT2 | Dong_P6 | Human | Prostate | Tumor | 2.53e-05 | -3.55e-01 | 0.0371 |
| 10653 | SPINT2 | P7 | Human | Prostate | Tumor | 4.20e-11 | 9.19e-01 | -0.1025 |
| 10653 | SPINT2 | P10 | Human | Prostate | Tumor | 5.98e-17 | 3.18e-01 | -0.0902 |
| 10653 | SPINT2 | GSM5353216_PA_PB1A_Pool_1_3_S50_L002 | Human | Prostate | Tumor | 5.96e-03 | -4.22e-01 | 0.159 |
| 10653 | SPINT2 | GSM5353218_PA_PB1B_Pool_1_2_S74_L003 | Human | Prostate | Tumor | 5.88e-04 | -9.14e-01 | 0.1479 |
| 10653 | SPINT2 | GSM5353220_PA_PB1B_Pool_3_S51_L002 | Human | Prostate | Tumor | 1.56e-02 | -6.57e-01 | 0.1531 |
| 10653 | SPINT2 | GSM5353222_PA_PB2B_Pool_1_3_S52_L002 | Human | Prostate | Tumor | 2.45e-02 | -1.92e-01 | 0.1608 |
| 10653 | SPINT2 | GSM5353225_PA_PR5196-1_Pool_1_2_3_S53_L002 | Human | Prostate | Tumor | 7.53e-04 | -3.76e-01 | 0.1619 |
| Page: 1 2 3 4 5 6 7 8 9 10 11 12 13 14 15 16 |
| Tissue | Expression Dynamics | Abbreviation |
| Breast | 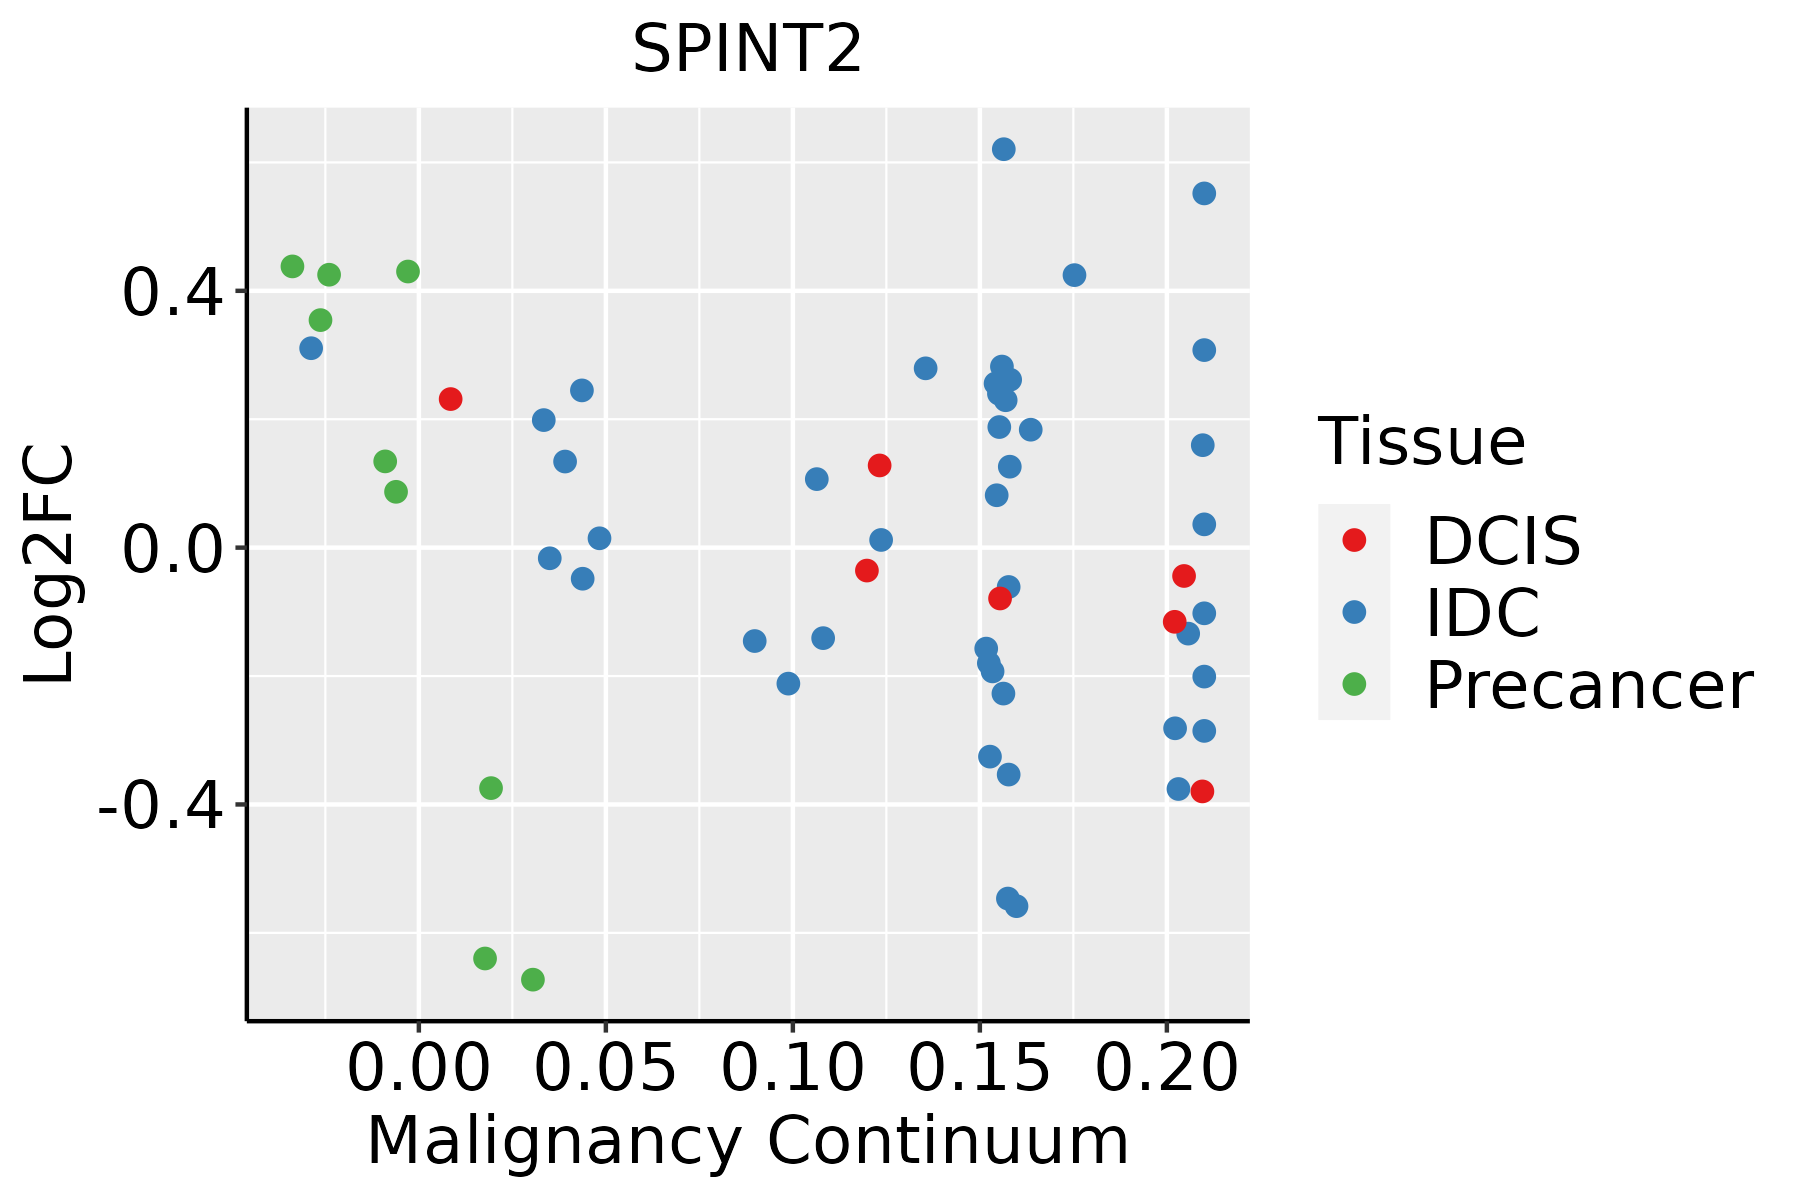 | IDC: Invasive ductal carcinoma |
| DCIS: Ductal carcinoma in situ | ||
| Precancer(BRCA1-mut): Precancerous lesion from BRCA1 mutation carriers | ||
| Cervix | 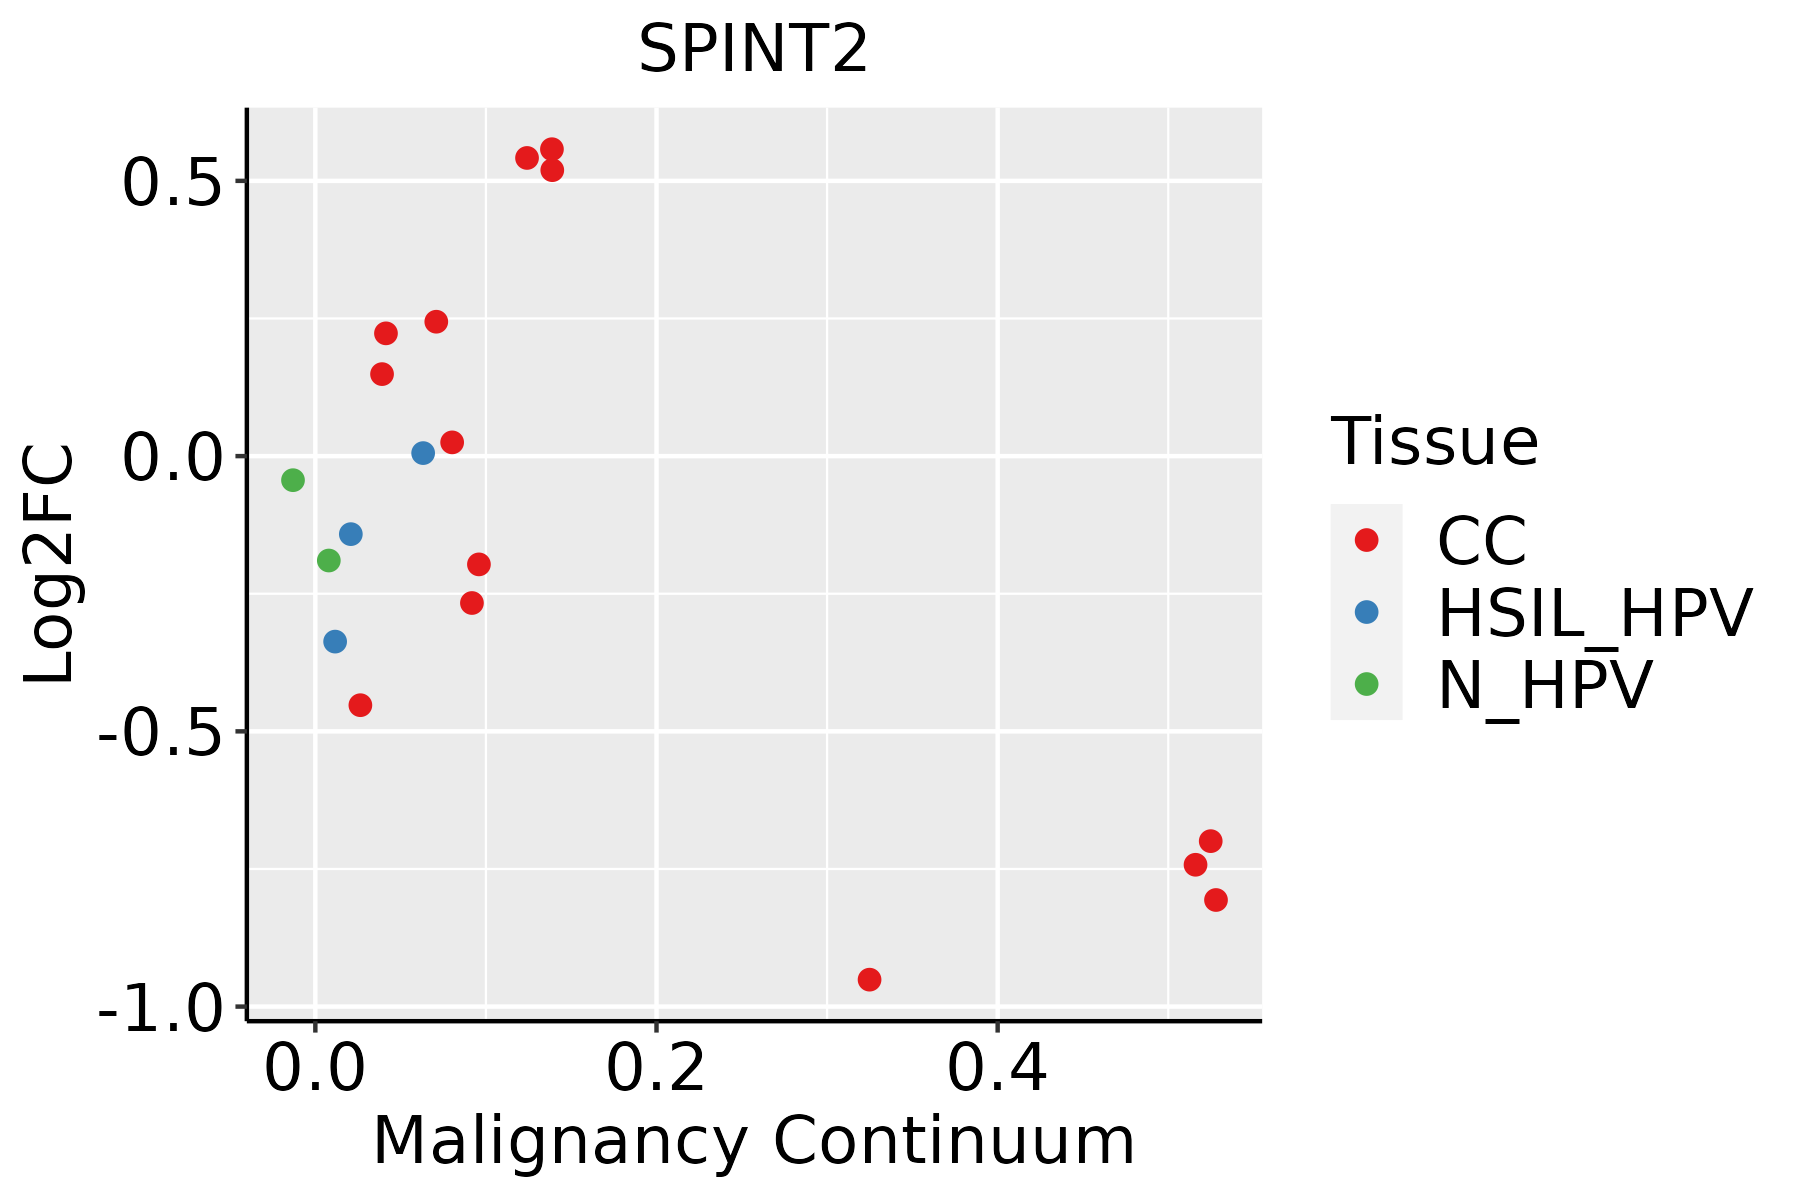 | CC: Cervix cancer |
| HSIL_HPV: HPV-infected high-grade squamous intraepithelial lesions | ||
| N_HPV: HPV-infected normal cervix | ||
| Colorectum (GSE201348) |  | FAP: Familial adenomatous polyposis |
| CRC: Colorectal cancer | ||
| Colorectum (HTA11) | 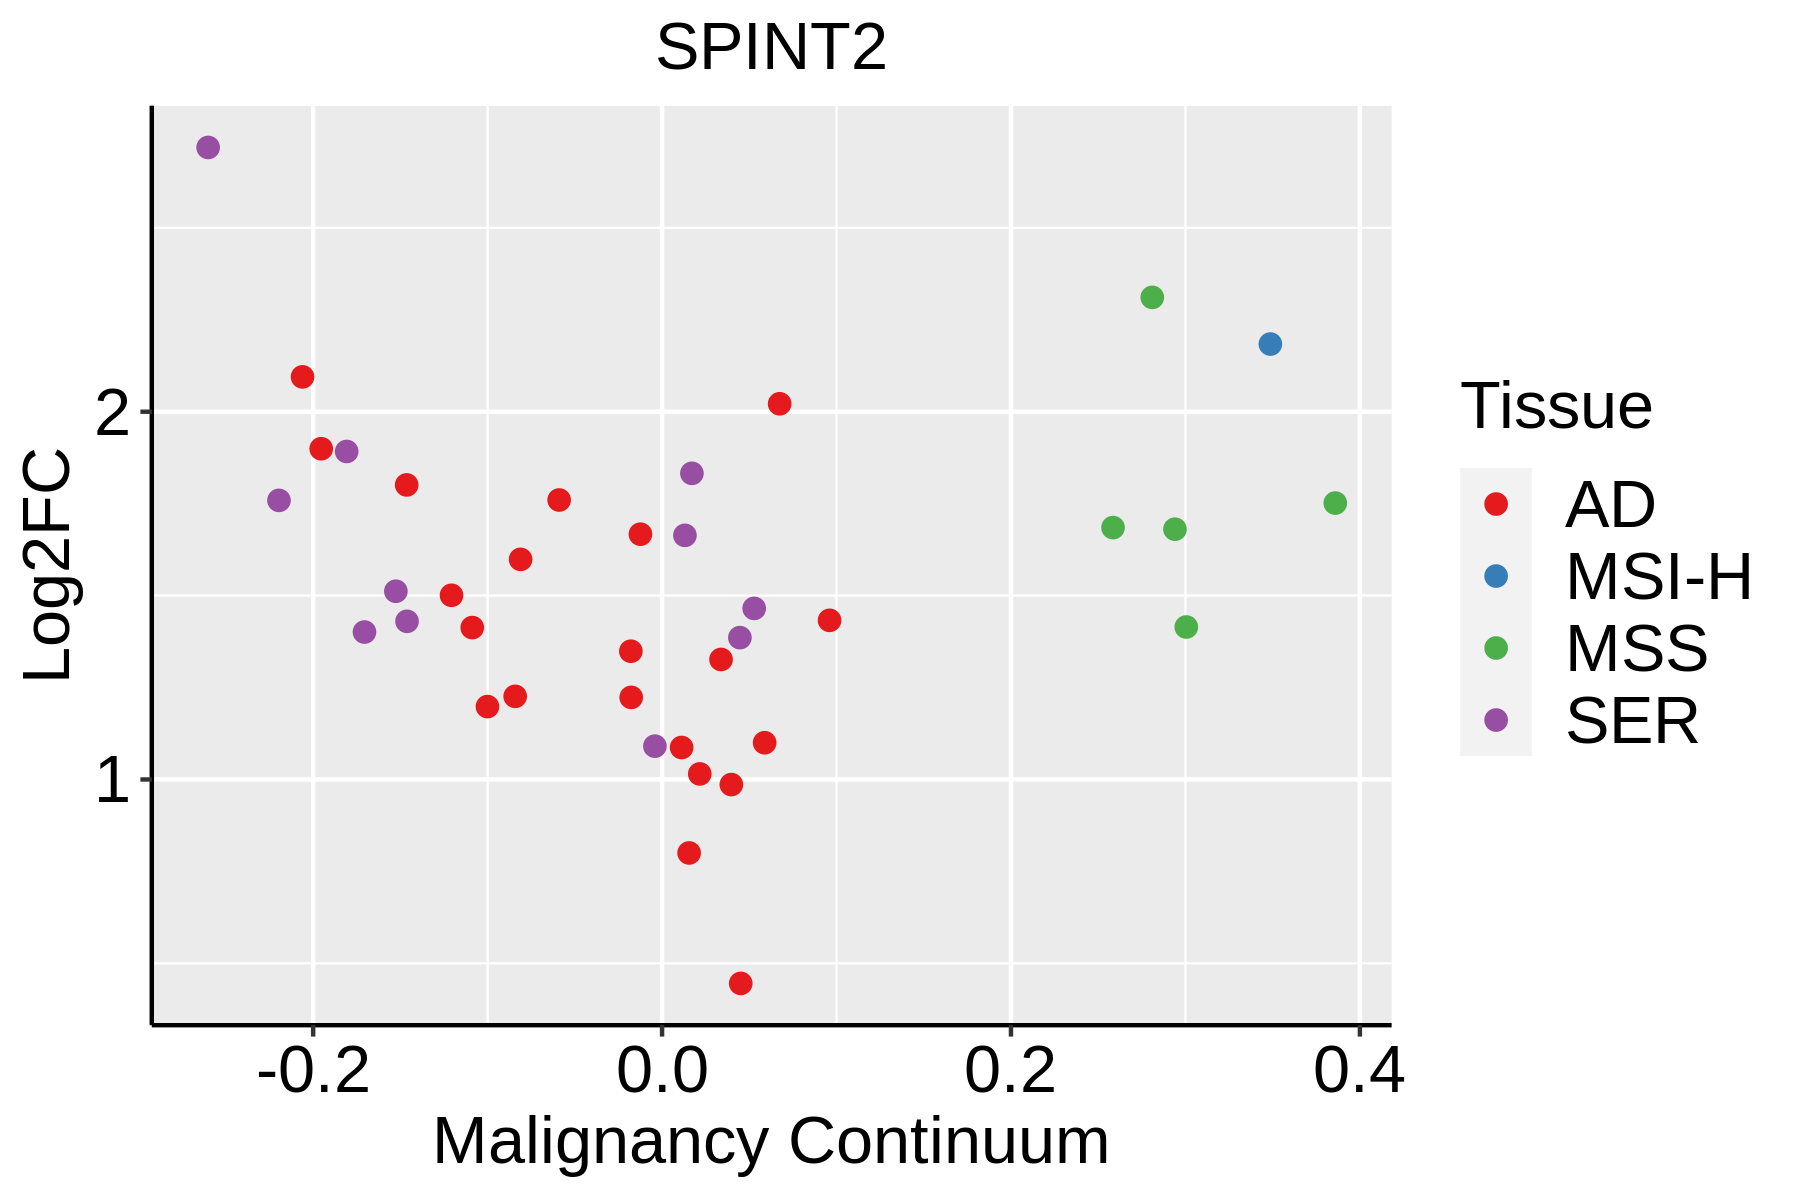 | AD: Adenomas |
| SER: Sessile serrated lesions | ||
| MSI-H: Microsatellite-high colorectal cancer | ||
| MSS: Microsatellite stable colorectal cancer | ||
| Endometrium | 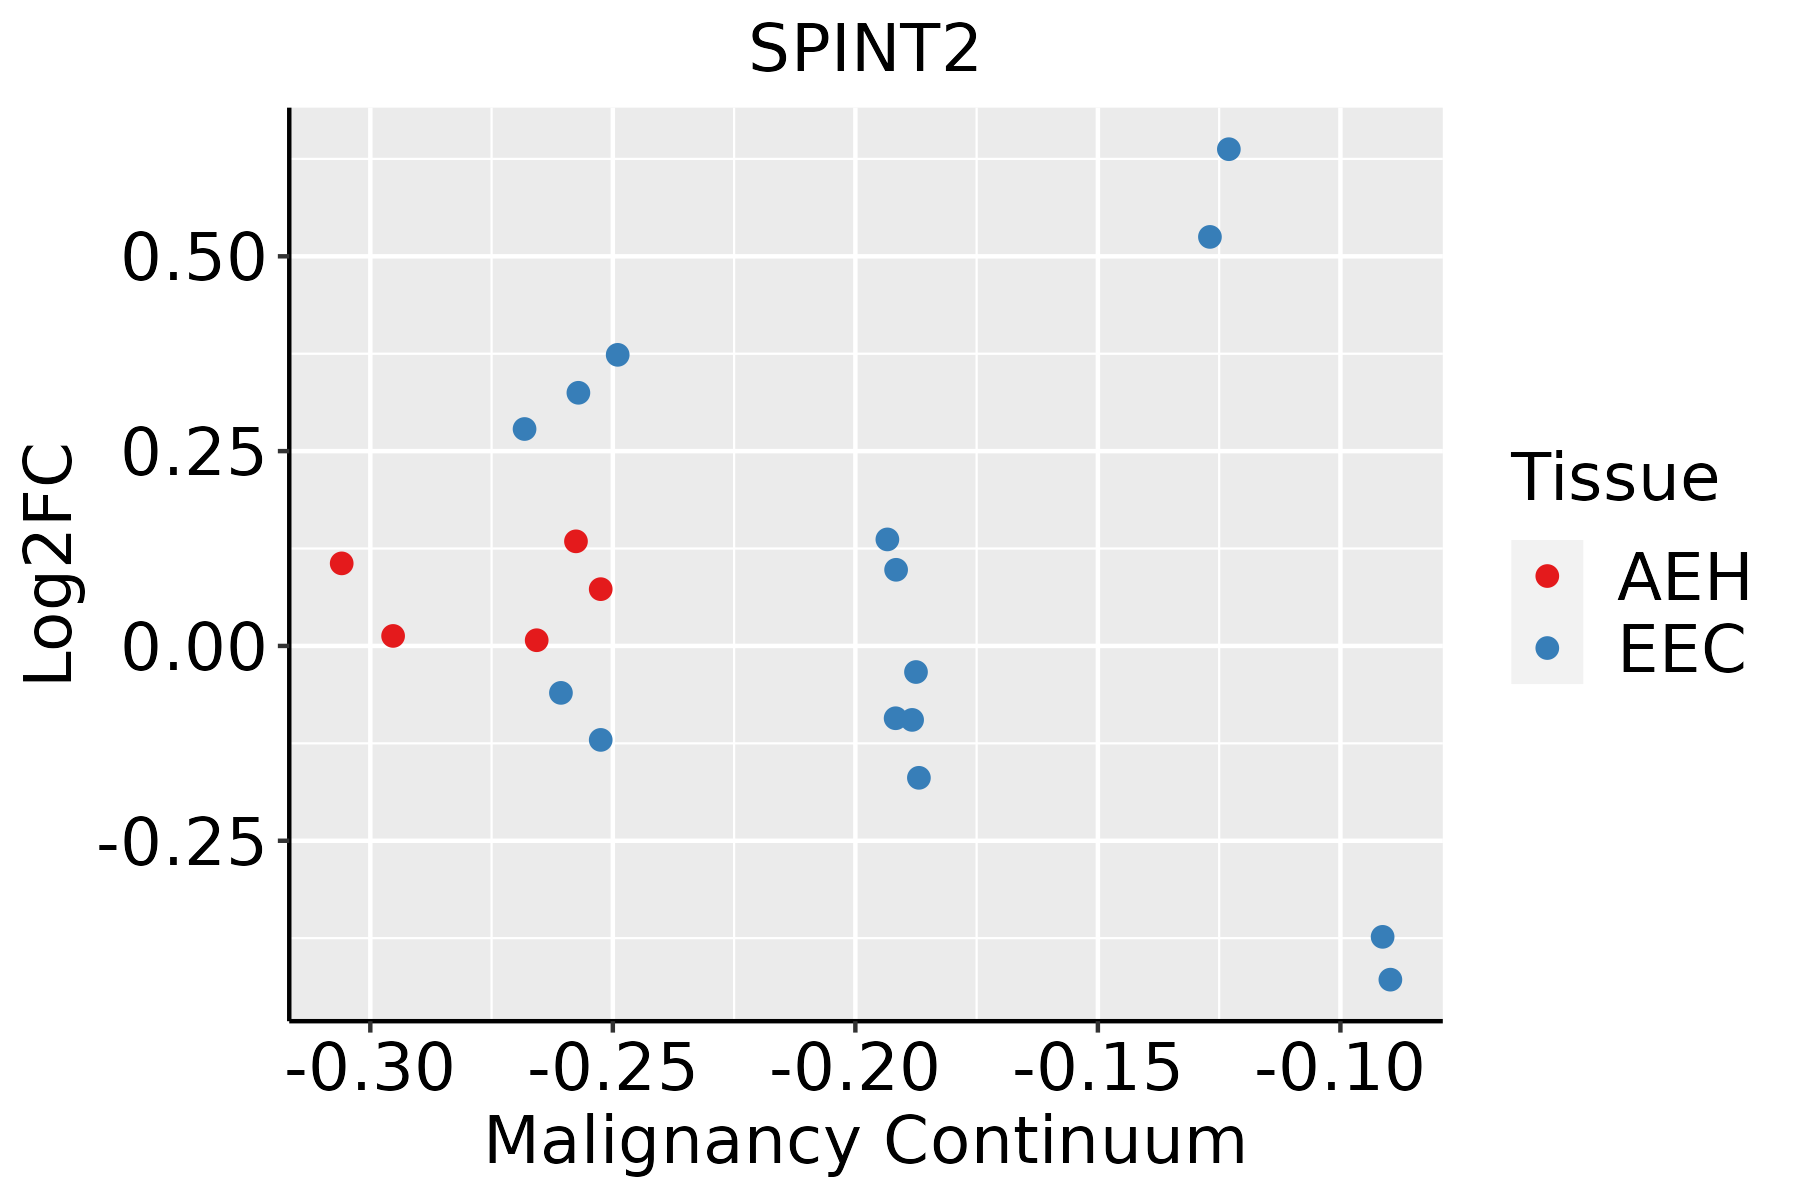 | AEH: Atypical endometrial hyperplasia |
| EEC: Endometrioid Cancer | ||
| Esophagus | 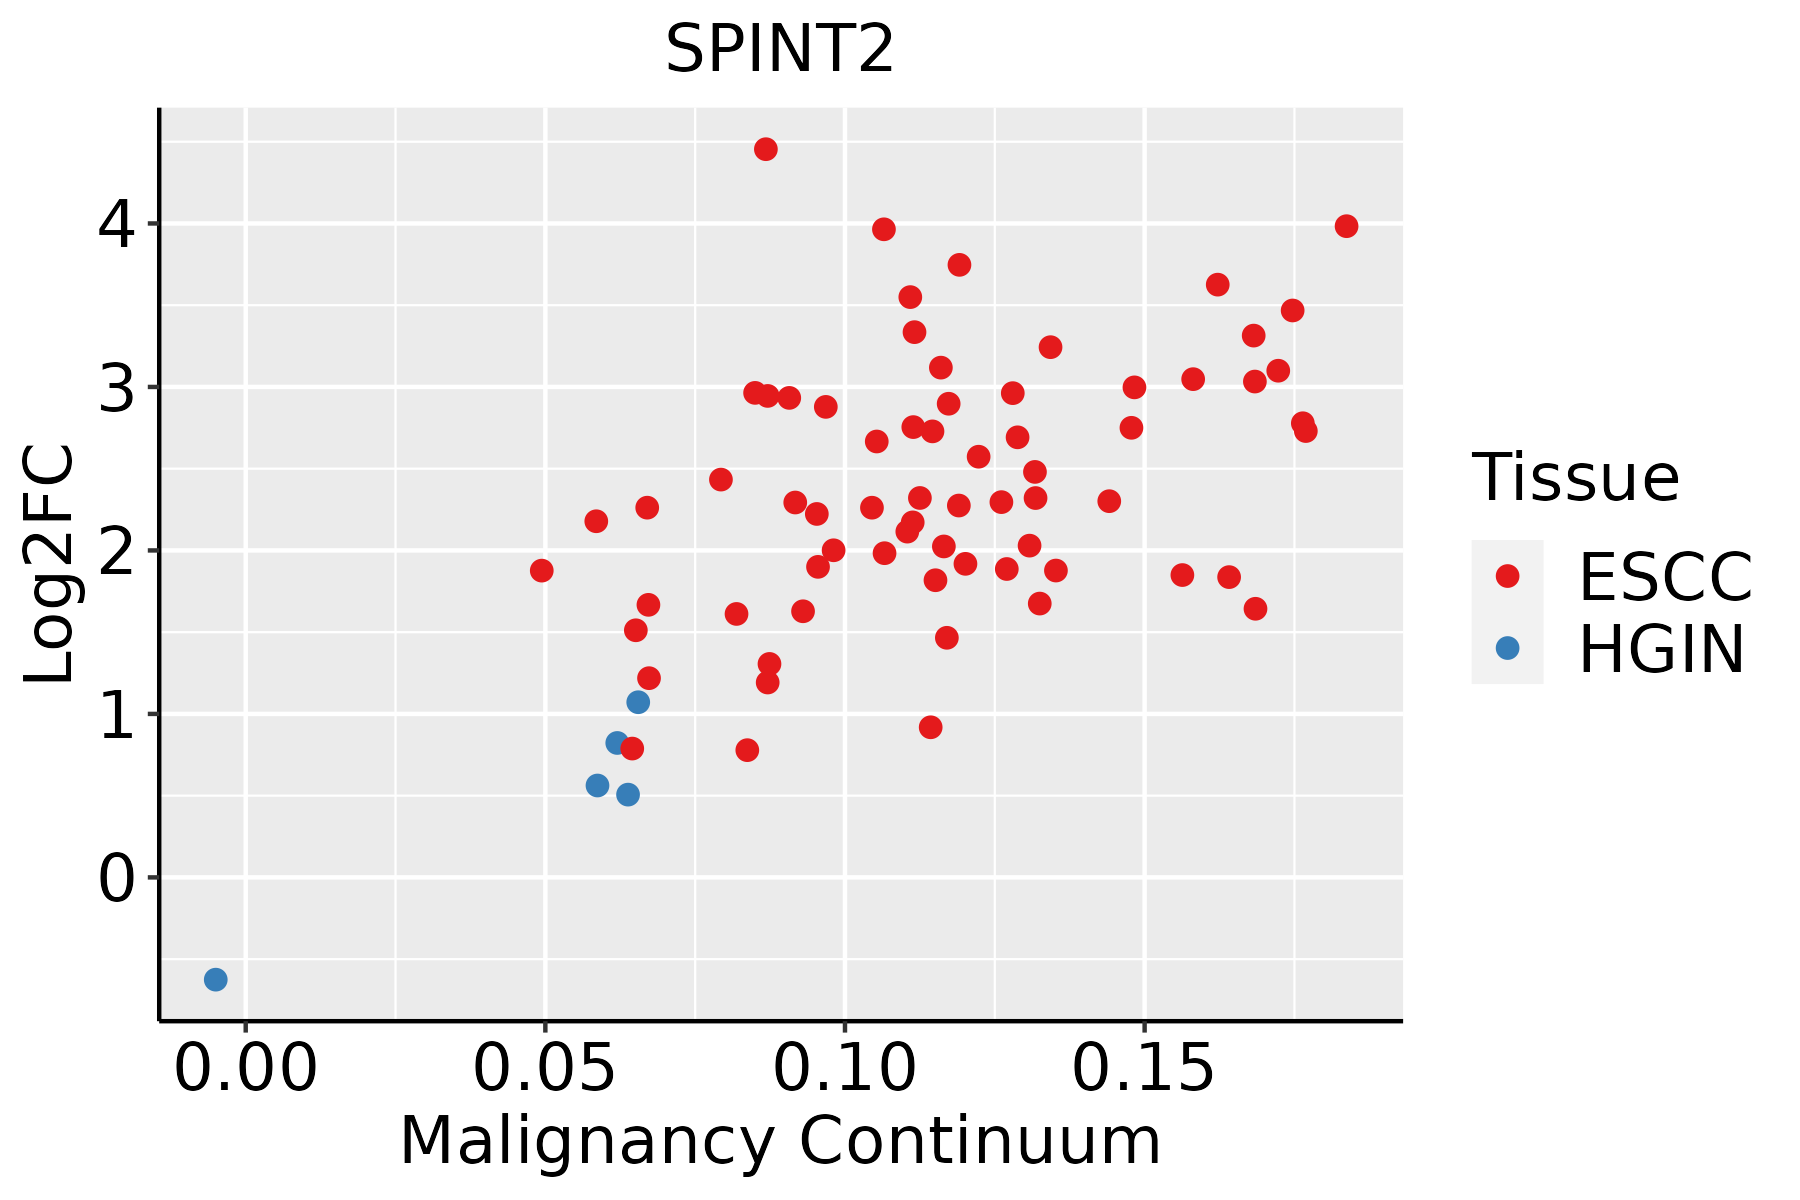 | ESCC: Esophageal squamous cell carcinoma |
| HGIN: High-grade intraepithelial neoplasias | ||
| LGIN: Low-grade intraepithelial neoplasias | ||
| GC | 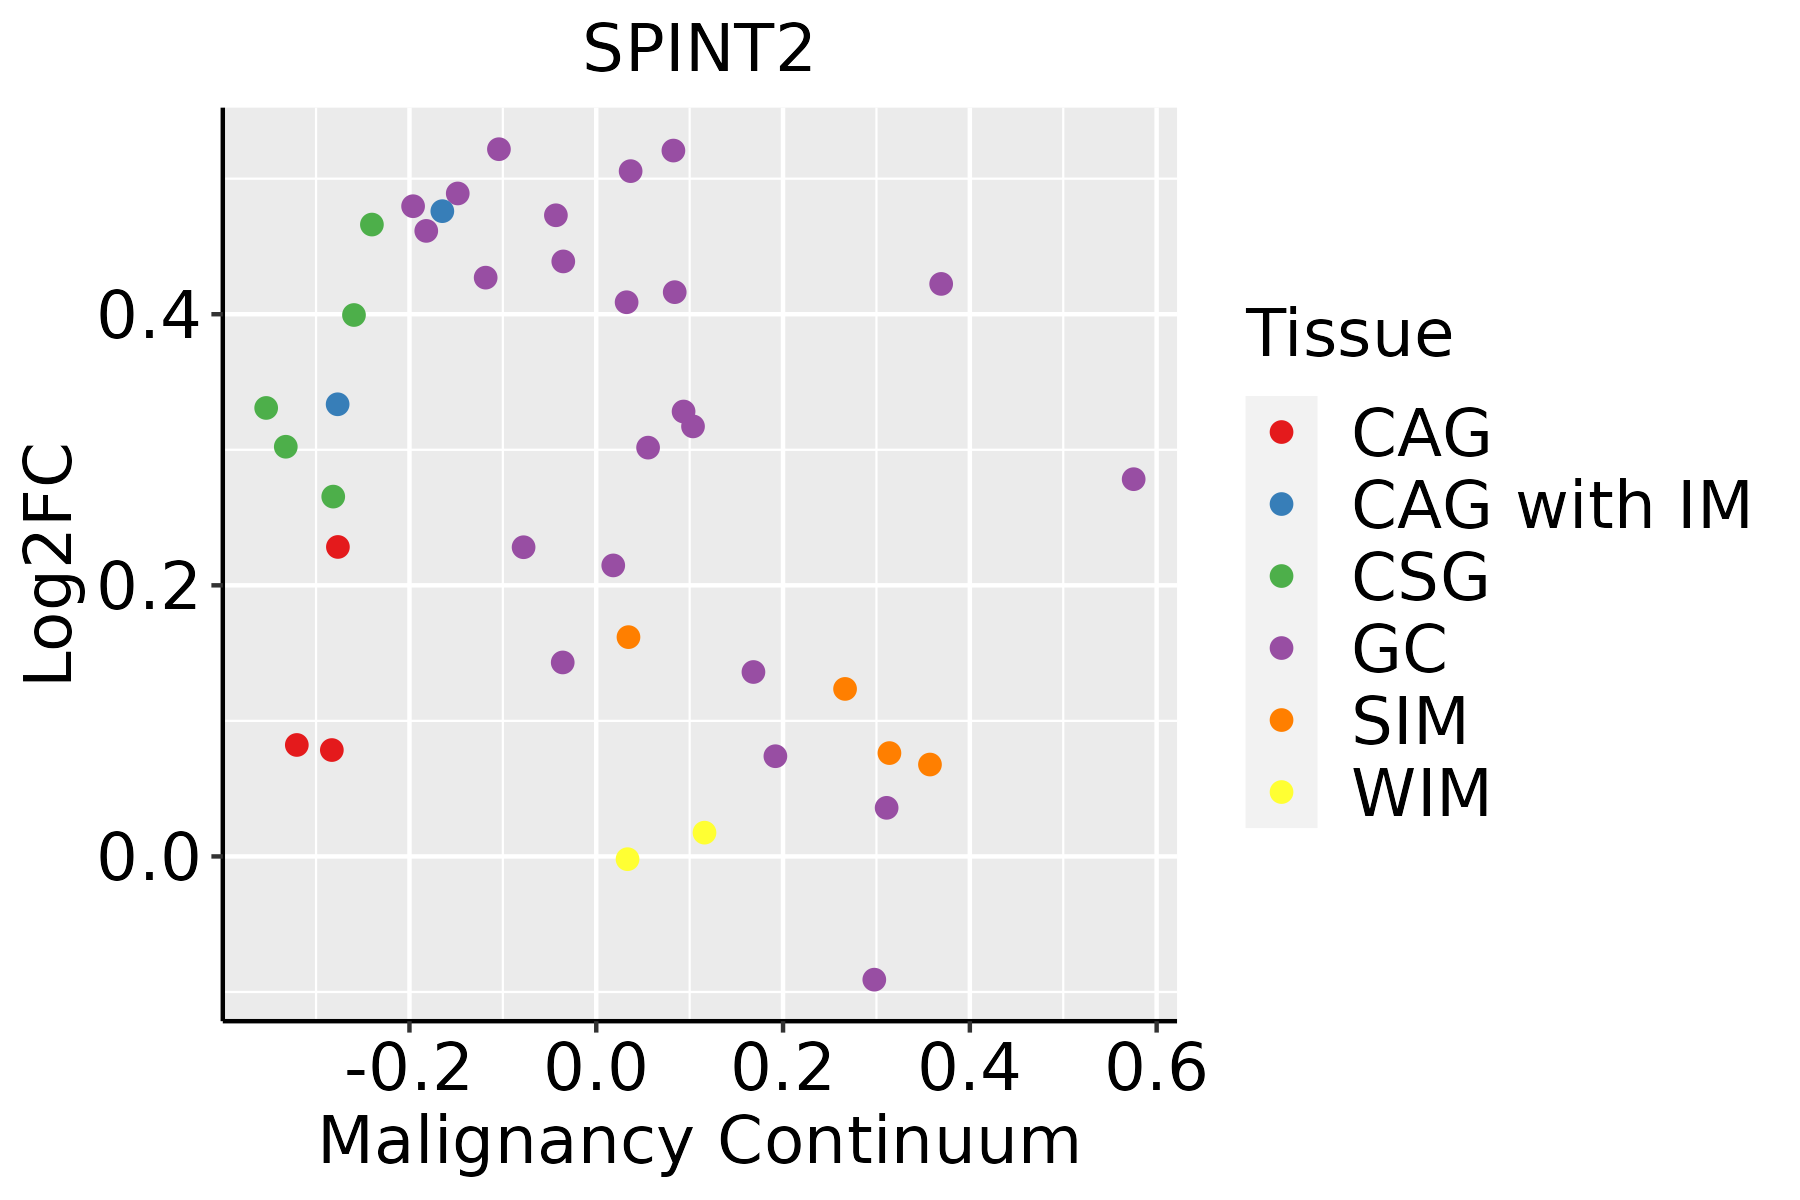 | CAG: Chronic atrophic gastritis |
| CAG with IM: Chronic atrophic gastritis with intestinal metaplasia | ||
| CSG: Chronic superficial gastritis | ||
| GC: Gastric cancer | ||
| SIM: Severe intestinal metaplasia | ||
| WIM: Wild intestinal metaplasia | ||
| Liver |  | HCC: Hepatocellular carcinoma |
| NAFLD: Non-alcoholic fatty liver disease | ||
| Oral Cavity |  | EOLP: Erosive Oral lichen planus |
| LP: leukoplakia | ||
| NEOLP: Non-erosive oral lichen planus | ||
| OSCC: Oral squamous cell carcinoma | ||
| Prostate | 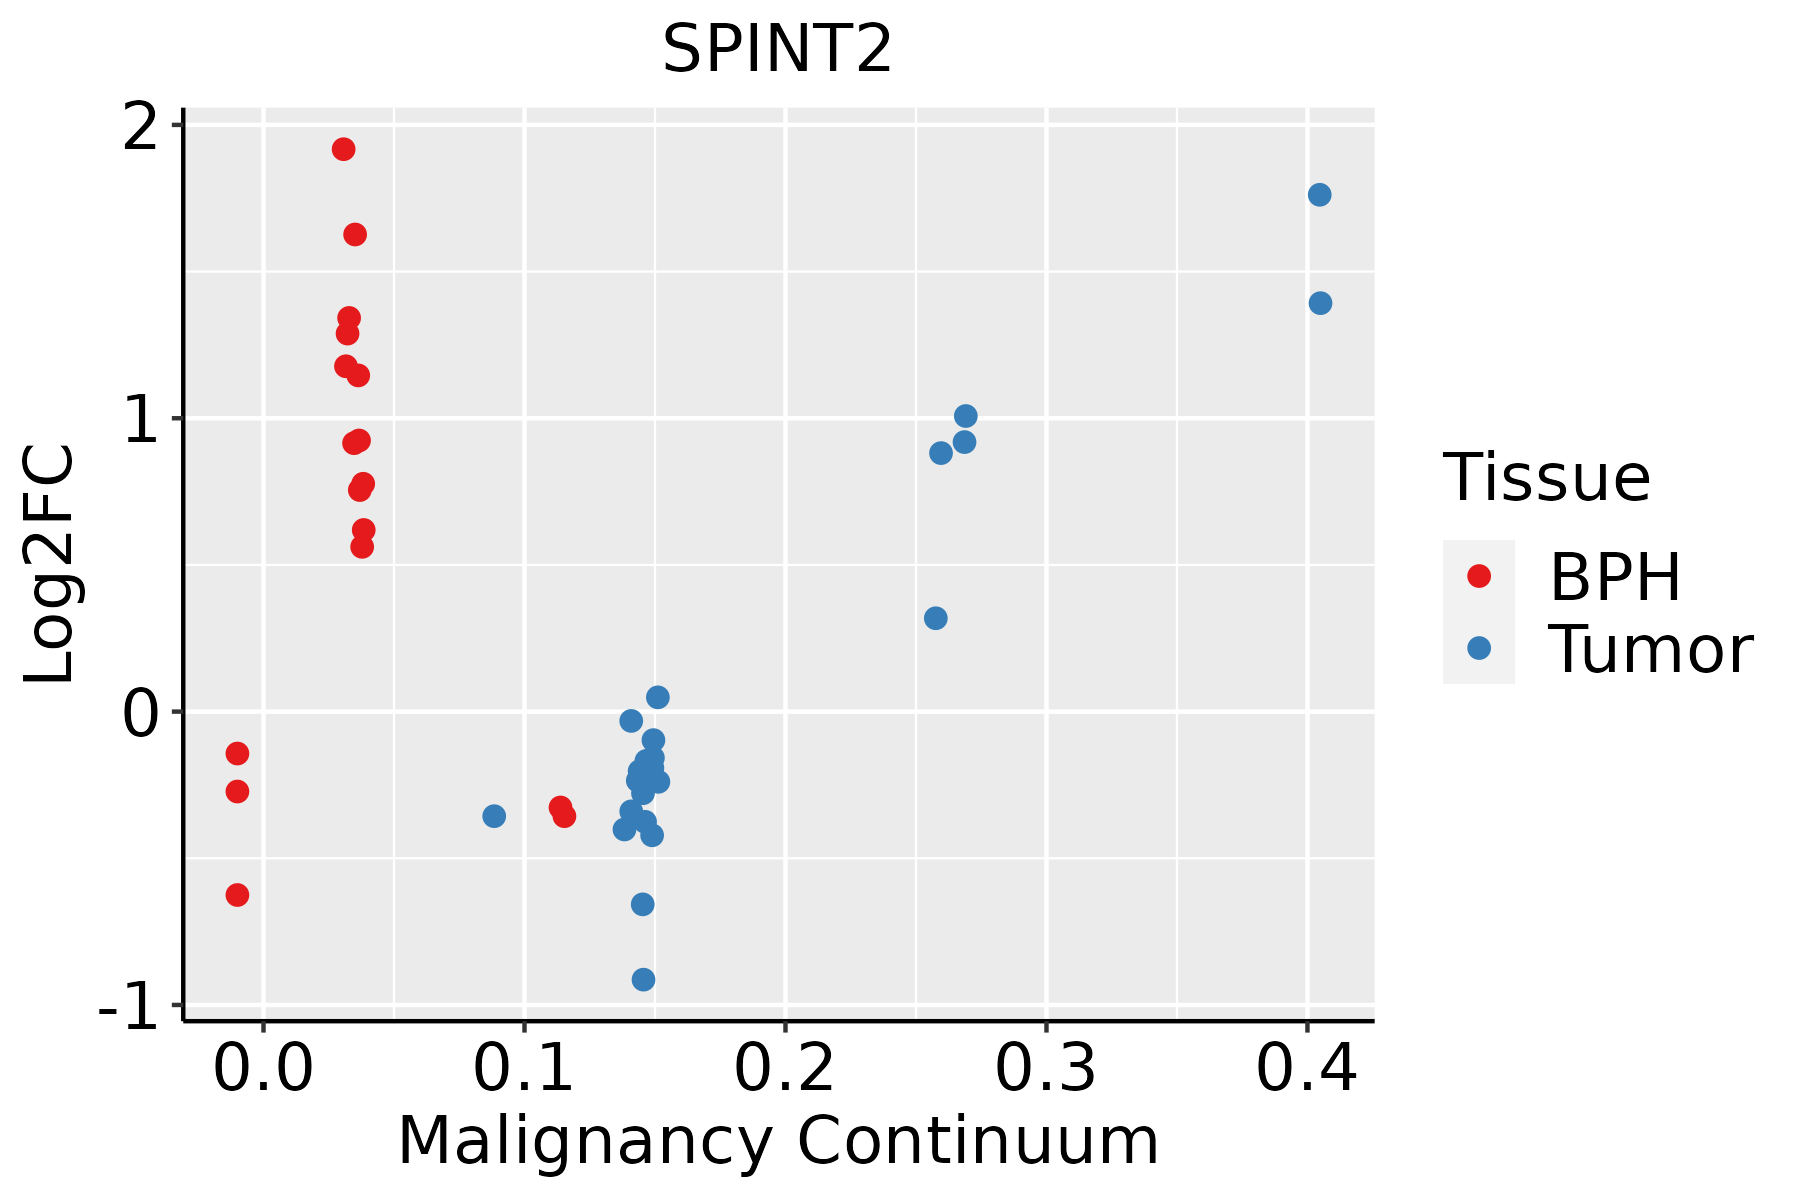 | BPH: Benign Prostatic Hyperplasia |
| Skin | 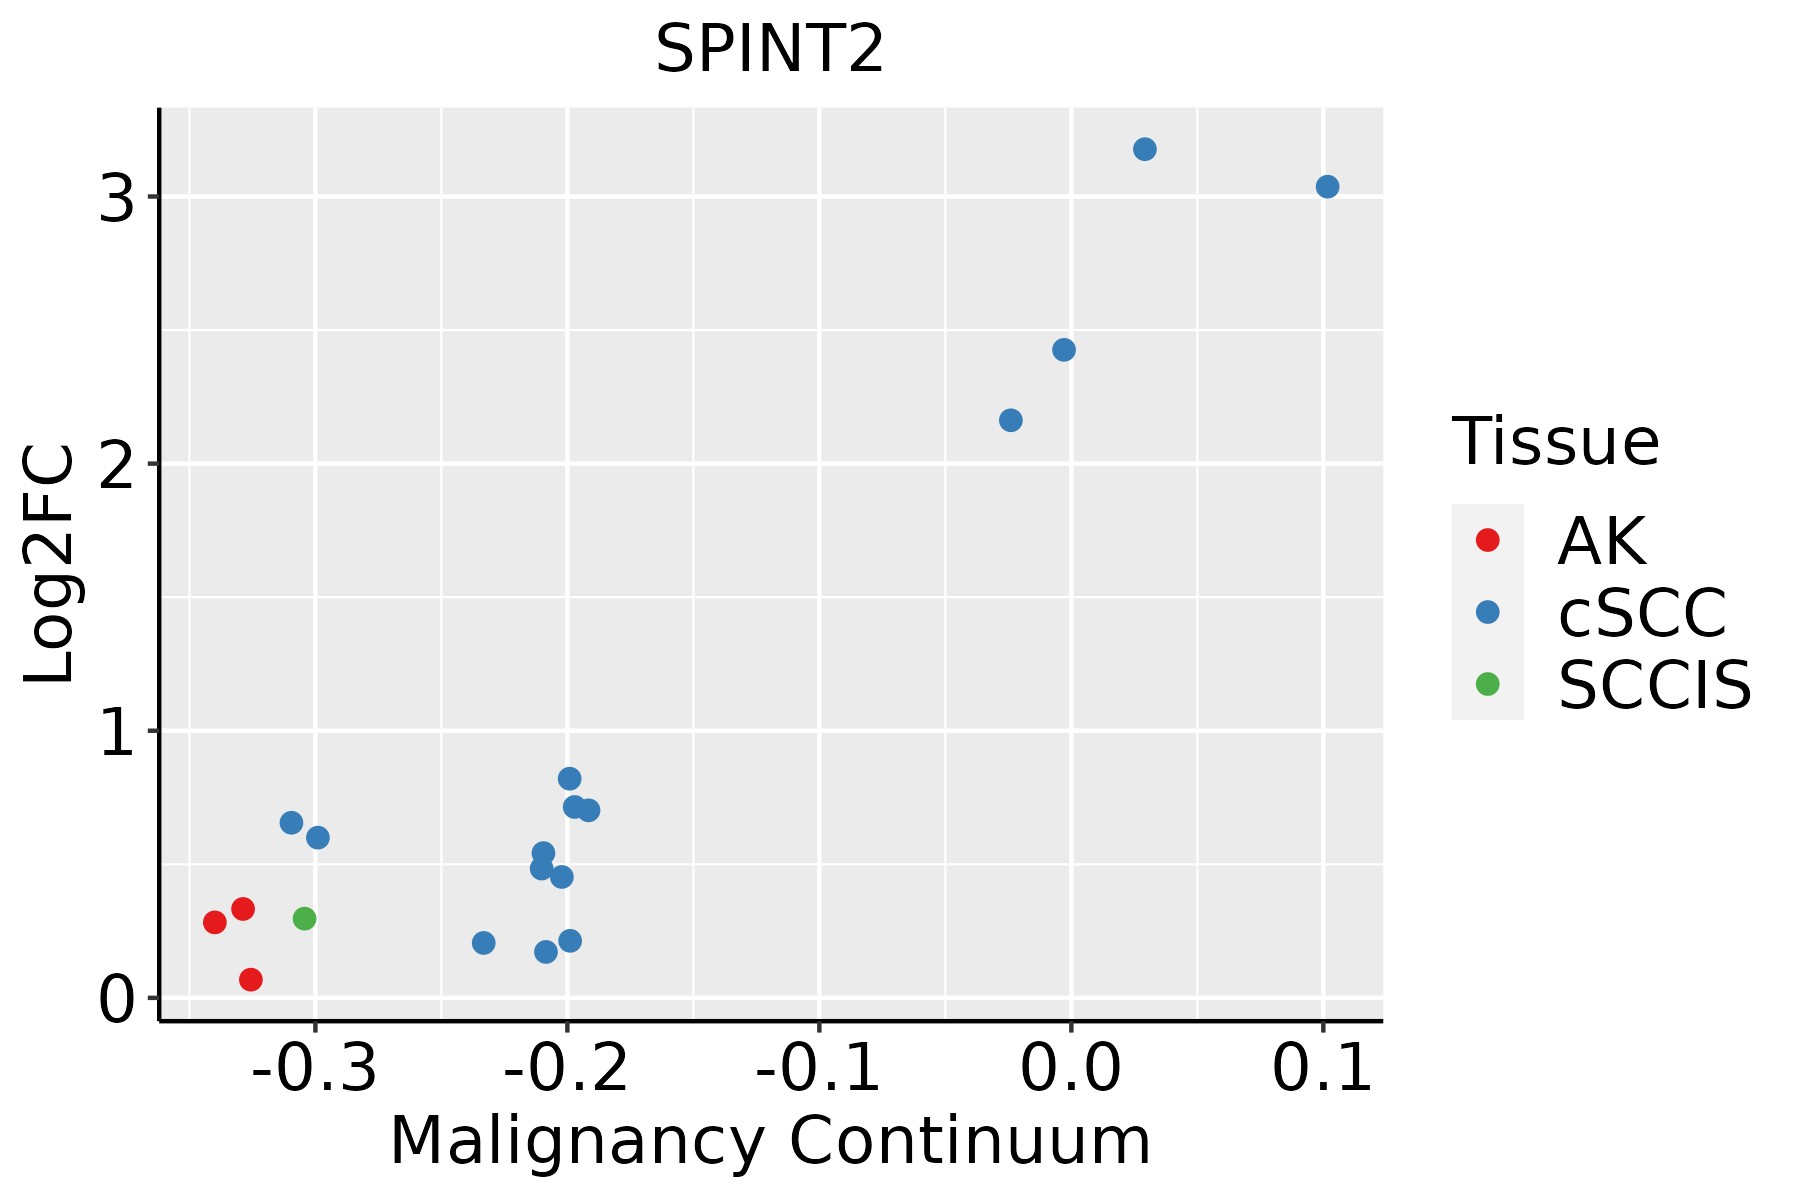 | AK: Actinic keratosis |
| cSCC: Cutaneous squamous cell carcinoma | ||
| SCCIS:squamous cell carcinoma in situ | ||
| Thyroid | 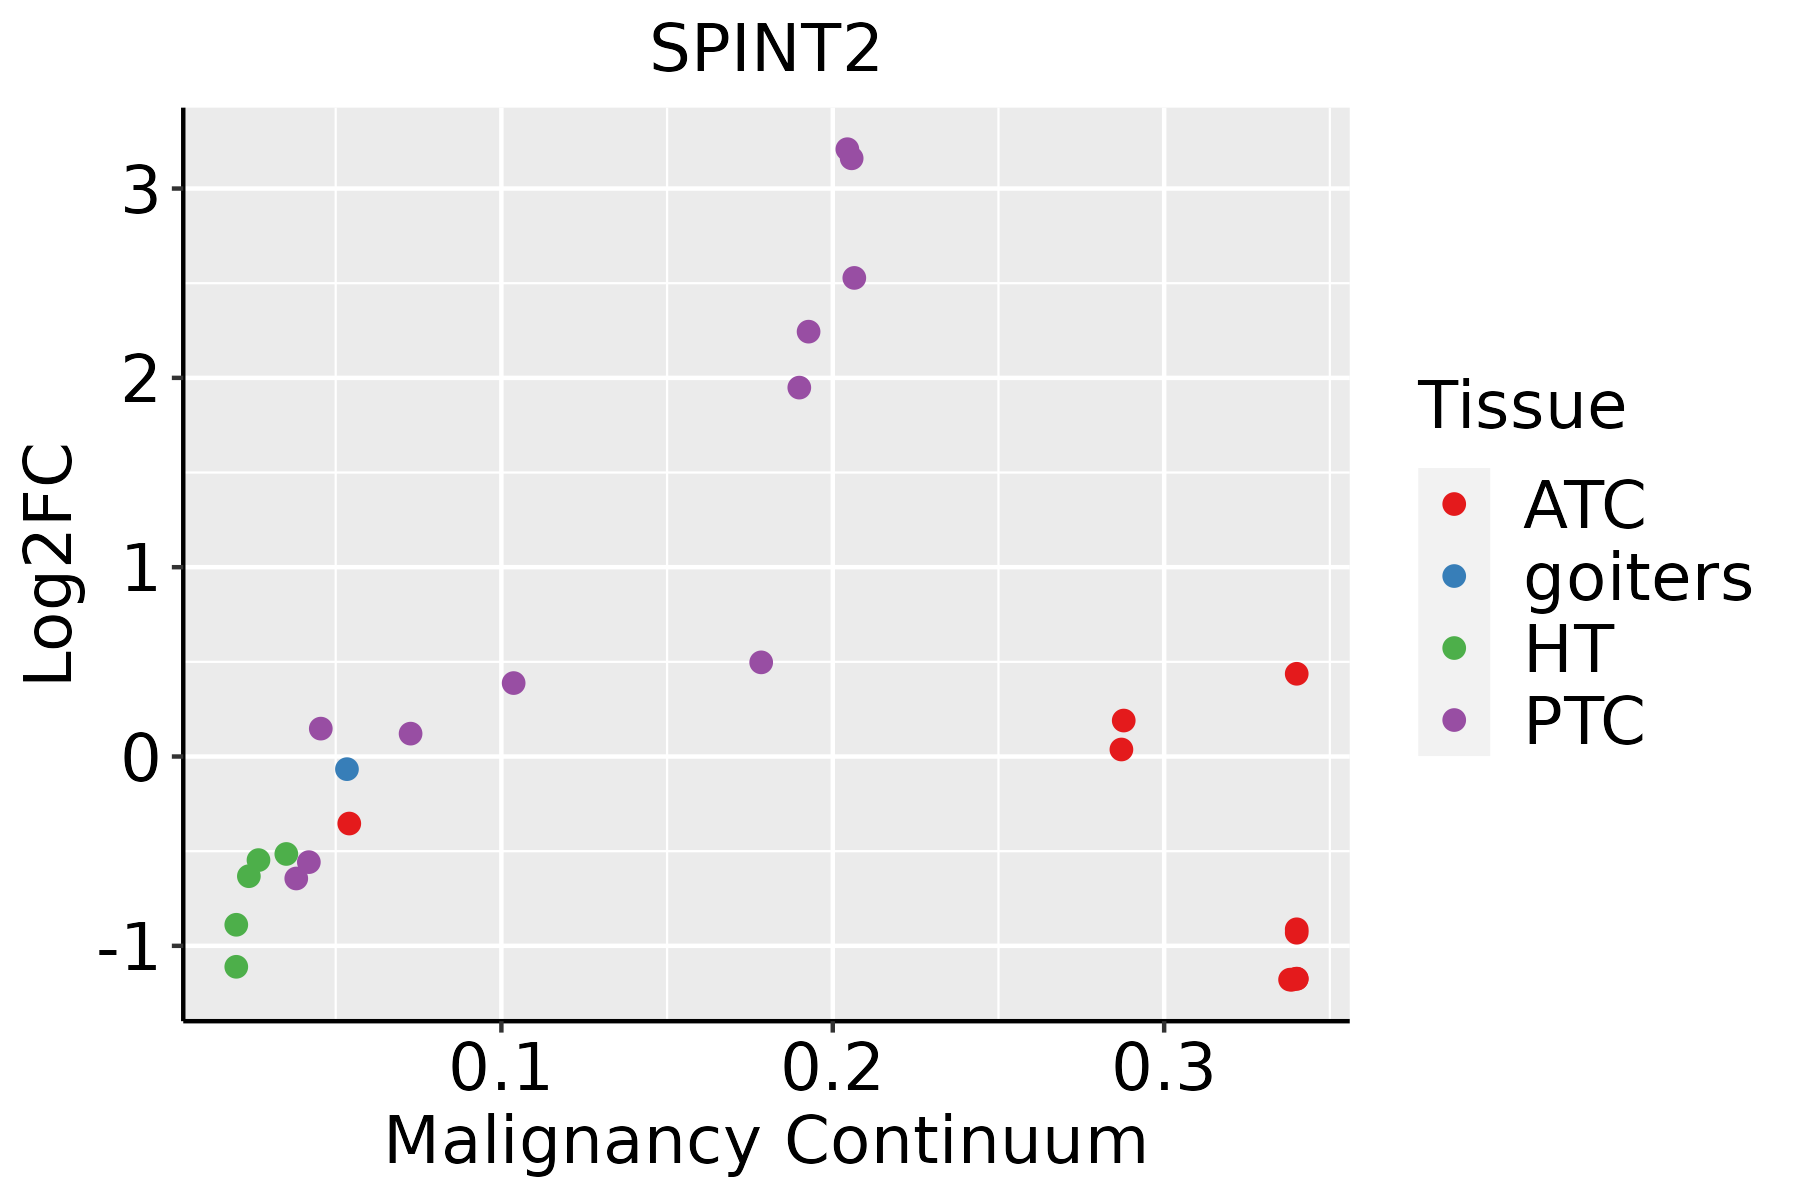 | ATC: Anaplastic thyroid cancer |
| HT: Hashimoto's thyroiditis | ||
| PTC: Papillary thyroid cancer |
| ∗log2FC in expression of this searched gene in stem-like cells from each diseased tissue sample relative to stem-like cells in normal samples in each tissue plotted against the malignancy continuum. Samples are colored based on if they are from different disease stage. |
Top |
Malignant transformation related pathway analysis |
| Find out the enriched GO biological processes and KEGG pathways involved in transition from healthy to precancer to cancer |
| Tissue | Disease Stage | Enriched GO biological Processes |
| Colorectum | AD |  |
| Colorectum | SER |  |
| Colorectum | MSS |  |
| Colorectum | MSI-H |  |
| Colorectum | FAP |  |
| ∗Top 15 enriched GO BP terms are showed in the bar plot of each disease state in each tissue. Each row represents a significant GO biological process which is colored according to the -log10(p.adjust). |
| Page: 1 2 3 4 5 6 7 8 9 |
| GO ID | Tissue | Disease Stage | Description | Gene Ratio | Bg Ratio | pvalue | p.adjust | Count |
| GO:00525479 | Breast | Precancer | regulation of peptidase activity | 71/1080 | 461/18723 | 2.72e-14 | 6.94e-12 | 71 |
| GO:00525489 | Breast | Precancer | regulation of endopeptidase activity | 67/1080 | 432/18723 | 1.06e-13 | 2.36e-11 | 67 |
| GO:00458619 | Breast | Precancer | negative regulation of proteolysis | 50/1080 | 351/18723 | 2.99e-09 | 2.39e-07 | 50 |
| GO:00513468 | Breast | Precancer | negative regulation of hydrolase activity | 50/1080 | 379/18723 | 3.85e-08 | 2.34e-06 | 50 |
| GO:00104668 | Breast | Precancer | negative regulation of peptidase activity | 38/1080 | 262/18723 | 1.46e-07 | 7.82e-06 | 38 |
| GO:00109519 | Breast | Precancer | negative regulation of endopeptidase activity | 37/1080 | 252/18723 | 1.55e-07 | 8.05e-06 | 37 |
| GO:00224079 | Breast | Precancer | regulation of cell-cell adhesion | 45/1080 | 448/18723 | 2.12e-04 | 3.30e-03 | 45 |
| GO:00018927 | Breast | Precancer | embryonic placenta development | 14/1080 | 82/18723 | 2.30e-04 | 3.48e-03 | 14 |
| GO:00486087 | Breast | Precancer | reproductive structure development | 43/1080 | 424/18723 | 2.36e-04 | 3.56e-03 | 43 |
| GO:00614587 | Breast | Precancer | reproductive system development | 43/1080 | 427/18723 | 2.75e-04 | 4.00e-03 | 43 |
| GO:00018907 | Breast | Precancer | placenta development | 19/1080 | 144/18723 | 6.26e-04 | 7.78e-03 | 19 |
| GO:00351486 | Breast | Precancer | tube formation | 19/1080 | 148/18723 | 8.79e-04 | 1.01e-02 | 19 |
| GO:00017017 | Breast | Precancer | in utero embryonic development | 35/1080 | 367/18723 | 2.47e-03 | 2.27e-02 | 35 |
| GO:0060706 | Breast | Precancer | cell differentiation involved in embryonic placenta development | 6/1080 | 25/18723 | 2.49e-03 | 2.28e-02 | 6 |
| GO:00071638 | Breast | Precancer | establishment or maintenance of cell polarity | 23/1080 | 218/18723 | 3.82e-03 | 3.06e-02 | 23 |
| GO:00018386 | Breast | Precancer | embryonic epithelial tube formation | 15/1080 | 121/18723 | 4.12e-03 | 3.24e-02 | 15 |
| GO:00605625 | Breast | Precancer | epithelial tube morphogenesis | 31/1080 | 325/18723 | 4.21e-03 | 3.31e-02 | 31 |
| GO:00020649 | Breast | Precancer | epithelial cell development | 23/1080 | 220/18723 | 4.28e-03 | 3.35e-02 | 23 |
| GO:00607135 | Breast | Precancer | labyrinthine layer morphogenesis | 5/1080 | 22/18723 | 7.32e-03 | 4.88e-02 | 5 |
| GO:005254714 | Breast | IDC | regulation of peptidase activity | 96/1434 | 461/18723 | 7.58e-20 | 6.15e-17 | 96 |
| Page: 1 2 3 4 5 6 7 8 9 10 11 12 13 14 15 16 17 18 19 20 21 22 23 24 25 26 27 28 29 30 31 32 33 34 35 36 37 38 |
| Pathway ID | Tissue | Disease Stage | Description | Gene Ratio | Bg Ratio | pvalue | p.adjust | qvalue | Count |
| Page: 1 |
Top |
Cell-cell communication analysis |
| Identification of potential cell-cell interactions between two cell types and their ligand-receptor pairs for different disease states |
| Ligand | Receptor | LRpair | Pathway | Tissue | Disease Stage |
| Page: 1 |
Top |
Single-cell gene regulatory network inference analysis |
| Find out the significant the regulons (TFs) and the target genes of each regulon across cell types for different disease states |
| TF | Cell Type | Tissue | Disease Stage | Target Gene | RSS | Regulon Activity |
| ∗The dot plots of a searched regulon are shown for all cell subpopulations in each disease state of each tissue based on the regulon specific score inferred using pySCENIC and by calculating the average expression. |
| Page: 1 |
Top |
Somatic mutation of malignant transformation related genes |
| Annotation of somatic variants for genes involved in malignant transformation |
| Hugo Symbol | Variant Class | Variant Classification | dbSNP RS | HGVSc | HGVSp | HGVSp Short | SWISSPROT | BIOTYPE | SIFT | PolyPhen | Tumor Sample Barcode | Tissue | Histology | Sex | Age | Stage | Therapy Types | Drugs | Outcome |
| SPINT2 | SNV | Missense_Mutation | novel | c.367T>A | p.Ser123Thr | p.S123T | O43291 | protein_coding | tolerated(0.1) | benign(0.003) | TCGA-AO-A0JB-01 | Breast | breast invasive carcinoma | Female | <65 | III/IV | Chemotherapy | cyclophosphamide | SD |
| SPINT2 | SNV | Missense_Mutation | c.68N>G | p.Ser23Cys | p.S23C | O43291 | protein_coding | tolerated_low_confidence(0.06) | benign(0) | TCGA-IR-A3LA-01 | Cervix | cervical & endocervical cancer | Female | <65 | I/II | Chemotherapy | cisplatin | CR | |
| SPINT2 | SNV | Missense_Mutation | rs11548458 | c.142N>T | p.Arg48Trp | p.R48W | O43291 | protein_coding | deleterious(0) | probably_damaging(1) | TCGA-AM-5821-01 | Colorectum | colon adenocarcinoma | Female | >=65 | I/II | Unknown | Unknown | SD |
| SPINT2 | SNV | Missense_Mutation | c.443N>A | p.Arg148His | p.R148H | O43291 | protein_coding | deleterious(0) | possibly_damaging(0.709) | TCGA-AZ-6601-01 | Colorectum | colon adenocarcinoma | Male | >=65 | I/II | Unknown | Unknown | PD | |
| SPINT2 | SNV | Missense_Mutation | c.510N>T | p.Lys170Asn | p.K170N | O43291 | protein_coding | deleterious(0) | possibly_damaging(0.74) | TCGA-AG-A002-01 | Colorectum | rectum adenocarcinoma | Male | <65 | I/II | Unknown | Unknown | SD | |
| SPINT2 | deletion | Frame_Shift_Del | c.205delN | p.Gly70AlafsTer10 | p.G70Afs*10 | O43291 | protein_coding | TCGA-CM-4743-01 | Colorectum | colon adenocarcinoma | Male | >=65 | I/II | Chemotherapy | capecitabine | SD | |||
| SPINT2 | SNV | Missense_Mutation | rs746801741 | c.457G>A | p.Val153Met | p.V153M | O43291 | protein_coding | deleterious(0.05) | possibly_damaging(0.75) | TCGA-A5-A0G1-01 | Endometrium | uterine corpus endometrioid carcinoma | Female | >=65 | I/II | Unknown | Unknown | SD |
| SPINT2 | SNV | Missense_Mutation | novel | c.16N>A | p.Gly6Arg | p.G6R | O43291 | protein_coding | deleterious_low_confidence(0.01) | possibly_damaging(0.652) | TCGA-A5-A1OF-01 | Endometrium | uterine corpus endometrioid carcinoma | Female | <65 | I/II | Unknown | Unknown | SD |
| SPINT2 | SNV | Missense_Mutation | c.316N>T | p.Ala106Ser | p.A106S | O43291 | protein_coding | tolerated(0.06) | benign(0.074) | TCGA-AP-A059-01 | Endometrium | uterine corpus endometrioid carcinoma | Female | >=65 | I/II | Unknown | Unknown | SD | |
| SPINT2 | SNV | Missense_Mutation | c.580N>T | p.Leu194Phe | p.L194F | O43291 | protein_coding | tolerated(0.7) | benign(0.04) | TCGA-AP-A059-01 | Endometrium | uterine corpus endometrioid carcinoma | Female | >=65 | I/II | Unknown | Unknown | SD |
| Page: 1 2 3 |
Top |
Related drugs of malignant transformation related genes |
| Identification of chemicals and drugs interact with genes involved in malignant transfromation |
| (DGIdb 4.0) |
| Entrez ID | Symbol | Category | Interaction Types | Drug Claim Name | Drug Name | PMIDs |
| Page: 1 |

Copyright 2023-Present -The University of Texas Health Science Center at Houston |