
|
|||||
|
 | |
| |
| |
| |
| |
| |
|
Gene: CST3 |
Gene summary for CST3 |
| Gene information | Species | Human | Gene symbol | CST3 | Gene ID | 1471 |
| Gene name | cystatin C | |
| Gene Alias | ARMD11 | |
| Cytomap | 20p11.21 | |
| Gene Type | protein-coding | GO ID | GO:0001974 | UniProtAcc | A0A0K0K1J1 |
Top |
Malignant transformation analysis |
| Identification of the aberrant gene expression in precancerous and cancerous lesions by comparing the gene expression of stem-like cells in diseased tissues with normal stem cells |
| Entrez ID | Symbol | Replicates | Species | Organ | Tissue | Adj P-value | Log2FC | Malignancy |
| 1471 | CST3 | LP17 | Human | Oral cavity | LP | 1.46e-26 | 2.37e+00 | 0.2349 |
| 1471 | CST3 | EOLP-2 | Human | Oral cavity | EOLP | 8.18e-10 | 4.58e-01 | -0.0203 |
| 1471 | CST3 | SYSMH1 | Human | Oral cavity | OSCC | 5.57e-31 | 1.55e+00 | 0.1127 |
| 1471 | CST3 | SYSMH2 | Human | Oral cavity | OSCC | 4.54e-29 | 2.73e+00 | 0.2326 |
| 1471 | CST3 | SYSMH3 | Human | Oral cavity | OSCC | 4.39e-38 | 2.83e+00 | 0.2442 |
| 1471 | CST3 | SYSMH4 | Human | Oral cavity | OSCC | 1.37e-03 | 3.05e-01 | 0.1226 |
| 1471 | CST3 | SYSMH5 | Human | Oral cavity | OSCC | 2.45e-31 | 1.96e+00 | 0.0647 |
| 1471 | CST3 | SYSMH6 | Human | Oral cavity | OSCC | 3.01e-28 | 2.19e+00 | 0.1275 |
| 1471 | CST3 | GSM5252126_BPH283PrGF_Via | Human | Prostate | BPH | 9.83e-12 | 8.30e-01 | -0.1771 |
| 1471 | CST3 | GSM5252127_BPH283PrSF_Via | Human | Prostate | BPH | 2.06e-05 | 3.33e-01 | -0.1453 |
| 1471 | CST3 | GSM5252128_BPH327PrGF_Via | Human | Prostate | BPH | 2.69e-15 | 8.93e-01 | -0.1688 |
| 1471 | CST3 | GSM5252129_BPH327PrSF_Via | Human | Prostate | BPH | 2.29e-16 | 8.88e-01 | -0.1697 |
| 1471 | CST3 | GSM5252130_BPH340PrGF_Via | Human | Prostate | BPH | 8.81e-25 | 1.28e+00 | -0.1972 |
| 1471 | CST3 | GSM5252131_BPH340PrSF_Via | Human | Prostate | BPH | 1.36e-51 | 1.96e+00 | -0.2126 |
| 1471 | CST3 | GSM5252132_BPH389PrGF | Human | Prostate | BPH | 1.44e-06 | 4.39e-01 | -0.2247 |
| 1471 | CST3 | GSM5252133_BPH389PrSF | Human | Prostate | BPH | 2.44e-04 | 9.41e-01 | -0.2027 |
| 1471 | CST3 | GSM5252134_BPH511PrG_Fcol_3GEX | Human | Prostate | BPH | 3.60e-06 | 3.92e-01 | -0.1433 |
| 1471 | CST3 | GSM5252135_BPH511PrPUr_Fcol_3GEX | Human | Prostate | BPH | 1.10e-20 | 1.24e+00 | -0.1833 |
| 1471 | CST3 | GSM5252136_BPH556PrGA1_Fcol | Human | Prostate | BPH | 1.20e-05 | 4.16e-01 | -0.23 |
| 1471 | CST3 | GSM5252137_BPH556PrGA2_Fcol | Human | Prostate | BPH | 4.90e-15 | 1.25e+00 | -0.23 |
| Page: 1 2 3 4 5 6 7 8 9 10 11 12 13 14 15 16 17 |
| Tissue | Expression Dynamics | Abbreviation |
| Breast | 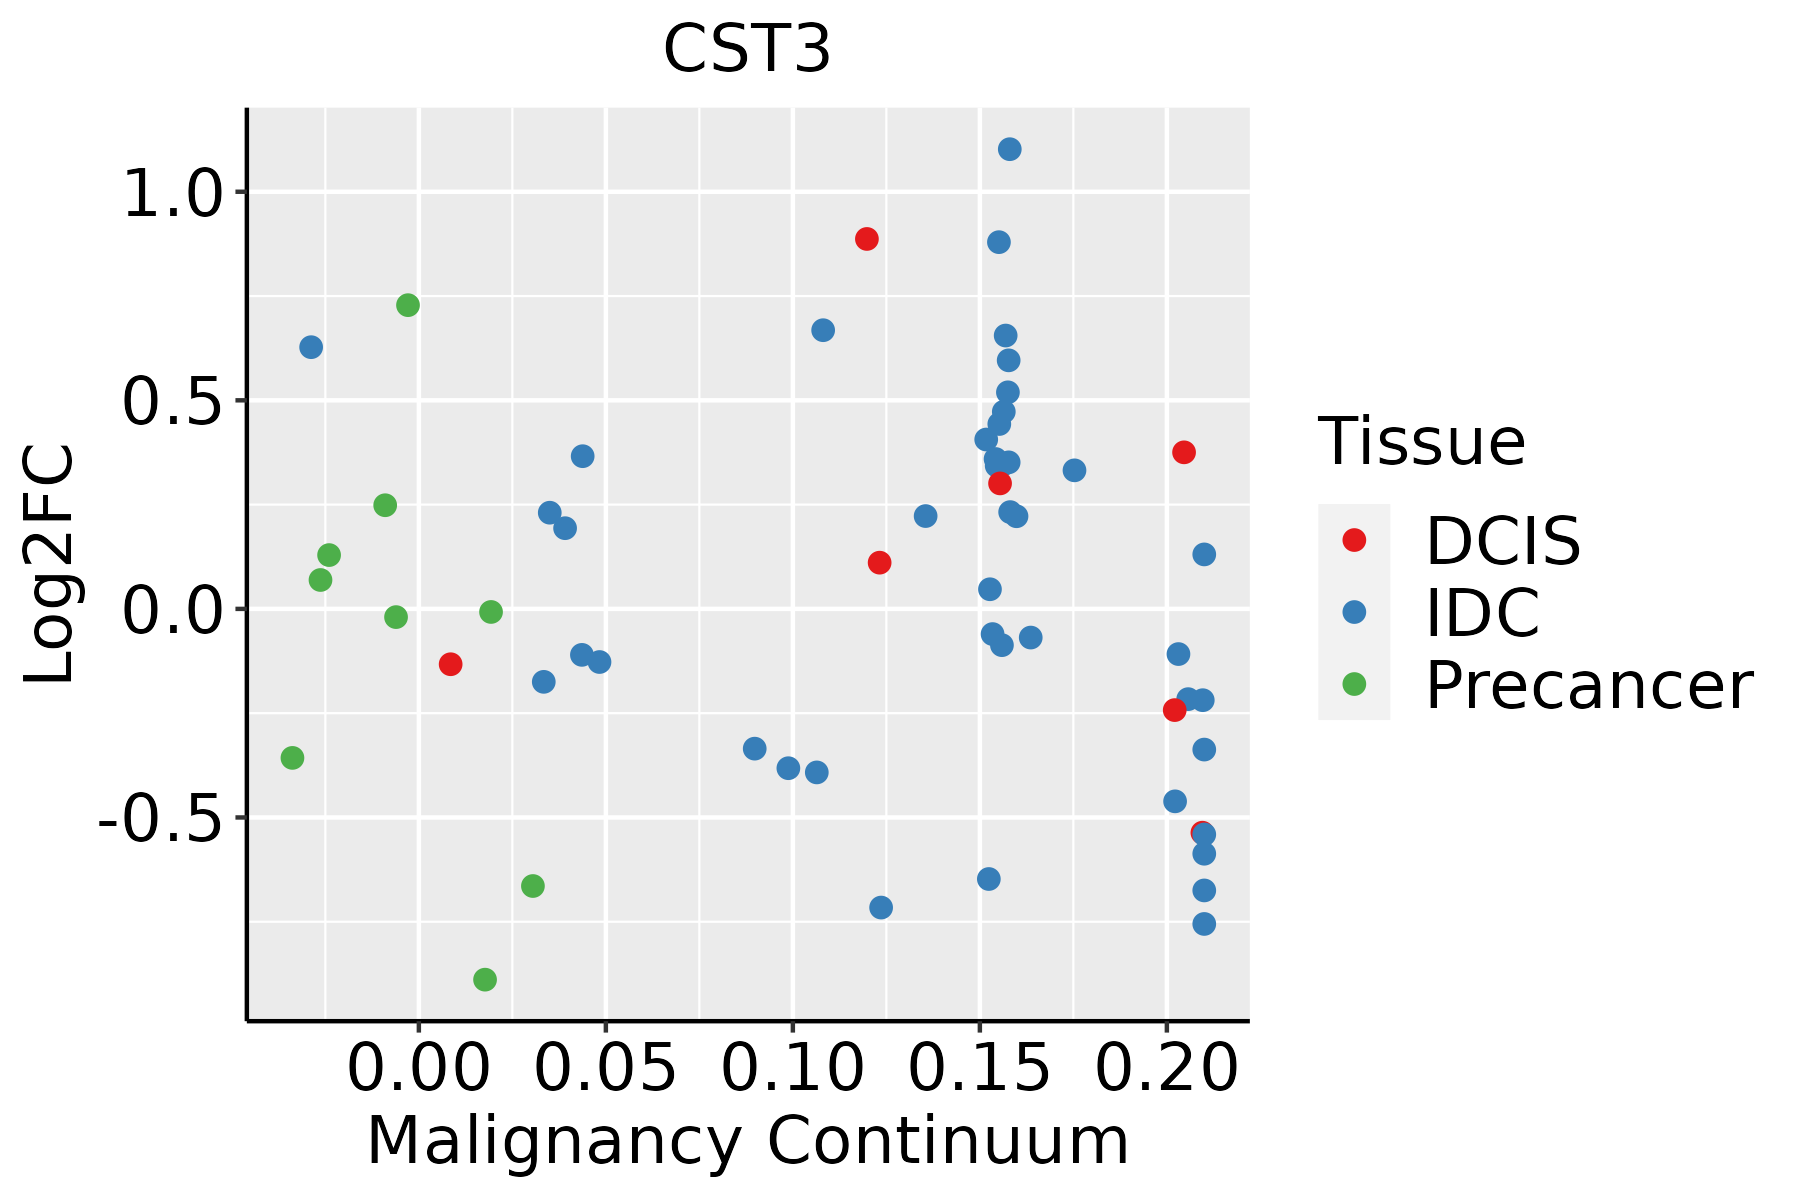 | IDC: Invasive ductal carcinoma |
| DCIS: Ductal carcinoma in situ | ||
| Precancer(BRCA1-mut): Precancerous lesion from BRCA1 mutation carriers | ||
| Cervix |  | CC: Cervix cancer |
| HSIL_HPV: HPV-infected high-grade squamous intraepithelial lesions | ||
| N_HPV: HPV-infected normal cervix | ||
| Colorectum (GSE201348) |  | FAP: Familial adenomatous polyposis |
| CRC: Colorectal cancer | ||
| Colorectum (HTA11) | 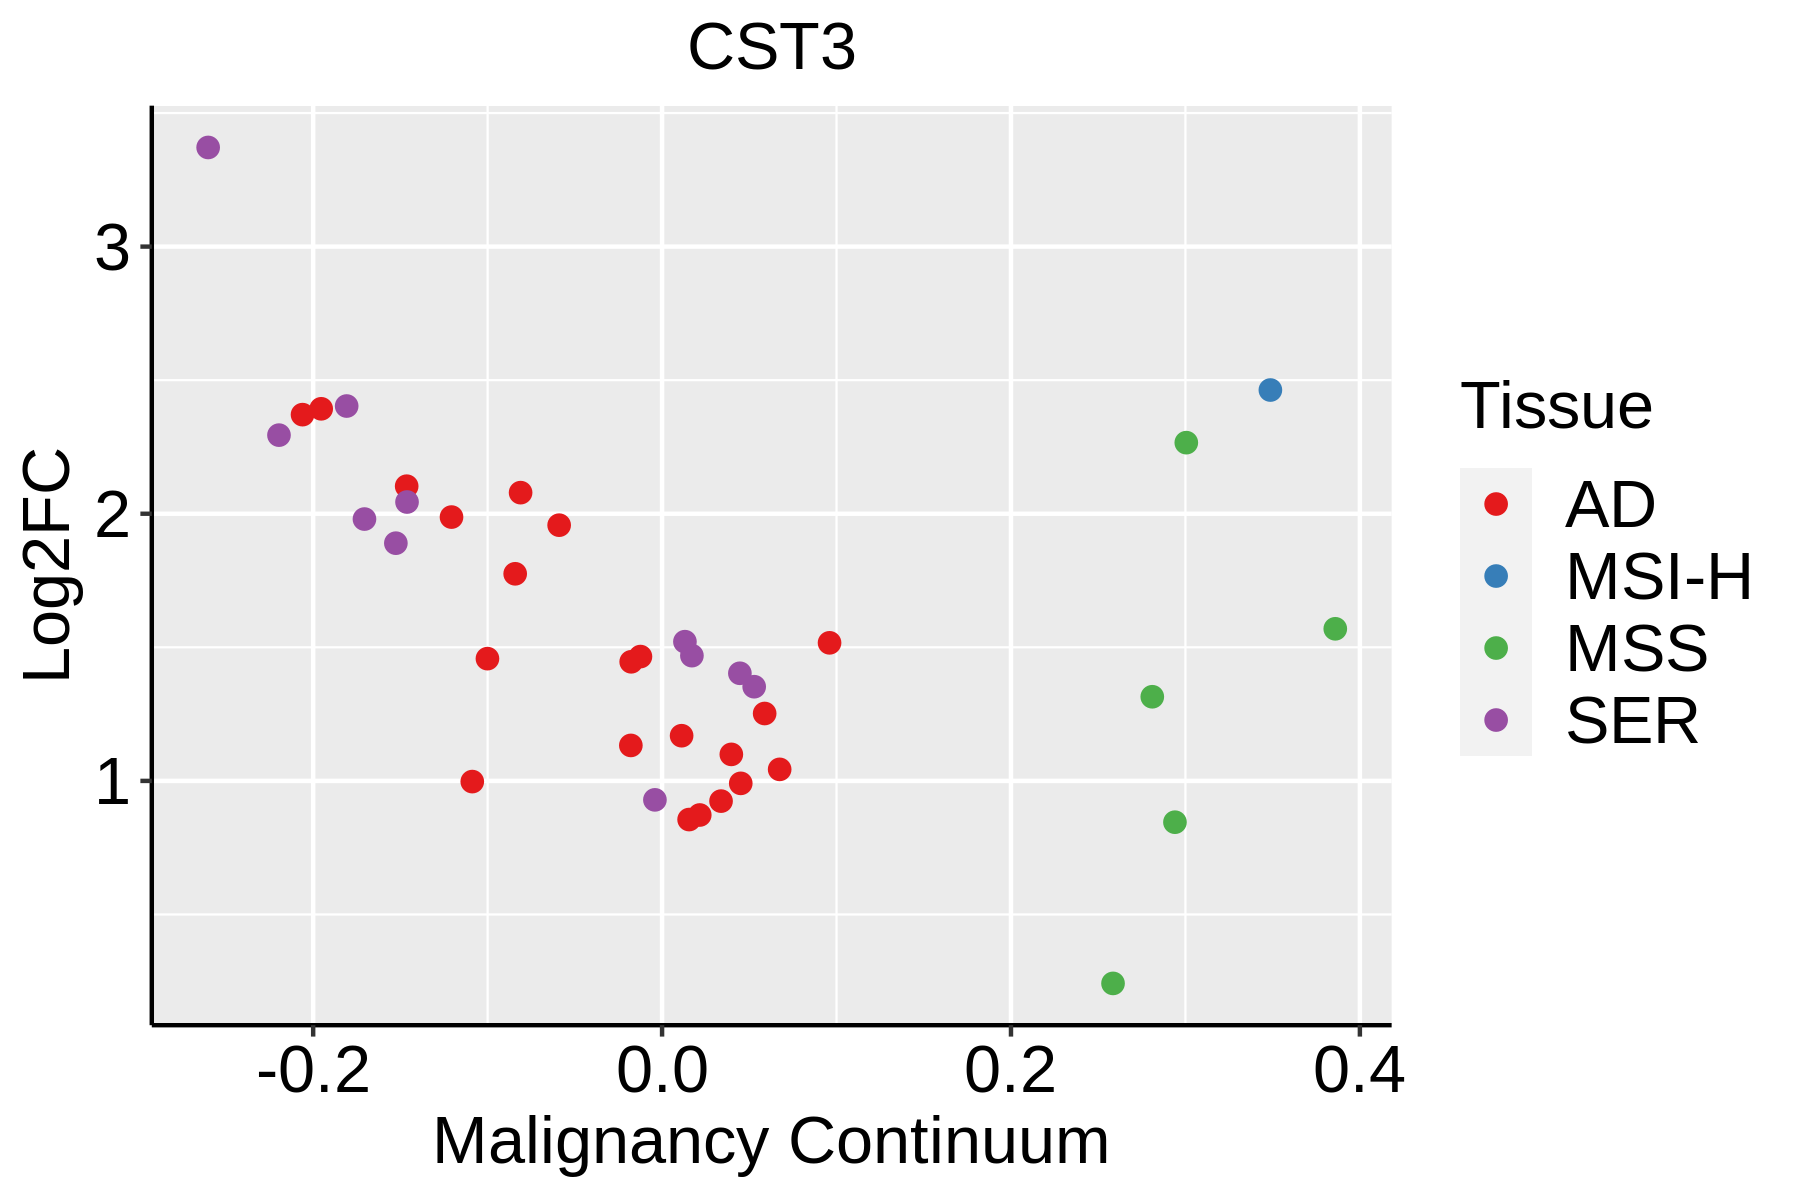 | AD: Adenomas |
| SER: Sessile serrated lesions | ||
| MSI-H: Microsatellite-high colorectal cancer | ||
| MSS: Microsatellite stable colorectal cancer | ||
| Endometrium |  | AEH: Atypical endometrial hyperplasia |
| EEC: Endometrioid Cancer | ||
| Esophagus | 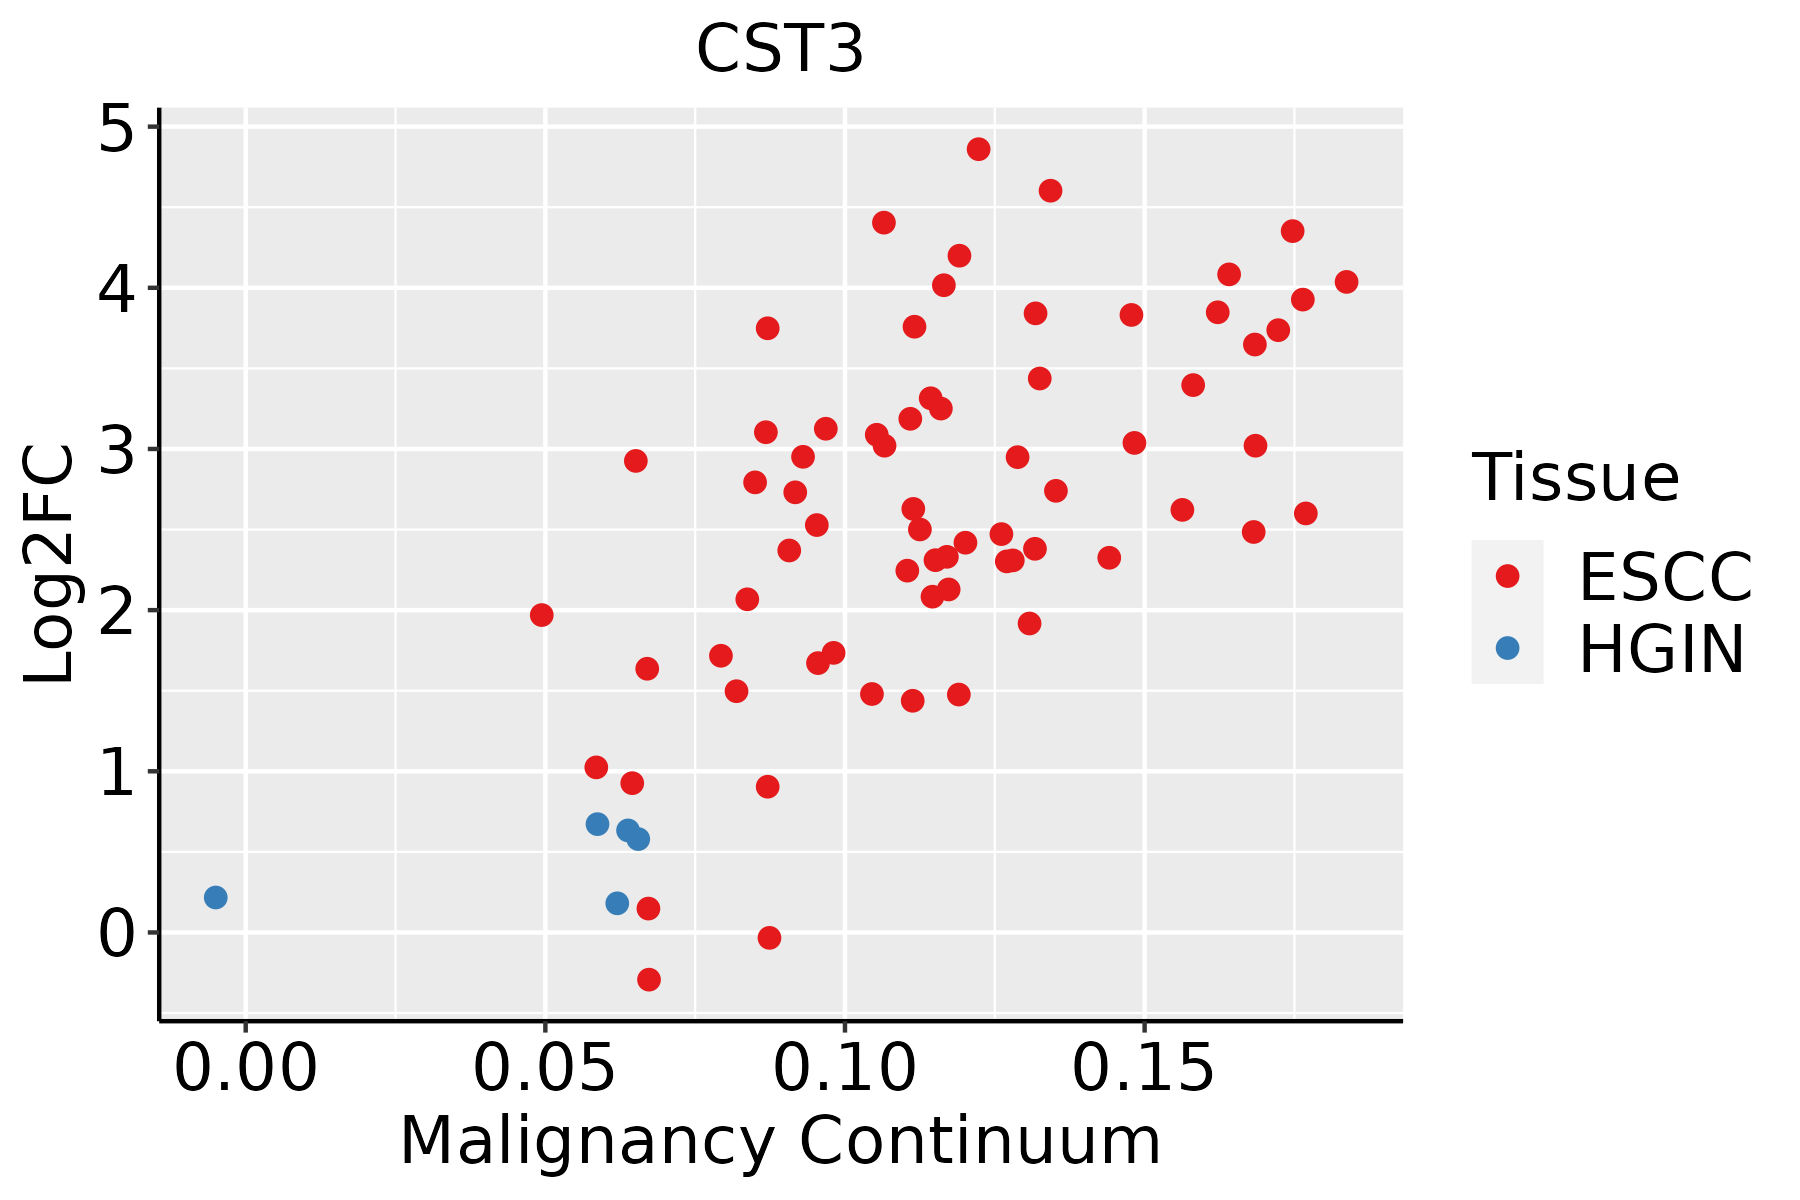 | ESCC: Esophageal squamous cell carcinoma |
| HGIN: High-grade intraepithelial neoplasias | ||
| LGIN: Low-grade intraepithelial neoplasias | ||
| GC | 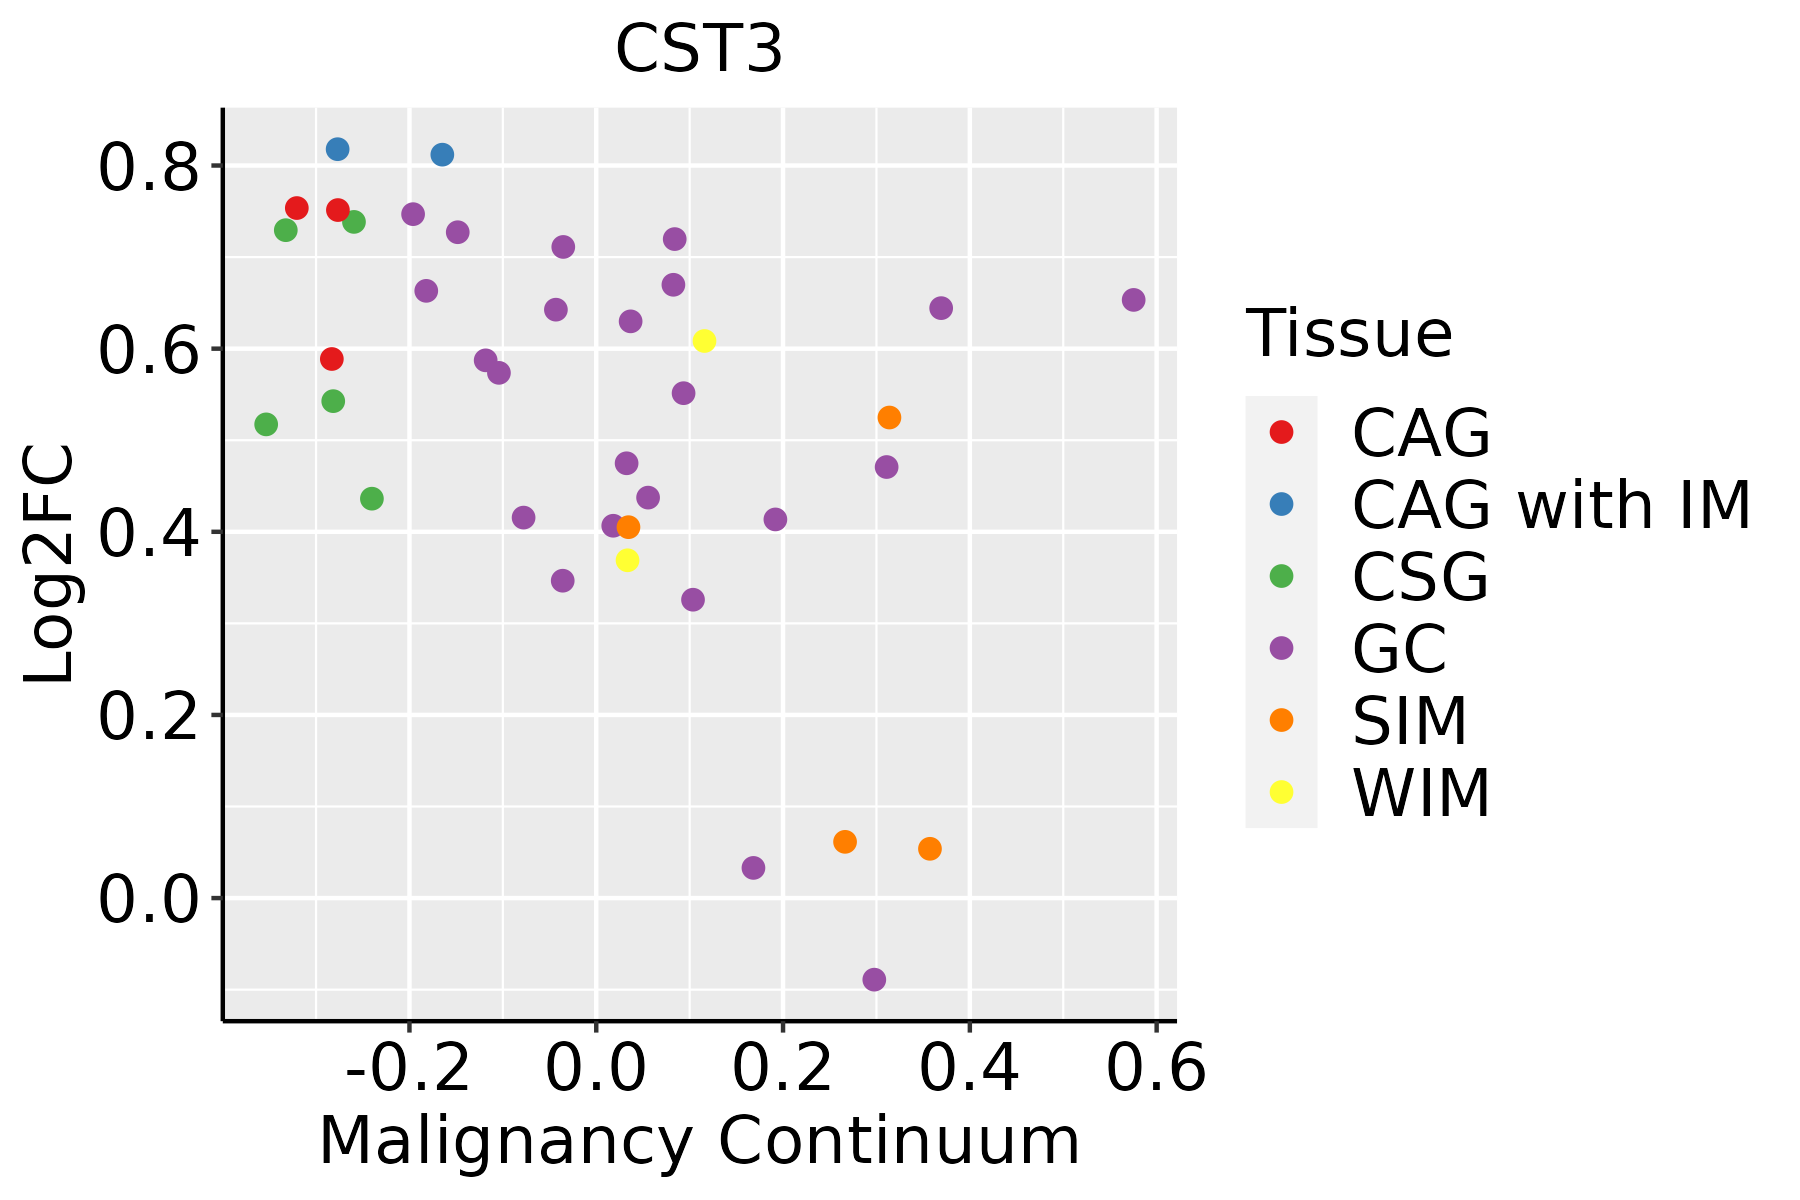 | CAG: Chronic atrophic gastritis |
| CAG with IM: Chronic atrophic gastritis with intestinal metaplasia | ||
| CSG: Chronic superficial gastritis | ||
| GC: Gastric cancer | ||
| SIM: Severe intestinal metaplasia | ||
| WIM: Wild intestinal metaplasia | ||
| Liver | 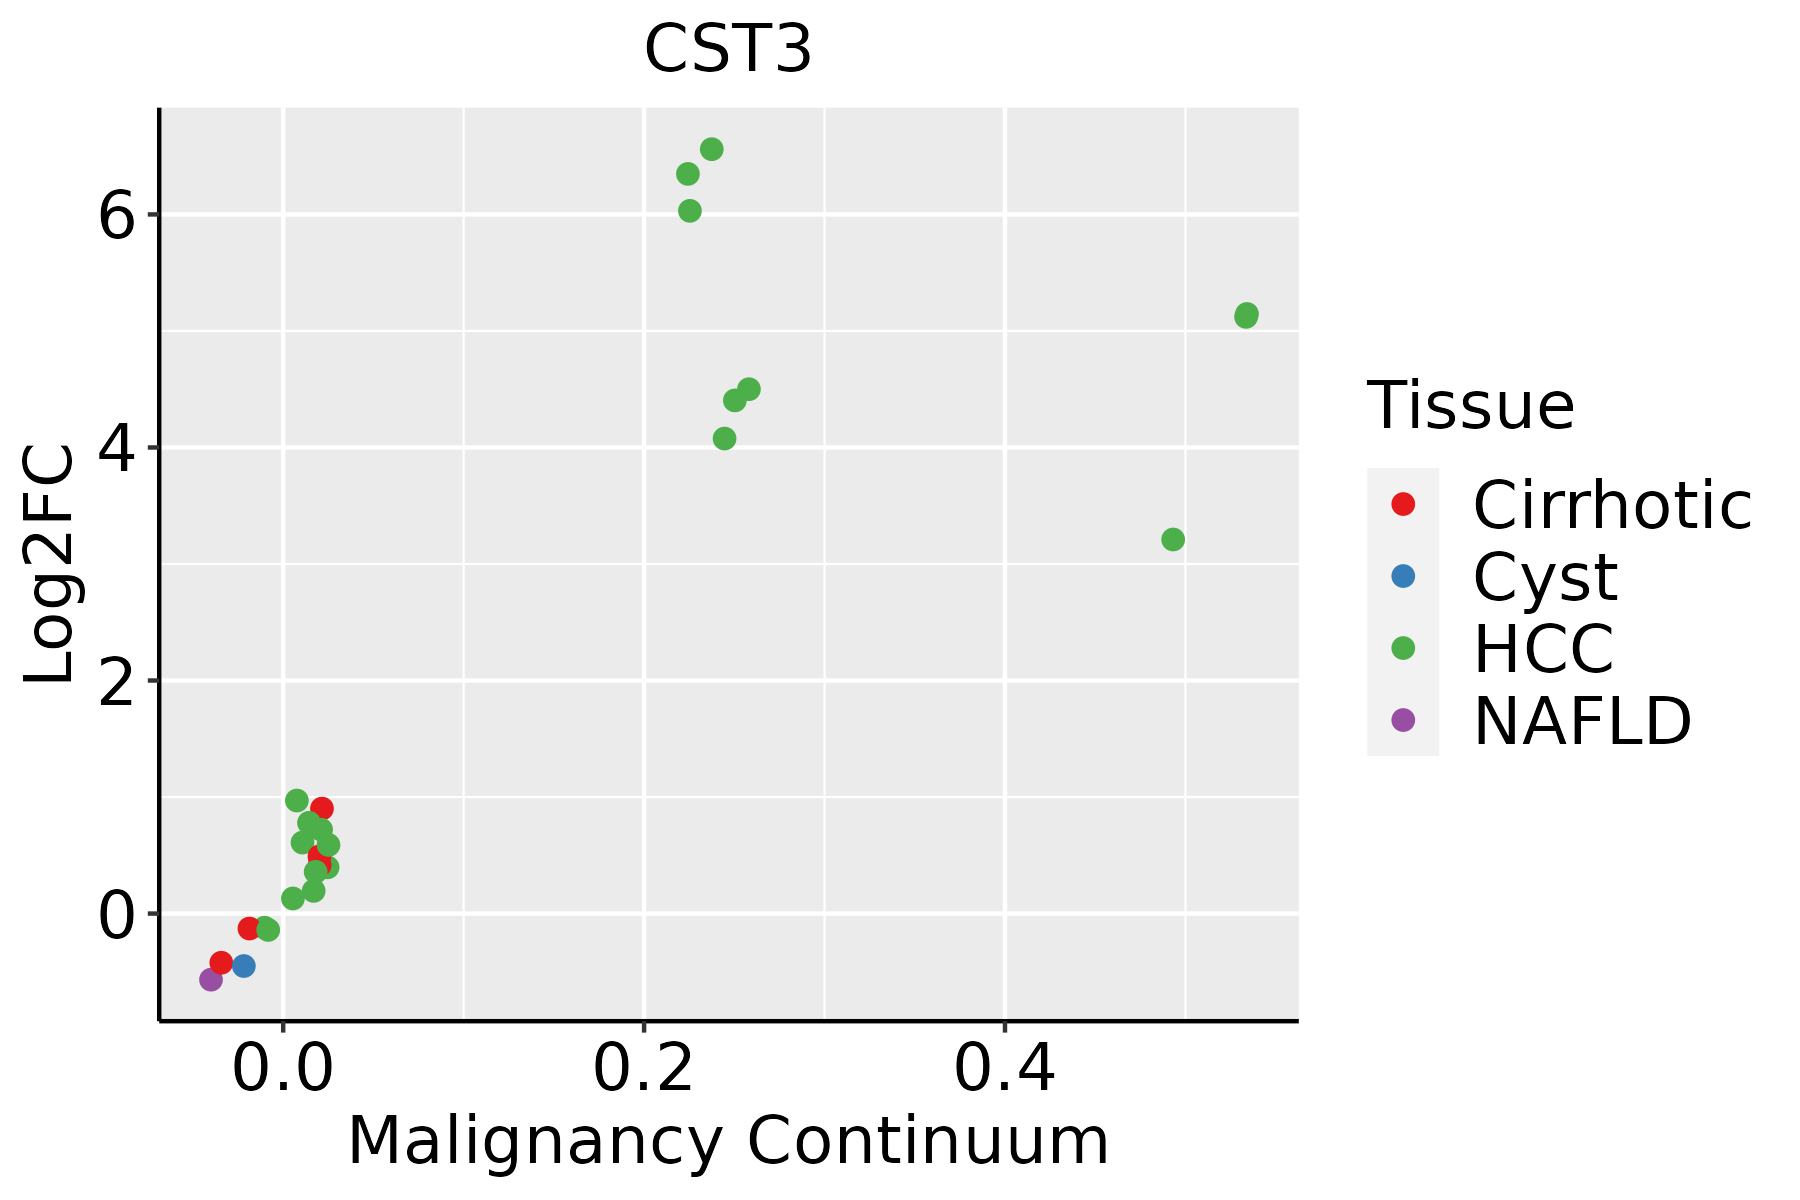 | HCC: Hepatocellular carcinoma |
| NAFLD: Non-alcoholic fatty liver disease | ||
| Oral Cavity | 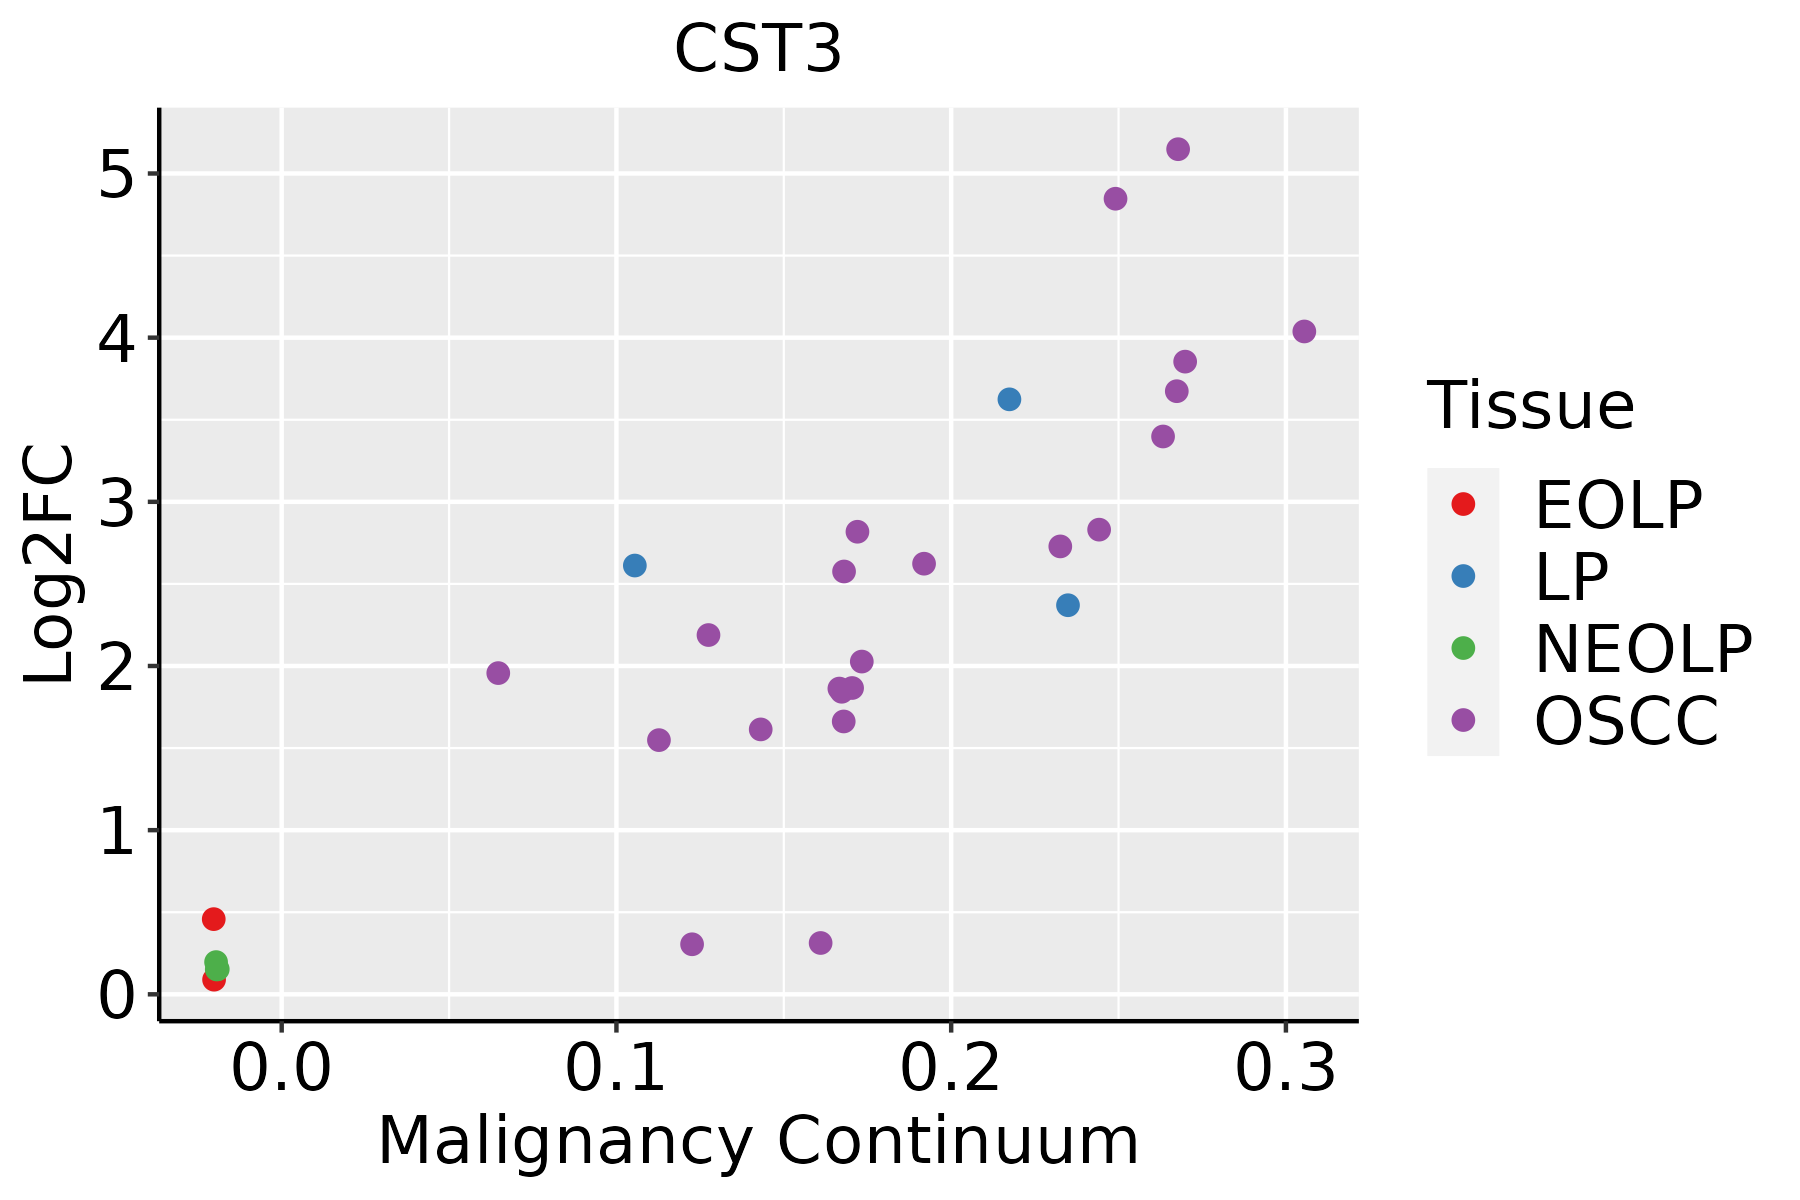 | EOLP: Erosive Oral lichen planus |
| LP: leukoplakia | ||
| NEOLP: Non-erosive oral lichen planus | ||
| OSCC: Oral squamous cell carcinoma | ||
| Prostate | 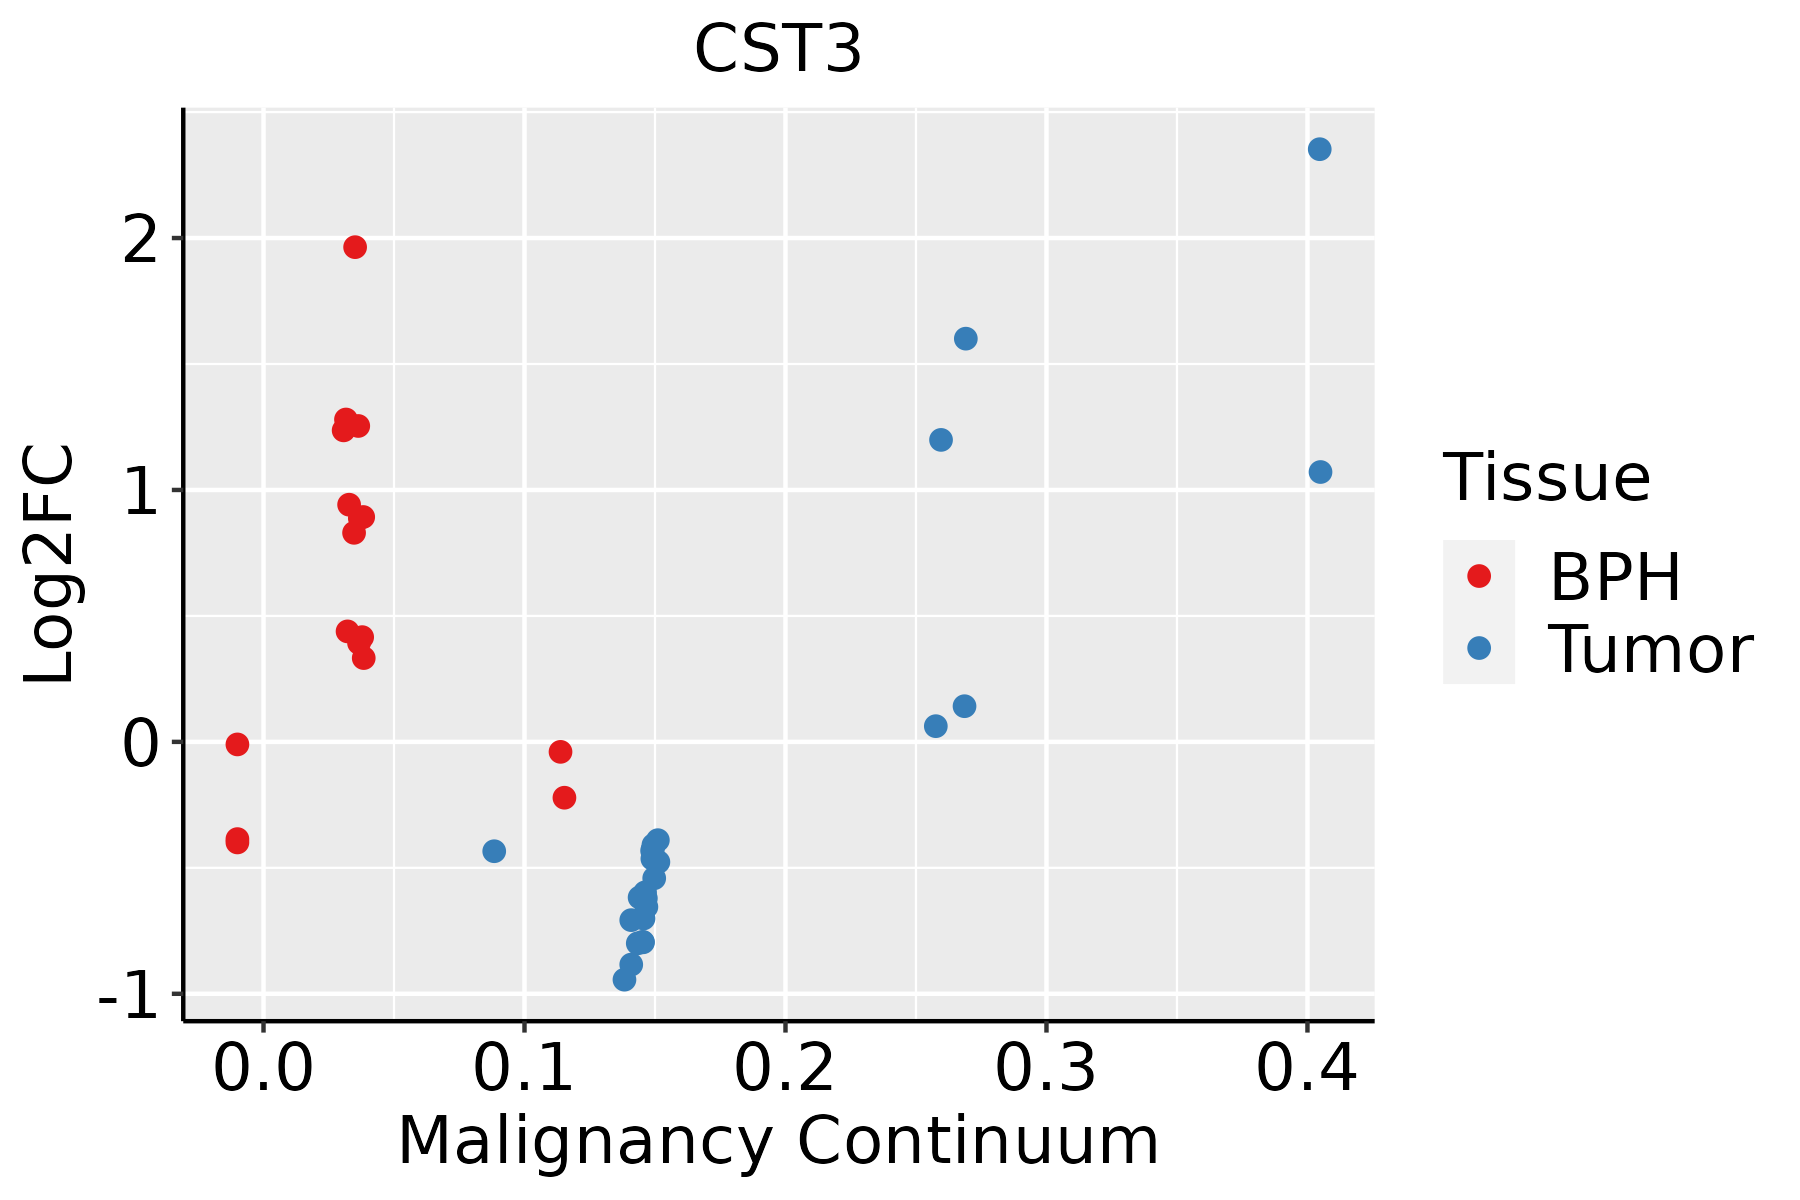 | BPH: Benign Prostatic Hyperplasia |
| Skin | 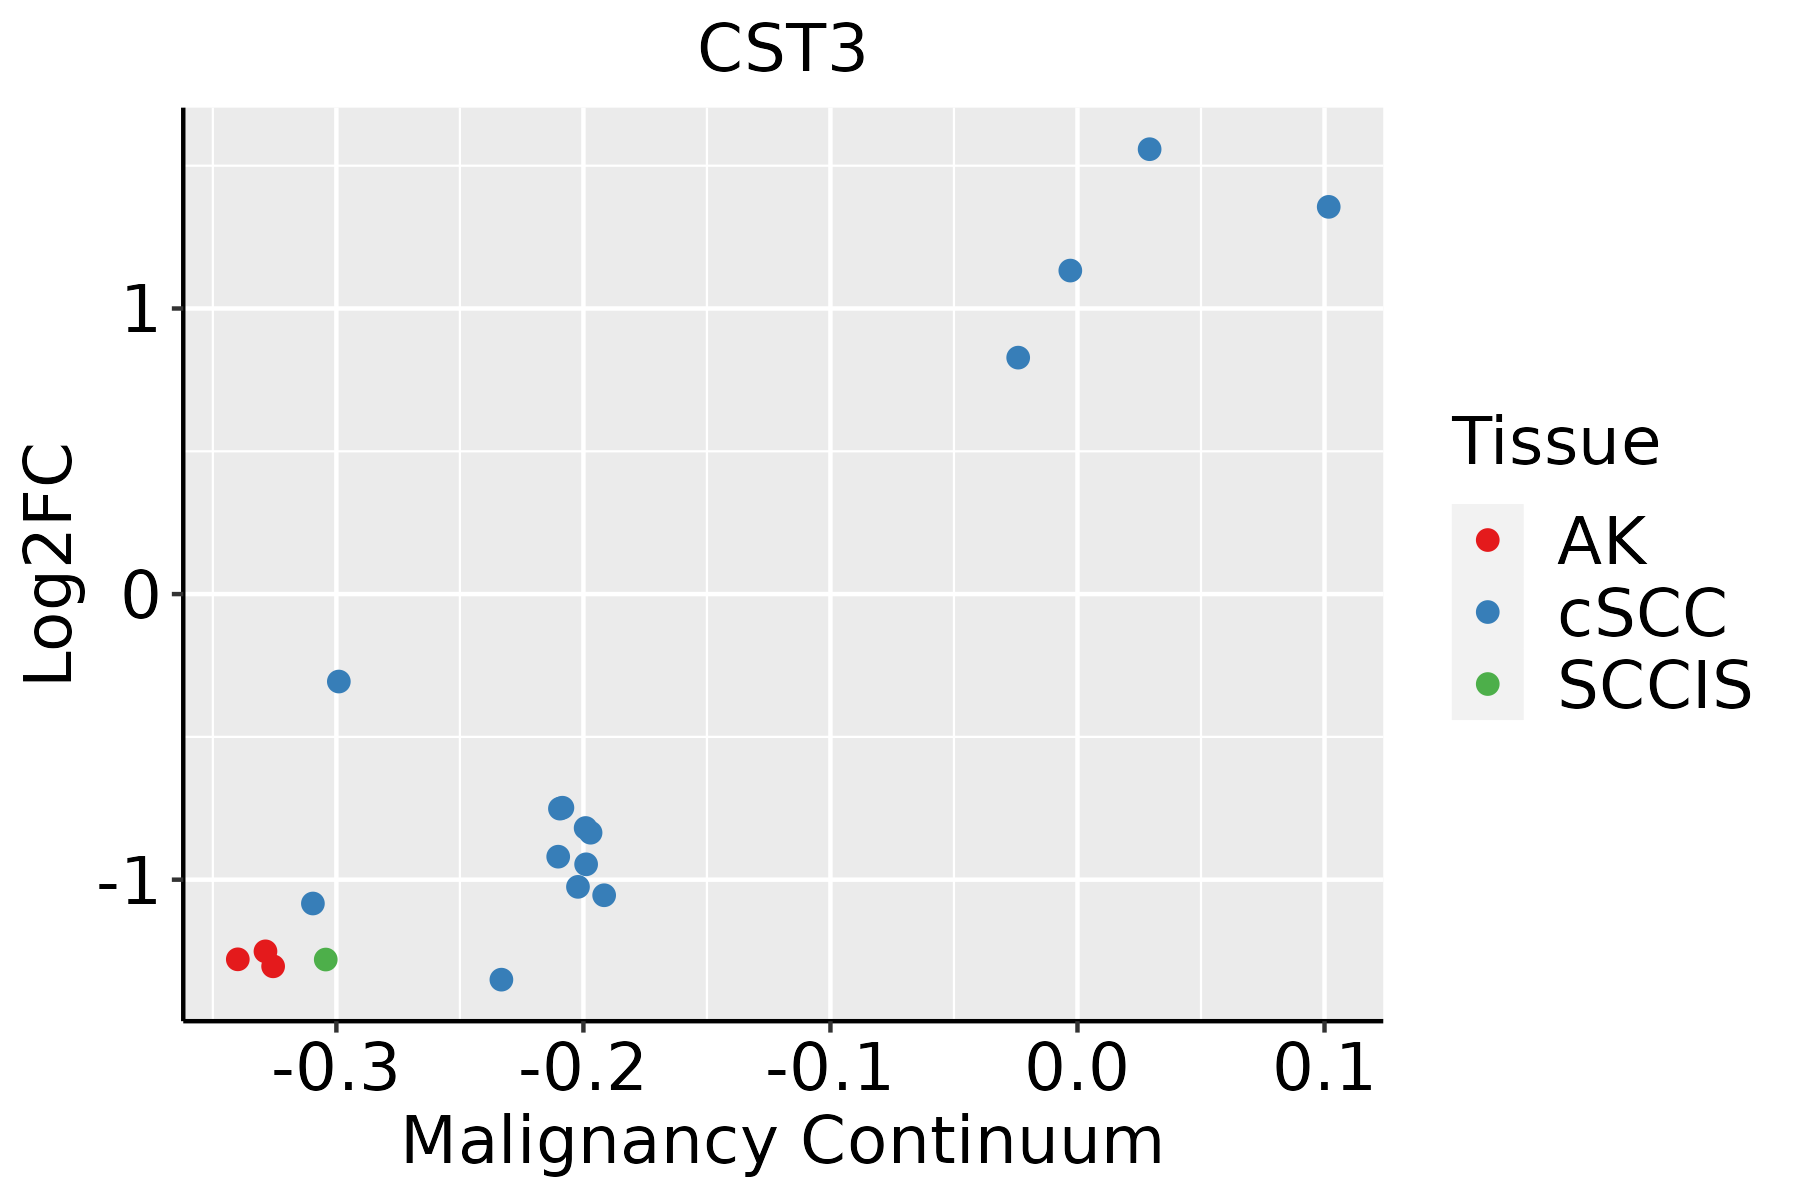 | AK: Actinic keratosis |
| cSCC: Cutaneous squamous cell carcinoma | ||
| SCCIS:squamous cell carcinoma in situ | ||
| Thyroid | 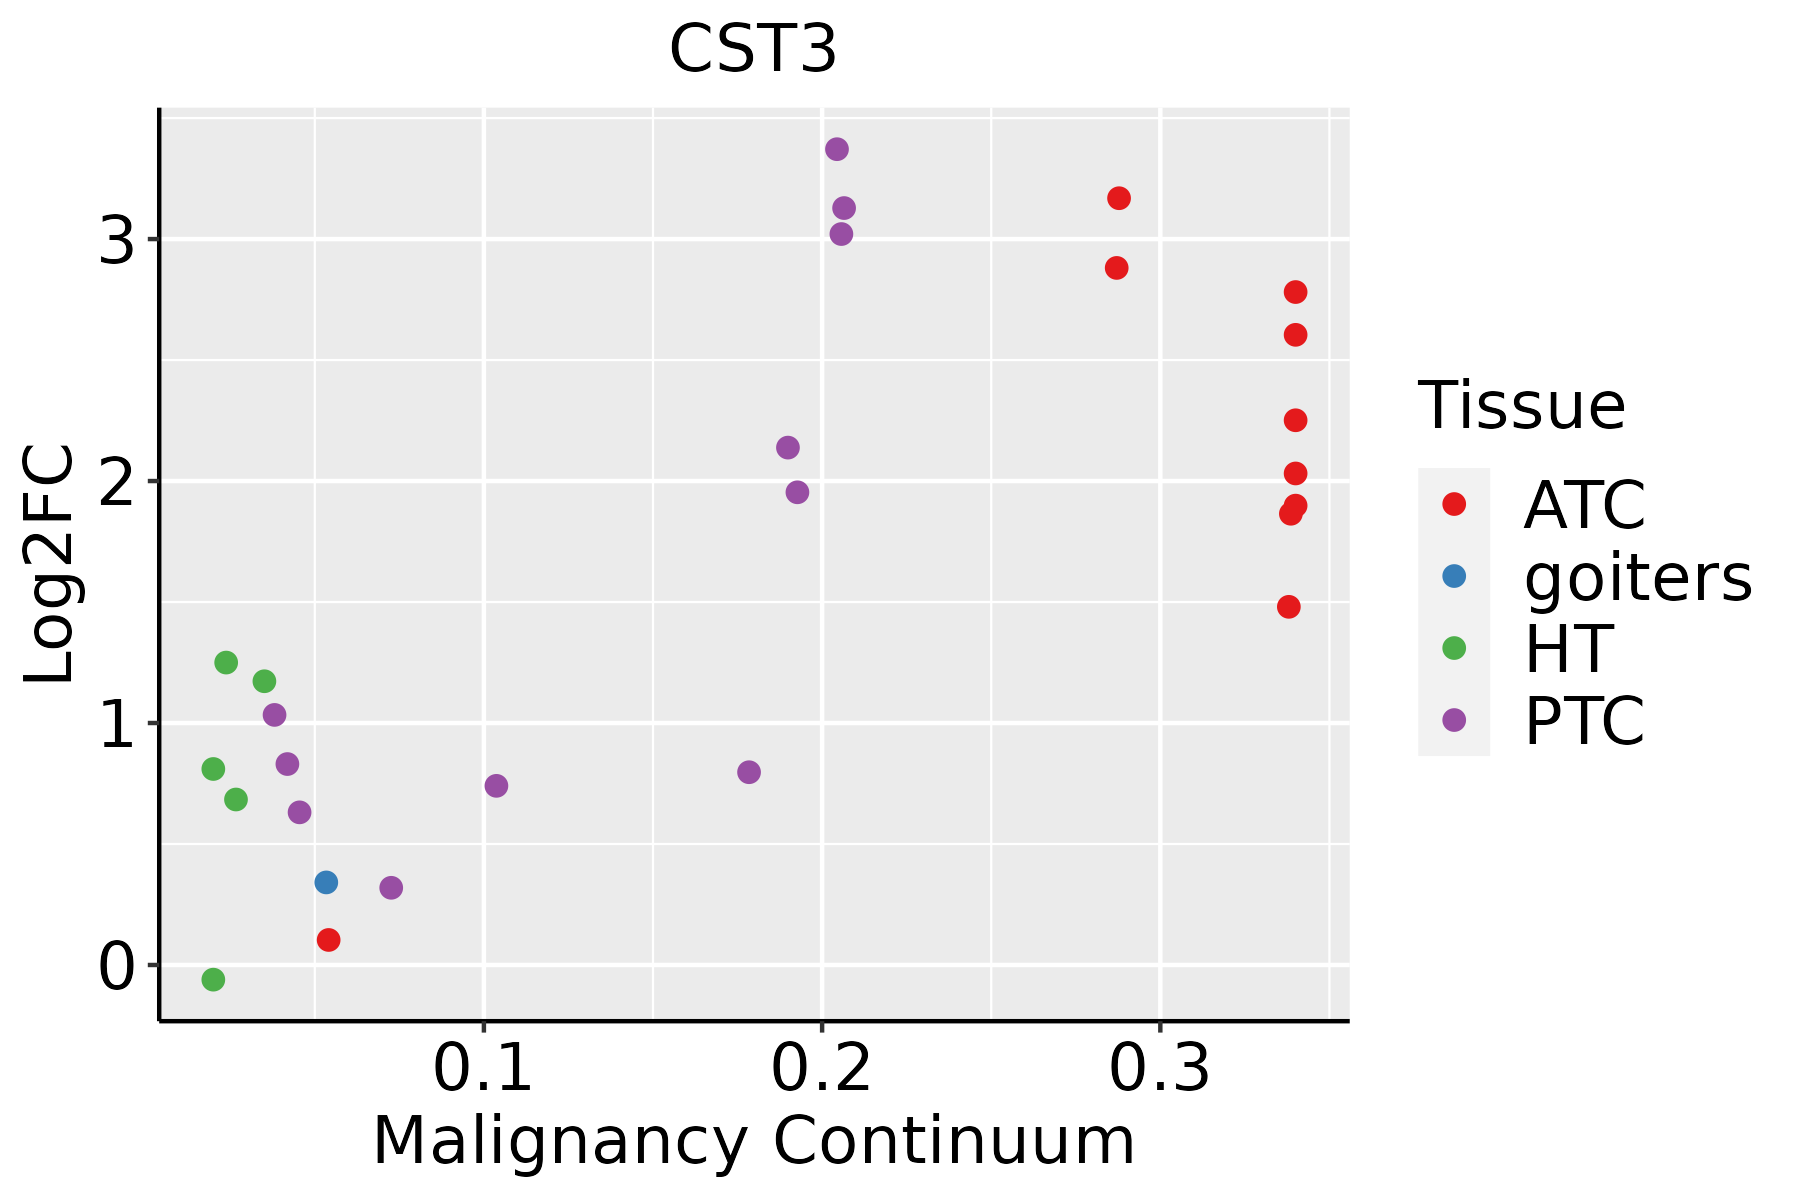 | ATC: Anaplastic thyroid cancer |
| HT: Hashimoto's thyroiditis | ||
| PTC: Papillary thyroid cancer |
| ∗log2FC in expression of this searched gene in stem-like cells from each diseased tissue sample relative to stem-like cells in normal samples in each tissue plotted against the malignancy continuum. Samples are colored based on if they are from different disease stage. |
Top |
Malignant transformation related pathway analysis |
| Find out the enriched GO biological processes and KEGG pathways involved in transition from healthy to precancer to cancer |
| Tissue | Disease Stage | Enriched GO biological Processes |
| Colorectum | AD |  |
| Colorectum | SER |  |
| Colorectum | MSS |  |
| Colorectum | MSI-H |  |
| Colorectum | FAP |  |
| ∗Top 15 enriched GO BP terms are showed in the bar plot of each disease state in each tissue. Each row represents a significant GO biological process which is colored according to the -log10(p.adjust). |
| Page: 1 2 3 4 5 6 7 8 9 |
| GO ID | Tissue | Disease Stage | Description | Gene Ratio | Bg Ratio | pvalue | p.adjust | Count |
| GO:00525479 | Breast | Precancer | regulation of peptidase activity | 71/1080 | 461/18723 | 2.72e-14 | 6.94e-12 | 71 |
| GO:00525489 | Breast | Precancer | regulation of endopeptidase activity | 67/1080 | 432/18723 | 1.06e-13 | 2.36e-11 | 67 |
| GO:00458619 | Breast | Precancer | negative regulation of proteolysis | 50/1080 | 351/18723 | 2.99e-09 | 2.39e-07 | 50 |
| GO:00513468 | Breast | Precancer | negative regulation of hydrolase activity | 50/1080 | 379/18723 | 3.85e-08 | 2.34e-06 | 50 |
| GO:00104668 | Breast | Precancer | negative regulation of peptidase activity | 38/1080 | 262/18723 | 1.46e-07 | 7.82e-06 | 38 |
| GO:00109519 | Breast | Precancer | negative regulation of endopeptidase activity | 37/1080 | 252/18723 | 1.55e-07 | 8.05e-06 | 37 |
| GO:00421769 | Breast | Precancer | regulation of protein catabolic process | 47/1080 | 391/18723 | 1.50e-06 | 5.58e-05 | 47 |
| GO:00313309 | Breast | Precancer | negative regulation of cellular catabolic process | 34/1080 | 262/18723 | 8.16e-06 | 2.20e-04 | 34 |
| GO:00098959 | Breast | Precancer | negative regulation of catabolic process | 36/1080 | 320/18723 | 9.92e-05 | 1.83e-03 | 36 |
| GO:00224119 | Breast | Precancer | cellular component disassembly | 44/1080 | 443/18723 | 3.17e-04 | 4.51e-03 | 44 |
| GO:00421779 | Breast | Precancer | negative regulation of protein catabolic process | 17/1080 | 121/18723 | 5.76e-04 | 7.28e-03 | 17 |
| GO:005254714 | Breast | IDC | regulation of peptidase activity | 96/1434 | 461/18723 | 7.58e-20 | 6.15e-17 | 96 |
| GO:005254814 | Breast | IDC | regulation of endopeptidase activity | 88/1434 | 432/18723 | 1.20e-17 | 4.85e-15 | 88 |
| GO:004586114 | Breast | IDC | negative regulation of proteolysis | 70/1434 | 351/18723 | 8.21e-14 | 2.22e-11 | 70 |
| GO:005134613 | Breast | IDC | negative regulation of hydrolase activity | 71/1434 | 379/18723 | 1.33e-12 | 2.90e-10 | 71 |
| GO:001046613 | Breast | IDC | negative regulation of peptidase activity | 56/1434 | 262/18723 | 1.39e-12 | 2.92e-10 | 56 |
| GO:001095112 | Breast | IDC | negative regulation of endopeptidase activity | 52/1434 | 252/18723 | 3.53e-11 | 5.57e-09 | 52 |
| GO:004217614 | Breast | IDC | regulation of protein catabolic process | 63/1434 | 391/18723 | 1.32e-08 | 9.61e-07 | 63 |
| GO:003133014 | Breast | IDC | negative regulation of cellular catabolic process | 37/1434 | 262/18723 | 2.20e-04 | 3.52e-03 | 37 |
| GO:004217714 | Breast | IDC | negative regulation of protein catabolic process | 20/1434 | 121/18723 | 8.51e-04 | 9.92e-03 | 20 |
| Page: 1 2 3 4 5 6 7 8 9 10 11 12 13 14 15 16 17 18 19 20 21 |
| Pathway ID | Tissue | Disease Stage | Description | Gene Ratio | Bg Ratio | pvalue | p.adjust | qvalue | Count |
| hsa049704 | Breast | IDC | Salivary secretion | 18/867 | 93/8465 | 5.69e-03 | 3.13e-02 | 2.34e-02 | 18 |
| hsa0497011 | Breast | IDC | Salivary secretion | 18/867 | 93/8465 | 5.69e-03 | 3.13e-02 | 2.34e-02 | 18 |
| hsa04970 | Colorectum | FAP | Salivary secretion | 24/1404 | 93/8465 | 1.52e-02 | 4.99e-02 | 3.03e-02 | 24 |
| hsa049701 | Colorectum | FAP | Salivary secretion | 24/1404 | 93/8465 | 1.52e-02 | 4.99e-02 | 3.03e-02 | 24 |
| hsa049702 | Colorectum | CRC | Salivary secretion | 22/1091 | 93/8465 | 3.03e-03 | 1.91e-02 | 1.29e-02 | 22 |
| hsa049703 | Colorectum | CRC | Salivary secretion | 22/1091 | 93/8465 | 3.03e-03 | 1.91e-02 | 1.29e-02 | 22 |
| Page: 1 |
Top |
Cell-cell communication analysis |
| Identification of potential cell-cell interactions between two cell types and their ligand-receptor pairs for different disease states |
| Ligand | Receptor | LRpair | Pathway | Tissue | Disease Stage |
| Page: 1 |
Top |
Single-cell gene regulatory network inference analysis |
| Find out the significant the regulons (TFs) and the target genes of each regulon across cell types for different disease states |
| TF | Cell Type | Tissue | Disease Stage | Target Gene | RSS | Regulon Activity |
| ∗The dot plots of a searched regulon are shown for all cell subpopulations in each disease state of each tissue based on the regulon specific score inferred using pySCENIC and by calculating the average expression. |
| Page: 1 |
Top |
Somatic mutation of malignant transformation related genes |
| Annotation of somatic variants for genes involved in malignant transformation |
| Hugo Symbol | Variant Class | Variant Classification | dbSNP RS | HGVSc | HGVSp | HGVSp Short | SWISSPROT | BIOTYPE | SIFT | PolyPhen | Tumor Sample Barcode | Tissue | Histology | Sex | Age | Stage | Therapy Types | Drugs | Outcome |
| CST3 | SNV | Missense_Mutation | rs759445850 | c.416N>T | p.Ser139Leu | p.S139L | P01034 | protein_coding | tolerated(0.36) | benign(0.001) | TCGA-A8-A06O-01 | Breast | breast invasive carcinoma | Female | <65 | I/II | Hormone Therapy | letrozole | SD |
| CST3 | SNV | Missense_Mutation | novel | c.267N>A | p.Phe89Leu | p.F89L | P01034 | protein_coding | tolerated(0.17) | benign(0.187) | TCGA-AN-A046-01 | Breast | breast invasive carcinoma | Female | >=65 | I/II | Unknown | Unknown | SD |
| CST3 | SNV | Missense_Mutation | c.169N>T | p.Val57Phe | p.V57F | P01034 | protein_coding | deleterious(0.01) | probably_damaging(0.988) | TCGA-CK-4951-01 | Colorectum | colon adenocarcinoma | Female | >=65 | I/II | Unknown | Unknown | PD | |
| CST3 | SNV | Missense_Mutation | c.399N>T | p.Gln133His | p.Q133H | P01034 | protein_coding | tolerated(0.13) | benign(0.407) | TCGA-AP-A051-01 | Endometrium | uterine corpus endometrioid carcinoma | Female | >=65 | I/II | Unknown | Unknown | SD | |
| CST3 | SNV | Missense_Mutation | c.287N>A | p.Arg96Gln | p.R96Q | P01034 | protein_coding | deleterious(0.04) | probably_damaging(0.934) | TCGA-AX-A0J0-01 | Endometrium | uterine corpus endometrioid carcinoma | Female | <65 | I/II | Unknown | Unknown | SD | |
| CST3 | SNV | Missense_Mutation | novel | c.364N>A | p.Phe122Ile | p.F122I | P01034 | protein_coding | tolerated(0.12) | benign(0.043) | TCGA-EY-A547-01 | Endometrium | uterine corpus endometrioid carcinoma | Female | >=65 | I/II | Unknown | Unknown | SD |
| CST3 | SNV | Missense_Mutation | c.359A>T | p.Lys120Ile | p.K120I | P01034 | protein_coding | deleterious(0.01) | possibly_damaging(0.626) | TCGA-97-7554-01 | Lung | lung adenocarcinoma | Female | >=65 | III/IV | Chemotherapy | alimta | SD | |
| CST3 | SNV | Missense_Mutation | novel | c.385N>T | p.Ala129Ser | p.A129S | P01034 | protein_coding | tolerated(0.78) | benign(0.011) | TCGA-58-A46M-01 | Lung | lung squamous cell carcinoma | Male | <65 | I/II | Unknown | Unknown | SD |
| CST3 | SNV | Missense_Mutation | novel | c.326N>A | p.Cys109Tyr | p.C109Y | P01034 | protein_coding | deleterious(0) | probably_damaging(1) | TCGA-P3-A5QF-01 | Oral cavity | head & neck squamous cell carcinoma | Male | <65 | I/II | Chemotherapy | cetuximab | PD |
| Page: 1 |
Top |
Related drugs of malignant transformation related genes |
| Identification of chemicals and drugs interact with genes involved in malignant transfromation |
| (DGIdb 4.0) |
| Entrez ID | Symbol | Category | Interaction Types | Drug Claim Name | Drug Name | PMIDs |
| 1471 | CST3 | ENZYME, DRUGGABLE GENOME, PROTEASE INHIBITOR | DIGOXIN | DIGOXIN | 17698593 | |
| 1471 | CST3 | ENZYME, DRUGGABLE GENOME, PROTEASE INHIBITOR | RIBAVIRIN | RIBAVIRIN | 18637076 |
| Page: 1 |

Copyright 2023-Present -The University of Texas Health Science Center at Houston |