
|
|||||
|
 | |
| |
| |
| |
| |
| |
|
Gene: SSFA2 |
Gene summary for SSFA2 |
| Gene information | Species | Human | Gene symbol | SSFA2 | Gene ID | 6744 |
| Gene name | ITPR interacting domain containing 2 | |
| Gene Alias | CS-1 | |
| Cytomap | 2q31.3 | |
| Gene Type | protein-coding | GO ID | GO:0005575 | UniProtAcc | P28290 |
Top |
Malignant transformation analysis |
| Identification of the aberrant gene expression in precancerous and cancerous lesions by comparing the gene expression of stem-like cells in diseased tissues with normal stem cells |
| Entrez ID | Symbol | Replicates | Species | Organ | Tissue | Adj P-value | Log2FC | Malignancy |
| 6744 | SSFA2 | Pat16-B | Human | Stomach | GC | 2.40e-16 | -5.26e-01 | 0.1918 |
| 6744 | SSFA2 | Pat17-B | Human | Stomach | GC | 2.76e-15 | -5.26e-01 | 0.3109 |
| 6744 | SSFA2 | Pat18-B | Human | Stomach | GC | 1.69e-09 | -5.26e-01 | -0.0432 |
| 6744 | SSFA2 | Pat19-B | Human | Stomach | GC | 1.34e-06 | -5.26e-01 | 0.0826 |
| 6744 | SSFA2 | Pat22-B | Human | Stomach | GC | 1.28e-08 | -5.26e-01 | -0.1042 |
| 6744 | SSFA2 | Pat24-B | Human | Stomach | GC | 7.56e-05 | -5.26e-01 | -0.1184 |
| 6744 | SSFA2 | Pat25-A | Human | Stomach | CAG with IM | 5.43e-16 | -5.26e-01 | -0.1648 |
| 6744 | SSFA2 | Pat26-A | Human | Stomach | CSG | 8.97e-18 | -5.26e-01 | -0.2402 |
| 6744 | SSFA2 | Pat28-A | Human | Stomach | CSG | 8.55e-05 | -5.26e-01 | -0.2594 |
| 6744 | SSFA2 | SIM_2 | Human | Stomach | SIM | 6.83e-05 | -3.48e-01 | 0.3139 |
| 6744 | SSFA2 | EGC | Human | Stomach | GC | 1.12e-03 | -3.95e-01 | 0.1683 |
| 6744 | SSFA2 | male-WTA | Human | Thyroid | PTC | 2.43e-03 | -3.10e-01 | 0.1037 |
| 6744 | SSFA2 | nodule-WTA | Human | Thyroid | goiters | 3.57e-04 | -3.10e-01 | 0.0534 |
| 6744 | SSFA2 | PTC01 | Human | Thyroid | PTC | 4.95e-14 | -2.66e-02 | 0.1899 |
| 6744 | SSFA2 | PTC03 | Human | Thyroid | PTC | 7.08e-10 | -2.51e-02 | 0.1784 |
| 6744 | SSFA2 | PTC04 | Human | Thyroid | PTC | 1.18e-23 | 1.88e-01 | 0.1927 |
| 6744 | SSFA2 | PTC05 | Human | Thyroid | PTC | 2.98e-13 | 3.98e-01 | 0.2065 |
| 6744 | SSFA2 | PTC06 | Human | Thyroid | PTC | 1.91e-19 | 6.03e-01 | 0.2057 |
| 6744 | SSFA2 | PTC07 | Human | Thyroid | PTC | 4.47e-30 | 5.17e-01 | 0.2044 |
| 6744 | SSFA2 | ATC08 | Human | Thyroid | ATC | 6.02e-03 | -1.62e-01 | 0.0541 |
| Page: 1 2 3 4 5 6 7 8 9 10 11 12 |
| Tissue | Expression Dynamics | Abbreviation |
| Breast |  | IDC: Invasive ductal carcinoma |
| DCIS: Ductal carcinoma in situ | ||
| Precancer(BRCA1-mut): Precancerous lesion from BRCA1 mutation carriers | ||
| Colorectum (GSE201348) | 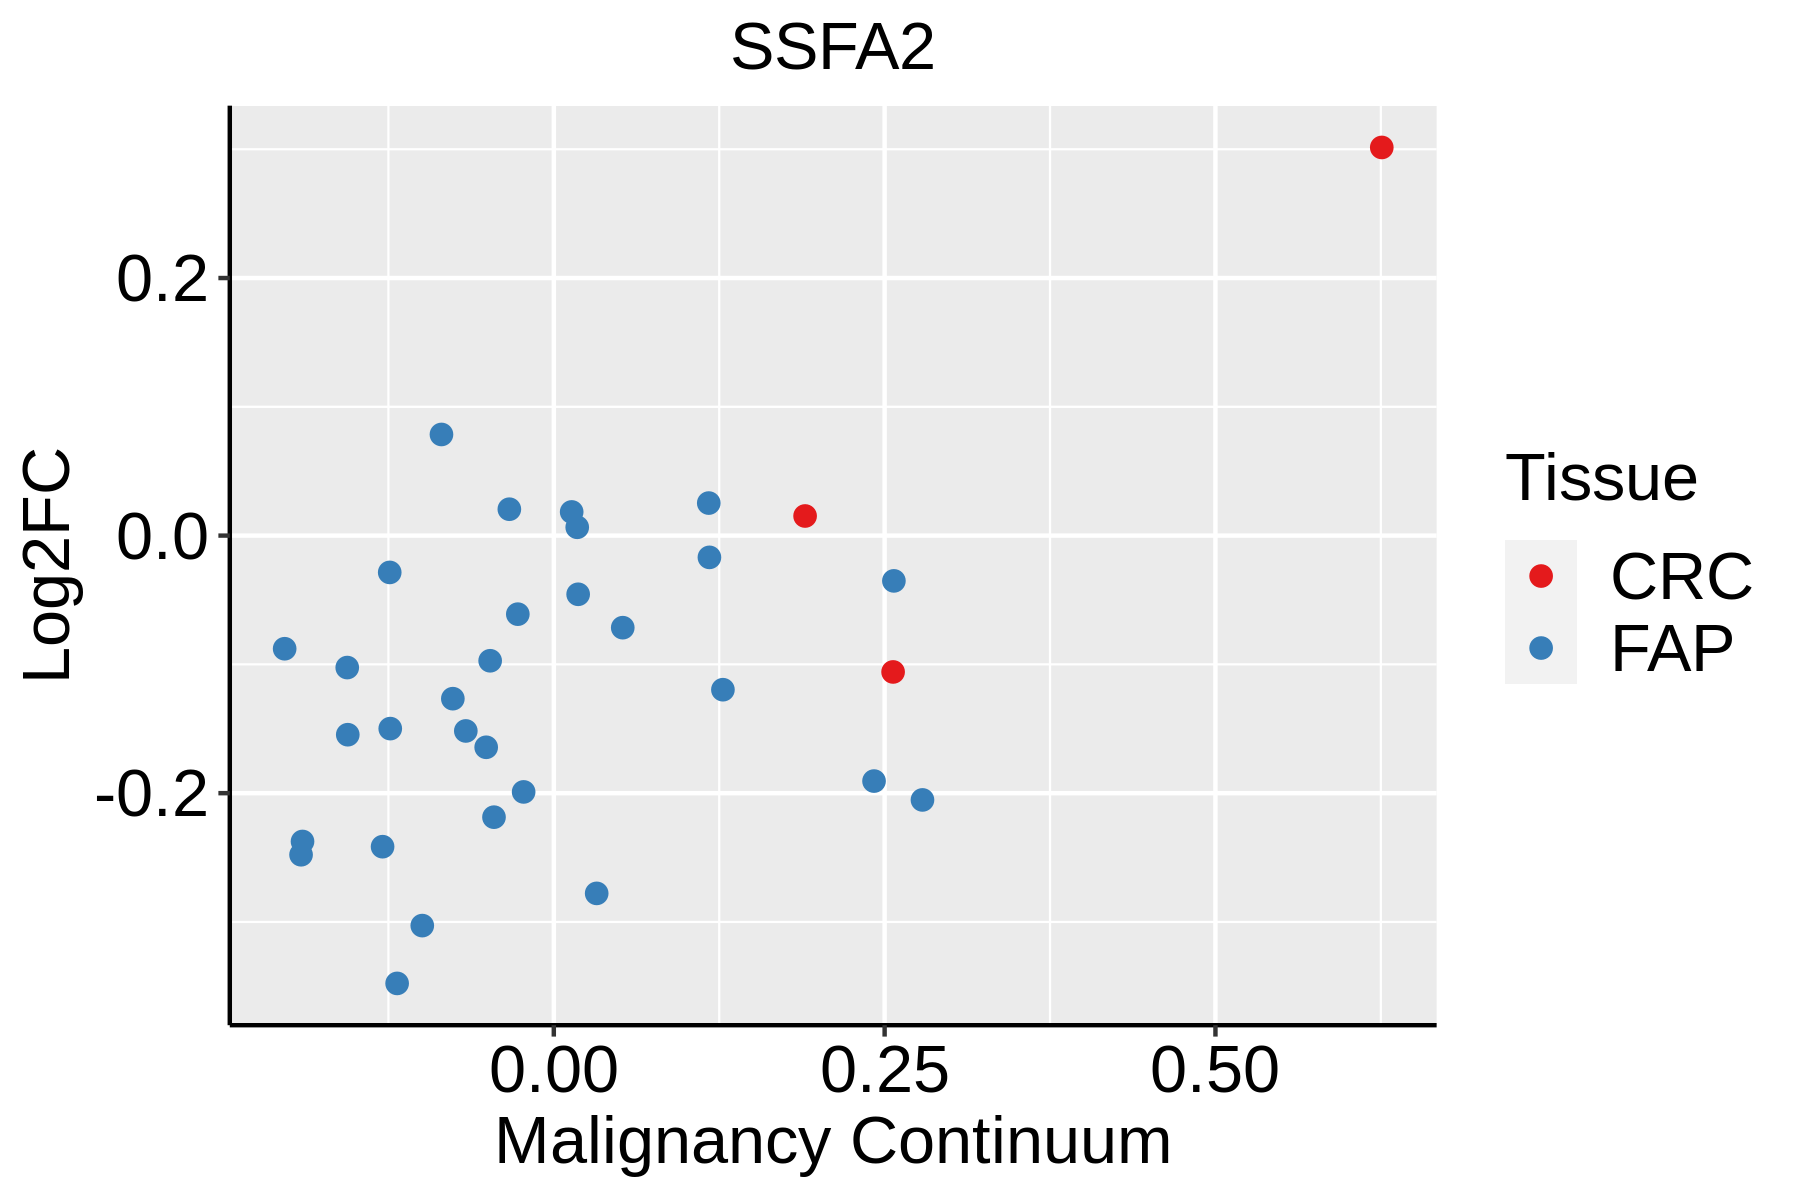 | FAP: Familial adenomatous polyposis |
| CRC: Colorectal cancer | ||
| Colorectum (HTA11) |  | AD: Adenomas |
| SER: Sessile serrated lesions | ||
| MSI-H: Microsatellite-high colorectal cancer | ||
| MSS: Microsatellite stable colorectal cancer | ||
| Esophagus | 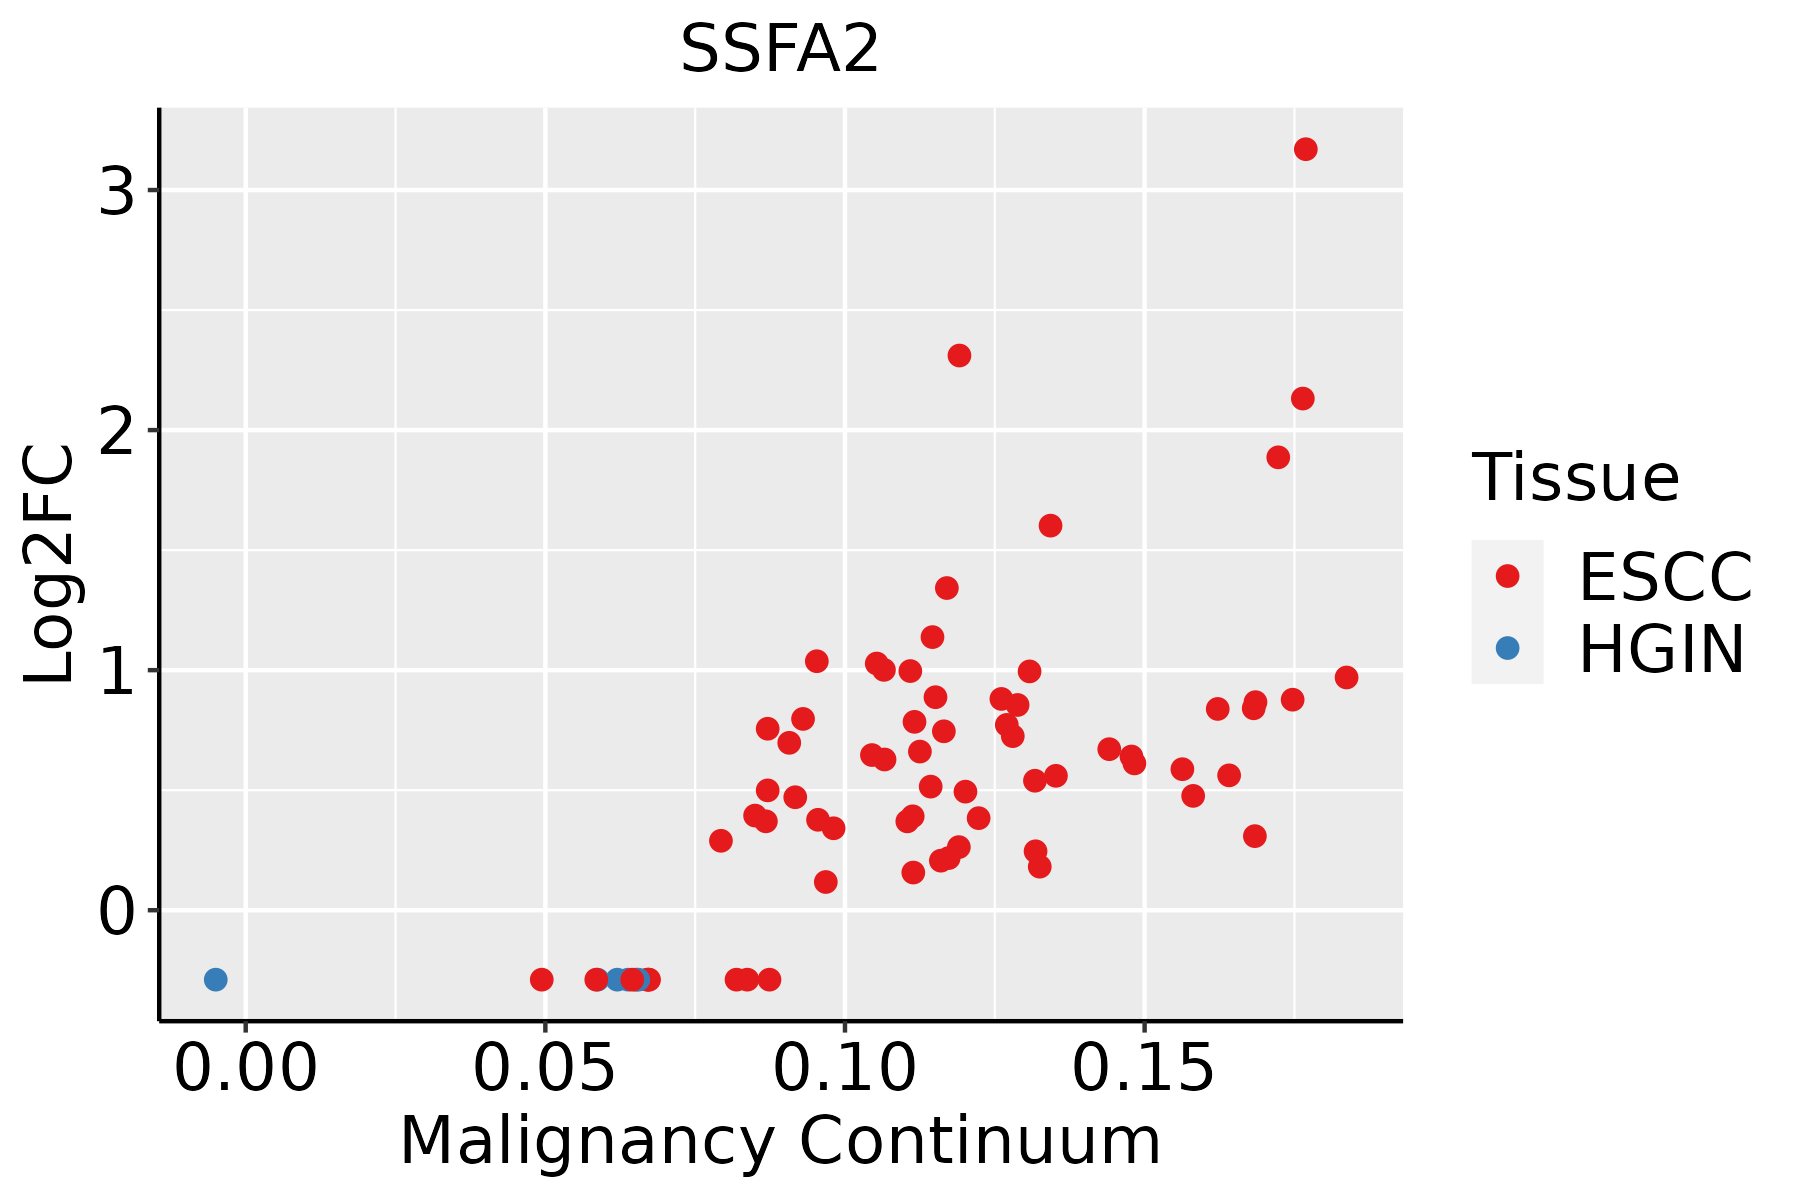 | ESCC: Esophageal squamous cell carcinoma |
| HGIN: High-grade intraepithelial neoplasias | ||
| LGIN: Low-grade intraepithelial neoplasias | ||
| GC | 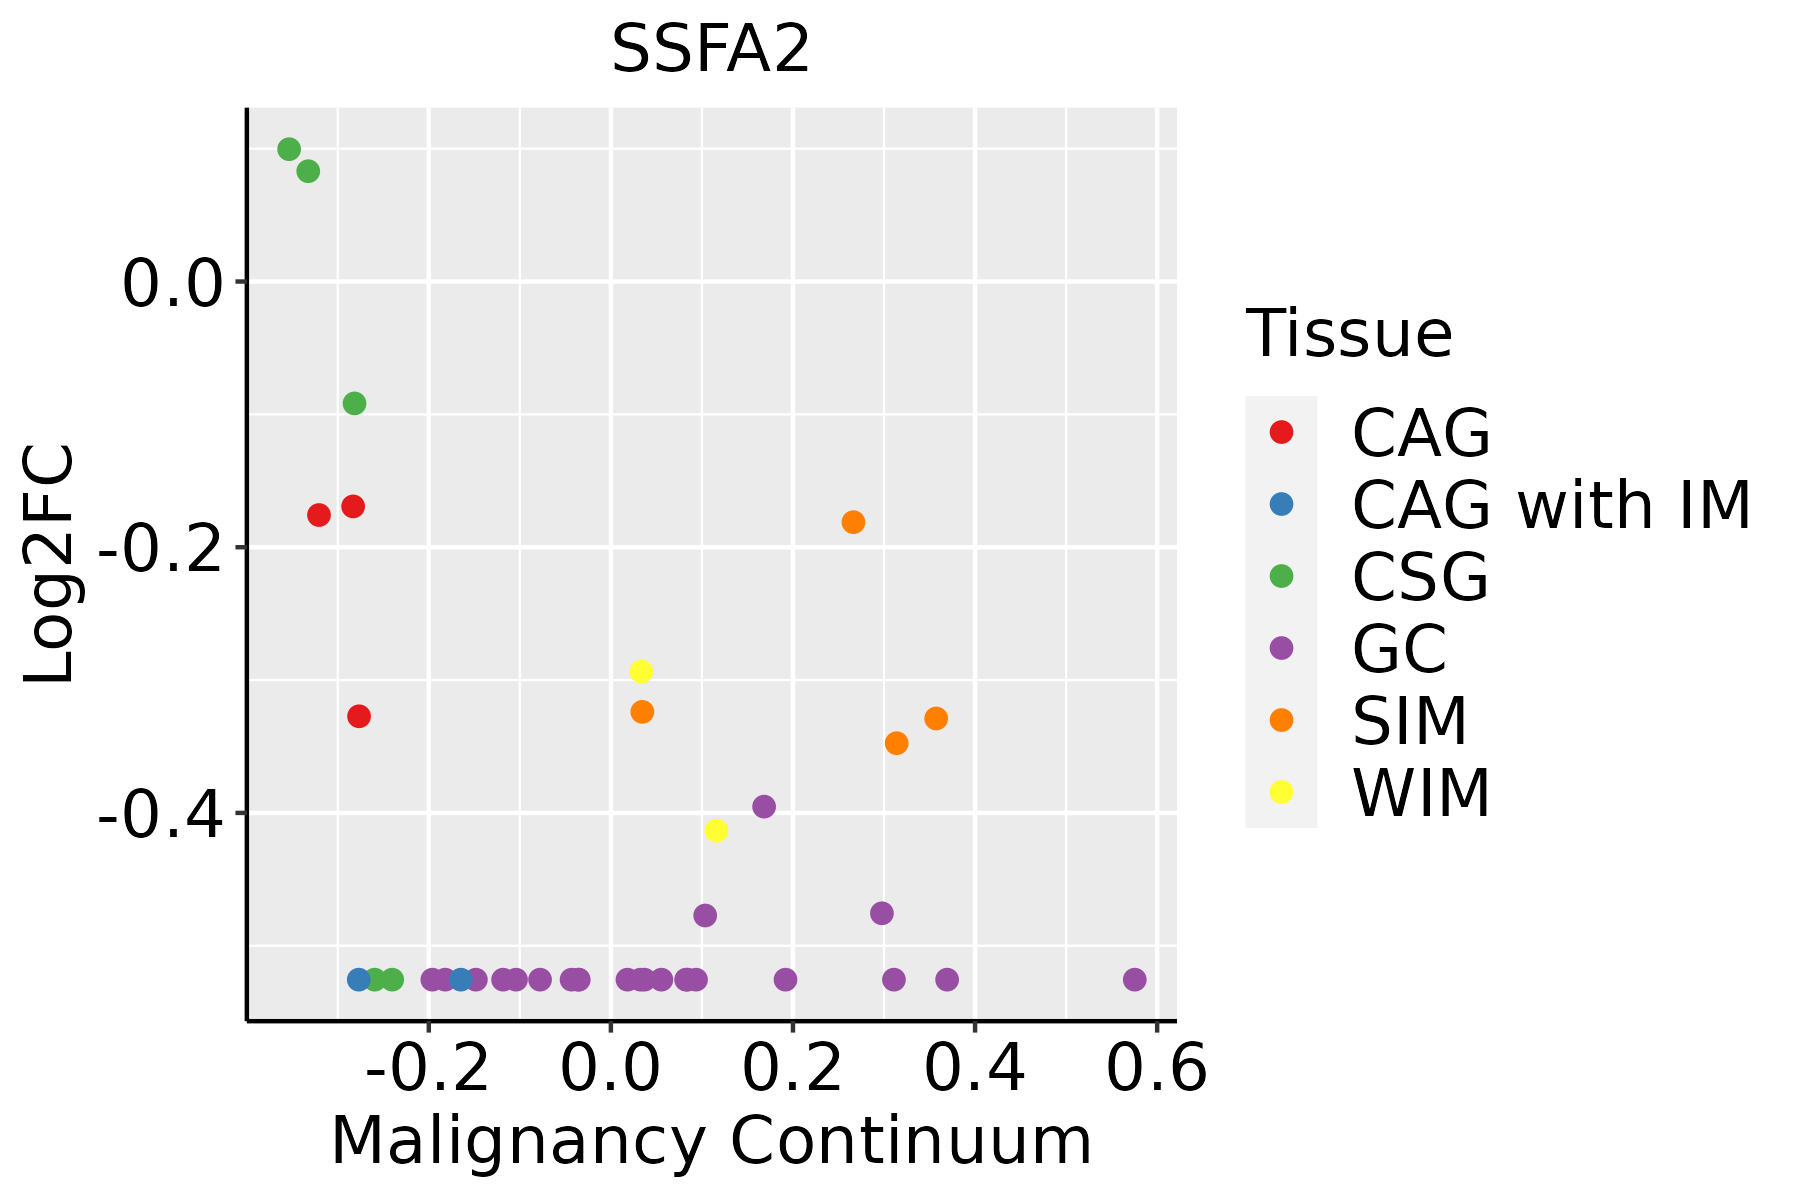 | CAG: Chronic atrophic gastritis |
| CAG with IM: Chronic atrophic gastritis with intestinal metaplasia | ||
| CSG: Chronic superficial gastritis | ||
| GC: Gastric cancer | ||
| SIM: Severe intestinal metaplasia | ||
| WIM: Wild intestinal metaplasia | ||
| Liver |  | HCC: Hepatocellular carcinoma |
| NAFLD: Non-alcoholic fatty liver disease | ||
| Oral Cavity | 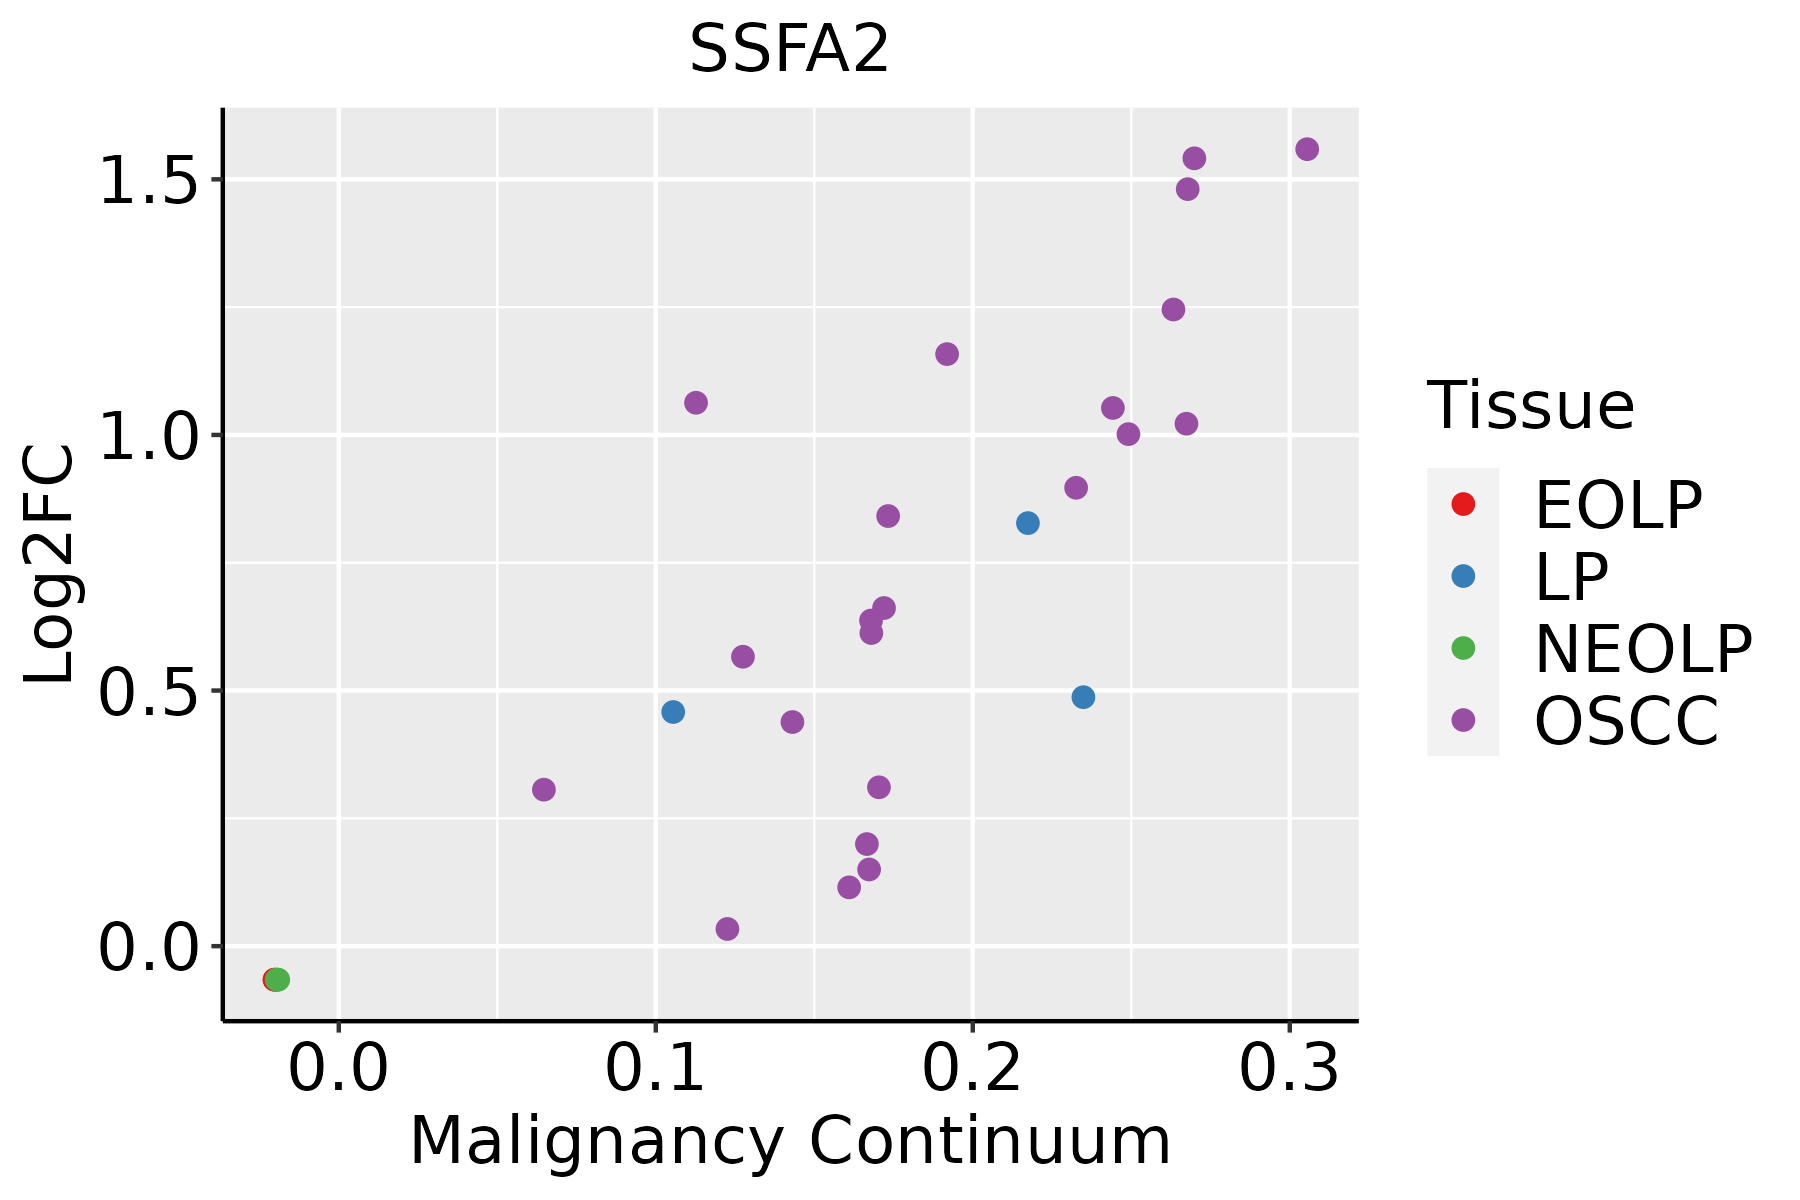 | EOLP: Erosive Oral lichen planus |
| LP: leukoplakia | ||
| NEOLP: Non-erosive oral lichen planus | ||
| OSCC: Oral squamous cell carcinoma | ||
| Prostate | 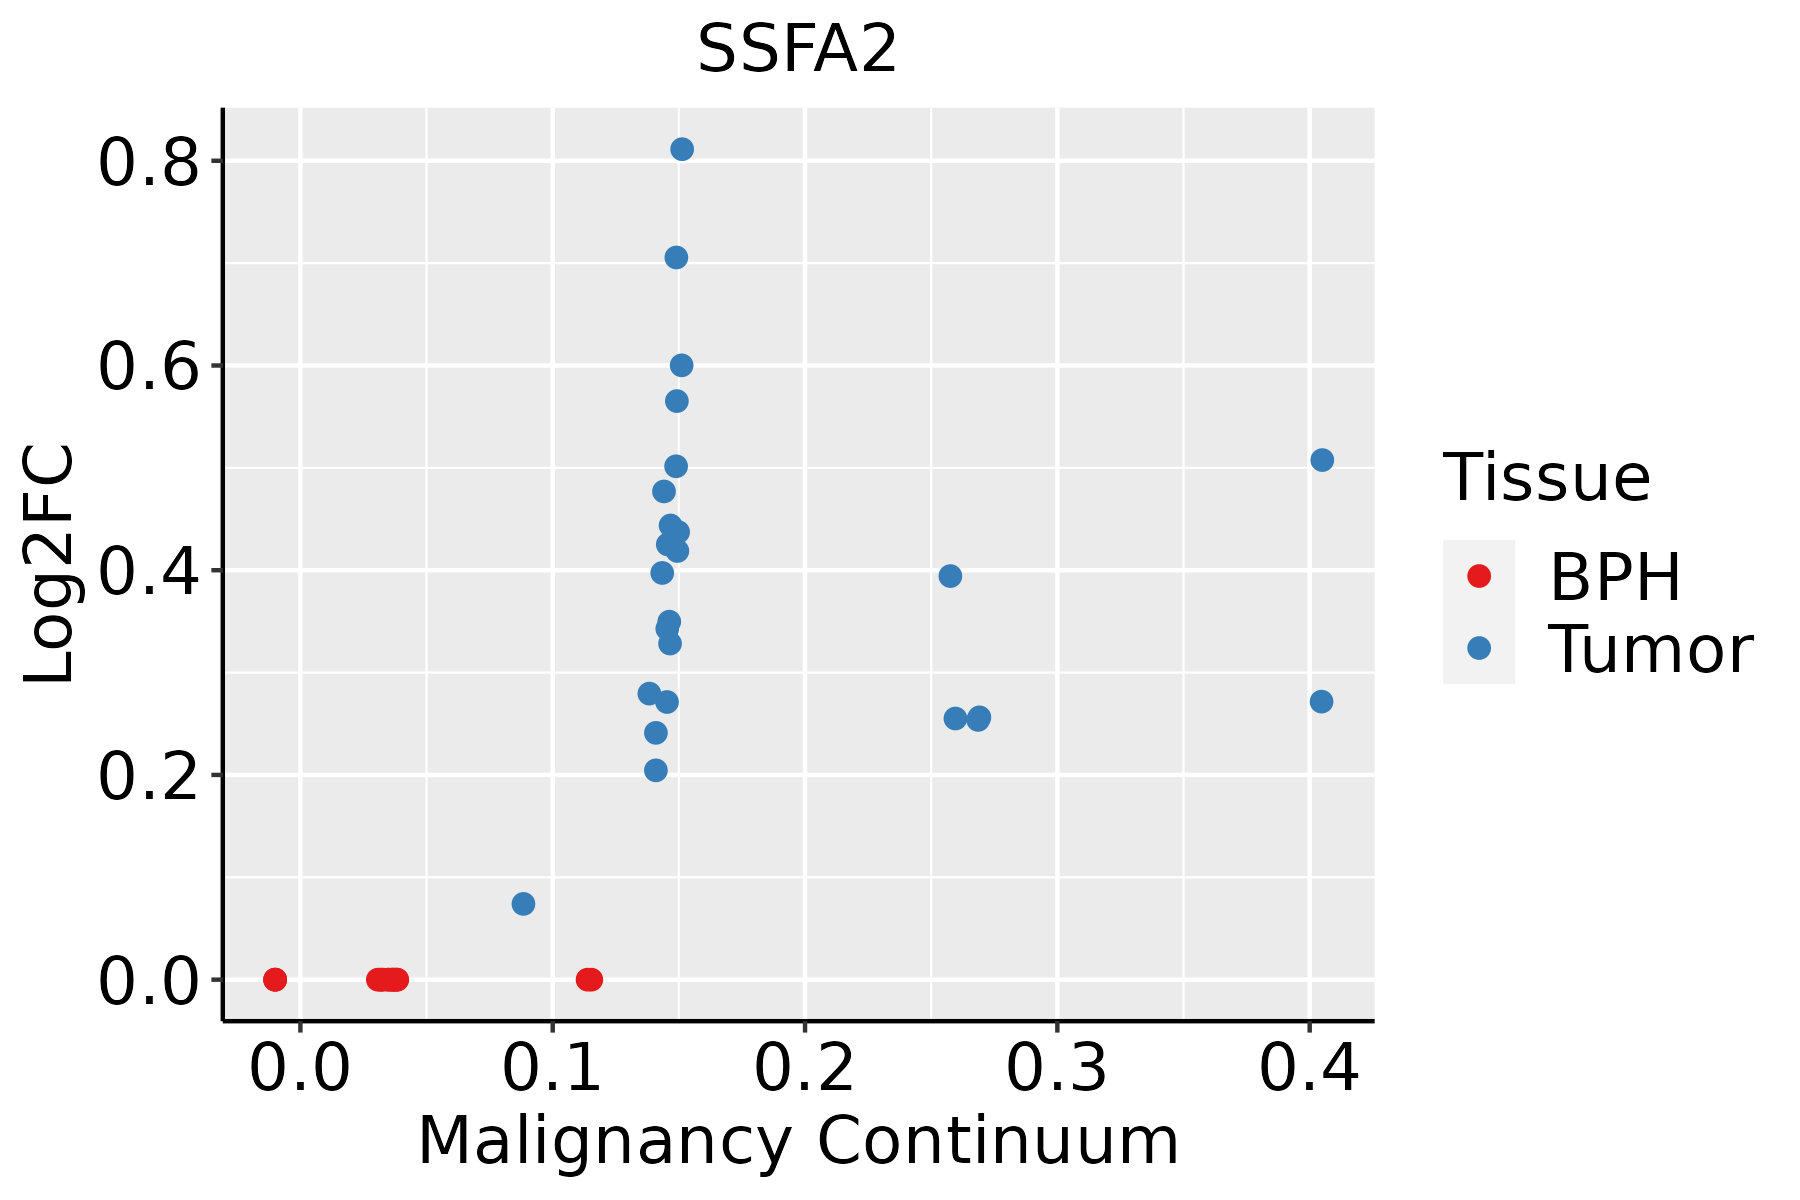 | BPH: Benign Prostatic Hyperplasia |
| Skin | 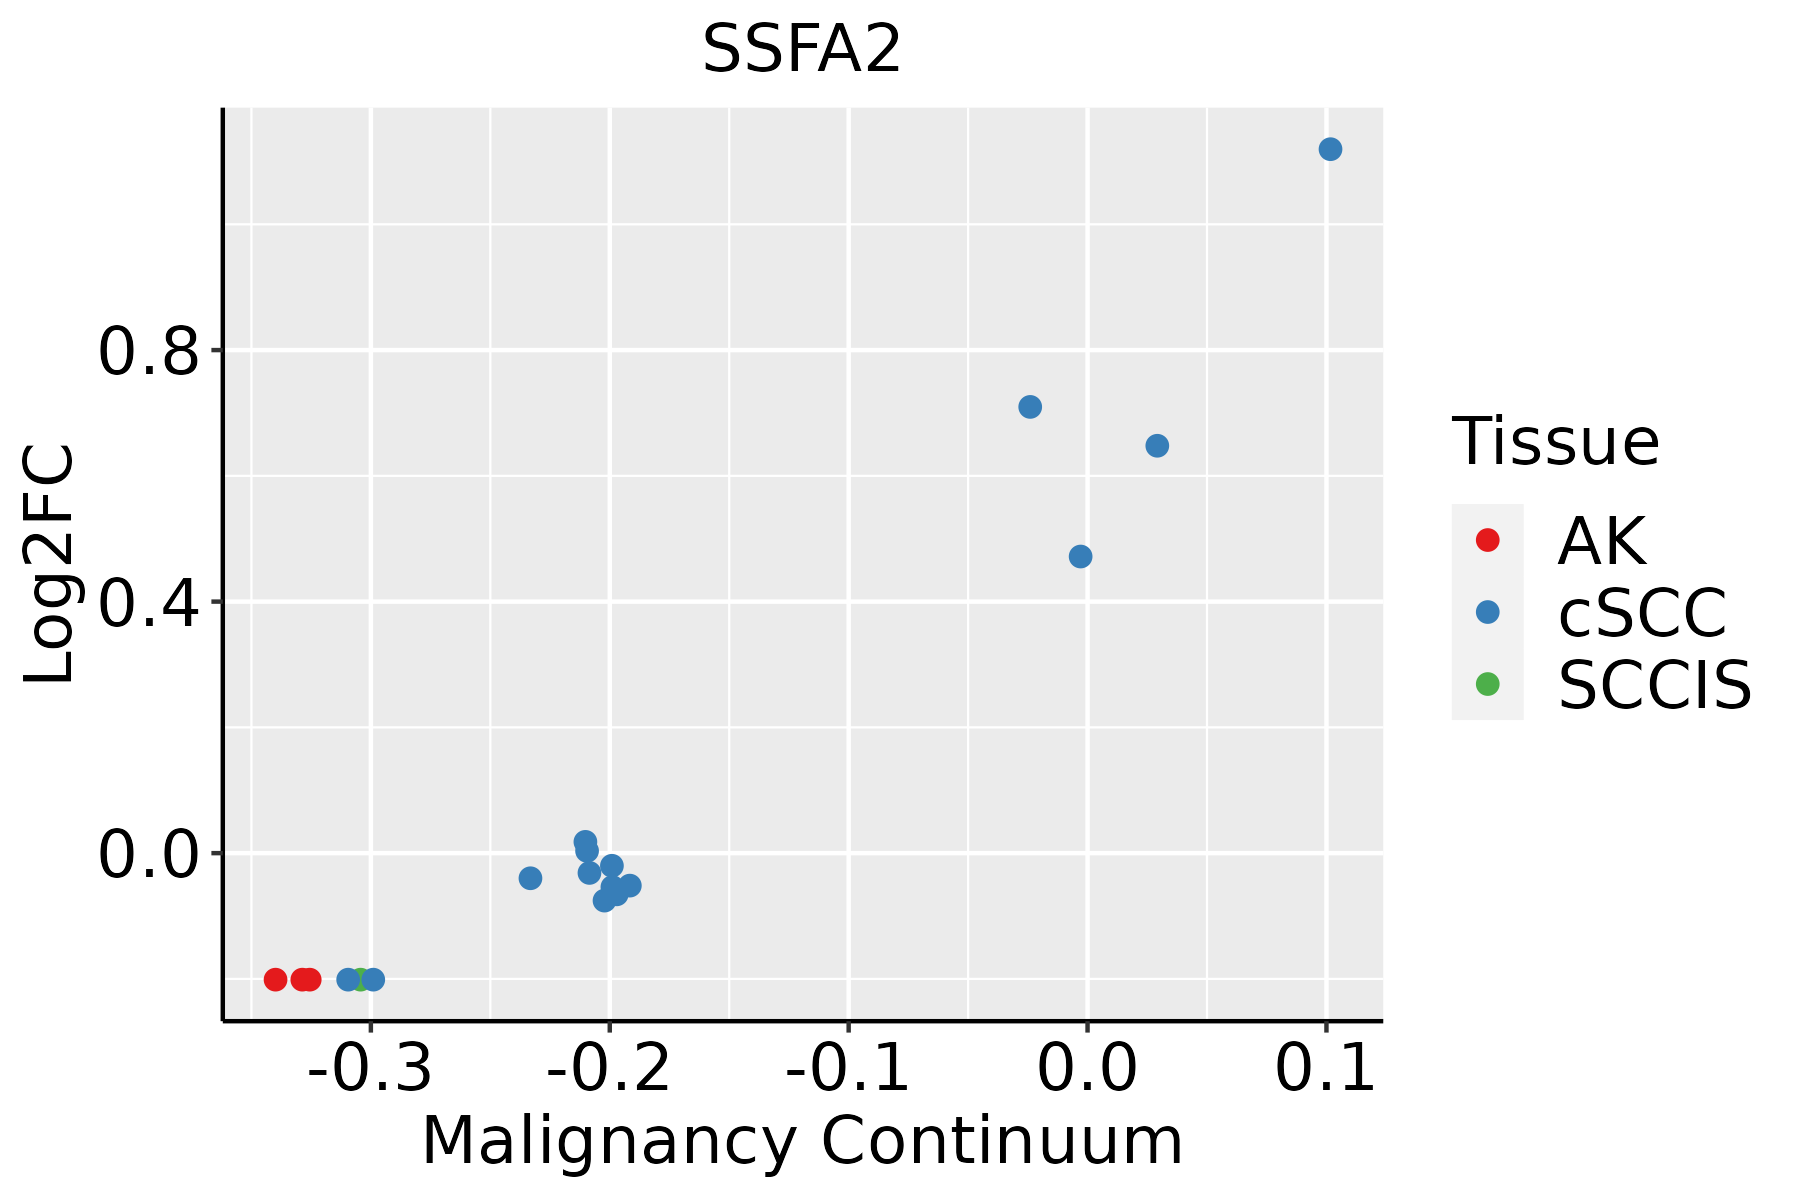 | AK: Actinic keratosis |
| cSCC: Cutaneous squamous cell carcinoma | ||
| SCCIS:squamous cell carcinoma in situ | ||
| Thyroid | 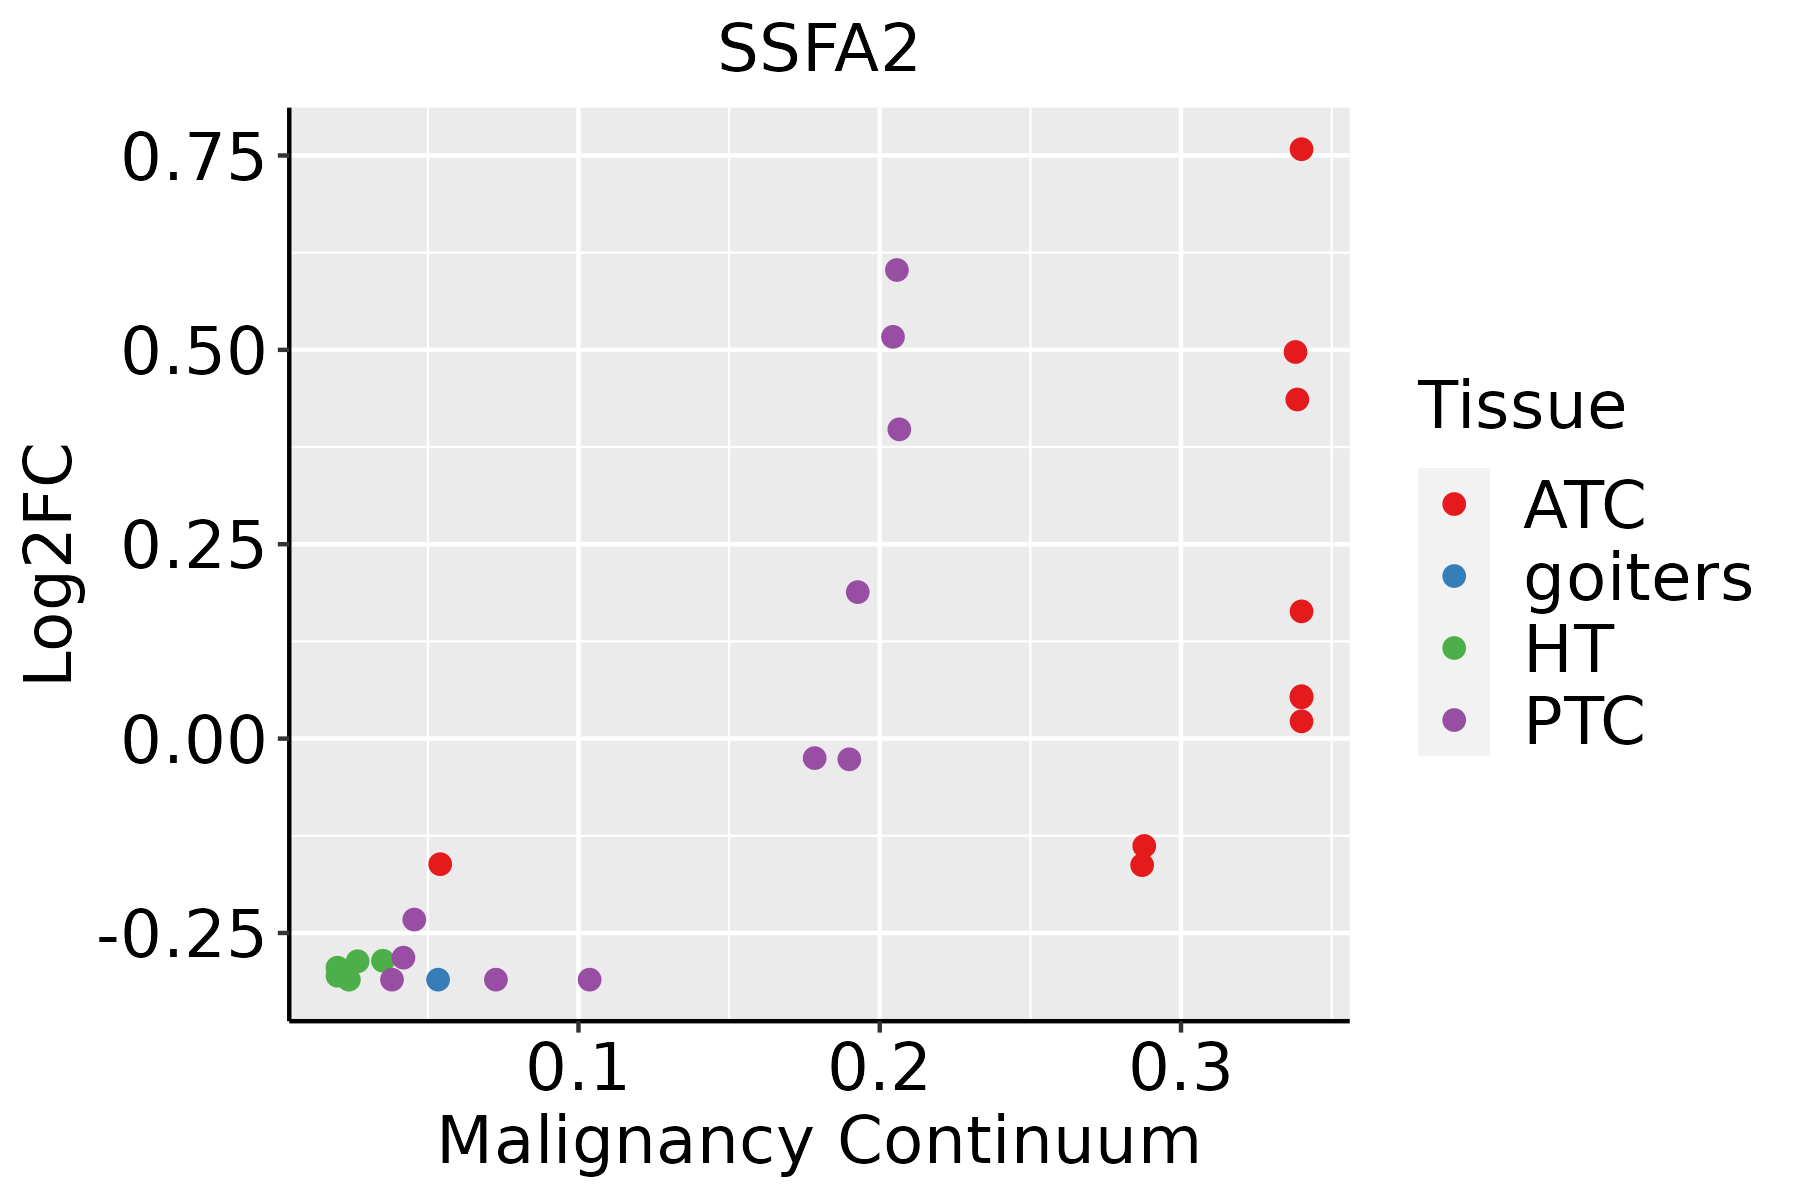 | ATC: Anaplastic thyroid cancer |
| HT: Hashimoto's thyroiditis | ||
| PTC: Papillary thyroid cancer |
| ∗log2FC in expression of this searched gene in stem-like cells from each diseased tissue sample relative to stem-like cells in normal samples in each tissue plotted against the malignancy continuum. Samples are colored based on if they are from different disease stage. |
Top |
Malignant transformation related pathway analysis |
| Find out the enriched GO biological processes and KEGG pathways involved in transition from healthy to precancer to cancer |
| Tissue | Disease Stage | Enriched GO biological Processes |
| Colorectum | AD |  |
| Colorectum | SER |  |
| Colorectum | MSS |  |
| Colorectum | MSI-H |  |
| Colorectum | FAP |  |
| ∗Top 15 enriched GO BP terms are showed in the bar plot of each disease state in each tissue. Each row represents a significant GO biological process which is colored according to the -log10(p.adjust). |
| Page: 1 2 3 4 5 6 7 8 9 |
| GO ID | Tissue | Disease Stage | Description | Gene Ratio | Bg Ratio | pvalue | p.adjust | Count |
| Page: 1 |
| Pathway ID | Tissue | Disease Stage | Description | Gene Ratio | Bg Ratio | pvalue | p.adjust | qvalue | Count |
| Page: 1 |
Top |
Cell-cell communication analysis |
| Identification of potential cell-cell interactions between two cell types and their ligand-receptor pairs for different disease states |
| Ligand | Receptor | LRpair | Pathway | Tissue | Disease Stage |
| Page: 1 |
Top |
Single-cell gene regulatory network inference analysis |
| Find out the significant the regulons (TFs) and the target genes of each regulon across cell types for different disease states |
| TF | Cell Type | Tissue | Disease Stage | Target Gene | RSS | Regulon Activity |
| ∗The dot plots of a searched regulon are shown for all cell subpopulations in each disease state of each tissue based on the regulon specific score inferred using pySCENIC and by calculating the average expression. |
| Page: 1 |
Top |
Somatic mutation of malignant transformation related genes |
| Annotation of somatic variants for genes involved in malignant transformation |
| Hugo Symbol | Variant Class | Variant Classification | dbSNP RS | HGVSc | HGVSp | HGVSp Short | SWISSPROT | BIOTYPE | SIFT | PolyPhen | Tumor Sample Barcode | Tissue | Histology | Sex | Age | Stage | Therapy Types | Drugs | Outcome |
| SSFA2 | SNV | Missense_Mutation | c.3652N>A | p.Glu1218Lys | p.E1218K | P28290 | protein_coding | deleterious(0.01) | probably_damaging(0.994) | TCGA-A2-A0CX-01 | Breast | breast invasive carcinoma | Female | <65 | I/II | Chemotherapy | adriamycin | SD | |
| SSFA2 | SNV | Missense_Mutation | c.558N>G | p.Asn186Lys | p.N186K | P28290 | protein_coding | deleterious(0) | probably_damaging(0.983) | TCGA-A2-A1FV-01 | Breast | breast invasive carcinoma | Female | >=65 | I/II | Chemotherapy | cyclophosphamide | SD | |
| SSFA2 | SNV | Missense_Mutation | c.839N>A | p.Thr280Lys | p.T280K | P28290 | protein_coding | tolerated(0.07) | benign(0.202) | TCGA-A2-A25B-01 | Breast | breast invasive carcinoma | Female | <65 | I/II | Chemotherapy | taxotere | PD | |
| SSFA2 | SNV | Missense_Mutation | c.2525N>G | p.Ser842Cys | p.S842C | P28290 | protein_coding | deleterious(0) | probably_damaging(0.999) | TCGA-AC-A23H-01 | Breast | breast invasive carcinoma | Female | >=65 | I/II | Unknown | Unknown | PD | |
| SSFA2 | SNV | Missense_Mutation | novel | c.2720N>T | p.Ser907Leu | p.S907L | P28290 | protein_coding | deleterious(0) | probably_damaging(0.996) | TCGA-AC-A3W6-01 | Breast | breast invasive carcinoma | Female | >=65 | III/IV | Unknown | Unknown | SD |
| SSFA2 | SNV | Missense_Mutation | novel | c.998N>C | p.Glu333Ala | p.E333A | P28290 | protein_coding | deleterious(0.01) | possibly_damaging(0.721) | TCGA-AN-A046-01 | Breast | breast invasive carcinoma | Female | >=65 | I/II | Unknown | Unknown | SD |
| SSFA2 | SNV | Missense_Mutation | c.618N>A | p.Asn206Lys | p.N206K | P28290 | protein_coding | deleterious(0) | possibly_damaging(0.725) | TCGA-AR-A24Q-01 | Breast | breast invasive carcinoma | Female | <65 | I/II | Chemotherapy | doxorubicin | SD | |
| SSFA2 | SNV | Missense_Mutation | novel | c.619N>C | p.Ser207Pro | p.S207P | P28290 | protein_coding | deleterious(0) | probably_damaging(0.974) | TCGA-AR-A24Q-01 | Breast | breast invasive carcinoma | Female | <65 | I/II | Chemotherapy | doxorubicin | SD |
| SSFA2 | SNV | Missense_Mutation | c.2587N>G | p.Arg863Gly | p.R863G | P28290 | protein_coding | deleterious(0.01) | probably_damaging(0.983) | TCGA-BH-A0DV-01 | Breast | breast invasive carcinoma | Female | <65 | III/IV | Chemotherapy | taxotere | CR | |
| SSFA2 | SNV | Missense_Mutation | c.2775N>T | p.Gln925His | p.Q925H | P28290 | protein_coding | tolerated(0.06) | probably_damaging(0.997) | TCGA-BH-A1FU-01 | Breast | breast invasive carcinoma | Female | <65 | I/II | Unknown | Unknown | PD |
| Page: 1 2 3 4 5 6 7 8 9 10 11 12 13 |
Top |
Related drugs of malignant transformation related genes |
| Identification of chemicals and drugs interact with genes involved in malignant transfromation |
| (DGIdb 4.0) |
| Entrez ID | Symbol | Category | Interaction Types | Drug Claim Name | Drug Name | PMIDs |
| Page: 1 |

Copyright 2023-Present -The University of Texas Health Science Center at Houston |