
|
|||||
|
 | |
| |
| |
| |
| |
| |
|
Gene: SPCS2 |
Gene summary for SPCS2 |
| Gene information | Species | Human | Gene symbol | SPCS2 | Gene ID | 9789 |
| Gene name | signal peptidase complex subunit 2 | |
| Gene Alias | SPCS2 | |
| Cytomap | 11q13.4 | |
| Gene Type | protein-coding | GO ID | GO:0006465 | UniProtAcc | Q15005 |
Top |
Malignant transformation analysis |
| Identification of the aberrant gene expression in precancerous and cancerous lesions by comparing the gene expression of stem-like cells in diseased tissues with normal stem cells |
| Entrez ID | Symbol | Replicates | Species | Organ | Tissue | Adj P-value | Log2FC | Malignancy |
| 9789 | SPCS2 | P4_S8_cSCC | Human | Skin | cSCC | 9.72e-10 | -6.16e-02 | -0.3095 |
| 9789 | SPCS2 | P5_S10_cSCC | Human | Skin | cSCC | 5.57e-12 | -9.83e-02 | -0.299 |
| 9789 | SPCS2 | P1_cSCC | Human | Skin | cSCC | 2.33e-40 | 1.39e+00 | 0.0292 |
| 9789 | SPCS2 | P2_cSCC | Human | Skin | cSCC | 2.10e-22 | 8.07e-01 | -0.024 |
| 9789 | SPCS2 | P4_cSCC | Human | Skin | cSCC | 4.96e-57 | 1.51e+00 | -0.00290000000000005 |
| 9789 | SPCS2 | P10_cSCC | Human | Skin | cSCC | 2.61e-69 | 2.13e+00 | 0.1017 |
| 9789 | SPCS2 | cSCC_p11 | Human | Skin | cSCC | 3.93e-05 | -3.21e-01 | -0.2102 |
| 9789 | SPCS2 | cSCC_p3 | Human | Skin | cSCC | 4.42e-07 | -5.25e-01 | -0.2085 |
| 9789 | SPCS2 | cSCC_p4 | Human | Skin | cSCC | 1.37e-06 | -2.59e-01 | -0.2022 |
| 9789 | SPCS2 | cSCC_p6 | Human | Skin | cSCC | 3.58e-03 | -3.74e-01 | -0.1989 |
| 9789 | SPCS2 | cSCC_p7 | Human | Skin | cSCC | 9.40e-08 | -5.56e-01 | -0.2332 |
| 9789 | SPCS2 | cSCC_p8 | Human | Skin | cSCC | 2.80e-10 | -2.47e-01 | -0.1971 |
| 9789 | SPCS2 | cSCC_p9 | Human | Skin | cSCC | 2.82e-09 | -2.43e-01 | -0.1991 |
| 9789 | SPCS2 | Pat01-B | Human | Stomach | GC | 1.93e-20 | 1.38e-01 | 0.5754 |
| 9789 | SPCS2 | Pat02-B | Human | Stomach | GC | 1.94e-63 | 5.66e-01 | 0.0368 |
| 9789 | SPCS2 | Pat03-B | Human | Stomach | GC | 3.61e-35 | 3.51e-01 | 0.3693 |
| 9789 | SPCS2 | Pat04-B | Human | Stomach | GC | 1.96e-45 | 6.44e-01 | -0.1483 |
| 9789 | SPCS2 | Pat05-B | Human | Stomach | GC | 1.45e-20 | 3.98e-01 | -0.0353 |
| 9789 | SPCS2 | Pat06-B | Human | Stomach | GC | 9.81e-61 | 4.98e-01 | -0.1961 |
| 9789 | SPCS2 | Pat07-B | Human | Stomach | GC | 1.54e-06 | 3.20e-01 | 0.0935 |
| Page: 1 2 3 4 5 6 7 8 9 10 11 12 13 14 |
| Tissue | Expression Dynamics | Abbreviation |
| Breast |  | IDC: Invasive ductal carcinoma |
| DCIS: Ductal carcinoma in situ | ||
| Precancer(BRCA1-mut): Precancerous lesion from BRCA1 mutation carriers | ||
| Cervix |  | CC: Cervix cancer |
| HSIL_HPV: HPV-infected high-grade squamous intraepithelial lesions | ||
| N_HPV: HPV-infected normal cervix | ||
| Colorectum (GSE201348) |  | FAP: Familial adenomatous polyposis |
| CRC: Colorectal cancer | ||
| Colorectum (HTA11) |  | AD: Adenomas |
| SER: Sessile serrated lesions | ||
| MSI-H: Microsatellite-high colorectal cancer | ||
| MSS: Microsatellite stable colorectal cancer | ||
| Endometrium |  | AEH: Atypical endometrial hyperplasia |
| EEC: Endometrioid Cancer | ||
| Esophagus |  | ESCC: Esophageal squamous cell carcinoma |
| HGIN: High-grade intraepithelial neoplasias | ||
| LGIN: Low-grade intraepithelial neoplasias | ||
| GC |  | CAG: Chronic atrophic gastritis |
| CAG with IM: Chronic atrophic gastritis with intestinal metaplasia | ||
| CSG: Chronic superficial gastritis | ||
| GC: Gastric cancer | ||
| SIM: Severe intestinal metaplasia | ||
| WIM: Wild intestinal metaplasia | ||
| Liver | 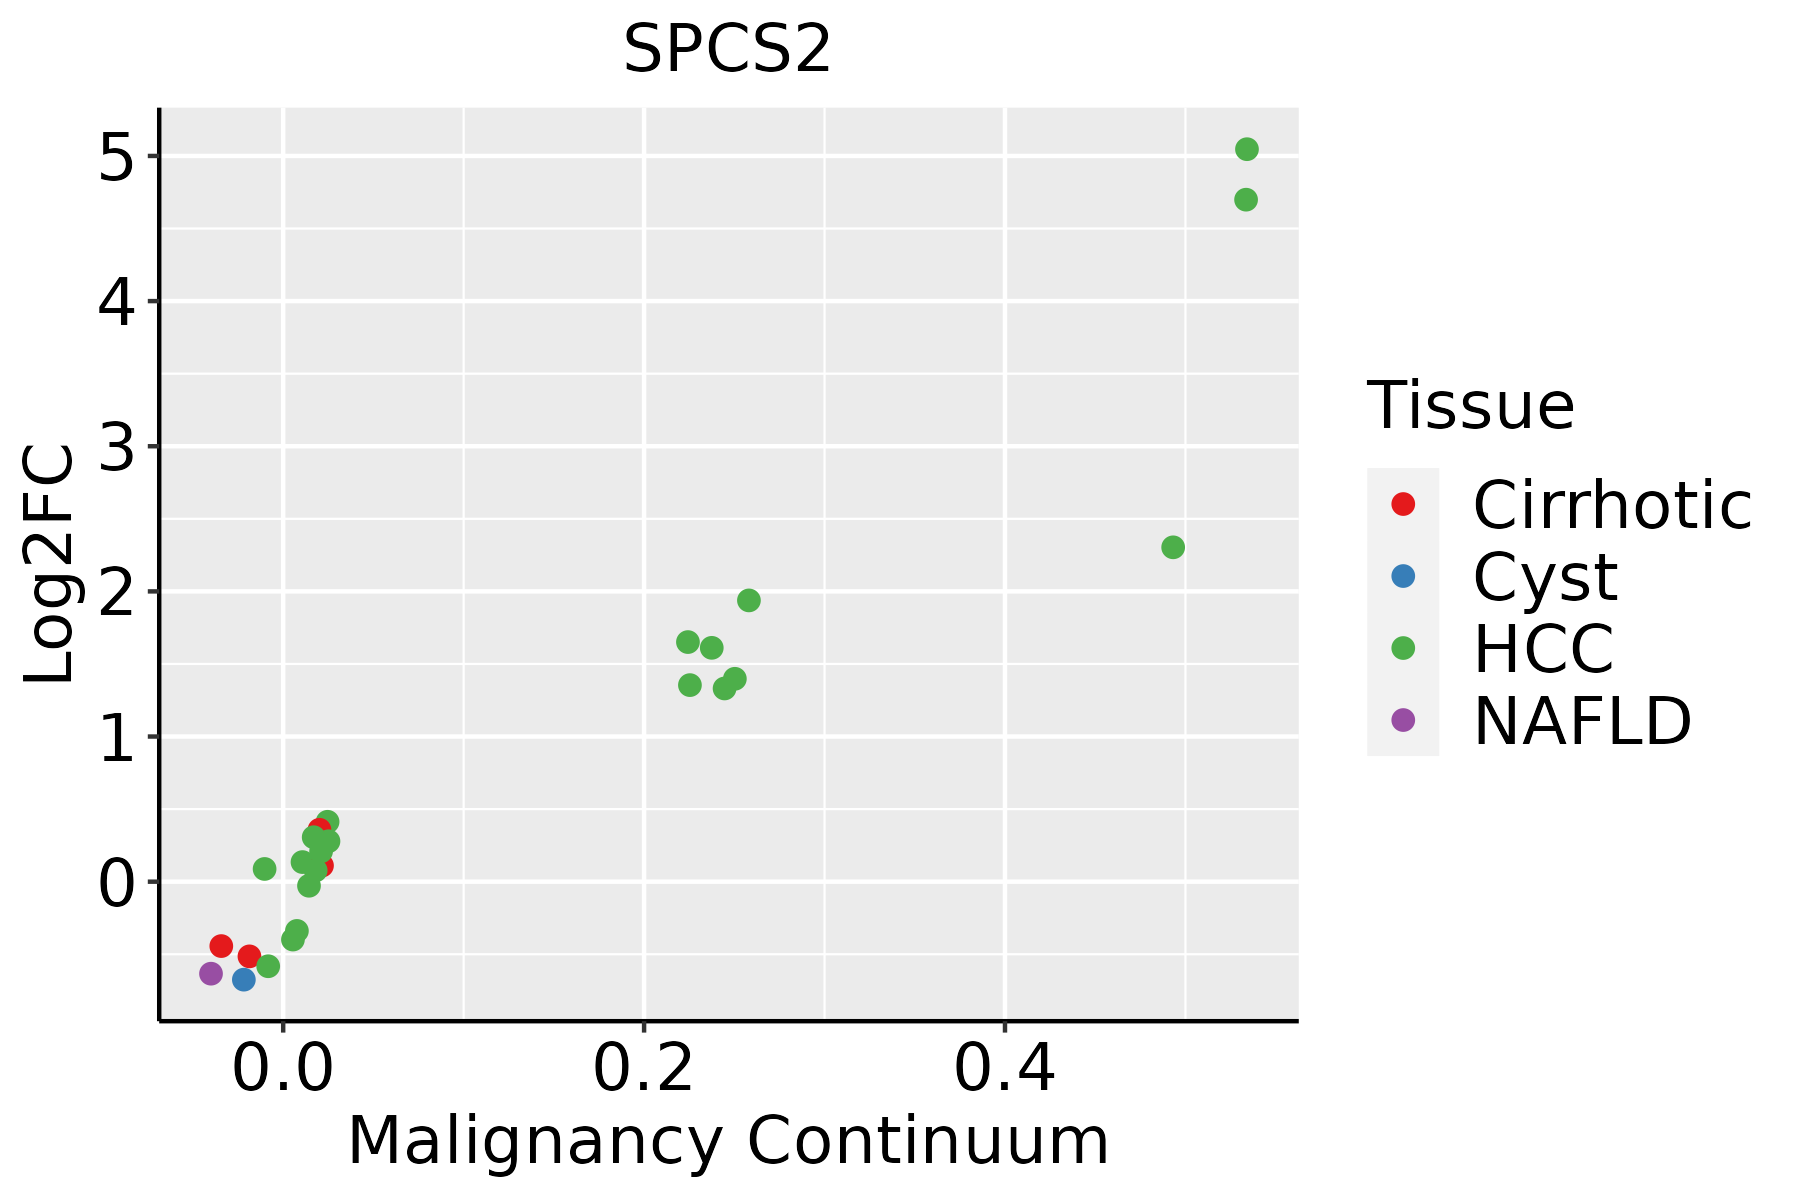 | HCC: Hepatocellular carcinoma |
| NAFLD: Non-alcoholic fatty liver disease | ||
| Oral Cavity | 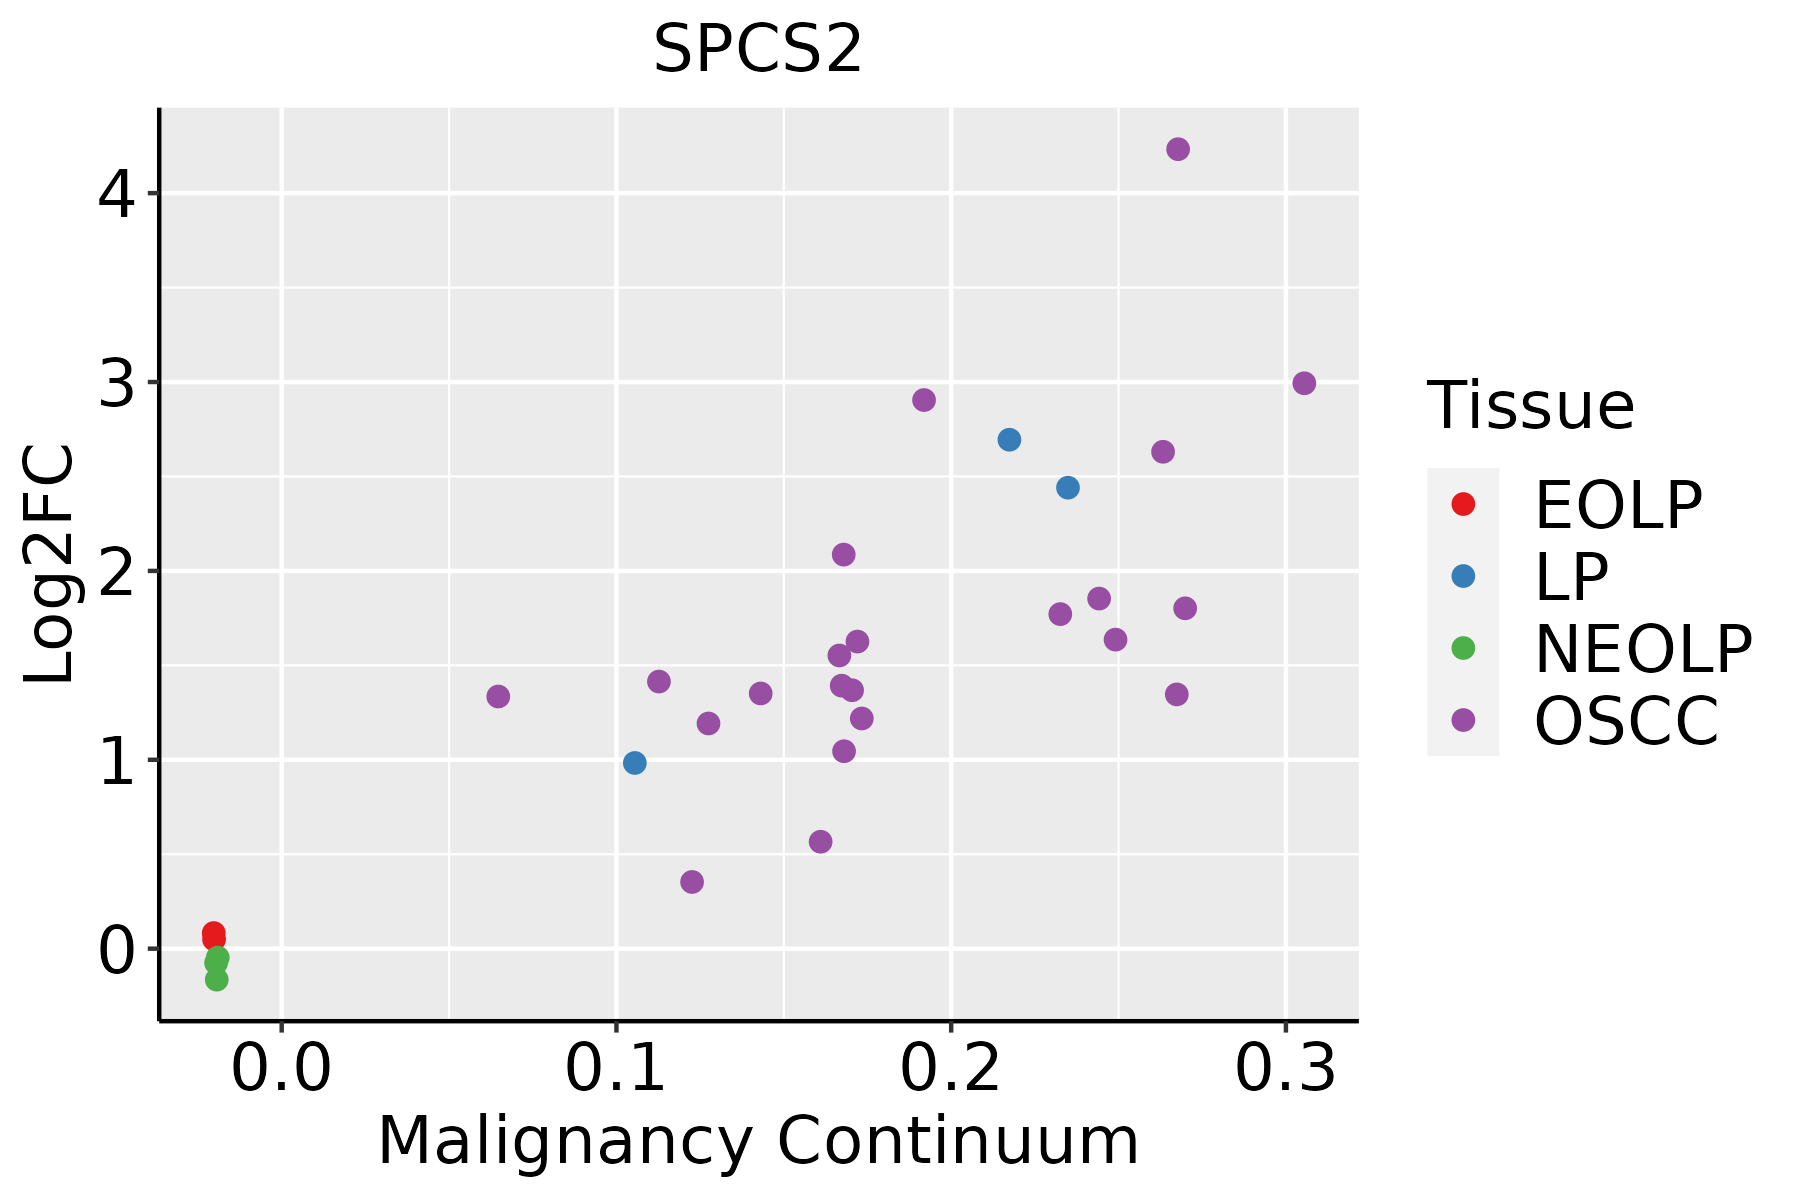 | EOLP: Erosive Oral lichen planus |
| LP: leukoplakia | ||
| NEOLP: Non-erosive oral lichen planus | ||
| OSCC: Oral squamous cell carcinoma | ||
| Prostate | 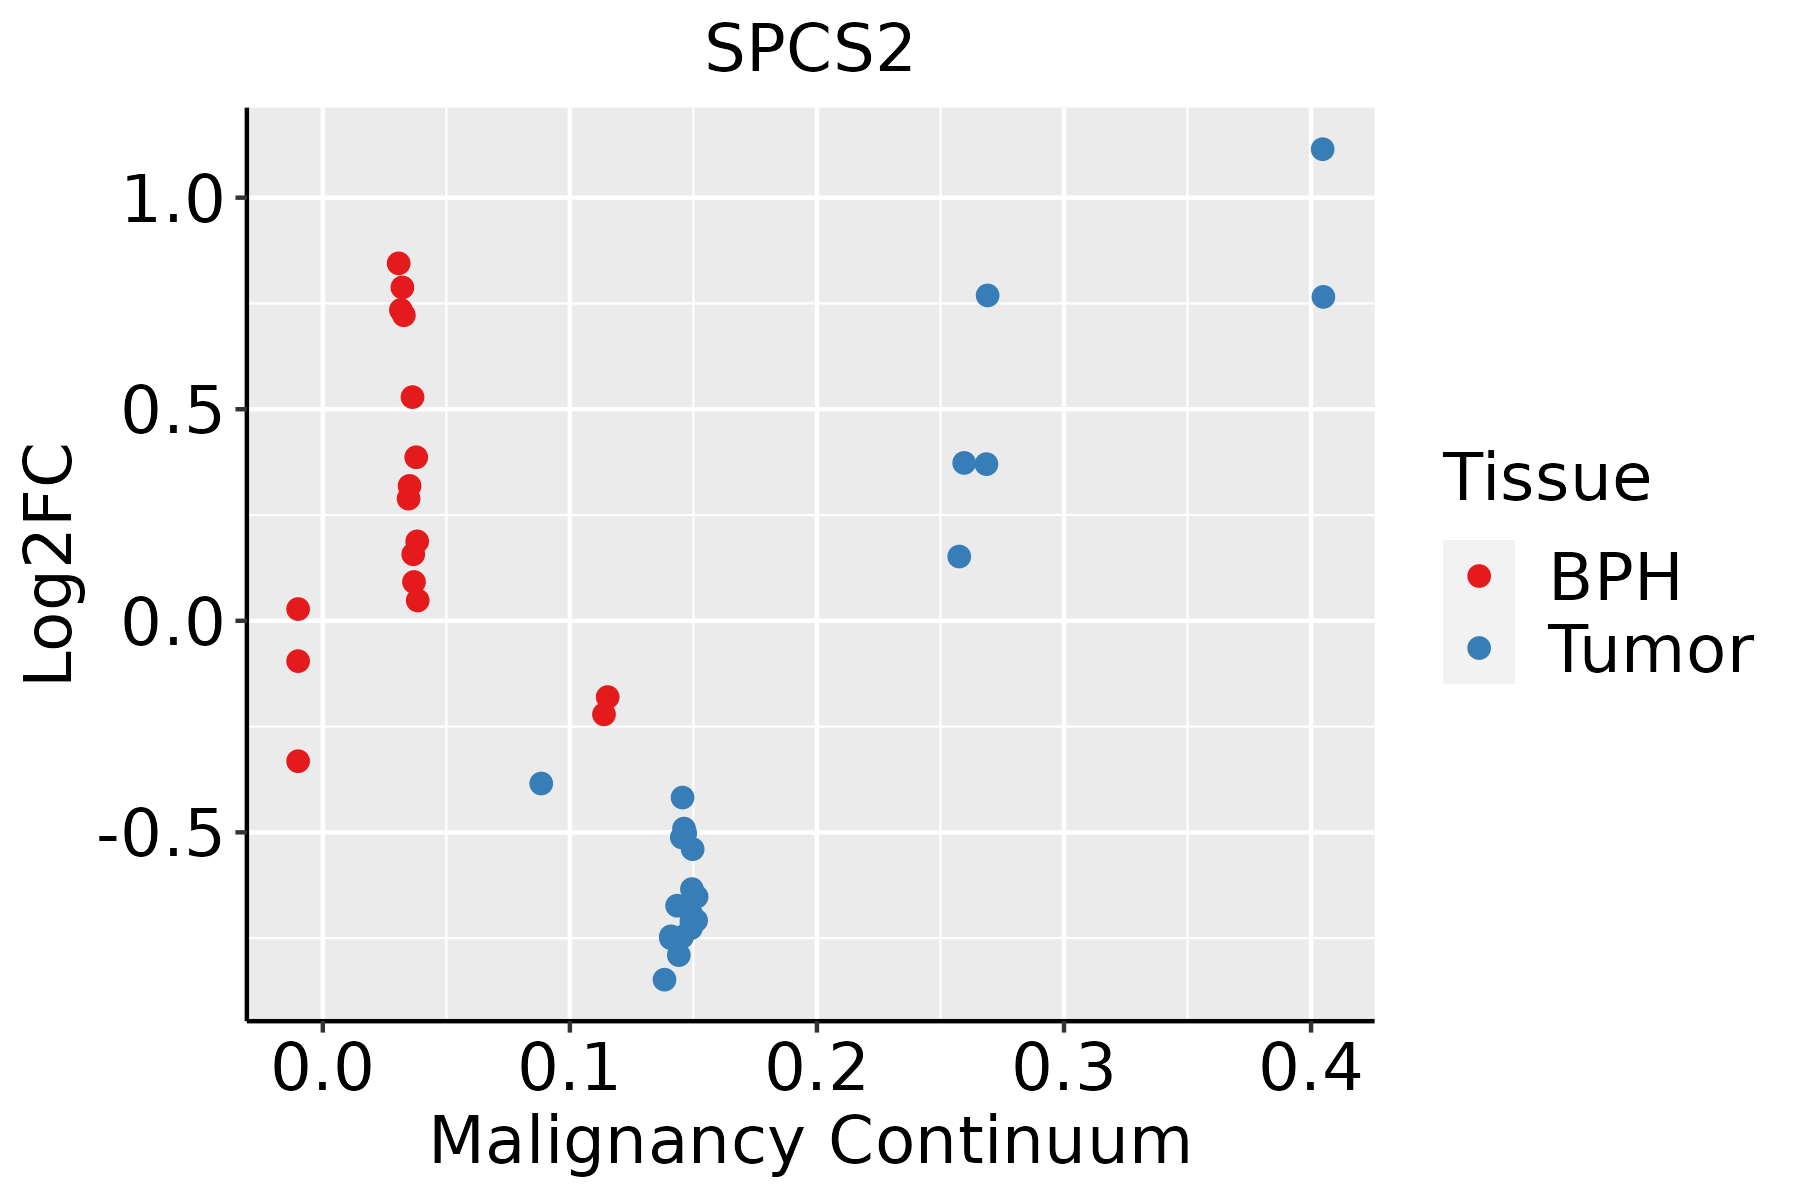 | BPH: Benign Prostatic Hyperplasia |
| Skin |  | AK: Actinic keratosis |
| cSCC: Cutaneous squamous cell carcinoma | ||
| SCCIS:squamous cell carcinoma in situ | ||
| Thyroid | 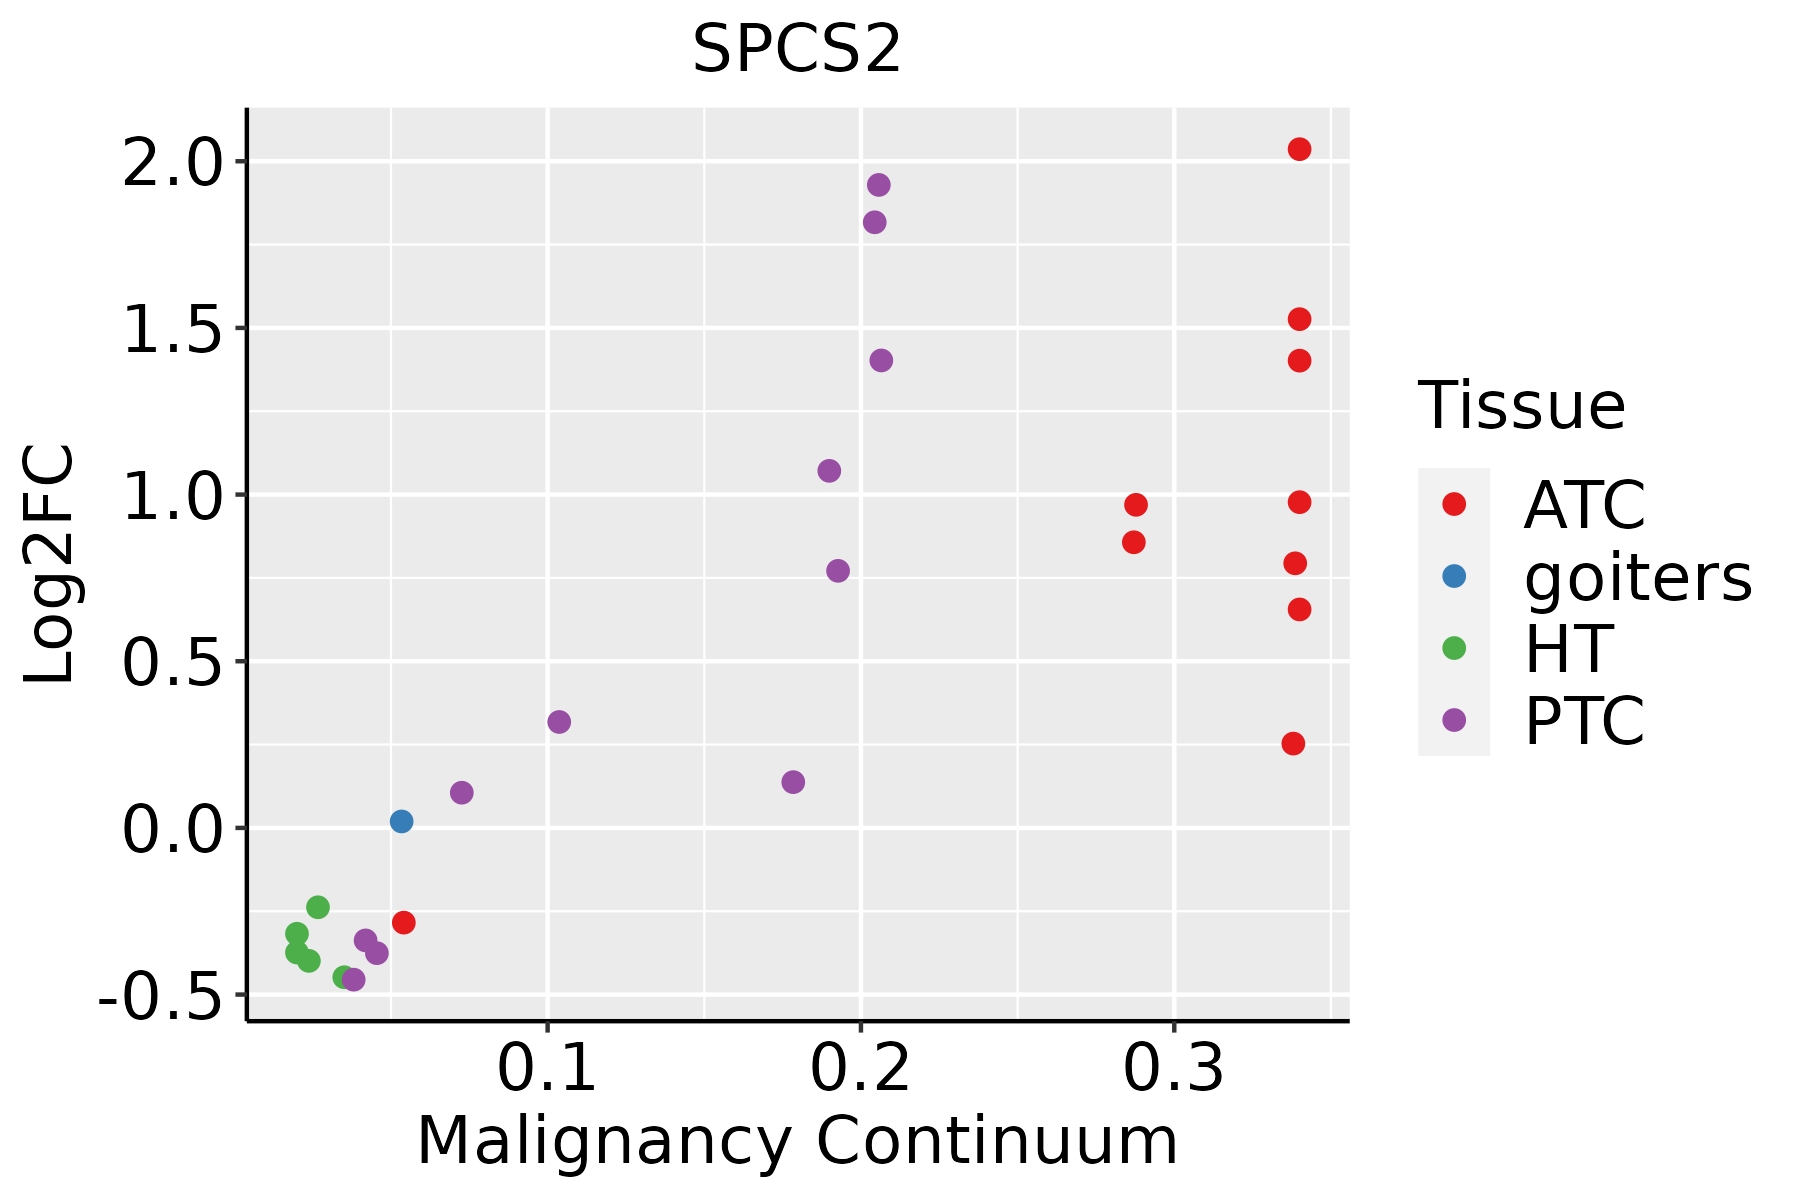 | ATC: Anaplastic thyroid cancer |
| HT: Hashimoto's thyroiditis | ||
| PTC: Papillary thyroid cancer |
| ∗log2FC in expression of this searched gene in stem-like cells from each diseased tissue sample relative to stem-like cells in normal samples in each tissue plotted against the malignancy continuum. Samples are colored based on if they are from different disease stage. |
Top |
Malignant transformation related pathway analysis |
| Find out the enriched GO biological processes and KEGG pathways involved in transition from healthy to precancer to cancer |
| Tissue | Disease Stage | Enriched GO biological Processes |
| Colorectum | AD |  |
| Colorectum | SER |  |
| Colorectum | MSS |  |
| Colorectum | MSI-H |  |
| Colorectum | FAP |  |
| ∗Top 15 enriched GO BP terms are showed in the bar plot of each disease state in each tissue. Each row represents a significant GO biological process which is colored according to the -log10(p.adjust). |
| Page: 1 2 3 4 5 6 7 8 9 |
| GO ID | Tissue | Disease Stage | Description | Gene Ratio | Bg Ratio | pvalue | p.adjust | Count |
| GO:00709725 | Breast | Precancer | protein localization to endoplasmic reticulum | 15/1080 | 74/18723 | 1.74e-05 | 4.17e-04 | 15 |
| GO:00066059 | Breast | Precancer | protein targeting | 33/1080 | 314/18723 | 6.50e-04 | 7.99e-03 | 33 |
| GO:00725948 | Breast | Precancer | establishment of protein localization to organelle | 41/1080 | 422/18723 | 7.75e-04 | 9.20e-03 | 41 |
| GO:00516047 | Breast | Precancer | protein maturation | 28/1080 | 294/18723 | 6.45e-03 | 4.50e-02 | 28 |
| GO:007097213 | Breast | IDC | protein localization to endoplasmic reticulum | 18/1434 | 74/18723 | 8.58e-06 | 2.47e-04 | 18 |
| GO:000660514 | Breast | IDC | protein targeting | 43/1434 | 314/18723 | 1.44e-04 | 2.53e-03 | 43 |
| GO:007259413 | Breast | IDC | establishment of protein localization to organelle | 51/1434 | 422/18723 | 7.94e-04 | 9.55e-03 | 51 |
| GO:005160413 | Breast | IDC | protein maturation | 35/1434 | 294/18723 | 6.18e-03 | 4.40e-02 | 35 |
| GO:007097222 | Breast | DCIS | protein localization to endoplasmic reticulum | 18/1390 | 74/18723 | 5.57e-06 | 1.60e-04 | 18 |
| GO:000660523 | Breast | DCIS | protein targeting | 43/1390 | 314/18723 | 7.17e-05 | 1.41e-03 | 43 |
| GO:007259423 | Breast | DCIS | establishment of protein localization to organelle | 51/1390 | 422/18723 | 3.91e-04 | 5.40e-03 | 51 |
| GO:005160422 | Breast | DCIS | protein maturation | 34/1390 | 294/18723 | 6.72e-03 | 4.66e-02 | 34 |
| GO:00725949 | Cervix | CC | establishment of protein localization to organelle | 99/2311 | 422/18723 | 1.23e-10 | 2.11e-08 | 99 |
| GO:000660510 | Cervix | CC | protein targeting | 68/2311 | 314/18723 | 2.17e-06 | 6.55e-05 | 68 |
| GO:00064657 | Cervix | CC | signal peptide processing | 8/2311 | 14/18723 | 8.01e-05 | 1.09e-03 | 8 |
| GO:00709726 | Cervix | CC | protein localization to endoplasmic reticulum | 21/2311 | 74/18723 | 1.69e-04 | 2.00e-03 | 21 |
| GO:00516048 | Cervix | CC | protein maturation | 56/2311 | 294/18723 | 5.90e-04 | 5.59e-03 | 56 |
| GO:00725995 | Cervix | CC | establishment of protein localization to endoplasmic reticulum | 13/2311 | 46/18723 | 2.95e-03 | 1.94e-02 | 13 |
| GO:00725942 | Colorectum | MSS | establishment of protein localization to organelle | 139/3467 | 422/18723 | 5.75e-13 | 1.12e-10 | 139 |
| GO:00066052 | Colorectum | MSS | protein targeting | 97/3467 | 314/18723 | 6.76e-08 | 3.46e-06 | 97 |
| Page: 1 2 3 4 5 6 7 8 9 |
| Pathway ID | Tissue | Disease Stage | Description | Gene Ratio | Bg Ratio | pvalue | p.adjust | qvalue | Count |
| hsa030609 | Breast | Precancer | Protein export | 6/684 | 23/8465 | 8.34e-03 | 4.54e-02 | 3.48e-02 | 6 |
| hsa0306012 | Breast | Precancer | Protein export | 6/684 | 23/8465 | 8.34e-03 | 4.54e-02 | 3.48e-02 | 6 |
| hsa0306010 | Cervix | CC | Protein export | 10/1267 | 23/8465 | 9.64e-04 | 4.22e-03 | 2.49e-03 | 10 |
| hsa0306013 | Cervix | CC | Protein export | 10/1267 | 23/8465 | 9.64e-04 | 4.22e-03 | 2.49e-03 | 10 |
| hsa030602 | Colorectum | MSS | Protein export | 15/1875 | 23/8465 | 1.13e-05 | 1.26e-04 | 7.71e-05 | 15 |
| hsa030603 | Colorectum | MSS | Protein export | 15/1875 | 23/8465 | 1.13e-05 | 1.26e-04 | 7.71e-05 | 15 |
| hsa030606 | Colorectum | FAP | Protein export | 10/1404 | 23/8465 | 2.17e-03 | 1.05e-02 | 6.39e-03 | 10 |
| hsa030607 | Colorectum | FAP | Protein export | 10/1404 | 23/8465 | 2.17e-03 | 1.05e-02 | 6.39e-03 | 10 |
| hsa0306014 | Endometrium | AEH | Protein export | 11/1197 | 23/8465 | 1.14e-04 | 1.06e-03 | 7.73e-04 | 11 |
| hsa0306015 | Endometrium | AEH | Protein export | 11/1197 | 23/8465 | 1.14e-04 | 1.06e-03 | 7.73e-04 | 11 |
| hsa0306023 | Endometrium | EEC | Protein export | 11/1237 | 23/8465 | 1.54e-04 | 1.41e-03 | 1.05e-03 | 11 |
| hsa0306033 | Endometrium | EEC | Protein export | 11/1237 | 23/8465 | 1.54e-04 | 1.41e-03 | 1.05e-03 | 11 |
| hsa0306020 | Esophagus | HGIN | Protein export | 13/1383 | 23/8465 | 1.27e-05 | 1.80e-04 | 1.43e-04 | 13 |
| hsa03060110 | Esophagus | HGIN | Protein export | 13/1383 | 23/8465 | 1.27e-05 | 1.80e-04 | 1.43e-04 | 13 |
| hsa0306026 | Esophagus | ESCC | Protein export | 22/4205 | 23/8465 | 2.43e-06 | 1.43e-05 | 7.32e-06 | 22 |
| hsa0306036 | Esophagus | ESCC | Protein export | 22/4205 | 23/8465 | 2.43e-06 | 1.43e-05 | 7.32e-06 | 22 |
| hsa030608 | Liver | Cirrhotic | Protein export | 20/2530 | 23/8465 | 2.00e-08 | 3.51e-07 | 2.17e-07 | 20 |
| hsa0306011 | Liver | Cirrhotic | Protein export | 20/2530 | 23/8465 | 2.00e-08 | 3.51e-07 | 2.17e-07 | 20 |
| hsa0306021 | Liver | HCC | Protein export | 21/4020 | 23/8465 | 1.20e-05 | 8.53e-05 | 4.74e-05 | 21 |
| hsa0306031 | Liver | HCC | Protein export | 21/4020 | 23/8465 | 1.20e-05 | 8.53e-05 | 4.74e-05 | 21 |
| Page: 1 2 |
Top |
Cell-cell communication analysis |
| Identification of potential cell-cell interactions between two cell types and their ligand-receptor pairs for different disease states |
| Ligand | Receptor | LRpair | Pathway | Tissue | Disease Stage |
| Page: 1 |
Top |
Single-cell gene regulatory network inference analysis |
| Find out the significant the regulons (TFs) and the target genes of each regulon across cell types for different disease states |
| TF | Cell Type | Tissue | Disease Stage | Target Gene | RSS | Regulon Activity |
| ∗The dot plots of a searched regulon are shown for all cell subpopulations in each disease state of each tissue based on the regulon specific score inferred using pySCENIC and by calculating the average expression. |
| Page: 1 |
Top |
Somatic mutation of malignant transformation related genes |
| Annotation of somatic variants for genes involved in malignant transformation |
| Hugo Symbol | Variant Class | Variant Classification | dbSNP RS | HGVSc | HGVSp | HGVSp Short | SWISSPROT | BIOTYPE | SIFT | PolyPhen | Tumor Sample Barcode | Tissue | Histology | Sex | Age | Stage | Therapy Types | Drugs | Outcome |
| SPCS2 | SNV | Missense_Mutation | novel | c.94N>T | p.Arg32Cys | p.R32C | Q15005 | protein_coding | deleterious_low_confidence(0) | possibly_damaging(0.549) | TCGA-AN-A046-01 | Breast | breast invasive carcinoma | Female | >=65 | I/II | Unknown | Unknown | SD |
| SPCS2 | SNV | Missense_Mutation | rs754474538 | c.5N>T | p.Ala2Val | p.A2V | Q15005 | protein_coding | deleterious_low_confidence(0) | probably_damaging(0.939) | TCGA-2W-A8YY-01 | Cervix | cervical & endocervical cancer | Female | <65 | I/II | Chemotherapy | cisplatin | CR |
| SPCS2 | SNV | Missense_Mutation | novel | c.502N>A | p.Asp168Asn | p.D168N | Q15005 | protein_coding | tolerated(0.05) | benign(0.251) | TCGA-HM-A4S6-01 | Cervix | cervical & endocervical cancer | Female | <65 | III/IV | Chemotherapy | cisplatin | CR |
| SPCS2 | SNV | Missense_Mutation | c.133N>T | p.Pro45Ser | p.P45S | Q15005 | protein_coding | deleterious(0.04) | probably_damaging(0.999) | TCGA-G4-6320-01 | Colorectum | colon adenocarcinoma | Male | >=65 | III/IV | Chemotherapy | oxaliplatin | SD | |
| SPCS2 | SNV | Missense_Mutation | novel | c.359C>A | p.Ser120Tyr | p.S120Y | Q15005 | protein_coding | deleterious(0.03) | probably_damaging(0.976) | TCGA-EI-6917-01 | Colorectum | rectum adenocarcinoma | Male | <65 | III/IV | Chemotherapy | 5fluorouracil+oxaciplatina+l-folinian | SD |
| SPCS2 | SNV | Missense_Mutation | novel | c.503N>G | p.Asp168Gly | p.D168G | Q15005 | protein_coding | tolerated(0.08) | benign(0.04) | TCGA-A5-A0G2-01 | Endometrium | uterine corpus endometrioid carcinoma | Female | <65 | III/IV | Unknown | Unknown | SD |
| SPCS2 | SNV | Missense_Mutation | c.259A>G | p.Ile87Val | p.I87V | Q15005 | protein_coding | deleterious(0.02) | possibly_damaging(0.873) | TCGA-AP-A0LM-01 | Endometrium | uterine corpus endometrioid carcinoma | Female | <65 | III/IV | Chemotherapy | cisplatin | SD | |
| SPCS2 | SNV | Missense_Mutation | novel | c.411N>T | p.Lys137Asn | p.K137N | Q15005 | protein_coding | deleterious(0) | probably_damaging(1) | TCGA-AP-A1E0-01 | Endometrium | uterine corpus endometrioid carcinoma | Female | <65 | III/IV | Chemotherapy | paclitaxel | SD |
| SPCS2 | SNV | Missense_Mutation | rs377570707 | c.337G>A | p.Val113Ile | p.V113I | Q15005 | protein_coding | tolerated(0.07) | possibly_damaging(0.621) | TCGA-AX-A0J1-01 | Endometrium | uterine corpus endometrioid carcinoma | Female | >=65 | I/II | Unknown | Unknown | SD |
| SPCS2 | SNV | Missense_Mutation | novel | c.170N>T | p.Lys57Ile | p.K57I | Q15005 | protein_coding | deleterious(0) | probably_damaging(0.995) | TCGA-B5-A3FA-01 | Endometrium | uterine corpus endometrioid carcinoma | Female | >=65 | I/II | Unknown | Unknown | SD |
| Page: 1 2 |
Top |
Related drugs of malignant transformation related genes |
| Identification of chemicals and drugs interact with genes involved in malignant transfromation |
| (DGIdb 4.0) |
| Entrez ID | Symbol | Category | Interaction Types | Drug Claim Name | Drug Name | PMIDs |
| Page: 1 |

Copyright 2023-Present -The University of Texas Health Science Center at Houston |