
|
|||||
|
 | |
| |
| |
| |
| |
| |
|
Gene: PRPF40A |
Gene summary for PRPF40A |
| Gene information | Species | Human | Gene symbol | PRPF40A | Gene ID | 55660 |
| Gene name | pre-mRNA processing factor 40 homolog A | |
| Gene Alias | FBP-11 | |
| Cytomap | 2q23.3 | |
| Gene Type | protein-coding | GO ID | GO:0000375 | UniProtAcc | O75400 |
Top |
Malignant transformation analysis |
| Identification of the aberrant gene expression in precancerous and cancerous lesions by comparing the gene expression of stem-like cells in diseased tissues with normal stem cells |
| Entrez ID | Symbol | Replicates | Species | Organ | Tissue | Adj P-value | Log2FC | Malignancy |
| 55660 | PRPF40A | cSCC_p9 | Human | Skin | cSCC | 6.42e-05 | 7.86e-02 | -0.1991 |
| 55660 | PRPF40A | male-WTA | Human | Thyroid | PTC | 1.19e-46 | 2.28e-01 | 0.1037 |
| 55660 | PRPF40A | PTC01 | Human | Thyroid | PTC | 3.20e-16 | 2.53e-01 | 0.1899 |
| 55660 | PRPF40A | PTC03 | Human | Thyroid | PTC | 9.25e-04 | 1.77e-01 | 0.1784 |
| 55660 | PRPF40A | PTC04 | Human | Thyroid | PTC | 1.29e-13 | 4.61e-01 | 0.1927 |
| 55660 | PRPF40A | PTC05 | Human | Thyroid | PTC | 4.42e-22 | 1.24e+00 | 0.2065 |
| 55660 | PRPF40A | PTC06 | Human | Thyroid | PTC | 3.78e-48 | 1.26e+00 | 0.2057 |
| 55660 | PRPF40A | PTC07 | Human | Thyroid | PTC | 7.93e-44 | 8.06e-01 | 0.2044 |
| 55660 | PRPF40A | ATC09 | Human | Thyroid | ATC | 2.63e-14 | 4.76e-01 | 0.2871 |
| 55660 | PRPF40A | ATC11 | Human | Thyroid | ATC | 2.95e-04 | 8.67e-01 | 0.3386 |
| 55660 | PRPF40A | ATC12 | Human | Thyroid | ATC | 2.53e-13 | 6.78e-01 | 0.34 |
| 55660 | PRPF40A | ATC13 | Human | Thyroid | ATC | 1.96e-48 | 1.27e+00 | 0.34 |
| 55660 | PRPF40A | ATC1 | Human | Thyroid | ATC | 2.32e-12 | 5.28e-01 | 0.2878 |
| 55660 | PRPF40A | ATC2 | Human | Thyroid | ATC | 1.11e-27 | 2.83e+00 | 0.34 |
| 55660 | PRPF40A | ATC3 | Human | Thyroid | ATC | 6.27e-04 | 5.65e-01 | 0.338 |
| 55660 | PRPF40A | ATC4 | Human | Thyroid | ATC | 2.40e-25 | 9.35e-01 | 0.34 |
| 55660 | PRPF40A | ATC5 | Human | Thyroid | ATC | 4.52e-56 | 1.40e+00 | 0.34 |
| Page: 1 2 3 4 5 6 7 8 9 10 11 |
| Tissue | Expression Dynamics | Abbreviation |
| Breast | 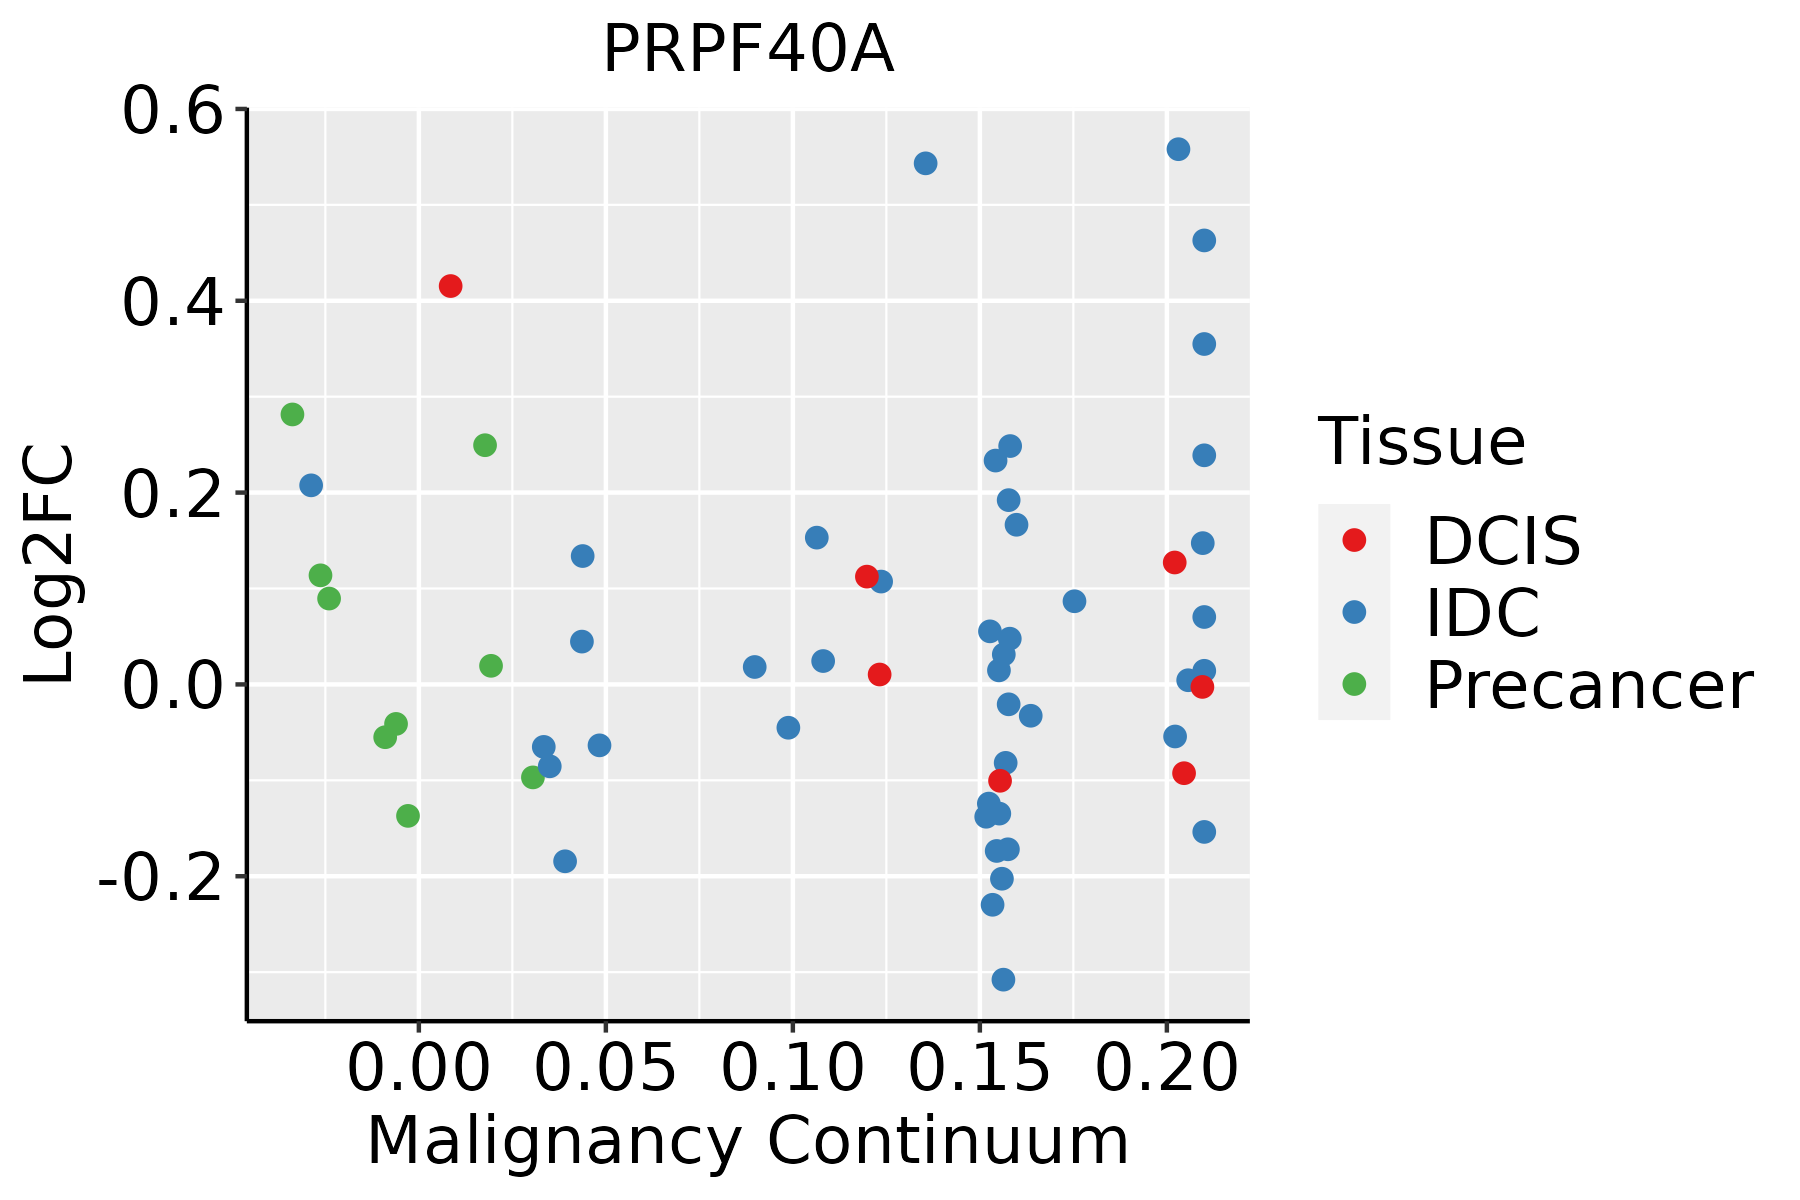 | IDC: Invasive ductal carcinoma |
| DCIS: Ductal carcinoma in situ | ||
| Precancer(BRCA1-mut): Precancerous lesion from BRCA1 mutation carriers | ||
| Colorectum (GSE201348) | 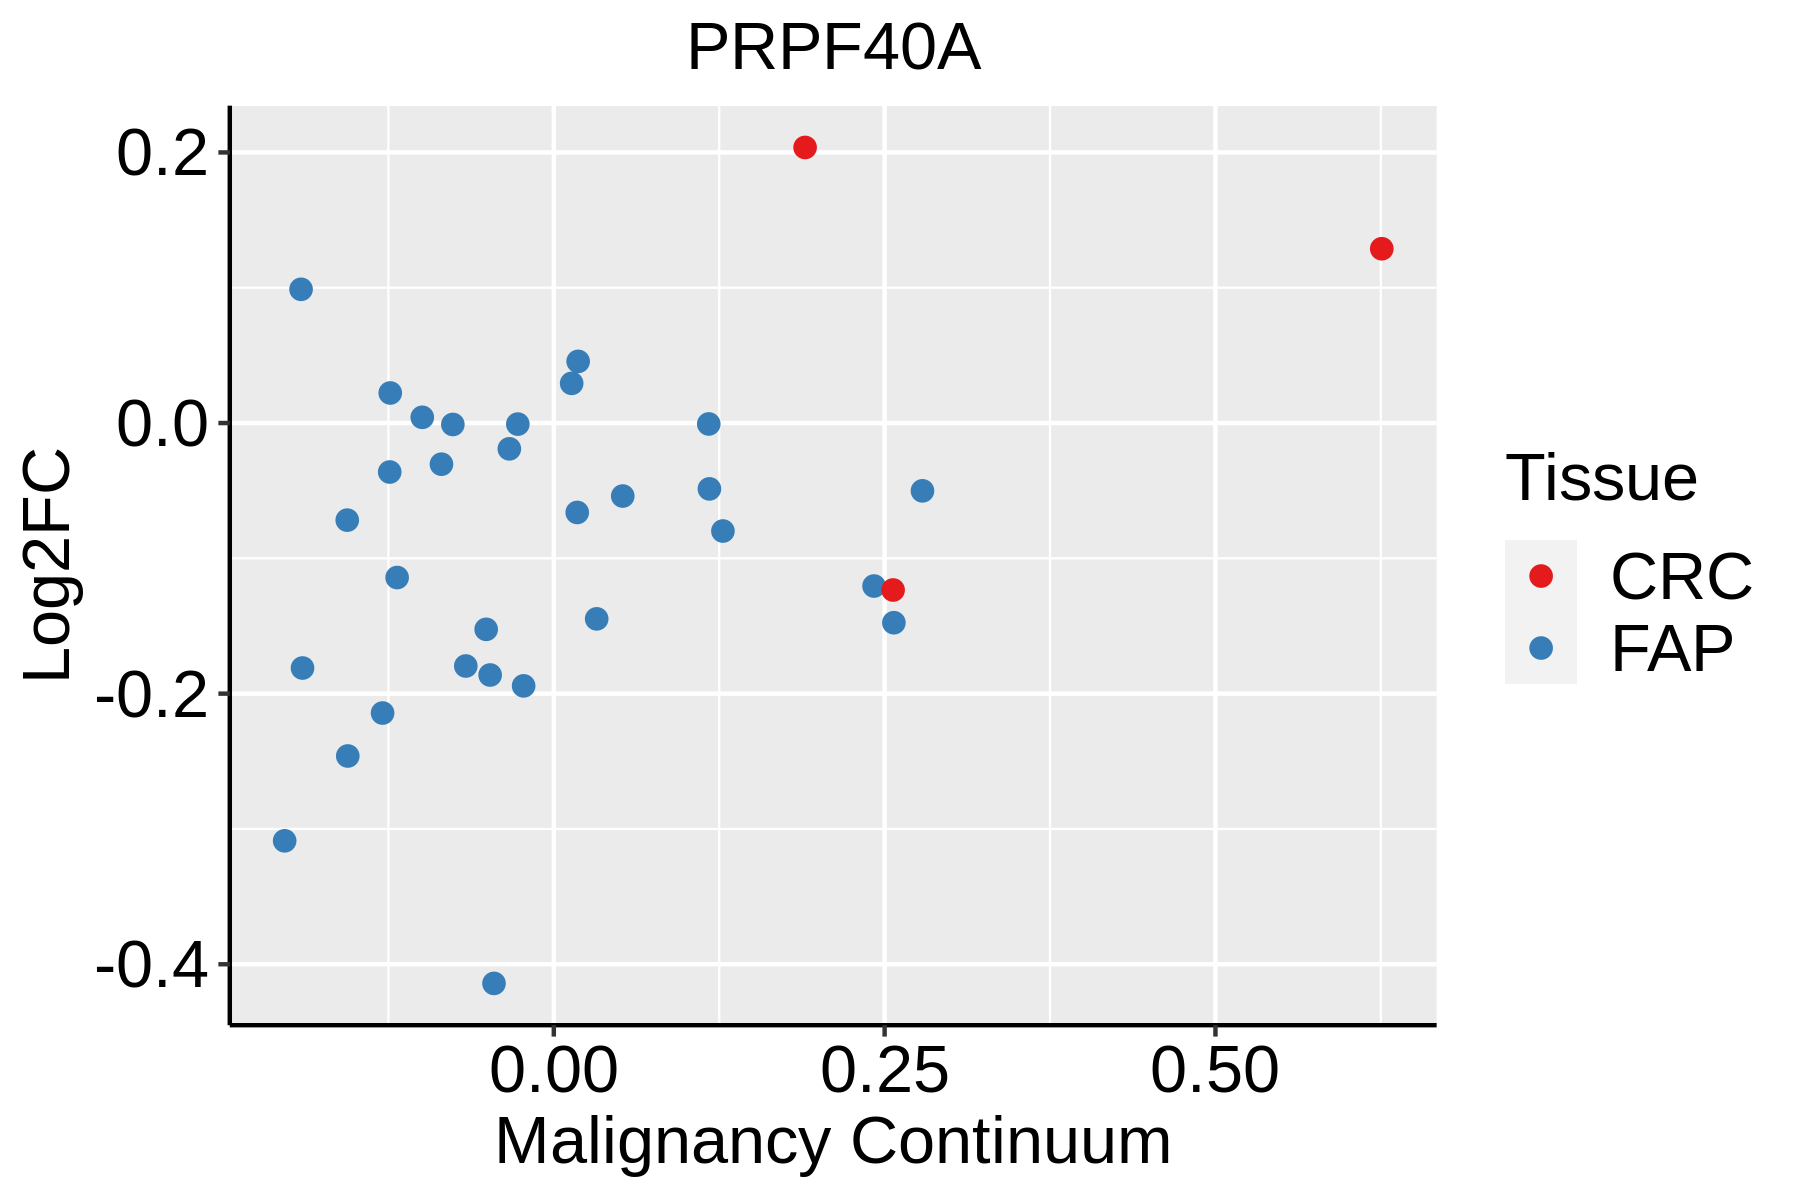 | FAP: Familial adenomatous polyposis |
| CRC: Colorectal cancer | ||
| Colorectum (HTA11) |  | AD: Adenomas |
| SER: Sessile serrated lesions | ||
| MSI-H: Microsatellite-high colorectal cancer | ||
| MSS: Microsatellite stable colorectal cancer | ||
| Endometrium | 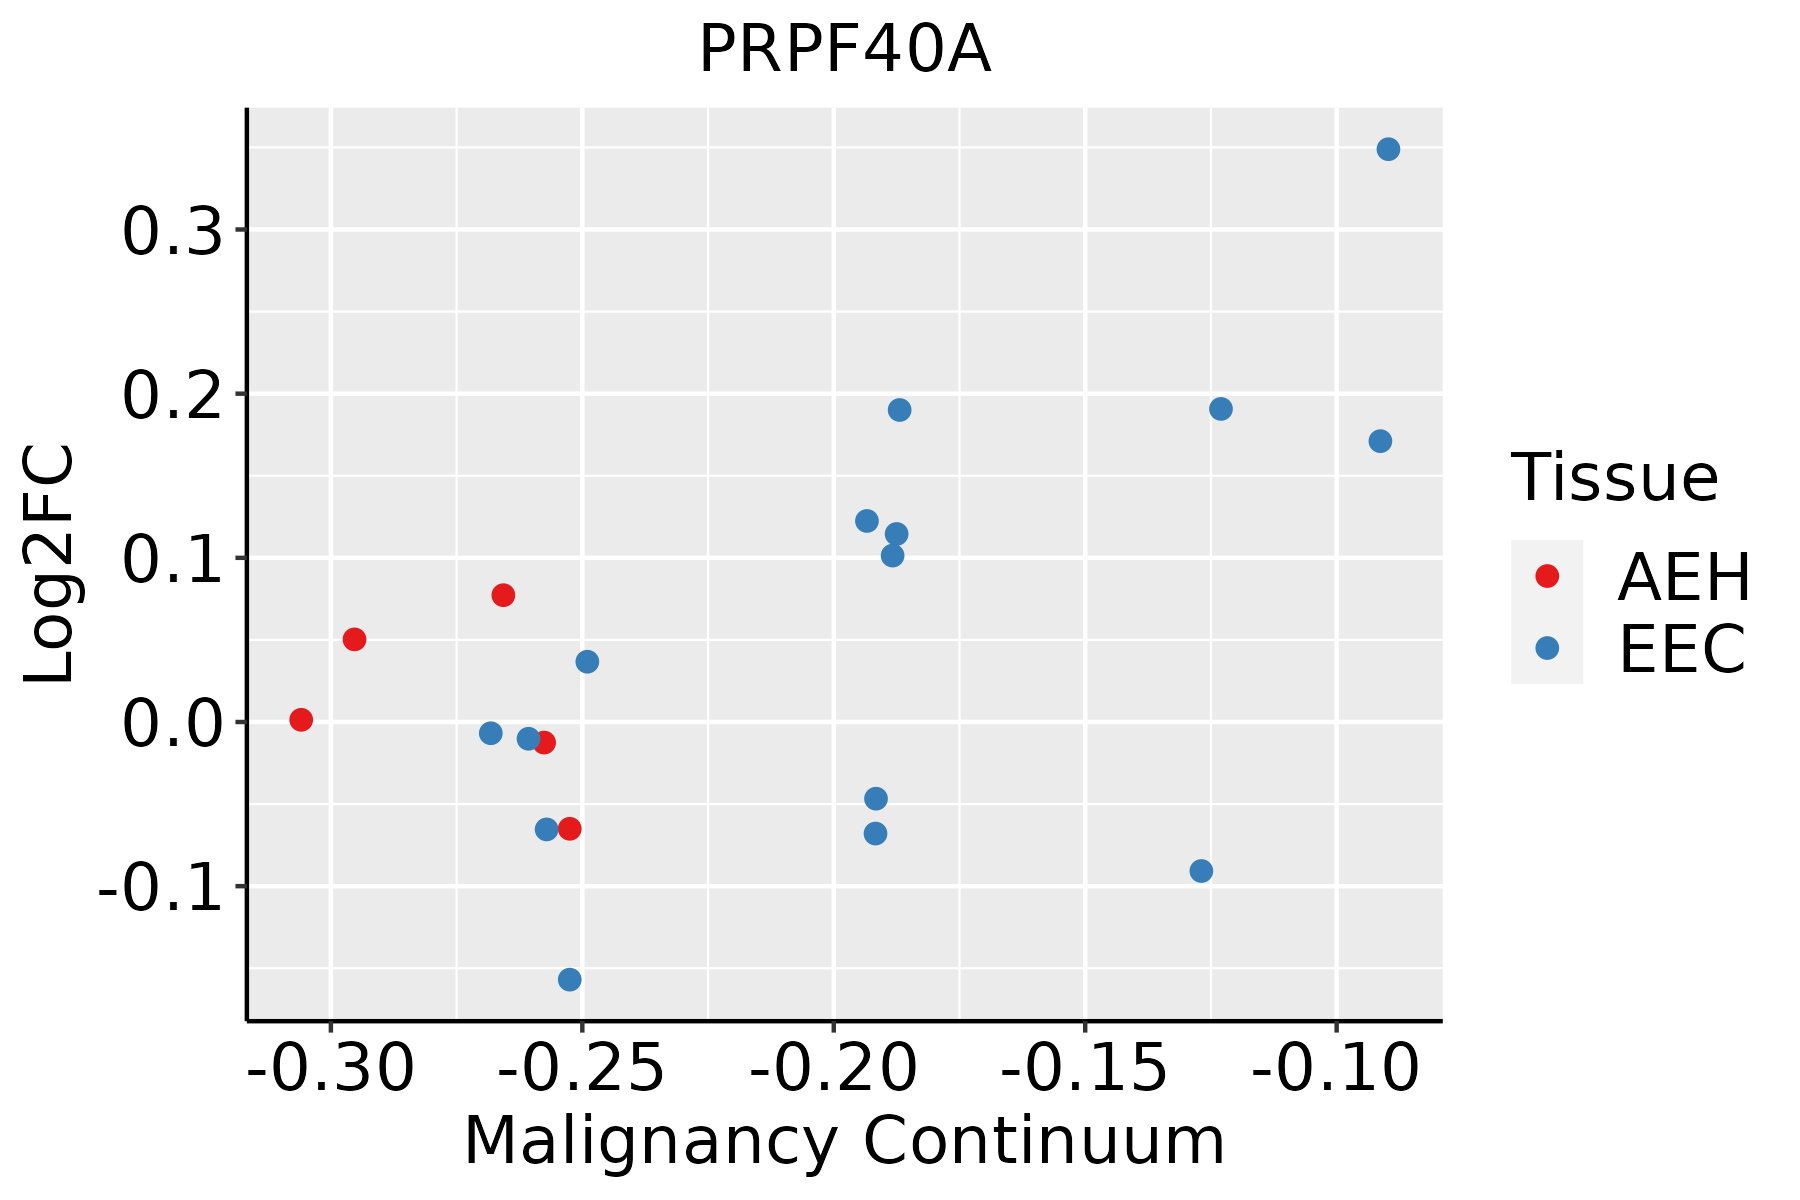 | AEH: Atypical endometrial hyperplasia |
| EEC: Endometrioid Cancer | ||
| Esophagus |  | ESCC: Esophageal squamous cell carcinoma |
| HGIN: High-grade intraepithelial neoplasias | ||
| LGIN: Low-grade intraepithelial neoplasias | ||
| Liver |  | HCC: Hepatocellular carcinoma |
| NAFLD: Non-alcoholic fatty liver disease | ||
| Oral Cavity | 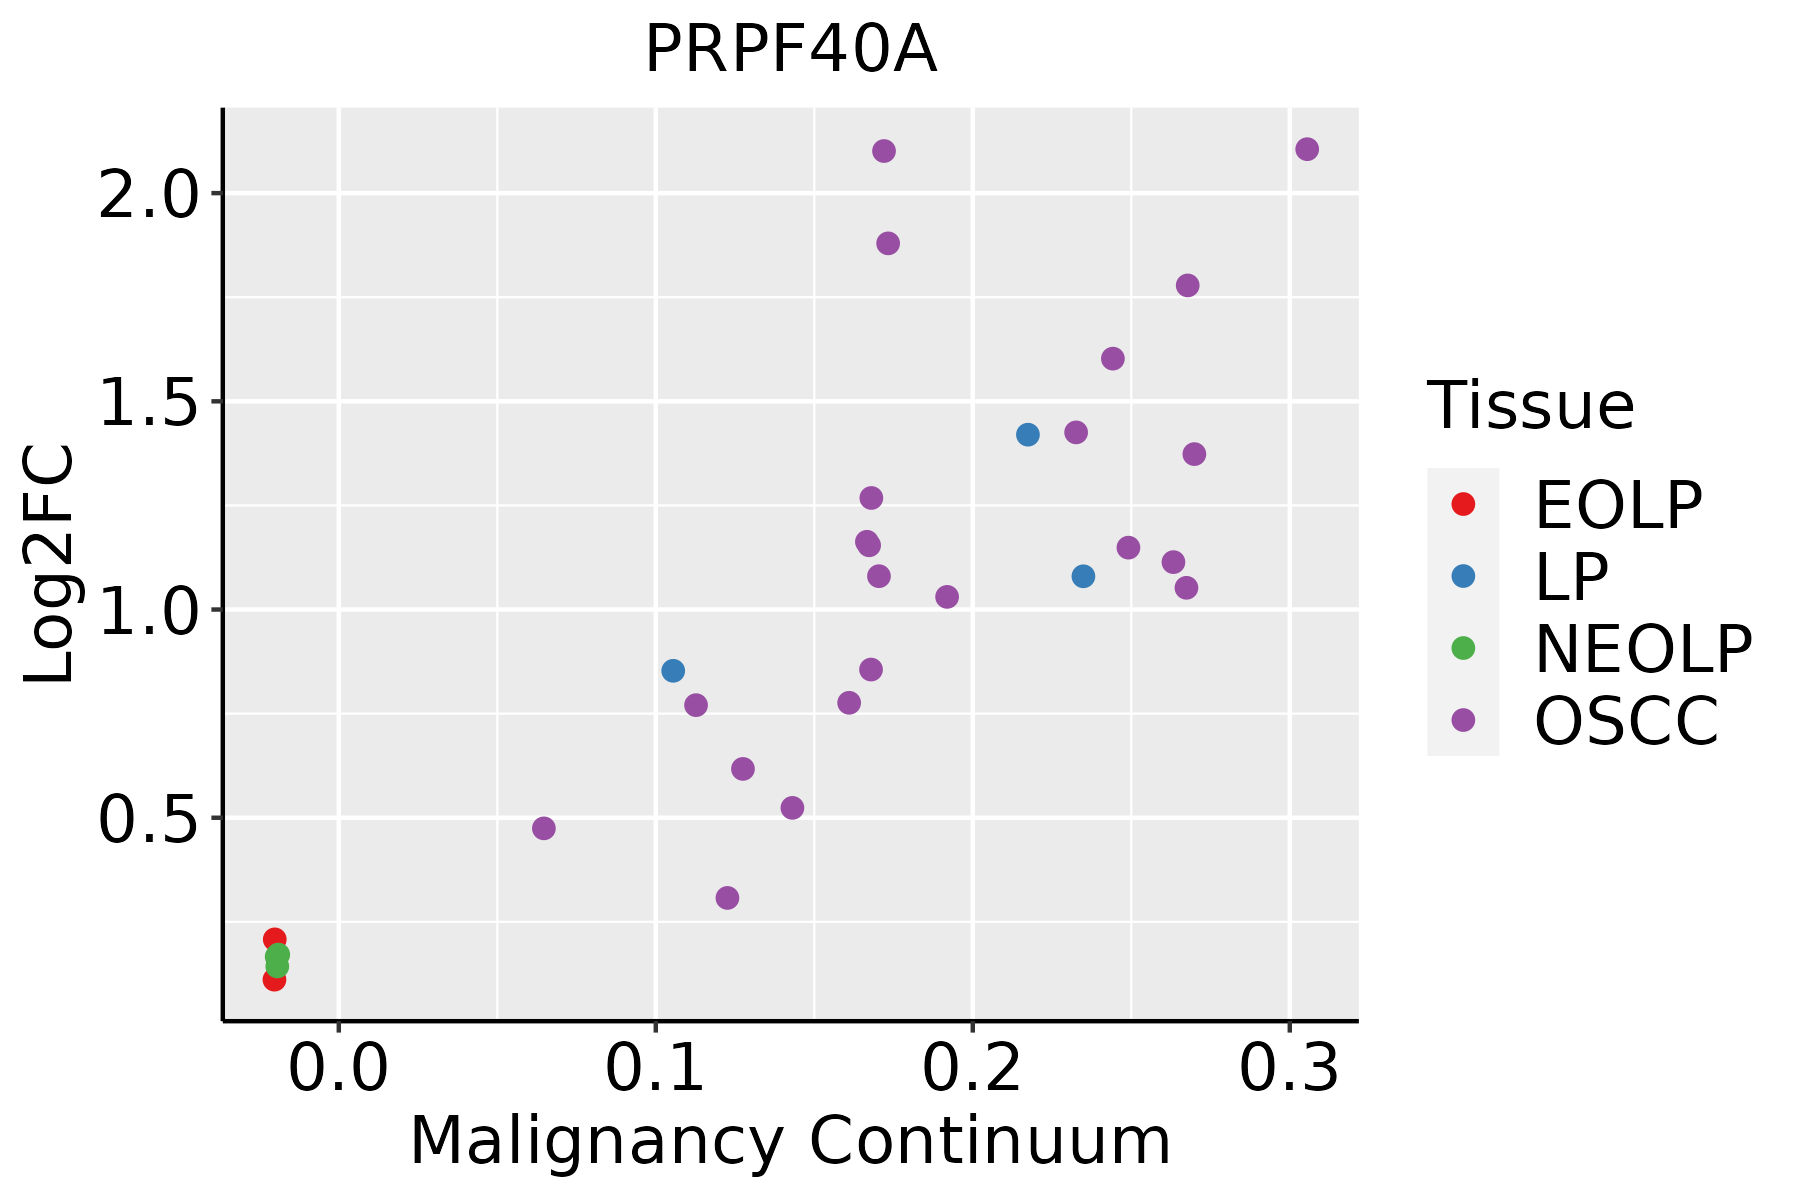 | EOLP: Erosive Oral lichen planus |
| LP: leukoplakia | ||
| NEOLP: Non-erosive oral lichen planus | ||
| OSCC: Oral squamous cell carcinoma | ||
| Prostate | 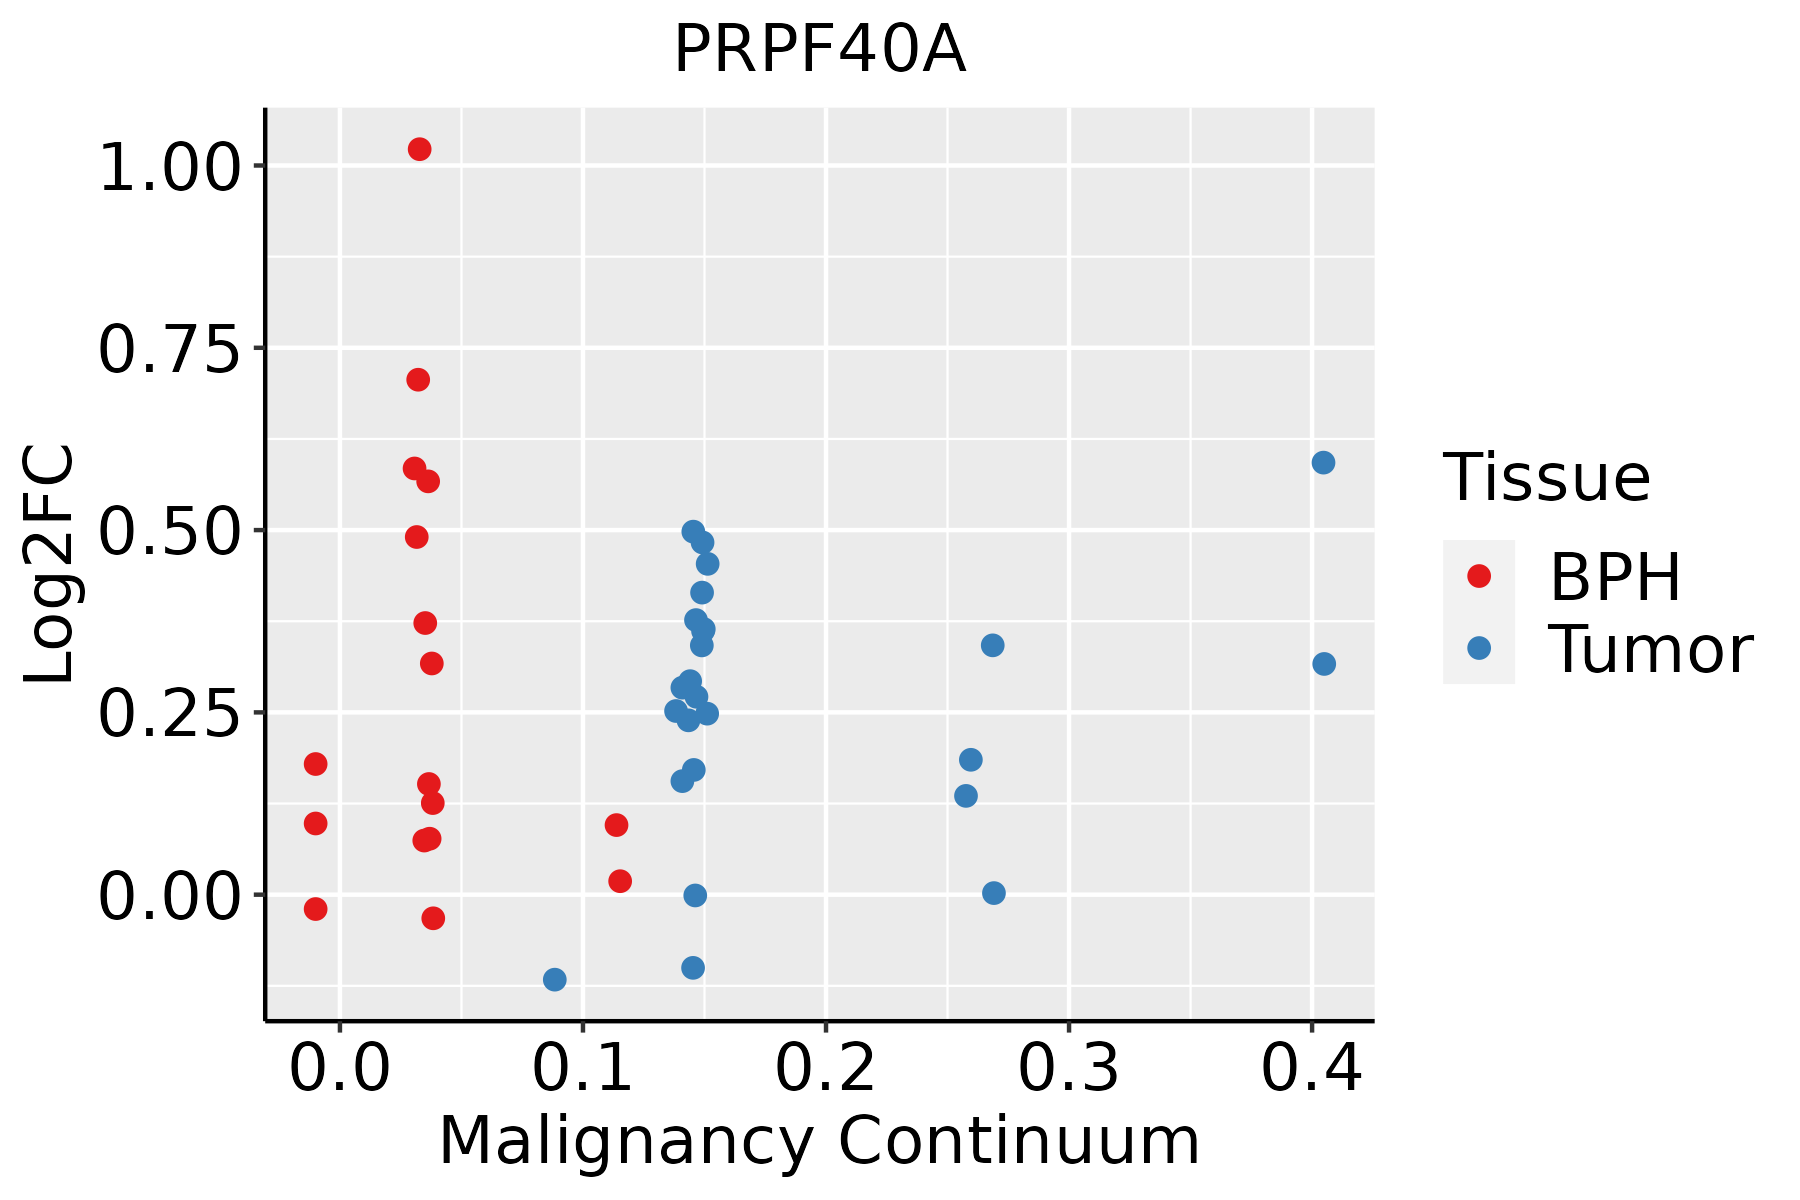 | BPH: Benign Prostatic Hyperplasia |
| Skin | 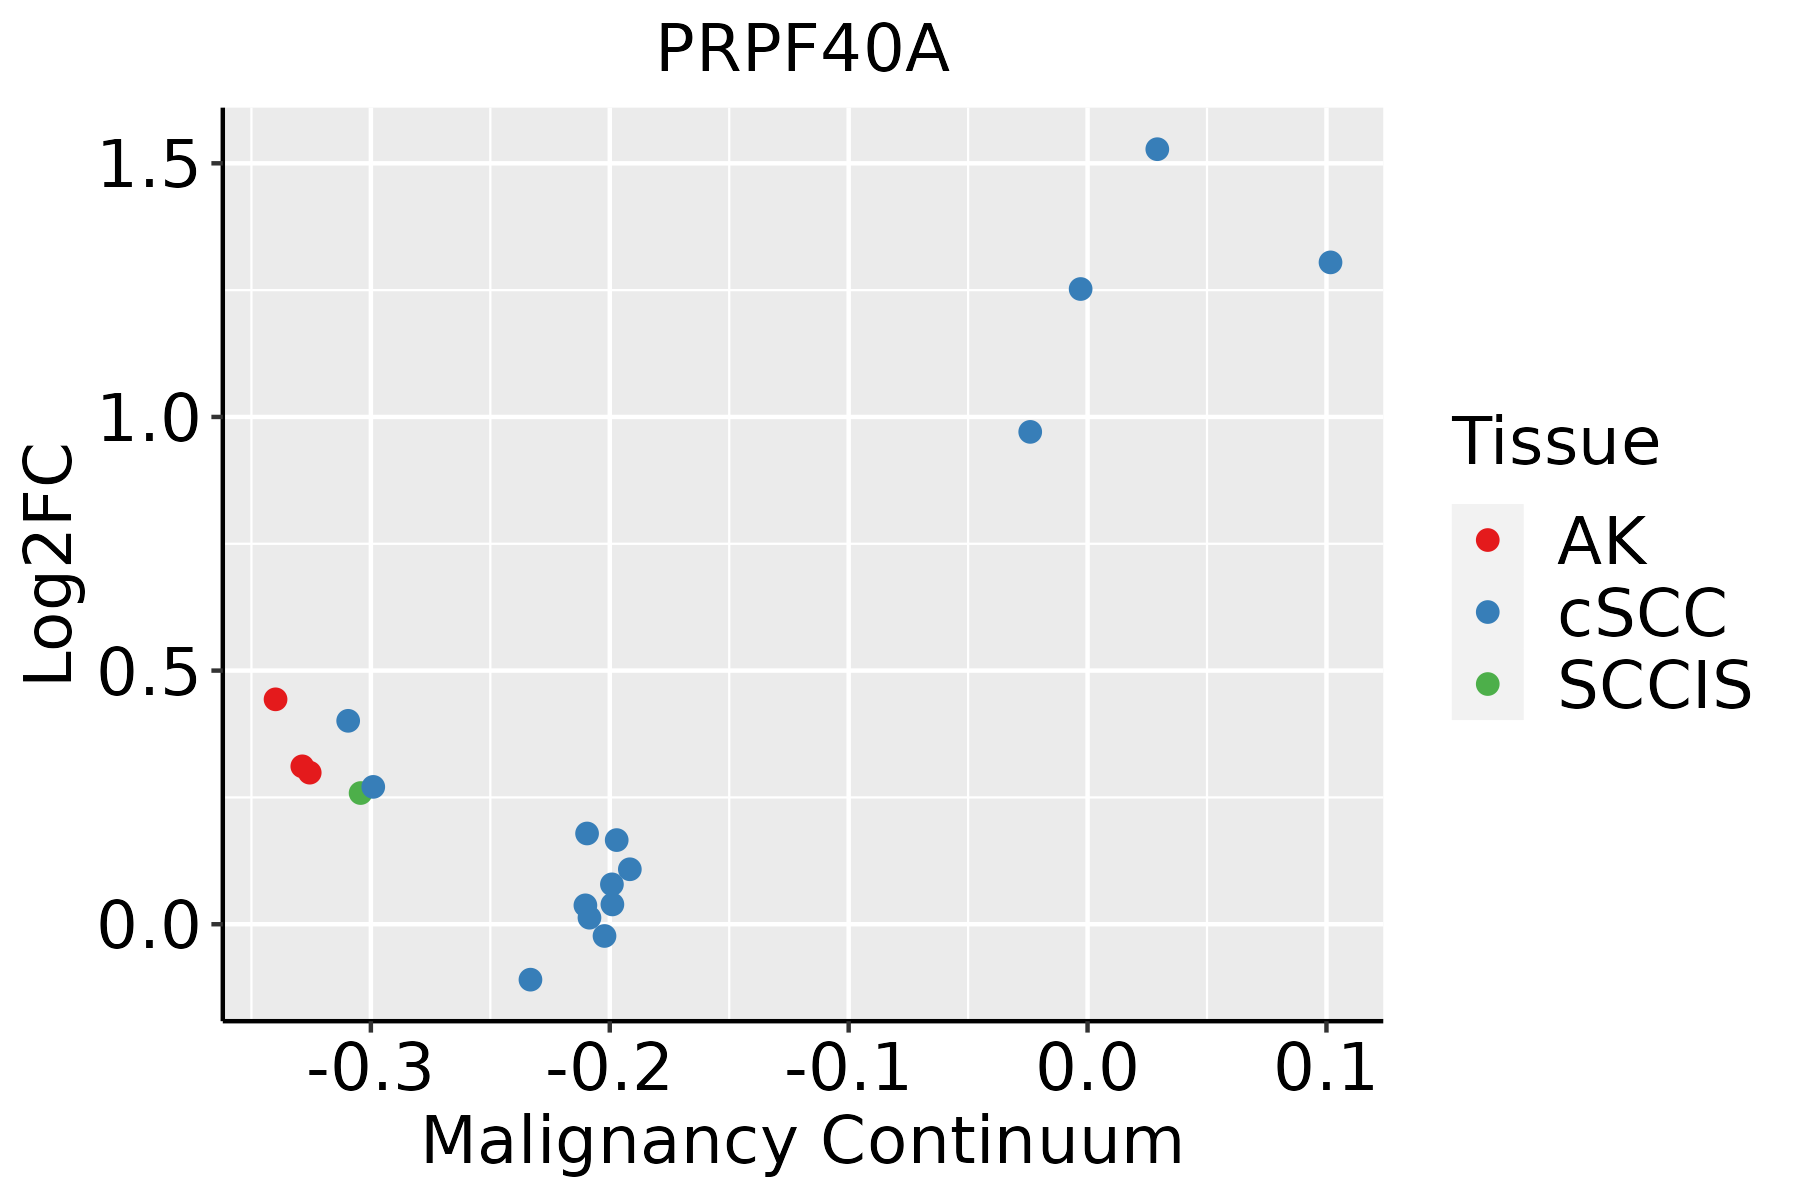 | AK: Actinic keratosis |
| cSCC: Cutaneous squamous cell carcinoma | ||
| SCCIS:squamous cell carcinoma in situ | ||
| Thyroid | 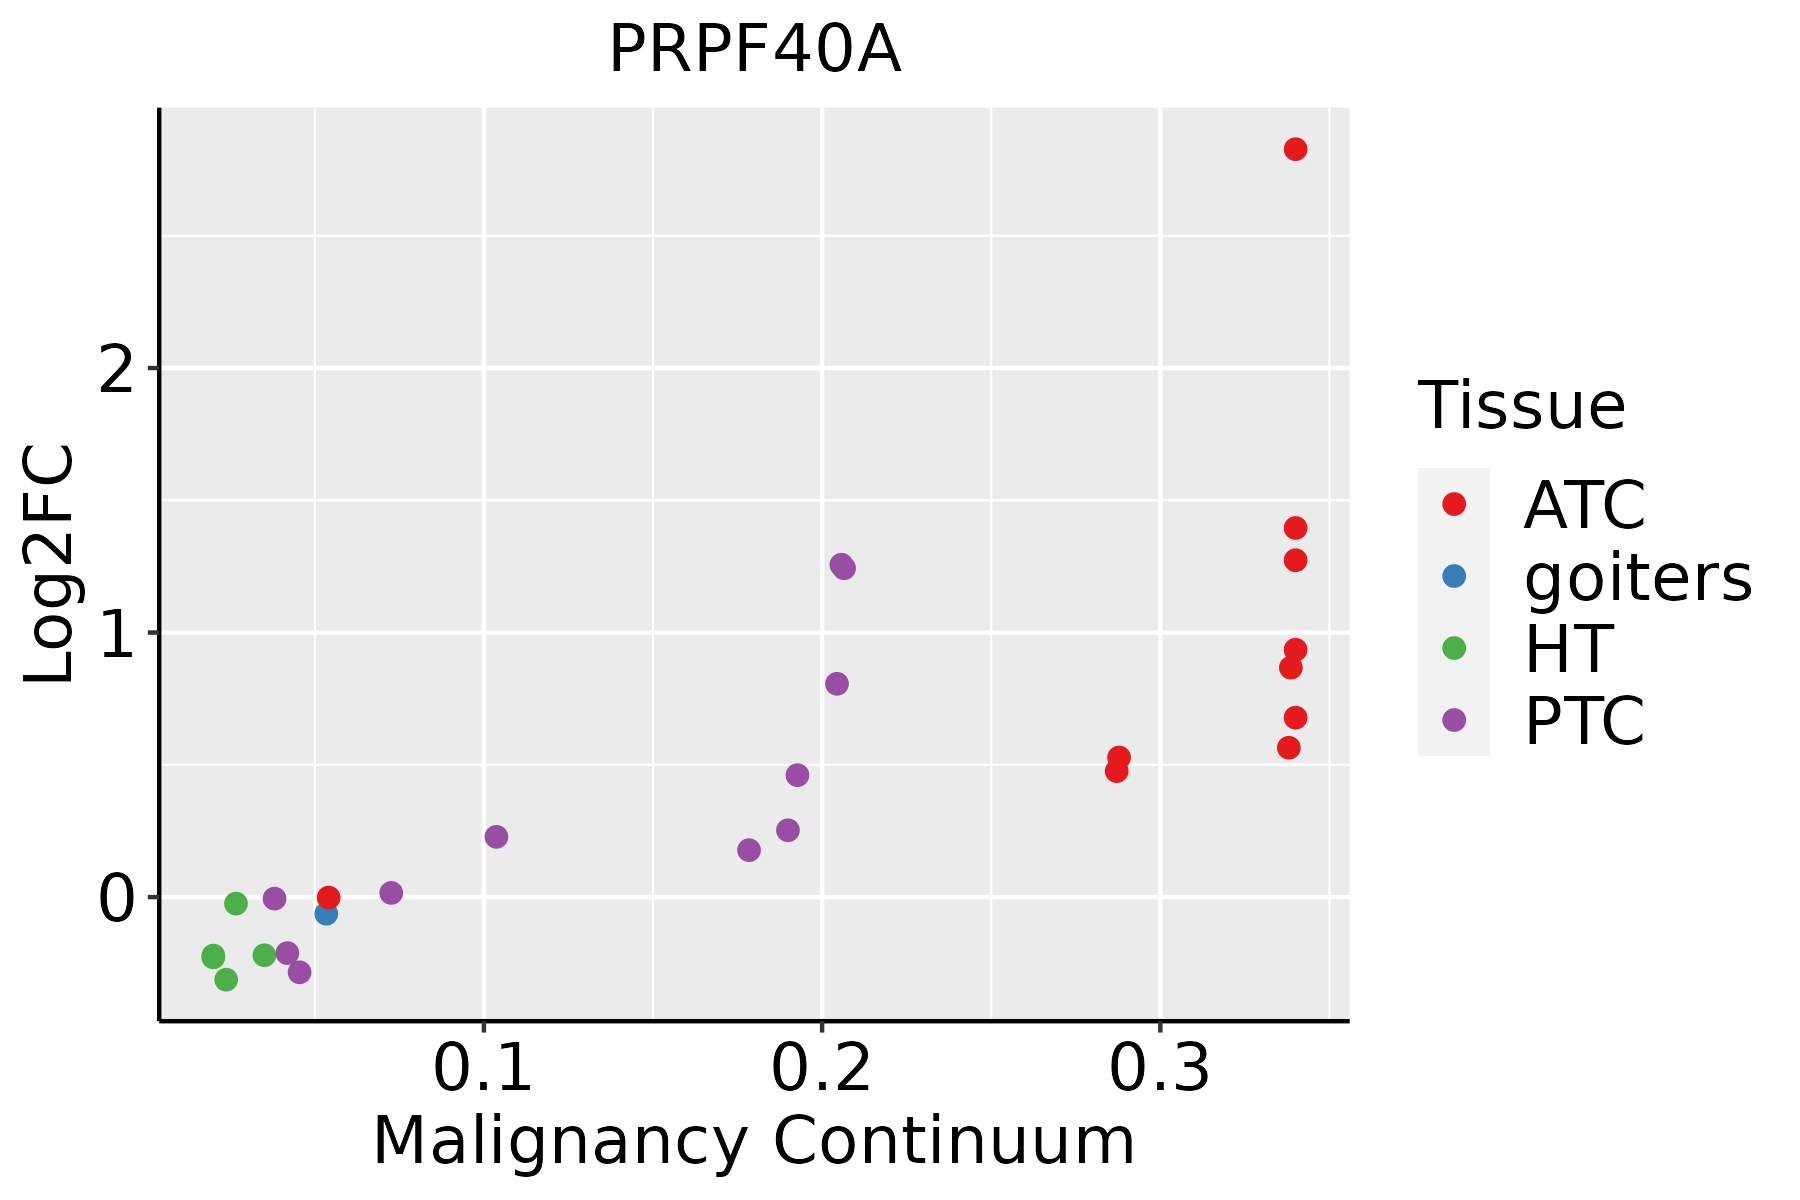 | ATC: Anaplastic thyroid cancer |
| HT: Hashimoto's thyroiditis | ||
| PTC: Papillary thyroid cancer |
| ∗log2FC in expression of this searched gene in stem-like cells from each diseased tissue sample relative to stem-like cells in normal samples in each tissue plotted against the malignancy continuum. Samples are colored based on if they are from different disease stage. |
Top |
Malignant transformation related pathway analysis |
| Find out the enriched GO biological processes and KEGG pathways involved in transition from healthy to precancer to cancer |
| Tissue | Disease Stage | Enriched GO biological Processes |
| Colorectum | AD |  |
| Colorectum | SER |  |
| Colorectum | MSS |  |
| Colorectum | MSI-H |  |
| Colorectum | FAP |  |
| ∗Top 15 enriched GO BP terms are showed in the bar plot of each disease state in each tissue. Each row represents a significant GO biological process which is colored according to the -log10(p.adjust). |
| Page: 1 2 3 4 5 6 7 8 9 |
| GO ID | Tissue | Disease Stage | Description | Gene Ratio | Bg Ratio | pvalue | p.adjust | Count |
| GO:00083809 | Breast | Precancer | RNA splicing | 65/1080 | 434/18723 | 1.27e-12 | 2.53e-10 | 65 |
| GO:00003759 | Breast | Precancer | RNA splicing, via transesterification reactions | 52/1080 | 324/18723 | 1.74e-11 | 2.22e-09 | 52 |
| GO:00003779 | Breast | Precancer | RNA splicing, via transesterification reactions with bulged adenosine as nucleophile | 51/1080 | 320/18723 | 3.55e-11 | 4.04e-09 | 51 |
| GO:00003989 | Breast | Precancer | mRNA splicing, via spliceosome | 51/1080 | 320/18723 | 3.55e-11 | 4.04e-09 | 51 |
| GO:00226049 | Breast | Precancer | regulation of cell morphogenesis | 29/1080 | 309/18723 | 6.88e-03 | 4.67e-02 | 29 |
| GO:000838014 | Breast | IDC | RNA splicing | 73/1434 | 434/18723 | 1.27e-10 | 1.57e-08 | 73 |
| GO:000037514 | Breast | IDC | RNA splicing, via transesterification reactions | 58/1434 | 324/18723 | 9.44e-10 | 9.58e-08 | 58 |
| GO:000037714 | Breast | IDC | RNA splicing, via transesterification reactions with bulged adenosine as nucleophile | 57/1434 | 320/18723 | 1.60e-09 | 1.49e-07 | 57 |
| GO:000039814 | Breast | IDC | mRNA splicing, via spliceosome | 57/1434 | 320/18723 | 1.60e-09 | 1.49e-07 | 57 |
| GO:000838024 | Breast | DCIS | RNA splicing | 73/1390 | 434/18723 | 3.05e-11 | 5.08e-09 | 73 |
| GO:000037524 | Breast | DCIS | RNA splicing, via transesterification reactions | 58/1390 | 324/18723 | 2.89e-10 | 3.34e-08 | 58 |
| GO:000037724 | Breast | DCIS | RNA splicing, via transesterification reactions with bulged adenosine as nucleophile | 57/1390 | 320/18723 | 5.01e-10 | 5.35e-08 | 57 |
| GO:000039824 | Breast | DCIS | mRNA splicing, via spliceosome | 57/1390 | 320/18723 | 5.01e-10 | 5.35e-08 | 57 |
| GO:0008380 | Colorectum | AD | RNA splicing | 169/3918 | 434/18723 | 3.59e-18 | 2.04e-15 | 169 |
| GO:0000377 | Colorectum | AD | RNA splicing, via transesterification reactions with bulged adenosine as nucleophile | 130/3918 | 320/18723 | 5.88e-16 | 2.16e-13 | 130 |
| GO:0000398 | Colorectum | AD | mRNA splicing, via spliceosome | 130/3918 | 320/18723 | 5.88e-16 | 2.16e-13 | 130 |
| GO:0000375 | Colorectum | AD | RNA splicing, via transesterification reactions | 131/3918 | 324/18723 | 7.11e-16 | 2.22e-13 | 131 |
| GO:0022604 | Colorectum | AD | regulation of cell morphogenesis | 109/3918 | 309/18723 | 3.08e-09 | 2.07e-07 | 109 |
| GO:0008360 | Colorectum | AD | regulation of cell shape | 56/3918 | 154/18723 | 7.01e-06 | 1.73e-04 | 56 |
| GO:0000910 | Colorectum | AD | cytokinesis | 59/3918 | 173/18723 | 3.74e-05 | 6.75e-04 | 59 |
| Page: 1 2 3 4 5 6 7 8 |
| Pathway ID | Tissue | Disease Stage | Description | Gene Ratio | Bg Ratio | pvalue | p.adjust | qvalue | Count |
| hsa030408 | Breast | Precancer | Spliceosome | 39/684 | 217/8465 | 1.44e-06 | 2.27e-05 | 1.74e-05 | 39 |
| hsa0304013 | Breast | Precancer | Spliceosome | 39/684 | 217/8465 | 1.44e-06 | 2.27e-05 | 1.74e-05 | 39 |
| hsa0304023 | Breast | IDC | Spliceosome | 40/867 | 217/8465 | 1.53e-04 | 1.42e-03 | 1.06e-03 | 40 |
| hsa0304033 | Breast | IDC | Spliceosome | 40/867 | 217/8465 | 1.53e-04 | 1.42e-03 | 1.06e-03 | 40 |
| hsa0304043 | Breast | DCIS | Spliceosome | 40/846 | 217/8465 | 8.97e-05 | 8.52e-04 | 6.28e-04 | 40 |
| hsa0304053 | Breast | DCIS | Spliceosome | 40/846 | 217/8465 | 8.97e-05 | 8.52e-04 | 6.28e-04 | 40 |
| hsa03040 | Colorectum | AD | Spliceosome | 73/2092 | 217/8465 | 1.73e-03 | 9.68e-03 | 6.18e-03 | 73 |
| hsa030401 | Colorectum | AD | Spliceosome | 73/2092 | 217/8465 | 1.73e-03 | 9.68e-03 | 6.18e-03 | 73 |
| hsa030409 | Endometrium | AEH | Spliceosome | 54/1197 | 217/8465 | 1.47e-05 | 1.65e-04 | 1.21e-04 | 54 |
| hsa0304014 | Endometrium | AEH | Spliceosome | 54/1197 | 217/8465 | 1.47e-05 | 1.65e-04 | 1.21e-04 | 54 |
| hsa0304024 | Endometrium | EEC | Spliceosome | 54/1237 | 217/8465 | 3.78e-05 | 3.88e-04 | 2.89e-04 | 54 |
| hsa0304034 | Endometrium | EEC | Spliceosome | 54/1237 | 217/8465 | 3.78e-05 | 3.88e-04 | 2.89e-04 | 54 |
| hsa0304018 | Esophagus | HGIN | Spliceosome | 79/1383 | 217/8465 | 3.22e-13 | 7.00e-12 | 5.56e-12 | 79 |
| hsa0304019 | Esophagus | HGIN | Spliceosome | 79/1383 | 217/8465 | 3.22e-13 | 7.00e-12 | 5.56e-12 | 79 |
| hsa0304027 | Esophagus | ESCC | Spliceosome | 128/4205 | 217/8465 | 3.31e-03 | 8.79e-03 | 4.50e-03 | 128 |
| hsa0304037 | Esophagus | ESCC | Spliceosome | 128/4205 | 217/8465 | 3.31e-03 | 8.79e-03 | 4.50e-03 | 128 |
| hsa030407 | Liver | Cirrhotic | Spliceosome | 102/2530 | 217/8465 | 5.69e-08 | 9.47e-07 | 5.84e-07 | 102 |
| hsa0304012 | Liver | Cirrhotic | Spliceosome | 102/2530 | 217/8465 | 5.69e-08 | 9.47e-07 | 5.84e-07 | 102 |
| hsa0304022 | Liver | HCC | Spliceosome | 122/4020 | 217/8465 | 5.55e-03 | 1.60e-02 | 8.91e-03 | 122 |
| hsa0304032 | Liver | HCC | Spliceosome | 122/4020 | 217/8465 | 5.55e-03 | 1.60e-02 | 8.91e-03 | 122 |
| Page: 1 2 |
Top |
Cell-cell communication analysis |
| Identification of potential cell-cell interactions between two cell types and their ligand-receptor pairs for different disease states |
| Ligand | Receptor | LRpair | Pathway | Tissue | Disease Stage |
| Page: 1 |
Top |
Single-cell gene regulatory network inference analysis |
| Find out the significant the regulons (TFs) and the target genes of each regulon across cell types for different disease states |
| TF | Cell Type | Tissue | Disease Stage | Target Gene | RSS | Regulon Activity |
| ∗The dot plots of a searched regulon are shown for all cell subpopulations in each disease state of each tissue based on the regulon specific score inferred using pySCENIC and by calculating the average expression. |
| Page: 1 |
Top |
Somatic mutation of malignant transformation related genes |
| Annotation of somatic variants for genes involved in malignant transformation |
| Hugo Symbol | Variant Class | Variant Classification | dbSNP RS | HGVSc | HGVSp | HGVSp Short | SWISSPROT | BIOTYPE | SIFT | PolyPhen | Tumor Sample Barcode | Tissue | Histology | Sex | Age | Stage | Therapy Types | Drugs | Outcome |
| PRPF40A | SNV | Missense_Mutation | novel | c.722N>G | p.Met241Arg | p.M241R | O75400 | protein_coding | tolerated(0.65) | benign(0.184) | TCGA-A7-A26H-01 | Breast | breast invasive carcinoma | Female | >=65 | I/II | Hormone Therapy | anastrozole | PD |
| PRPF40A | SNV | Missense_Mutation | c.2510G>T | p.Arg837Ile | p.R837I | O75400 | protein_coding | deleterious(0.02) | possibly_damaging(0.503) | TCGA-D8-A1JG-01 | Breast | breast invasive carcinoma | Female | <65 | I/II | Chemotherapy | doxorubicin | SD | |
| PRPF40A | SNV | Missense_Mutation | rs765112518 | c.742G>A | p.Glu248Lys | p.E248K | O75400 | protein_coding | tolerated(0.78) | benign(0) | TCGA-D8-A27G-01 | Breast | breast invasive carcinoma | Female | >=65 | I/II | Unknown | Unknown | SD |
| PRPF40A | SNV | Missense_Mutation | c.1098G>C | p.Lys366Asn | p.K366N | O75400 | protein_coding | deleterious(0) | possibly_damaging(0.835) | TCGA-E9-A1N9-01 | Breast | breast invasive carcinoma | Female | <65 | I/II | Chemotherapy | doxorubicin | SD | |
| PRPF40A | SNV | Missense_Mutation | c.2414N>T | p.Ser805Leu | p.S805L | O75400 | protein_coding | deleterious(0) | probably_damaging(0.916) | TCGA-EW-A1OZ-01 | Breast | breast invasive carcinoma | Female | <65 | I/II | Targeted Molecular therapy | trastuzumab | SD | |
| PRPF40A | SNV | Missense_Mutation | novel | c.1499G>A | p.Arg500Gln | p.R500Q | O75400 | protein_coding | deleterious(0.03) | probably_damaging(0.992) | TCGA-2W-A8YY-01 | Cervix | cervical & endocervical cancer | Female | <65 | I/II | Chemotherapy | cisplatin | CR |
| PRPF40A | SNV | Missense_Mutation | c.2422N>A | p.Asp808Asn | p.D808N | O75400 | protein_coding | tolerated(0.07) | benign(0.202) | TCGA-C5-A1BJ-01 | Cervix | cervical & endocervical cancer | Female | <65 | I/II | Unknown | Unknown | SD | |
| PRPF40A | SNV | Missense_Mutation | c.1618N>A | p.Glu540Lys | p.E540K | O75400 | protein_coding | tolerated(0.46) | possibly_damaging(0.81) | TCGA-EK-A2RN-01 | Cervix | cervical & endocervical cancer | Female | <65 | I/II | Unknown | Unknown | SD | |
| PRPF40A | SNV | Missense_Mutation | novel | c.2203N>A | p.Glu735Lys | p.E735K | O75400 | protein_coding | deleterious(0.01) | probably_damaging(0.981) | TCGA-LP-A4AU-01 | Cervix | cervical & endocervical cancer | Female | <65 | III/IV | Chemotherapy | cisplatin | CR |
| PRPF40A | SNV | Missense_Mutation | c.1205G>C | p.Ser402Thr | p.S402T | O75400 | protein_coding | tolerated(0.12) | probably_damaging(0.964) | TCGA-A6-A567-01 | Colorectum | colon adenocarcinoma | Male | <65 | III/IV | Unknown | Unknown | PD |
| Page: 1 2 3 4 5 6 7 8 9 |
Top |
Related drugs of malignant transformation related genes |
| Identification of chemicals and drugs interact with genes involved in malignant transfromation |
| (DGIdb 4.0) |
| Entrez ID | Symbol | Category | Interaction Types | Drug Claim Name | Drug Name | PMIDs |
| Page: 1 |

Copyright 2023-Present -The University of Texas Health Science Center at Houston |