
|
|||||
|
 | |
| |
| |
| |
| |
| |
|
Gene: PPA1 |
Gene summary for PPA1 |
| Gene information | Species | Human | Gene symbol | PPA1 | Gene ID | 5464 |
| Gene name | inorganic pyrophosphatase 1 | |
| Gene Alias | HEL-S-66p | |
| Cytomap | 10q22.1 | |
| Gene Type | protein-coding | GO ID | GO:0006793 | UniProtAcc | Q15181 |
Top |
Malignant transformation analysis |
| Identification of the aberrant gene expression in precancerous and cancerous lesions by comparing the gene expression of stem-like cells in diseased tissues with normal stem cells |
| Entrez ID | Symbol | Replicates | Species | Organ | Tissue | Adj P-value | Log2FC | Malignancy |
| 5464 | PPA1 | Dong_P3 | Human | Prostate | Tumor | 1.45e-13 | -1.14e-01 | 0.0278 |
| 5464 | PPA1 | Dong_P4 | Human | Prostate | Tumor | 2.34e-02 | 8.64e-02 | 0.0292 |
| 5464 | PPA1 | Dong_P5 | Human | Prostate | Tumor | 1.54e-15 | 6.18e-02 | 0.053 |
| 5464 | PPA1 | P9 | Human | Prostate | Tumor | 4.20e-07 | -5.83e-01 | -0.0285 |
| 5464 | PPA1 | GSM5353221_PA_PB2A_Pool_1_3_S25_L001 | Human | Prostate | Tumor | 2.62e-02 | -4.54e-01 | 0.1633 |
| 5464 | PPA1 | GSM5353222_PA_PB2B_Pool_1_3_S52_L002 | Human | Prostate | Tumor | 4.25e-02 | -3.51e-01 | 0.1608 |
| 5464 | PPA1 | GSM5353227_PA_PR5199-193K_Pool_1_2_3_S55_L002 | Human | Prostate | Tumor | 1.49e-06 | -4.66e-01 | 0.1602 |
| 5464 | PPA1 | GSM5353228_PA_PR5199-640K_Pool_1_3_S108_L004 | Human | Prostate | Tumor | 3.63e-03 | -8.84e-01 | 0.1537 |
| 5464 | PPA1 | GSM5353240_PA_PR5254_T1_S15_L001 | Human | Prostate | Tumor | 4.49e-12 | -5.84e-01 | 0.1575 |
| 5464 | PPA1 | GSM5353243_PA_PR5261_T1_S23_L002 | Human | Prostate | Tumor | 4.14e-15 | -4.21e-01 | 0.1545 |
| 5464 | PPA1 | GSM5353244_PA_PR5261_T2_S24_L002 | Human | Prostate | Tumor | 1.20e-10 | -3.81e-01 | 0.1569 |
| 5464 | PPA1 | GSM5353247_PA_PR5269_3_S27_L002 | Human | Prostate | Tumor | 1.74e-02 | -8.84e-01 | 0.1532 |
| 5464 | PPA1 | P4_S8_cSCC | Human | Skin | cSCC | 2.68e-07 | 1.46e-01 | -0.3095 |
| 5464 | PPA1 | P5_S10_cSCC | Human | Skin | cSCC | 2.95e-12 | 1.27e-01 | -0.299 |
| 5464 | PPA1 | P1_cSCC | Human | Skin | cSCC | 3.73e-61 | 2.46e+00 | 0.0292 |
| 5464 | PPA1 | P2_cSCC | Human | Skin | cSCC | 1.13e-35 | 1.40e+00 | -0.024 |
| 5464 | PPA1 | P4_cSCC | Human | Skin | cSCC | 6.67e-67 | 2.06e+00 | -0.00290000000000005 |
| 5464 | PPA1 | P10_cSCC | Human | Skin | cSCC | 5.07e-52 | 1.97e+00 | 0.1017 |
| 5464 | PPA1 | cSCC_p4 | Human | Skin | cSCC | 4.34e-02 | 5.74e-02 | -0.2022 |
| 5464 | PPA1 | cSCC_p7 | Human | Skin | cSCC | 1.09e-06 | -3.82e-01 | -0.2332 |
| Page: 1 2 3 4 5 6 7 8 9 10 11 12 13 14 |
| Tissue | Expression Dynamics | Abbreviation |
| Breast | 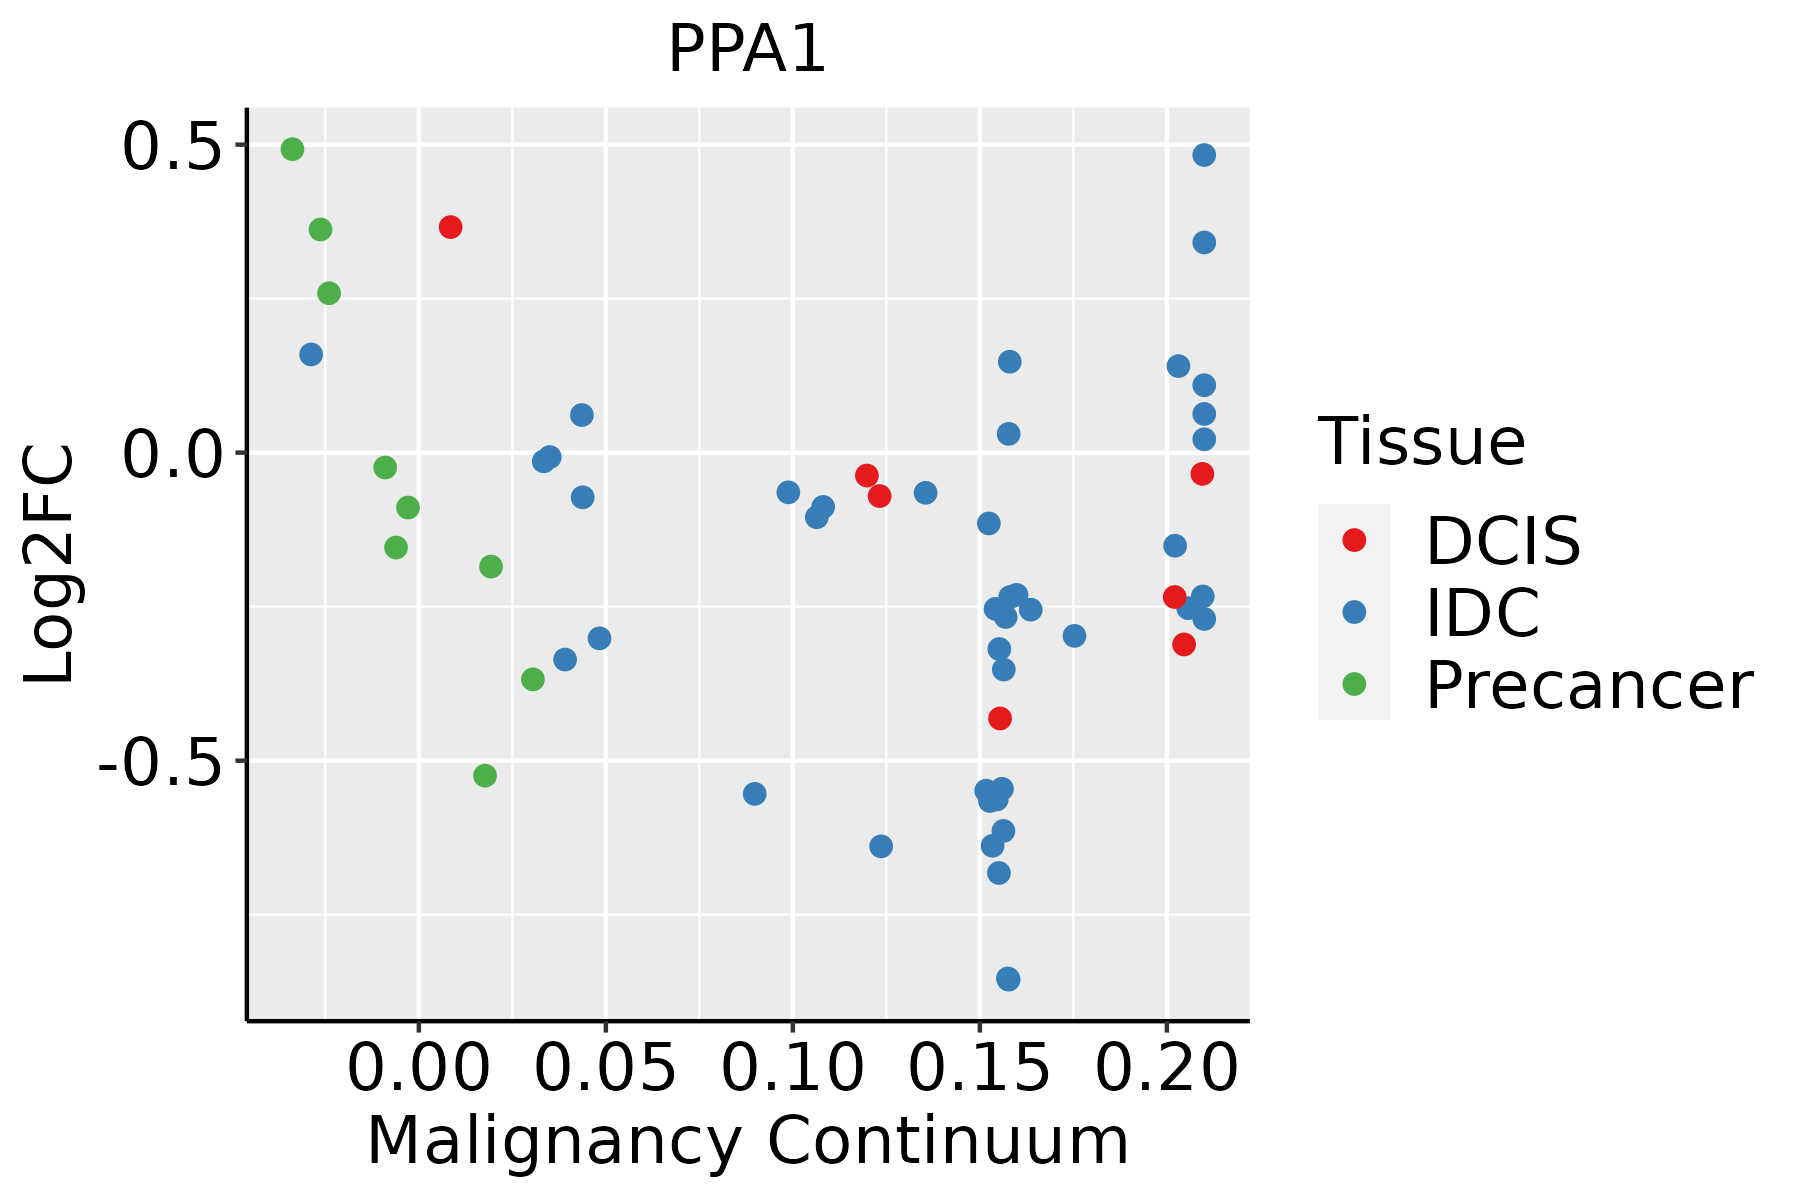 | IDC: Invasive ductal carcinoma |
| DCIS: Ductal carcinoma in situ | ||
| Precancer(BRCA1-mut): Precancerous lesion from BRCA1 mutation carriers | ||
| Cervix | 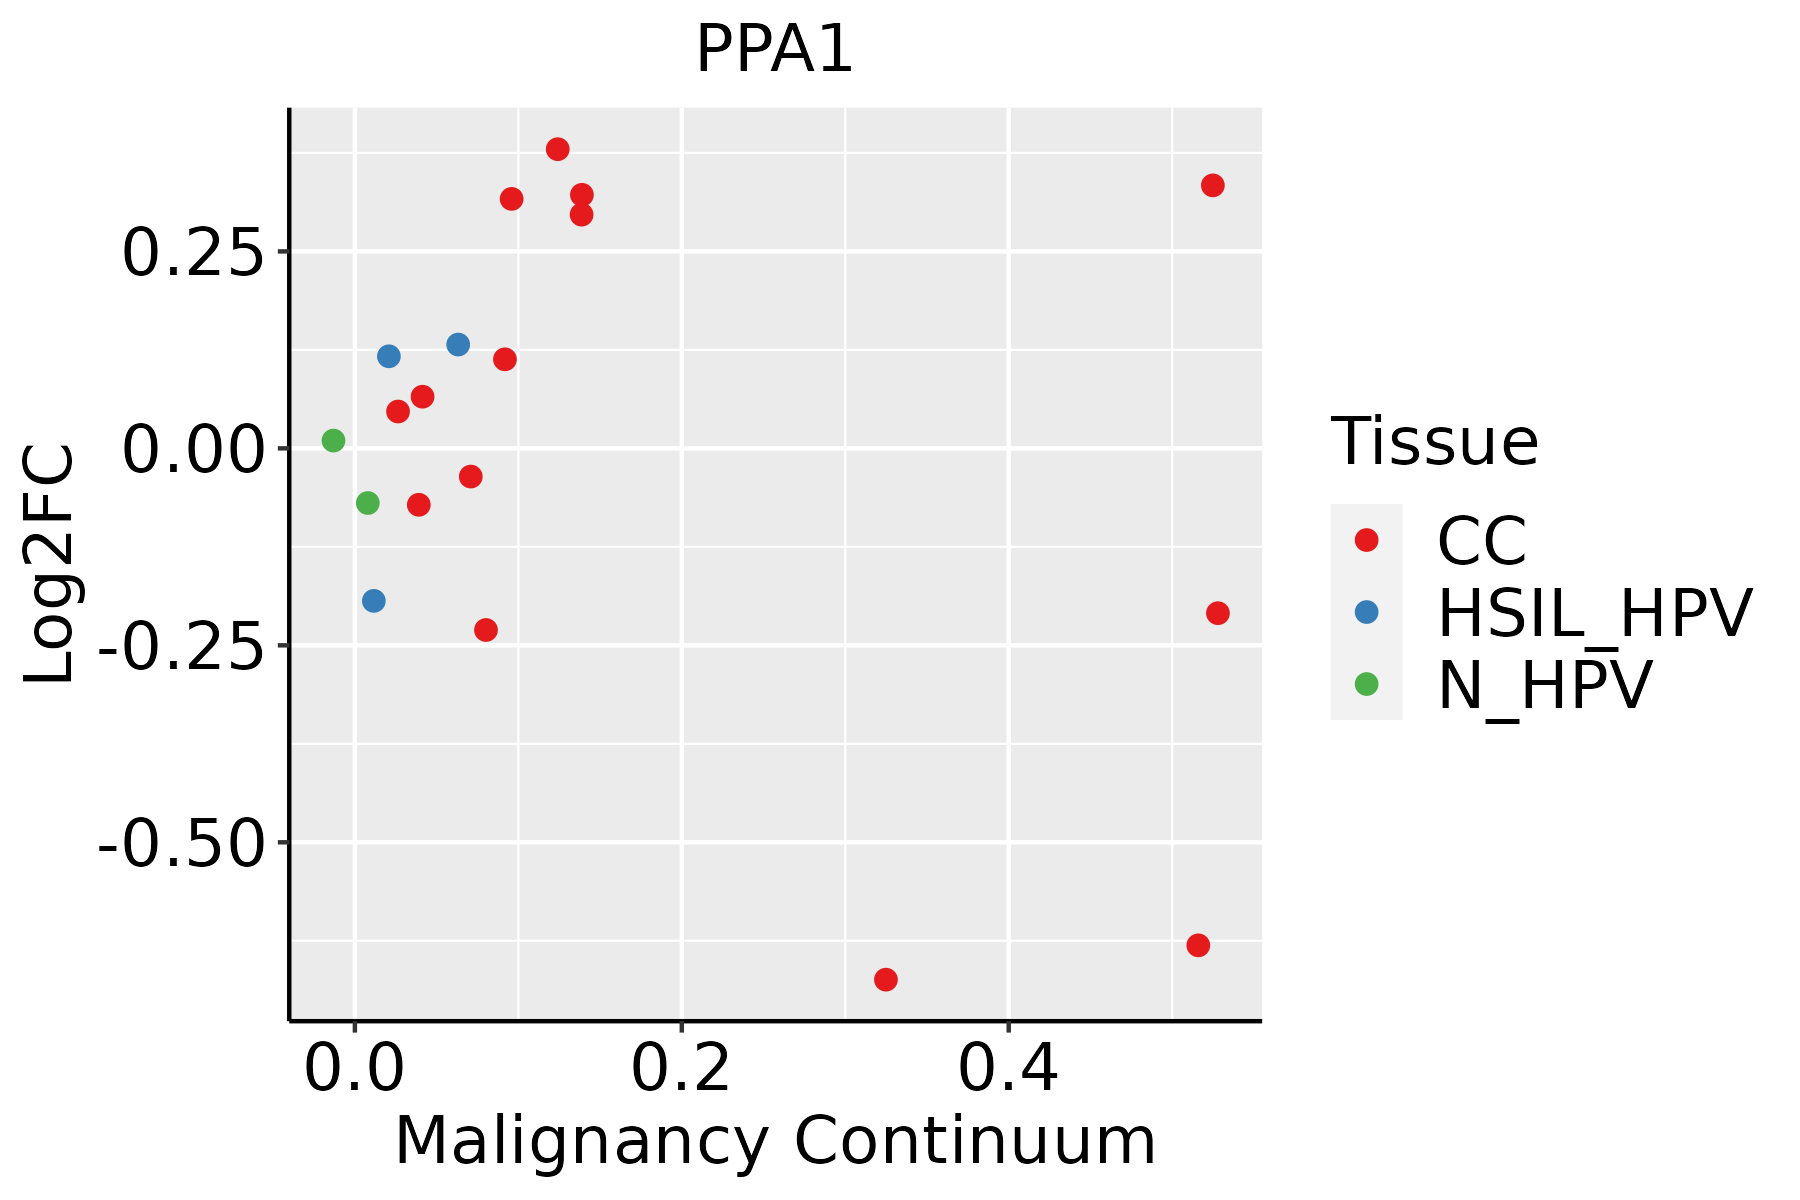 | CC: Cervix cancer |
| HSIL_HPV: HPV-infected high-grade squamous intraepithelial lesions | ||
| N_HPV: HPV-infected normal cervix | ||
| Colorectum (GSE201348) | 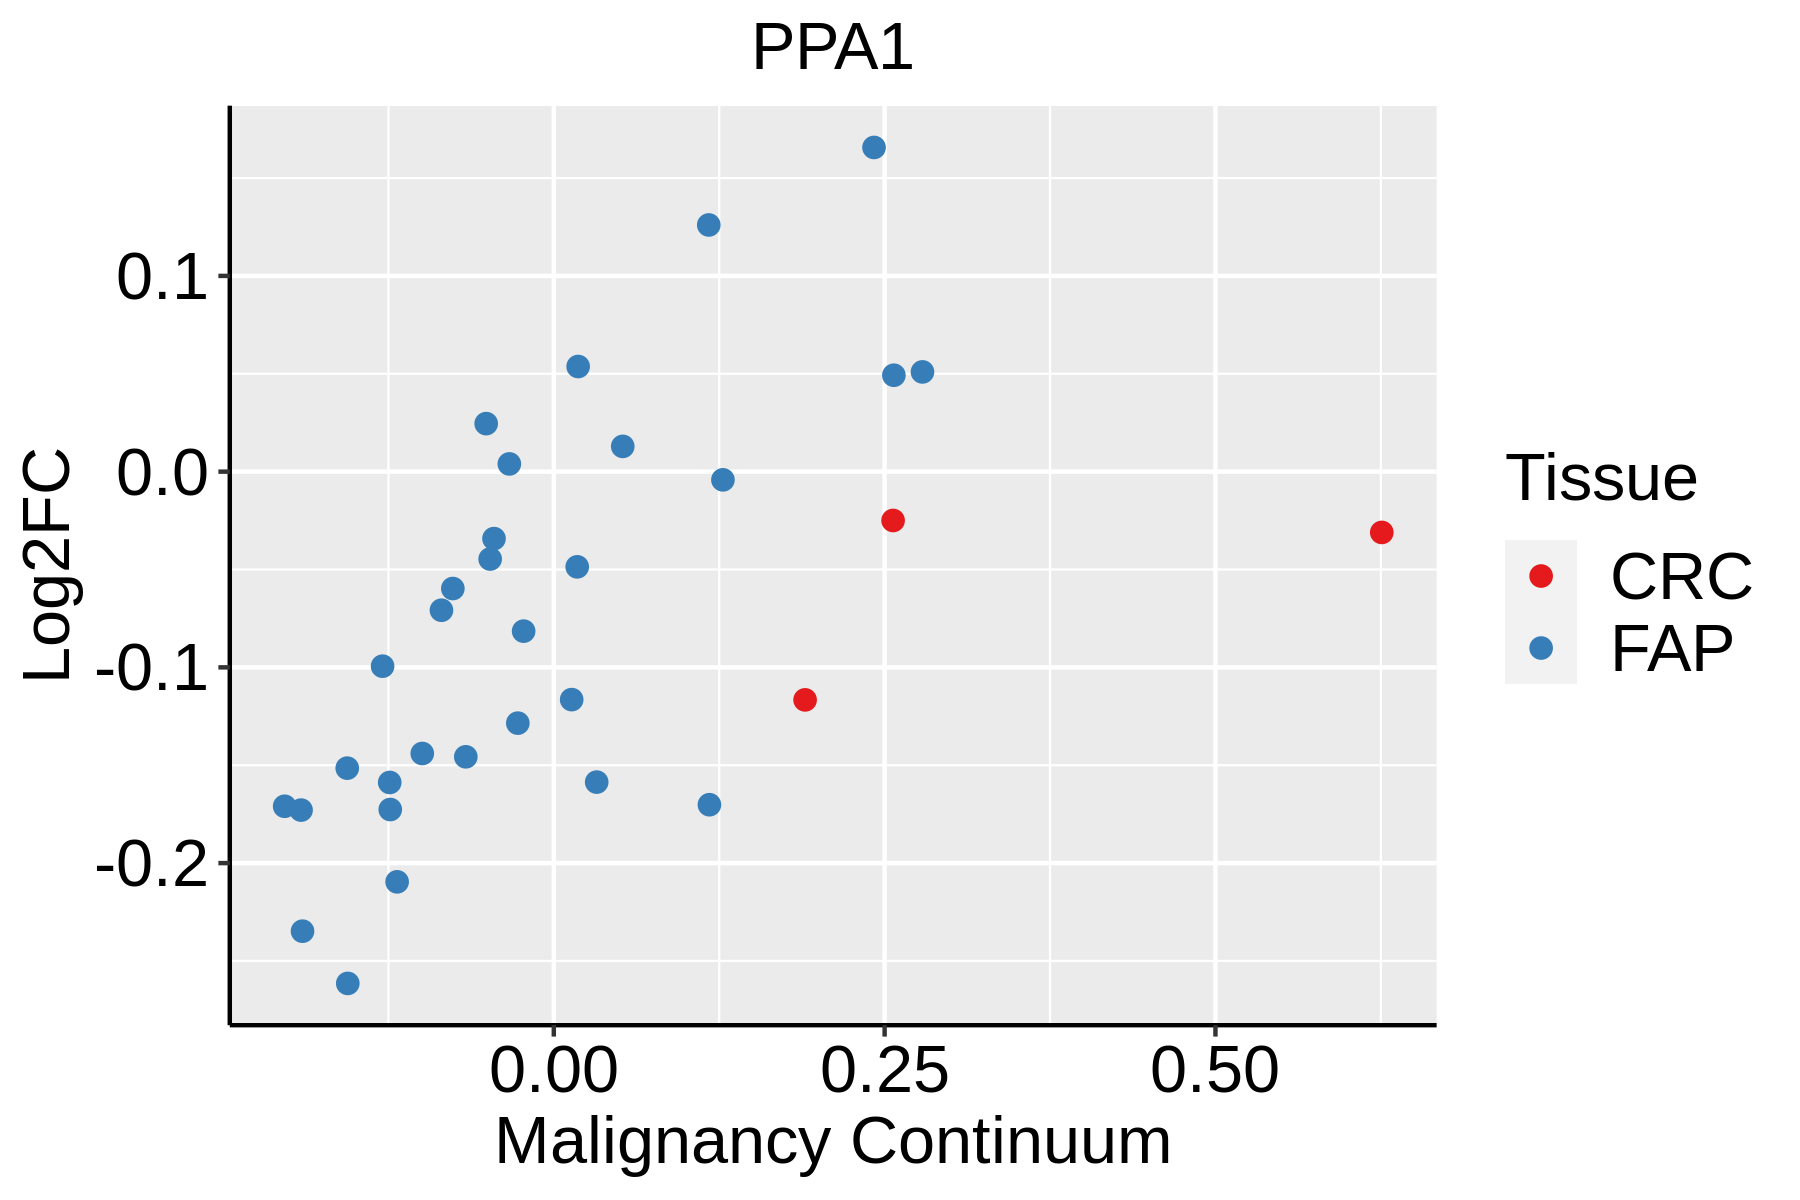 | FAP: Familial adenomatous polyposis |
| CRC: Colorectal cancer | ||
| Colorectum (HTA11) |  | AD: Adenomas |
| SER: Sessile serrated lesions | ||
| MSI-H: Microsatellite-high colorectal cancer | ||
| MSS: Microsatellite stable colorectal cancer | ||
| Endometrium |  | AEH: Atypical endometrial hyperplasia |
| EEC: Endometrioid Cancer | ||
| Esophagus |  | ESCC: Esophageal squamous cell carcinoma |
| HGIN: High-grade intraepithelial neoplasias | ||
| LGIN: Low-grade intraepithelial neoplasias | ||
| GC | 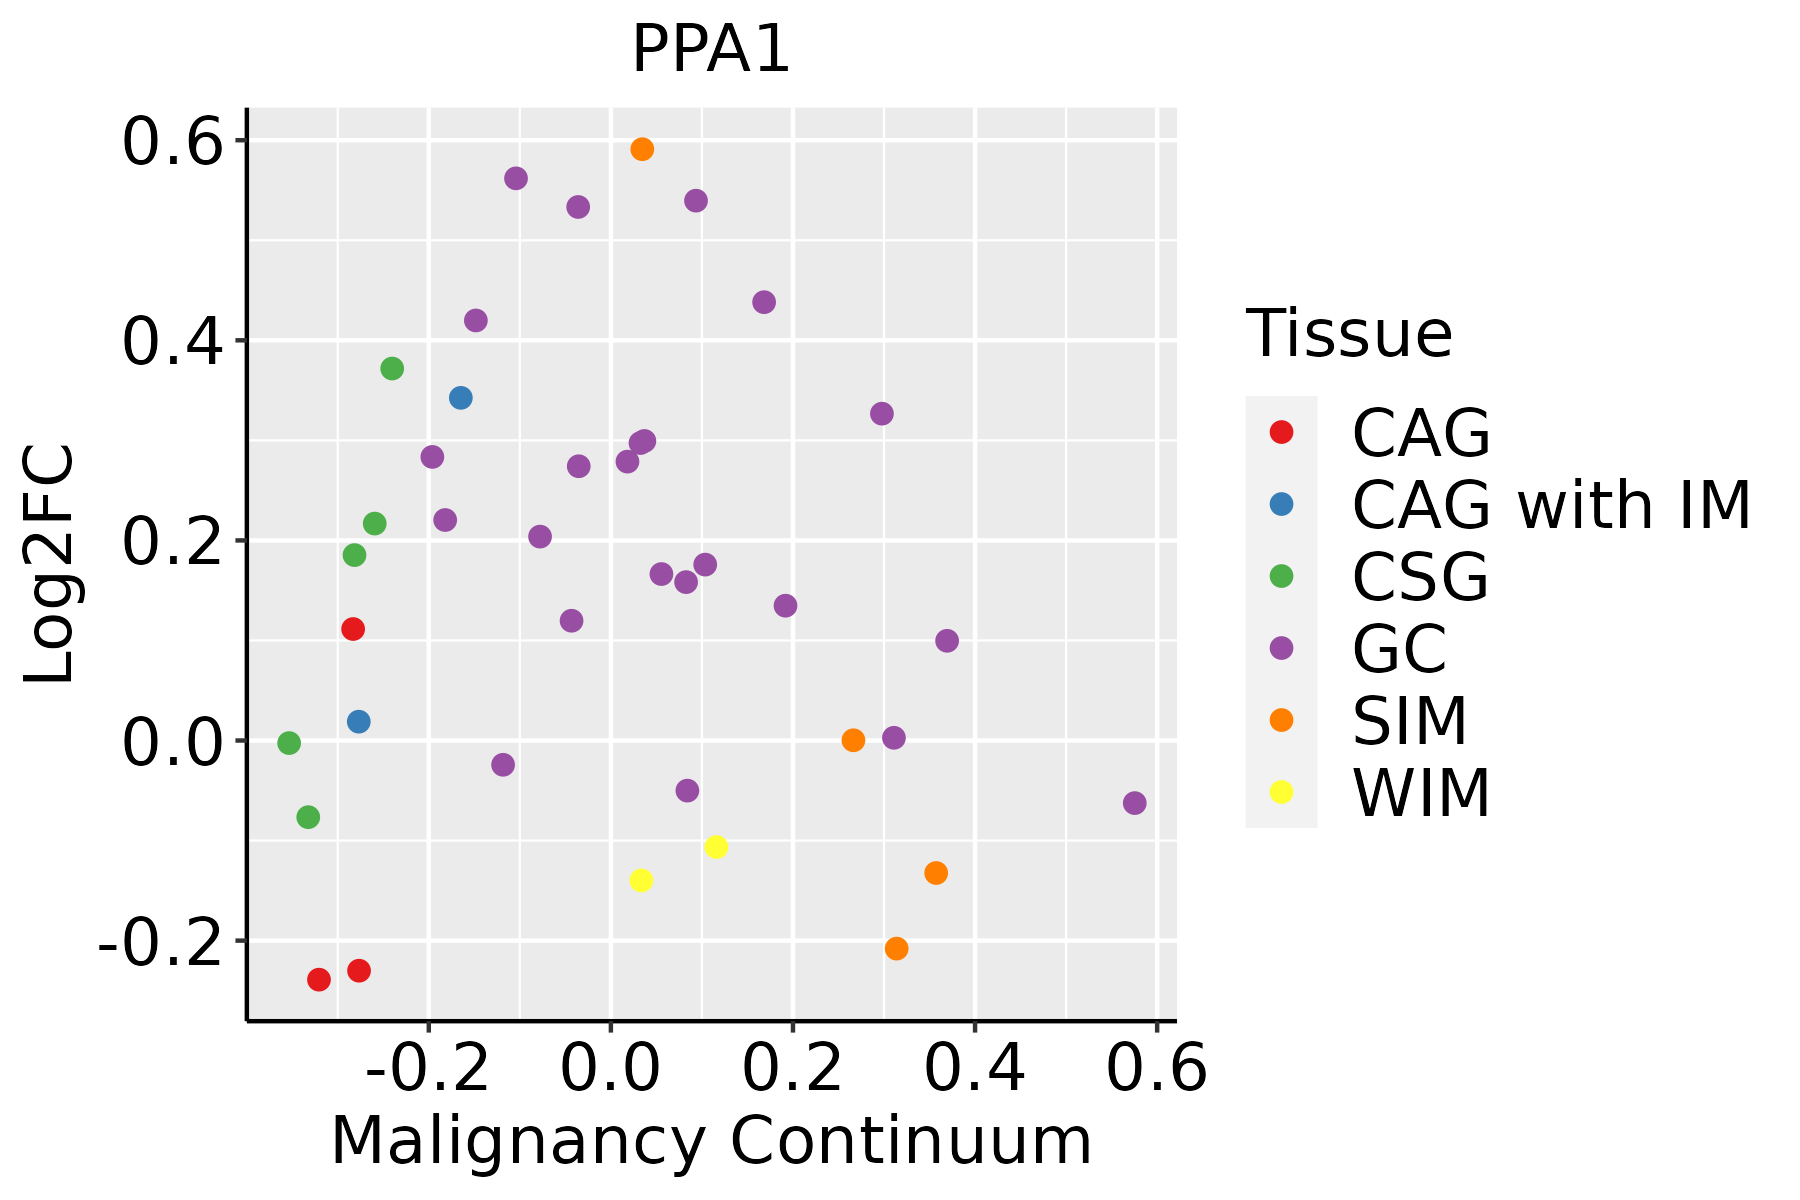 | CAG: Chronic atrophic gastritis |
| CAG with IM: Chronic atrophic gastritis with intestinal metaplasia | ||
| CSG: Chronic superficial gastritis | ||
| GC: Gastric cancer | ||
| SIM: Severe intestinal metaplasia | ||
| WIM: Wild intestinal metaplasia | ||
| Liver |  | HCC: Hepatocellular carcinoma |
| NAFLD: Non-alcoholic fatty liver disease | ||
| Oral Cavity |  | EOLP: Erosive Oral lichen planus |
| LP: leukoplakia | ||
| NEOLP: Non-erosive oral lichen planus | ||
| OSCC: Oral squamous cell carcinoma | ||
| Prostate | 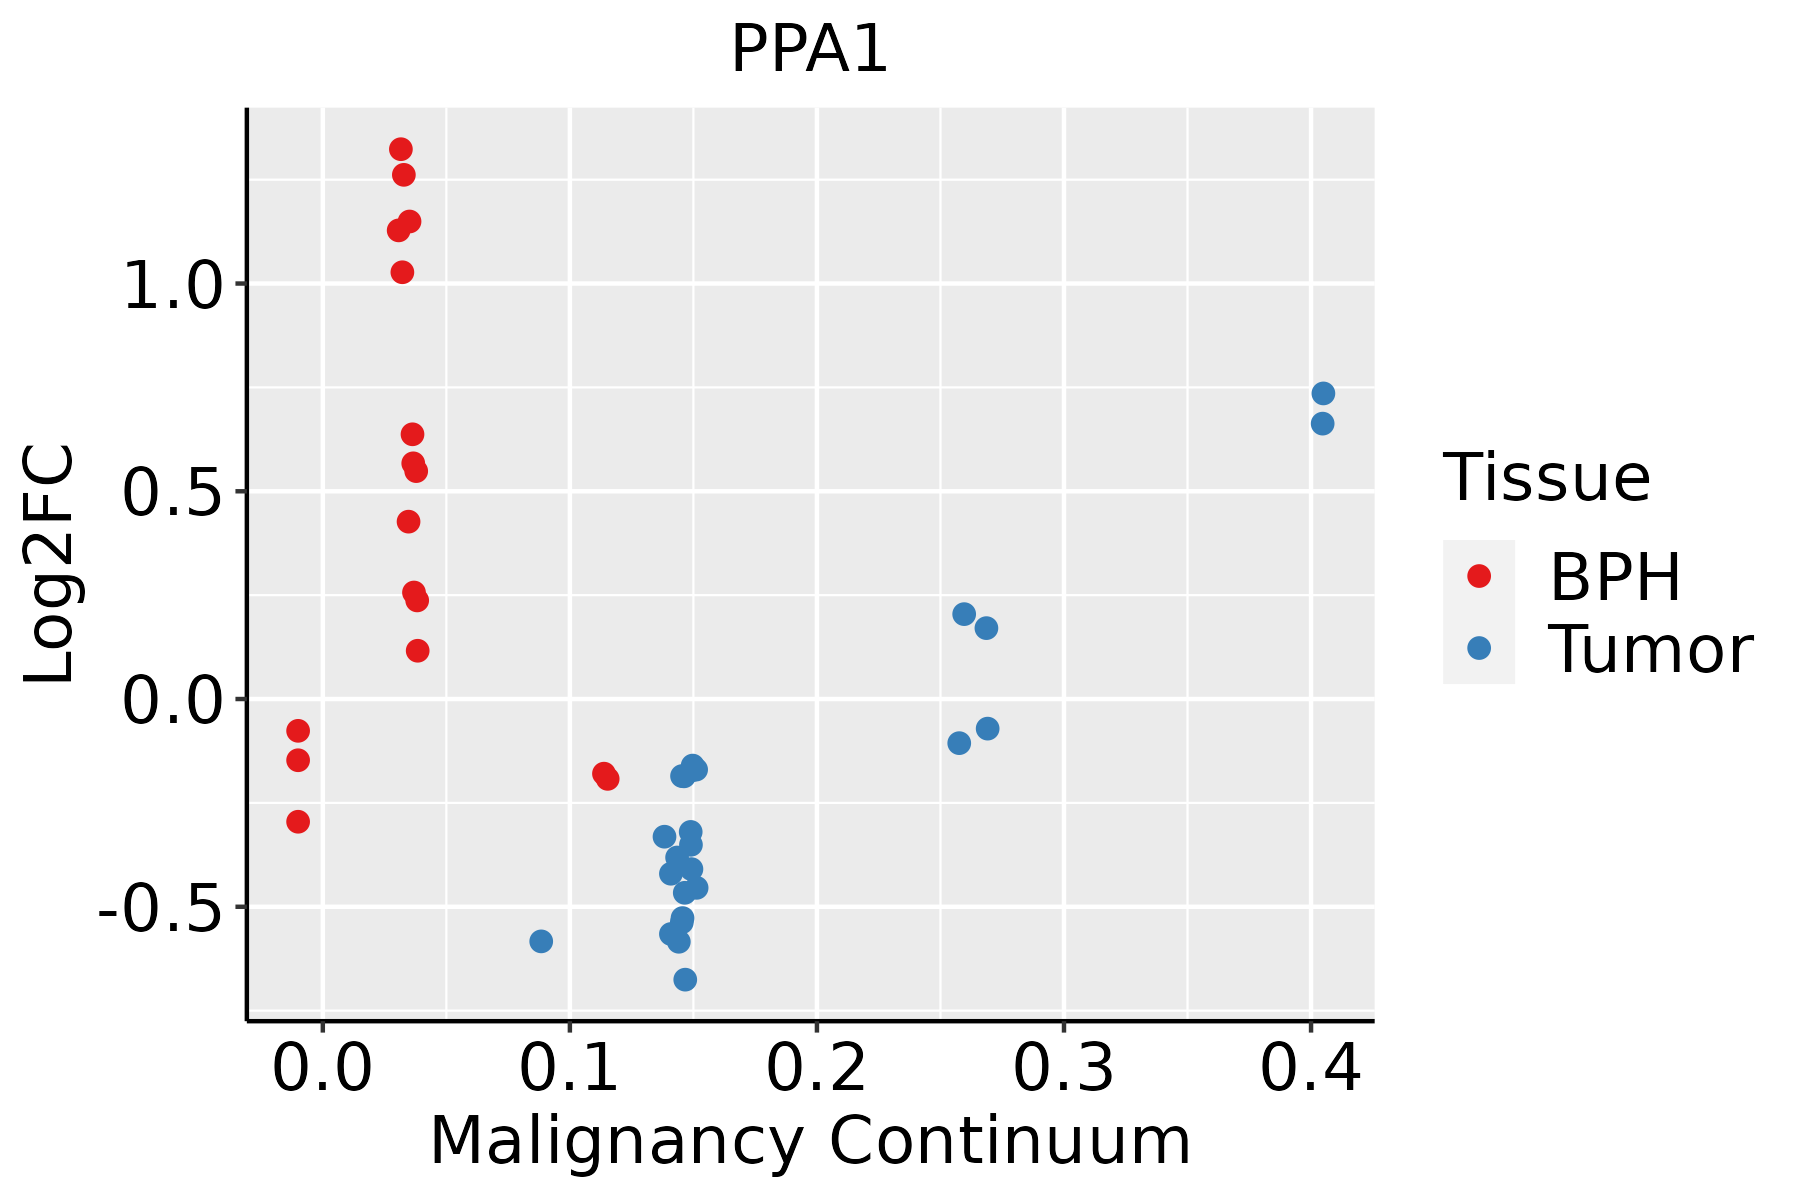 | BPH: Benign Prostatic Hyperplasia |
| Skin |  | AK: Actinic keratosis |
| cSCC: Cutaneous squamous cell carcinoma | ||
| SCCIS:squamous cell carcinoma in situ | ||
| Thyroid | 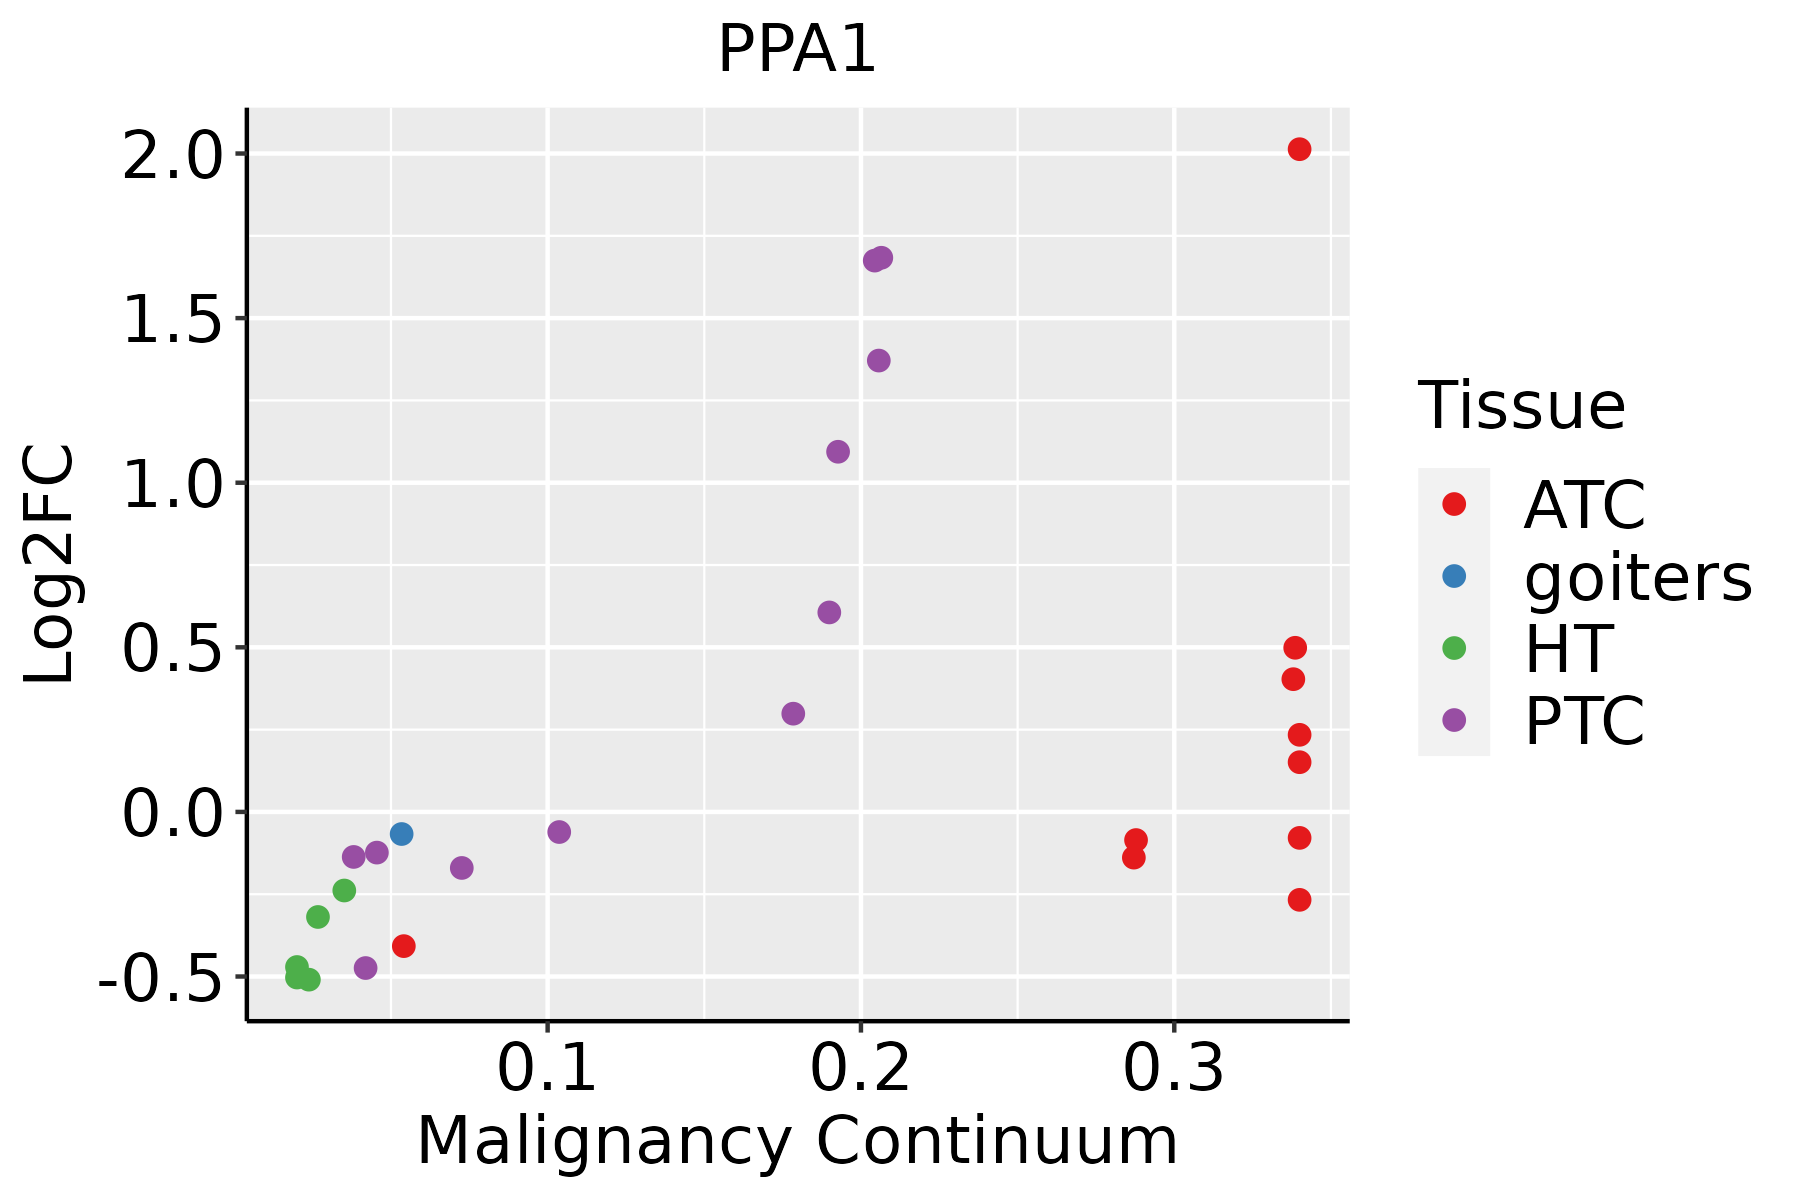 | ATC: Anaplastic thyroid cancer |
| HT: Hashimoto's thyroiditis | ||
| PTC: Papillary thyroid cancer |
| ∗log2FC in expression of this searched gene in stem-like cells from each diseased tissue sample relative to stem-like cells in normal samples in each tissue plotted against the malignancy continuum. Samples are colored based on if they are from different disease stage. |
Top |
Malignant transformation related pathway analysis |
| Find out the enriched GO biological processes and KEGG pathways involved in transition from healthy to precancer to cancer |
| Tissue | Disease Stage | Enriched GO biological Processes |
| Colorectum | AD |  |
| Colorectum | SER |  |
| Colorectum | MSS |  |
| Colorectum | MSI-H |  |
| Colorectum | FAP |  |
| ∗Top 15 enriched GO BP terms are showed in the bar plot of each disease state in each tissue. Each row represents a significant GO biological process which is colored according to the -log10(p.adjust). |
| Page: 1 2 3 4 5 6 7 8 9 |
| GO ID | Tissue | Disease Stage | Description | Gene Ratio | Bg Ratio | pvalue | p.adjust | Count |
| Page: 1 |
| Pathway ID | Tissue | Disease Stage | Description | Gene Ratio | Bg Ratio | pvalue | p.adjust | qvalue | Count |
| hsa0019016 | Breast | Precancer | Oxidative phosphorylation | 59/684 | 134/8465 | 6.15e-30 | 3.24e-28 | 2.48e-28 | 59 |
| hsa0019017 | Breast | Precancer | Oxidative phosphorylation | 59/684 | 134/8465 | 6.15e-30 | 3.24e-28 | 2.48e-28 | 59 |
| hsa0019023 | Breast | IDC | Oxidative phosphorylation | 62/867 | 134/8465 | 4.78e-27 | 2.59e-25 | 1.94e-25 | 62 |
| hsa0019033 | Breast | IDC | Oxidative phosphorylation | 62/867 | 134/8465 | 4.78e-27 | 2.59e-25 | 1.94e-25 | 62 |
| hsa0019043 | Breast | DCIS | Oxidative phosphorylation | 61/846 | 134/8465 | 9.84e-27 | 5.30e-25 | 3.90e-25 | 61 |
| hsa0019053 | Breast | DCIS | Oxidative phosphorylation | 61/846 | 134/8465 | 9.84e-27 | 5.30e-25 | 3.90e-25 | 61 |
| hsa0019018 | Cervix | CC | Oxidative phosphorylation | 64/1267 | 134/8465 | 1.25e-19 | 8.07e-18 | 4.77e-18 | 64 |
| hsa0019019 | Cervix | CC | Oxidative phosphorylation | 64/1267 | 134/8465 | 1.25e-19 | 8.07e-18 | 4.77e-18 | 64 |
| hsa0019044 | Cervix | N_HPV | Oxidative phosphorylation | 25/349 | 134/8465 | 1.50e-10 | 6.81e-09 | 5.33e-09 | 25 |
| hsa0019054 | Cervix | N_HPV | Oxidative phosphorylation | 25/349 | 134/8465 | 1.50e-10 | 6.81e-09 | 5.33e-09 | 25 |
| hsa00190 | Colorectum | AD | Oxidative phosphorylation | 86/2092 | 134/8465 | 2.47e-22 | 2.76e-20 | 1.76e-20 | 86 |
| hsa001901 | Colorectum | AD | Oxidative phosphorylation | 86/2092 | 134/8465 | 2.47e-22 | 2.76e-20 | 1.76e-20 | 86 |
| hsa001902 | Colorectum | SER | Oxidative phosphorylation | 79/1580 | 134/8465 | 1.98e-25 | 1.64e-23 | 1.19e-23 | 79 |
| hsa001903 | Colorectum | SER | Oxidative phosphorylation | 79/1580 | 134/8465 | 1.98e-25 | 1.64e-23 | 1.19e-23 | 79 |
| hsa001904 | Colorectum | MSS | Oxidative phosphorylation | 79/1875 | 134/8465 | 1.89e-20 | 7.90e-19 | 4.84e-19 | 79 |
| hsa001905 | Colorectum | MSS | Oxidative phosphorylation | 79/1875 | 134/8465 | 1.89e-20 | 7.90e-19 | 4.84e-19 | 79 |
| hsa001906 | Colorectum | MSI-H | Oxidative phosphorylation | 47/797 | 134/8465 | 2.13e-16 | 6.27e-15 | 5.26e-15 | 47 |
| hsa001907 | Colorectum | MSI-H | Oxidative phosphorylation | 47/797 | 134/8465 | 2.13e-16 | 6.27e-15 | 5.26e-15 | 47 |
| hsa001908 | Colorectum | FAP | Oxidative phosphorylation | 44/1404 | 134/8465 | 2.56e-06 | 4.28e-05 | 2.60e-05 | 44 |
| hsa001909 | Colorectum | FAP | Oxidative phosphorylation | 44/1404 | 134/8465 | 2.56e-06 | 4.28e-05 | 2.60e-05 | 44 |
| Page: 1 2 3 |
Top |
Cell-cell communication analysis |
| Identification of potential cell-cell interactions between two cell types and their ligand-receptor pairs for different disease states |
| Ligand | Receptor | LRpair | Pathway | Tissue | Disease Stage |
| Page: 1 |
Top |
Single-cell gene regulatory network inference analysis |
| Find out the significant the regulons (TFs) and the target genes of each regulon across cell types for different disease states |
| TF | Cell Type | Tissue | Disease Stage | Target Gene | RSS | Regulon Activity |
| ∗The dot plots of a searched regulon are shown for all cell subpopulations in each disease state of each tissue based on the regulon specific score inferred using pySCENIC and by calculating the average expression. |
| Page: 1 |
Top |
Somatic mutation of malignant transformation related genes |
| Annotation of somatic variants for genes involved in malignant transformation |
| Hugo Symbol | Variant Class | Variant Classification | dbSNP RS | HGVSc | HGVSp | HGVSp Short | SWISSPROT | BIOTYPE | SIFT | PolyPhen | Tumor Sample Barcode | Tissue | Histology | Sex | Age | Stage | Therapy Types | Drugs | Outcome |
| PPA1 | SNV | Missense_Mutation | c.550G>A | p.Glu184Lys | p.E184K | Q15181 | protein_coding | tolerated(0.29) | benign(0.03) | TCGA-A2-A0YK-01 | Breast | breast invasive carcinoma | Female | <65 | I/II | Chemotherapy | cytoxan | SD | |
| PPA1 | SNV | Missense_Mutation | c.159G>T | p.Trp53Cys | p.W53C | Q15181 | protein_coding | deleterious(0) | probably_damaging(0.999) | TCGA-A7-A13D-01 | Breast | breast invasive carcinoma | Female | <65 | I/II | Chemotherapy | cytoxan | SD | |
| PPA1 | SNV | Missense_Mutation | rs777717226 | c.235N>T | p.Arg79Cys | p.R79C | Q15181 | protein_coding | deleterious(0) | probably_damaging(0.999) | TCGA-AN-A046-01 | Breast | breast invasive carcinoma | Female | >=65 | I/II | Unknown | Unknown | SD |
| PPA1 | SNV | Missense_Mutation | rs867668532 | c.8G>A | p.Gly3Asp | p.G3D | Q15181 | protein_coding | tolerated(0.59) | benign(0.017) | TCGA-AO-A128-01 | Breast | breast invasive carcinoma | Female | <65 | I/II | Chemotherapy | doxorubicin | SD |
| PPA1 | SNV | Missense_Mutation | rs766193453 | c.559G>A | p.Val187Met | p.V187M | Q15181 | protein_coding | tolerated(0.11) | probably_damaging(0.912) | TCGA-BH-A0EE-01 | Breast | breast invasive carcinoma | Female | >=65 | I/II | Chemotherapy | docetaxel | SD |
| PPA1 | SNV | Missense_Mutation | rs146821187 | c.412N>A | p.Val138Met | p.V138M | Q15181 | protein_coding | deleterious(0.01) | probably_damaging(0.967) | TCGA-A6-5665-01 | Colorectum | colon adenocarcinoma | Female | >=65 | I/II | Unknown | Unknown | PD |
| PPA1 | SNV | Missense_Mutation | rs11538284 | c.457N>A | p.Asp153Asn | p.D153N | Q15181 | protein_coding | deleterious(0.02) | probably_damaging(0.915) | TCGA-AA-3977-01 | Colorectum | colon adenocarcinoma | Male | >=65 | I/II | Unknown | Unknown | SD |
| PPA1 | SNV | Missense_Mutation | c.701N>G | p.Lys234Arg | p.K234R | Q15181 | protein_coding | tolerated(0.08) | benign(0.03) | TCGA-AA-A00N-01 | Colorectum | colon adenocarcinoma | Male | >=65 | I/II | Unknown | Unknown | PD | |
| PPA1 | SNV | Missense_Mutation | novel | c.310N>T | p.Pro104Ser | p.P104S | Q15181 | protein_coding | deleterious(0.02) | probably_damaging(0.937) | TCGA-A5-A0G2-01 | Endometrium | uterine corpus endometrioid carcinoma | Female | <65 | III/IV | Unknown | Unknown | SD |
| PPA1 | SNV | Missense_Mutation | rs777717226 | c.235N>T | p.Arg79Cys | p.R79C | Q15181 | protein_coding | deleterious(0) | probably_damaging(0.999) | TCGA-A5-A0G2-01 | Endometrium | uterine corpus endometrioid carcinoma | Female | <65 | III/IV | Unknown | Unknown | SD |
| Page: 1 2 |
Top |
Related drugs of malignant transformation related genes |
| Identification of chemicals and drugs interact with genes involved in malignant transfromation |
| (DGIdb 4.0) |
| Entrez ID | Symbol | Category | Interaction Types | Drug Claim Name | Drug Name | PMIDs |
| 5464 | PPA1 | ENZYME | ETHANOL | ALCOHOL | 10349738 | |
| 5464 | PPA1 | ENZYME | GUANIDINIUM | 8639227 |
| Page: 1 |

Copyright 2023-Present -The University of Texas Health Science Center at Houston |