
|
|||||
|
 | |
| |
| |
| |
| |
| |
|
Gene: PHF3 |
Gene summary for PHF3 |
| Gene information | Species | Human | Gene symbol | PHF3 | Gene ID | 23469 |
| Gene name | PHD finger protein 3 | |
| Gene Alias | PHF3 | |
| Cytomap | 6q12 | |
| Gene Type | protein-coding | GO ID | GO:0006139 | UniProtAcc | B3KP41 |
Top |
Malignant transformation analysis |
| Identification of the aberrant gene expression in precancerous and cancerous lesions by comparing the gene expression of stem-like cells in diseased tissues with normal stem cells |
| Entrez ID | Symbol | Replicates | Species | Organ | Tissue | Adj P-value | Log2FC | Malignancy |
| 23469 | PHF3 | PTC01 | Human | Thyroid | PTC | 6.46e-25 | 4.37e-01 | 0.1899 |
| 23469 | PHF3 | PTC03 | Human | Thyroid | PTC | 1.96e-10 | 4.33e-01 | 0.1784 |
| 23469 | PHF3 | PTC04 | Human | Thyroid | PTC | 1.44e-39 | 7.37e-01 | 0.1927 |
| 23469 | PHF3 | PTC05 | Human | Thyroid | PTC | 1.50e-28 | 1.38e+00 | 0.2065 |
| 23469 | PHF3 | PTC06 | Human | Thyroid | PTC | 4.14e-51 | 1.34e+00 | 0.2057 |
| 23469 | PHF3 | PTC07 | Human | Thyroid | PTC | 1.69e-74 | 1.18e+00 | 0.2044 |
| 23469 | PHF3 | ATC09 | Human | Thyroid | ATC | 9.93e-09 | 2.82e-01 | 0.2871 |
| 23469 | PHF3 | ATC11 | Human | Thyroid | ATC | 4.41e-06 | 3.57e-01 | 0.3386 |
| 23469 | PHF3 | ATC12 | Human | Thyroid | ATC | 2.66e-15 | 2.99e-01 | 0.34 |
| 23469 | PHF3 | ATC13 | Human | Thyroid | ATC | 4.75e-65 | 1.35e+00 | 0.34 |
| 23469 | PHF3 | ATC1 | Human | Thyroid | ATC | 8.39e-09 | 3.67e-01 | 0.2878 |
| 23469 | PHF3 | ATC2 | Human | Thyroid | ATC | 9.17e-15 | 1.24e+00 | 0.34 |
| 23469 | PHF3 | ATC3 | Human | Thyroid | ATC | 3.20e-05 | 2.36e-01 | 0.338 |
| 23469 | PHF3 | ATC4 | Human | Thyroid | ATC | 2.73e-16 | 4.21e-01 | 0.34 |
| 23469 | PHF3 | ATC5 | Human | Thyroid | ATC | 3.81e-69 | 1.45e+00 | 0.34 |
| Page: 1 2 3 4 5 6 7 8 9 10 11 |
| Tissue | Expression Dynamics | Abbreviation |
| Colorectum (GSE201348) |  | FAP: Familial adenomatous polyposis |
| CRC: Colorectal cancer | ||
| Colorectum (HTA11) | 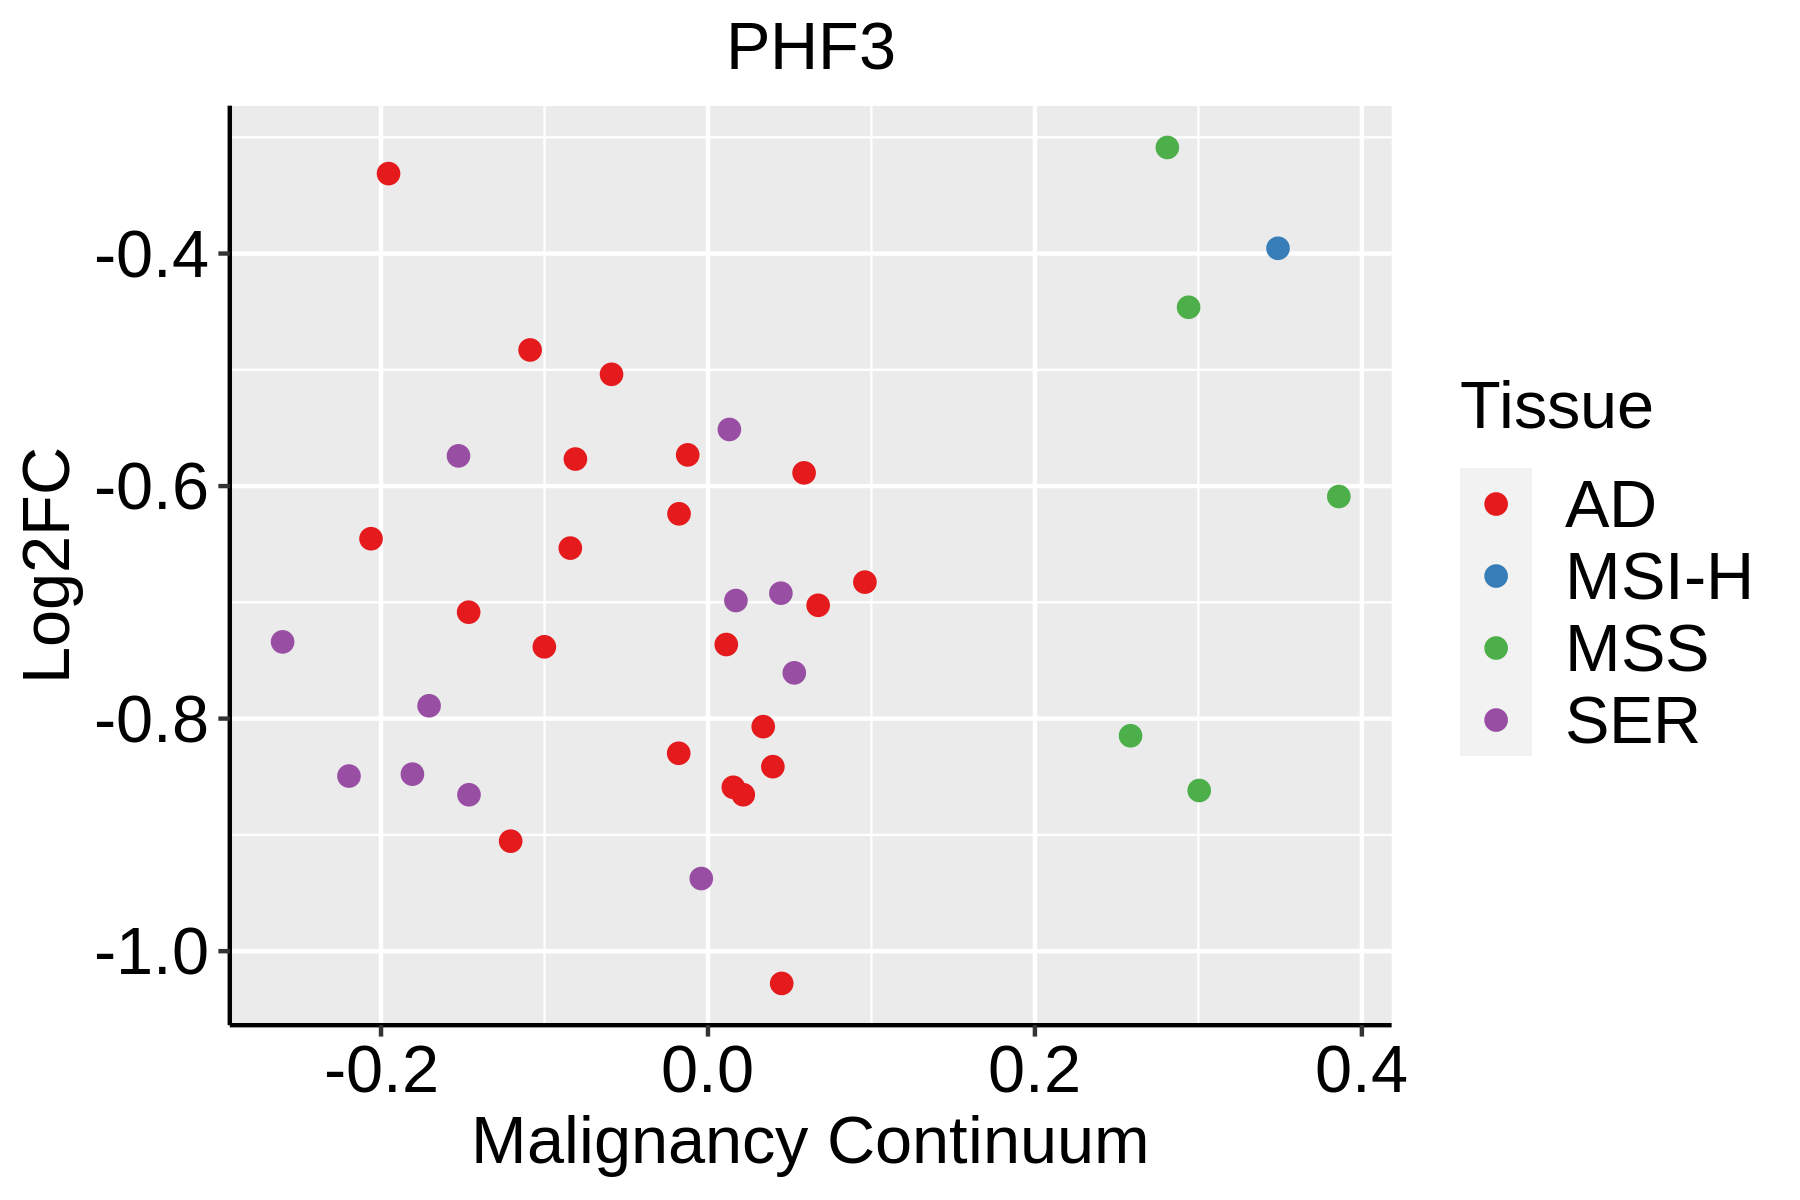 | AD: Adenomas |
| SER: Sessile serrated lesions | ||
| MSI-H: Microsatellite-high colorectal cancer | ||
| MSS: Microsatellite stable colorectal cancer | ||
| Esophagus |  | ESCC: Esophageal squamous cell carcinoma |
| HGIN: High-grade intraepithelial neoplasias | ||
| LGIN: Low-grade intraepithelial neoplasias | ||
| Liver | 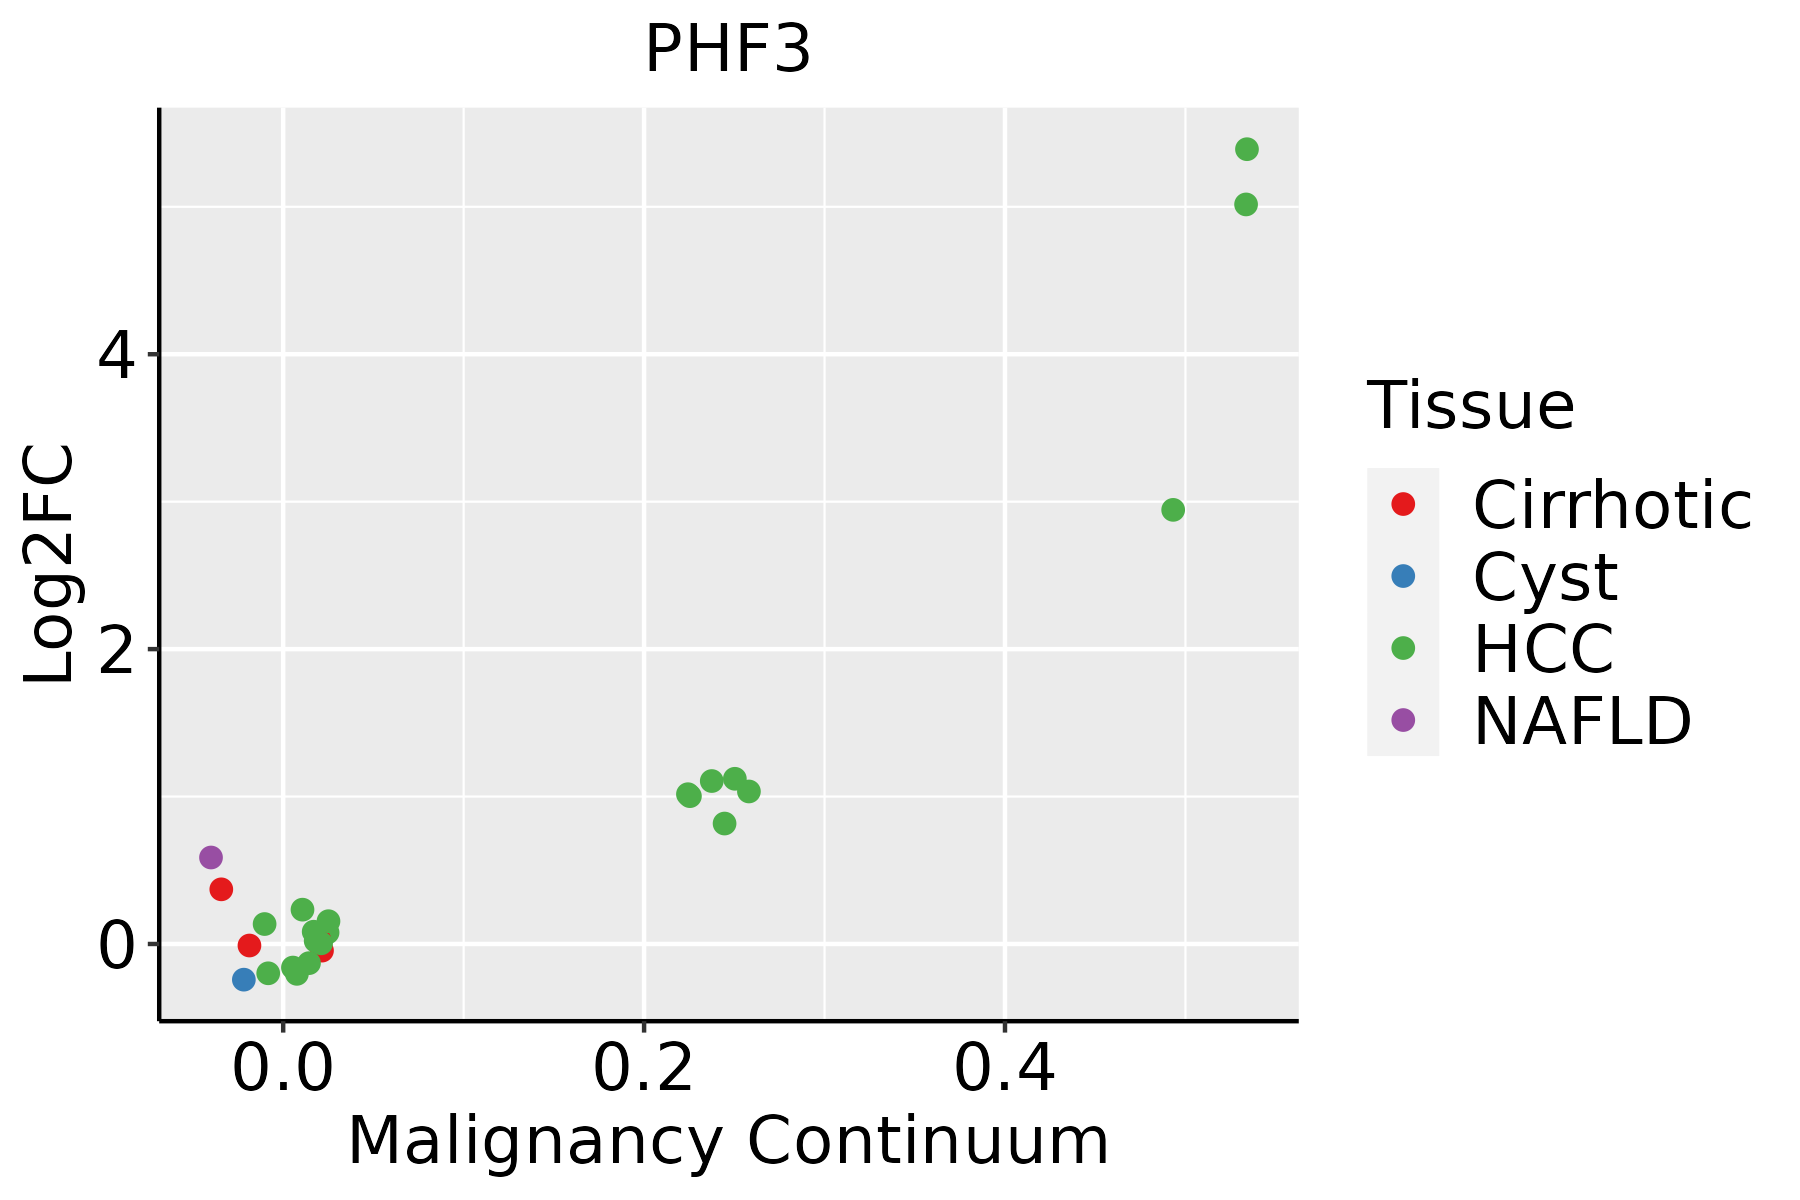 | HCC: Hepatocellular carcinoma |
| NAFLD: Non-alcoholic fatty liver disease | ||
| Oral Cavity |  | EOLP: Erosive Oral lichen planus |
| LP: leukoplakia | ||
| NEOLP: Non-erosive oral lichen planus | ||
| OSCC: Oral squamous cell carcinoma | ||
| Prostate |  | BPH: Benign Prostatic Hyperplasia |
| Skin | 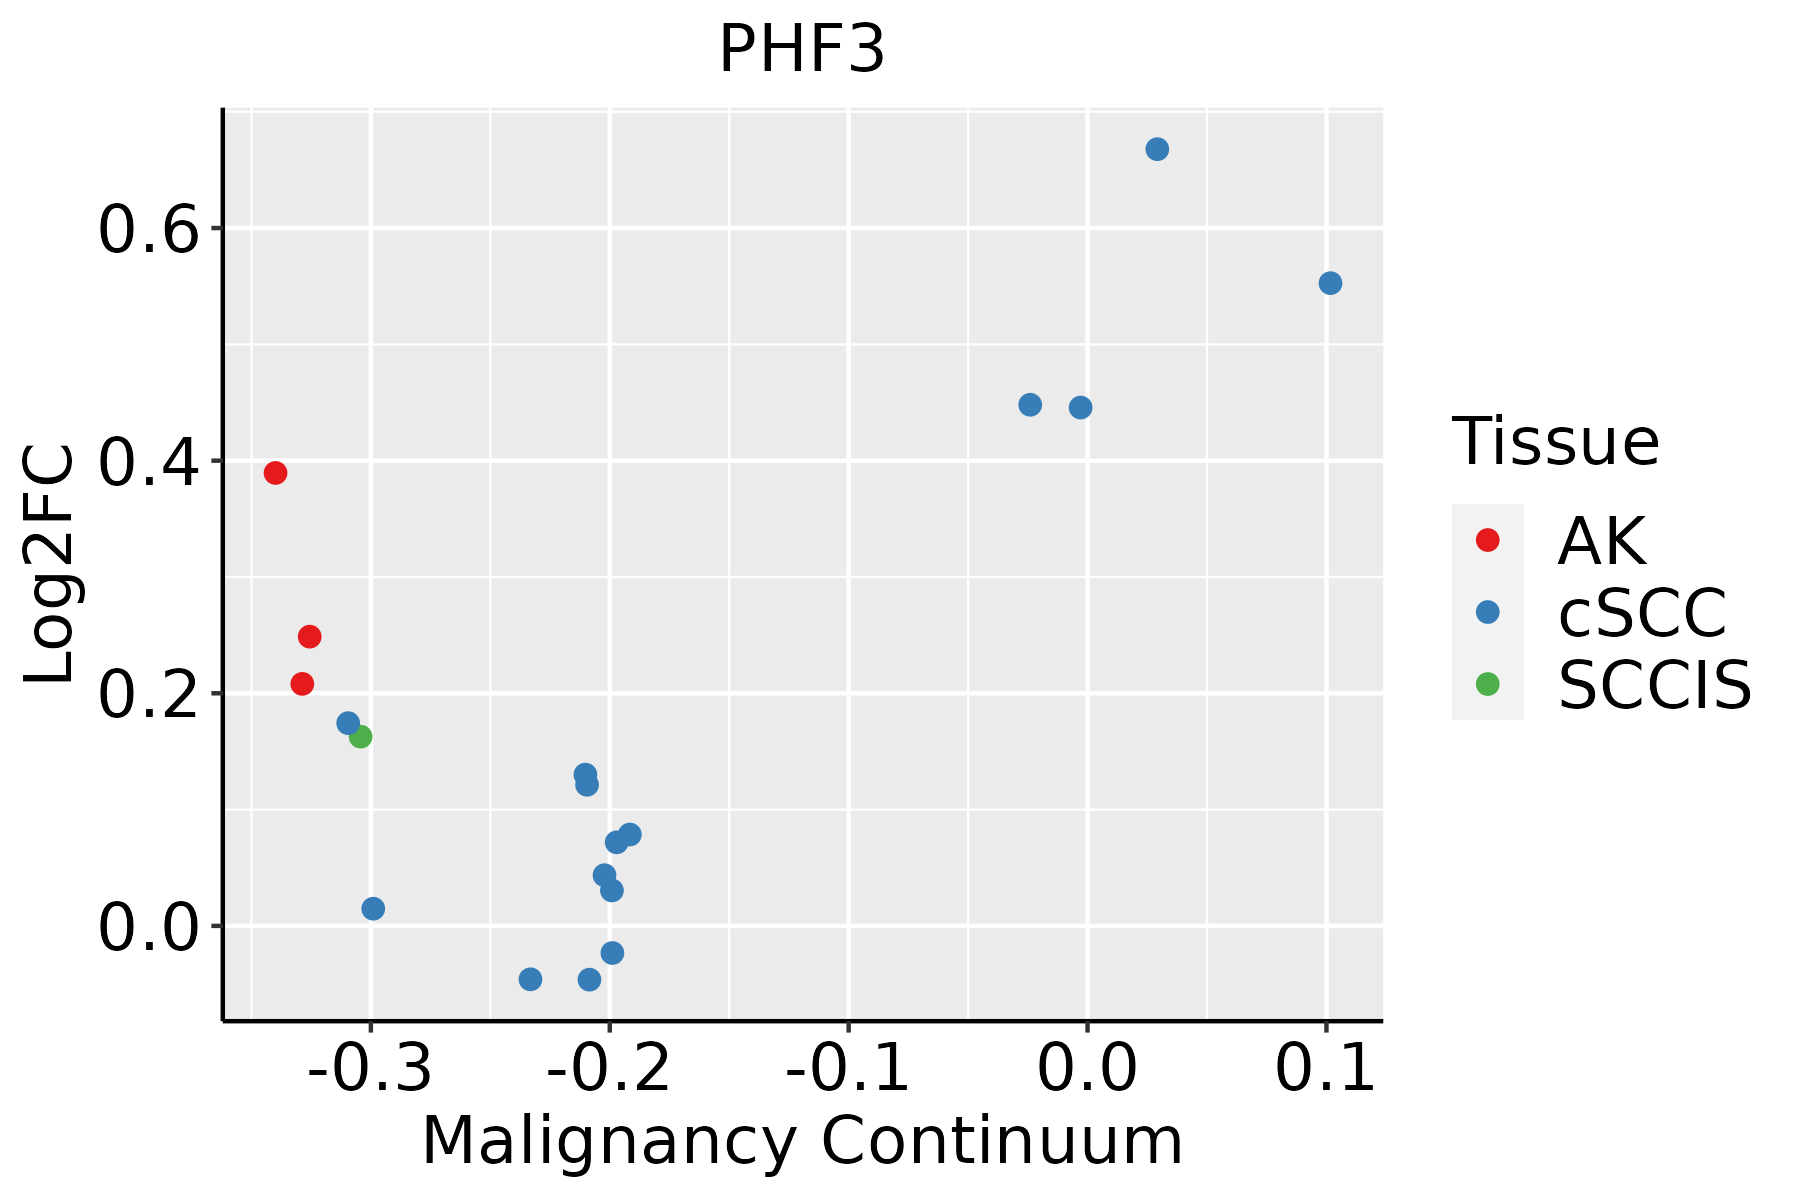 | AK: Actinic keratosis |
| cSCC: Cutaneous squamous cell carcinoma | ||
| SCCIS:squamous cell carcinoma in situ | ||
| Thyroid | 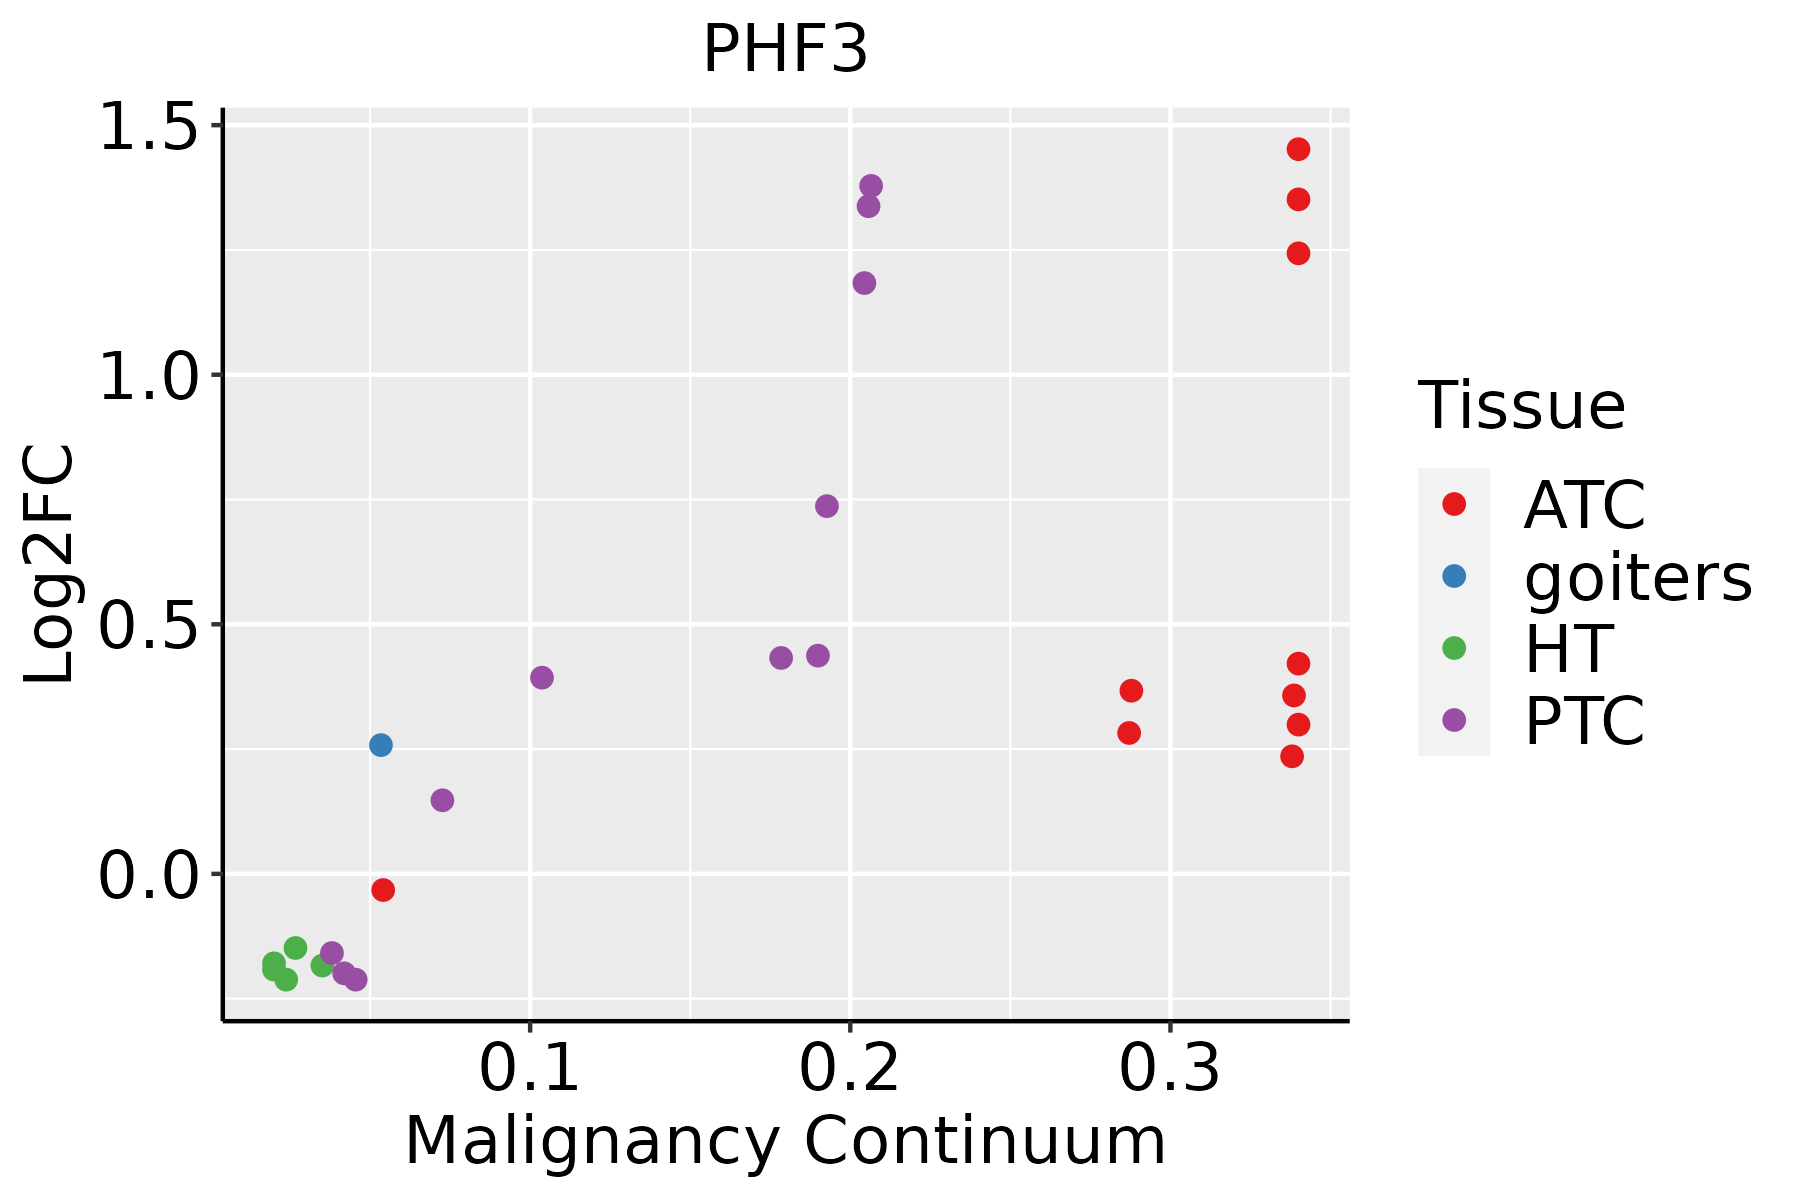 | ATC: Anaplastic thyroid cancer |
| HT: Hashimoto's thyroiditis | ||
| PTC: Papillary thyroid cancer |
| ∗log2FC in expression of this searched gene in stem-like cells from each diseased tissue sample relative to stem-like cells in normal samples in each tissue plotted against the malignancy continuum. Samples are colored based on if they are from different disease stage. |
Top |
Malignant transformation related pathway analysis |
| Find out the enriched GO biological processes and KEGG pathways involved in transition from healthy to precancer to cancer |
| Tissue | Disease Stage | Enriched GO biological Processes |
| Colorectum | AD |  |
| Colorectum | SER |  |
| Colorectum | MSS |  |
| Colorectum | MSI-H |  |
| Colorectum | FAP |  |
| ∗Top 15 enriched GO BP terms are showed in the bar plot of each disease state in each tissue. Each row represents a significant GO biological process which is colored according to the -log10(p.adjust). |
| Page: 1 2 3 4 5 6 7 8 9 |
| GO ID | Tissue | Disease Stage | Description | Gene Ratio | Bg Ratio | pvalue | p.adjust | Count |
| Page: 1 |
| Pathway ID | Tissue | Disease Stage | Description | Gene Ratio | Bg Ratio | pvalue | p.adjust | qvalue | Count |
| Page: 1 |
Top |
Cell-cell communication analysis |
| Identification of potential cell-cell interactions between two cell types and their ligand-receptor pairs for different disease states |
| Ligand | Receptor | LRpair | Pathway | Tissue | Disease Stage |
| Page: 1 |
Top |
Single-cell gene regulatory network inference analysis |
| Find out the significant the regulons (TFs) and the target genes of each regulon across cell types for different disease states |
| TF | Cell Type | Tissue | Disease Stage | Target Gene | RSS | Regulon Activity |
| ∗The dot plots of a searched regulon are shown for all cell subpopulations in each disease state of each tissue based on the regulon specific score inferred using pySCENIC and by calculating the average expression. |
| Page: 1 |
Top |
Somatic mutation of malignant transformation related genes |
| Annotation of somatic variants for genes involved in malignant transformation |
| Hugo Symbol | Variant Class | Variant Classification | dbSNP RS | HGVSc | HGVSp | HGVSp Short | SWISSPROT | BIOTYPE | SIFT | PolyPhen | Tumor Sample Barcode | Tissue | Histology | Sex | Age | Stage | Therapy Types | Drugs | Outcome |
| PHF3 | SNV | Missense_Mutation | novel | c.3970N>T | p.His1324Tyr | p.H1324Y | Q92576 | protein_coding | tolerated(0.06) | probably_damaging(0.953) | TCGA-A2-A4RW-01 | Breast | breast invasive carcinoma | Female | <65 | III/IV | Unknown | Unknown | SD |
| PHF3 | SNV | Missense_Mutation | c.1321N>A | p.Cys441Ser | p.C441S | Q92576 | protein_coding | tolerated_low_confidence(0.26) | benign(0.015) | TCGA-A7-A0DA-01 | Breast | breast invasive carcinoma | Female | <65 | I/II | Chemotherapy | adriamycin | SD | |
| PHF3 | SNV | Missense_Mutation | c.4572A>C | p.Lys1524Asn | p.K1524N | Q92576 | protein_coding | deleterious(0) | benign(0.017) | TCGA-A8-A07R-01 | Breast | breast invasive carcinoma | Female | >=65 | III/IV | Ancillary | zoledronic | SD | |
| PHF3 | SNV | Missense_Mutation | c.5560N>T | p.Pro1854Ser | p.P1854S | Q92576 | protein_coding | deleterious(0) | possibly_damaging(0.895) | TCGA-A8-A095-01 | Breast | breast invasive carcinoma | Female | <65 | I/II | Chemotherapy | 5-fluorouracil | CR | |
| PHF3 | SNV | Missense_Mutation | c.5465N>G | p.Asn1822Ser | p.N1822S | Q92576 | protein_coding | tolerated(0.09) | benign(0.009) | TCGA-A8-A09I-01 | Breast | breast invasive carcinoma | Female | >=65 | I/II | Hormone Therapy | anastrozole | SD | |
| PHF3 | SNV | Missense_Mutation | novel | c.1871A>G | p.Gln624Arg | p.Q624R | Q92576 | protein_coding | deleterious(0) | benign(0.255) | TCGA-AC-A2BK-01 | Breast | breast invasive carcinoma | Female | >=65 | III/IV | Chemotherapy | cytoxan | CR |
| PHF3 | SNV | Missense_Mutation | c.605G>A | p.Arg202Gln | p.R202Q | Q92576 | protein_coding | deleterious_low_confidence(0) | possibly_damaging(0.518) | TCGA-AN-A046-01 | Breast | breast invasive carcinoma | Female | >=65 | I/II | Unknown | Unknown | SD | |
| PHF3 | SNV | Missense_Mutation | novel | c.2444G>A | p.Arg815Lys | p.R815K | Q92576 | protein_coding | tolerated(1) | benign(0) | TCGA-AN-A046-01 | Breast | breast invasive carcinoma | Female | >=65 | I/II | Unknown | Unknown | SD |
| PHF3 | SNV | Missense_Mutation | rs764833590 | c.4973G>A | p.Arg1658Gln | p.R1658Q | Q92576 | protein_coding | deleterious(0) | benign(0.205) | TCGA-AN-A046-01 | Breast | breast invasive carcinoma | Female | >=65 | I/II | Unknown | Unknown | SD |
| PHF3 | SNV | Missense_Mutation | rs768248434 | c.6029G>A | p.Arg2010Gln | p.R2010Q | Q92576 | protein_coding | deleterious(0) | probably_damaging(0.926) | TCGA-AN-A046-01 | Breast | breast invasive carcinoma | Female | >=65 | I/II | Unknown | Unknown | SD |
| Page: 1 2 3 4 5 6 7 8 9 10 11 12 13 14 15 16 17 18 19 20 21 22 23 24 25 26 27 |
Top |
Related drugs of malignant transformation related genes |
| Identification of chemicals and drugs interact with genes involved in malignant transfromation |
| (DGIdb 4.0) |
| Entrez ID | Symbol | Category | Interaction Types | Drug Claim Name | Drug Name | PMIDs |
| Page: 1 |

Copyright 2023-Present -The University of Texas Health Science Center at Houston |