Schematic overview of the cellular and molecular mechanisms involved in the cancer progression, including the proposed cellular and molecular mechanisms in cancer cells trajectory. AT1: alveolar type 1 cells; AT2: alveolar type 2 cells; AAH: atypical adenomatous hyperplasia; AIS: adenocarcinoma in situ; MIA: minimally invasive adenocarcinoma; IA: invasive adenocarcinoma; EMT: epithelial-mesenchymal transition

Home

Download

Statistics

Help

Contact

Center for Computational Systems Medicine
leaf

Gene summary

leaf

Malignant transformation analysis

leaf

Malignant transformation related pathway analysis

leaf

Cell-cell communication analysis

leaf

Single-cell gene regulatory network inference analysis

leaf

Somatic mutation of malignant transformation related genes

leaf

Related drugs of malignant transformation related genes

Gene: HNRNPDL

Gene summary for HNRNPDL

check button Gene summary.

Gene informationSpeciesHuman
Gene symbol

HNRNPDL

Gene ID

9987

Gene nameheterogeneous nuclear ribonucleoprotein D like
Gene AliasHNRNP
Cytomap4q21.22
Gene Typeprotein-coding
GO ID

GO:0008150

UniProtAcc

A0A087WUK2


Top

Malignant transformation analysis

check button Identification of the aberrant gene expression in precancerous and cancerous lesions by comparing the gene expression of stem-like cells in diseased tissues with normal stem cells
check button Malignant transformation involving gene list.
Entrez IDSymbolReplicatesSpeciesOrganTissueAdj P-valueLog2FCMalignancy
9987HNRNPDLSYSMH1HumanOral cavityOSCC1.96e-156.01e-010.1127
9987HNRNPDLSYSMH2HumanOral cavityOSCC4.74e-441.70e+000.2326
9987HNRNPDLSYSMH3HumanOral cavityOSCC6.32e-531.85e+000.2442
9987HNRNPDLSYSMH4HumanOral cavityOSCC2.77e-206.16e-010.1226
9987HNRNPDLSYSMH5HumanOral cavityOSCC1.34e-167.06e-010.0647
9987HNRNPDLSYSMH6HumanOral cavityOSCC2.19e-208.93e-010.1275
9987HNRNPDLGSM5252126_BPH283PrGF_ViaHumanProstateBPH1.34e-094.51e-01-0.1771
9987HNRNPDLGSM5252128_BPH327PrGF_ViaHumanProstateBPH3.94e-073.52e-01-0.1688
9987HNRNPDLGSM5252129_BPH327PrSF_ViaHumanProstateBPH1.15e-064.10e-01-0.1697
9987HNRNPDLGSM5252130_BPH340PrGF_ViaHumanProstateBPH3.53e-247.65e-01-0.1972
9987HNRNPDLGSM5252131_BPH340PrSF_ViaHumanProstateBPH3.13e-135.83e-01-0.2126
9987HNRNPDLGSM5252132_BPH389PrGFHumanProstateBPH6.06e-065.65e-01-0.2247
9987HNRNPDLGSM5252133_BPH389PrSFHumanProstateBPH4.05e-088.76e-01-0.2027
9987HNRNPDLGSM5252134_BPH511PrG_Fcol_3GEXHumanProstateBPH3.14e-032.37e-01-0.1433
9987HNRNPDLGSM5252135_BPH511PrPUr_Fcol_3GEXHumanProstateBPH5.93e-054.34e-01-0.1833
9987HNRNPDLGSM5252136_BPH556PrGA1_FcolHumanProstateBPH2.93e-022.89e-01-0.23
9987HNRNPDLGSM5252137_BPH556PrGA2_FcolHumanProstateBPH1.36e-054.74e-01-0.23
9987HNRNPDL047563_1562-all-cellsHumanProstateBPH1.22e-36-5.68e-010.0791
9987HNRNPDL048752_1579-all-cellsHumanProstateBPH5.06e-27-5.01e-010.1008
9987HNRNPDL052095_1628-all-cellsHumanProstateBPH1.56e-11-4.01e-010.1032
Page: 1 2 3 4 5 6 7 8 9 10 11 12 13 14 

check button Transcriptomic changes along malignancy continuum.
TissueExpression DynamicsAbbreviation
BreastThe image shows the transcriptomic changes along malignancy continuum.log2FC in expression of this searched gene in stem-like cells from each diseased tissue sample relative to stem-like cells in normal samples in each tissue plotted against the malignancy continuum. Samples are colored based on if they are from different disease stage.
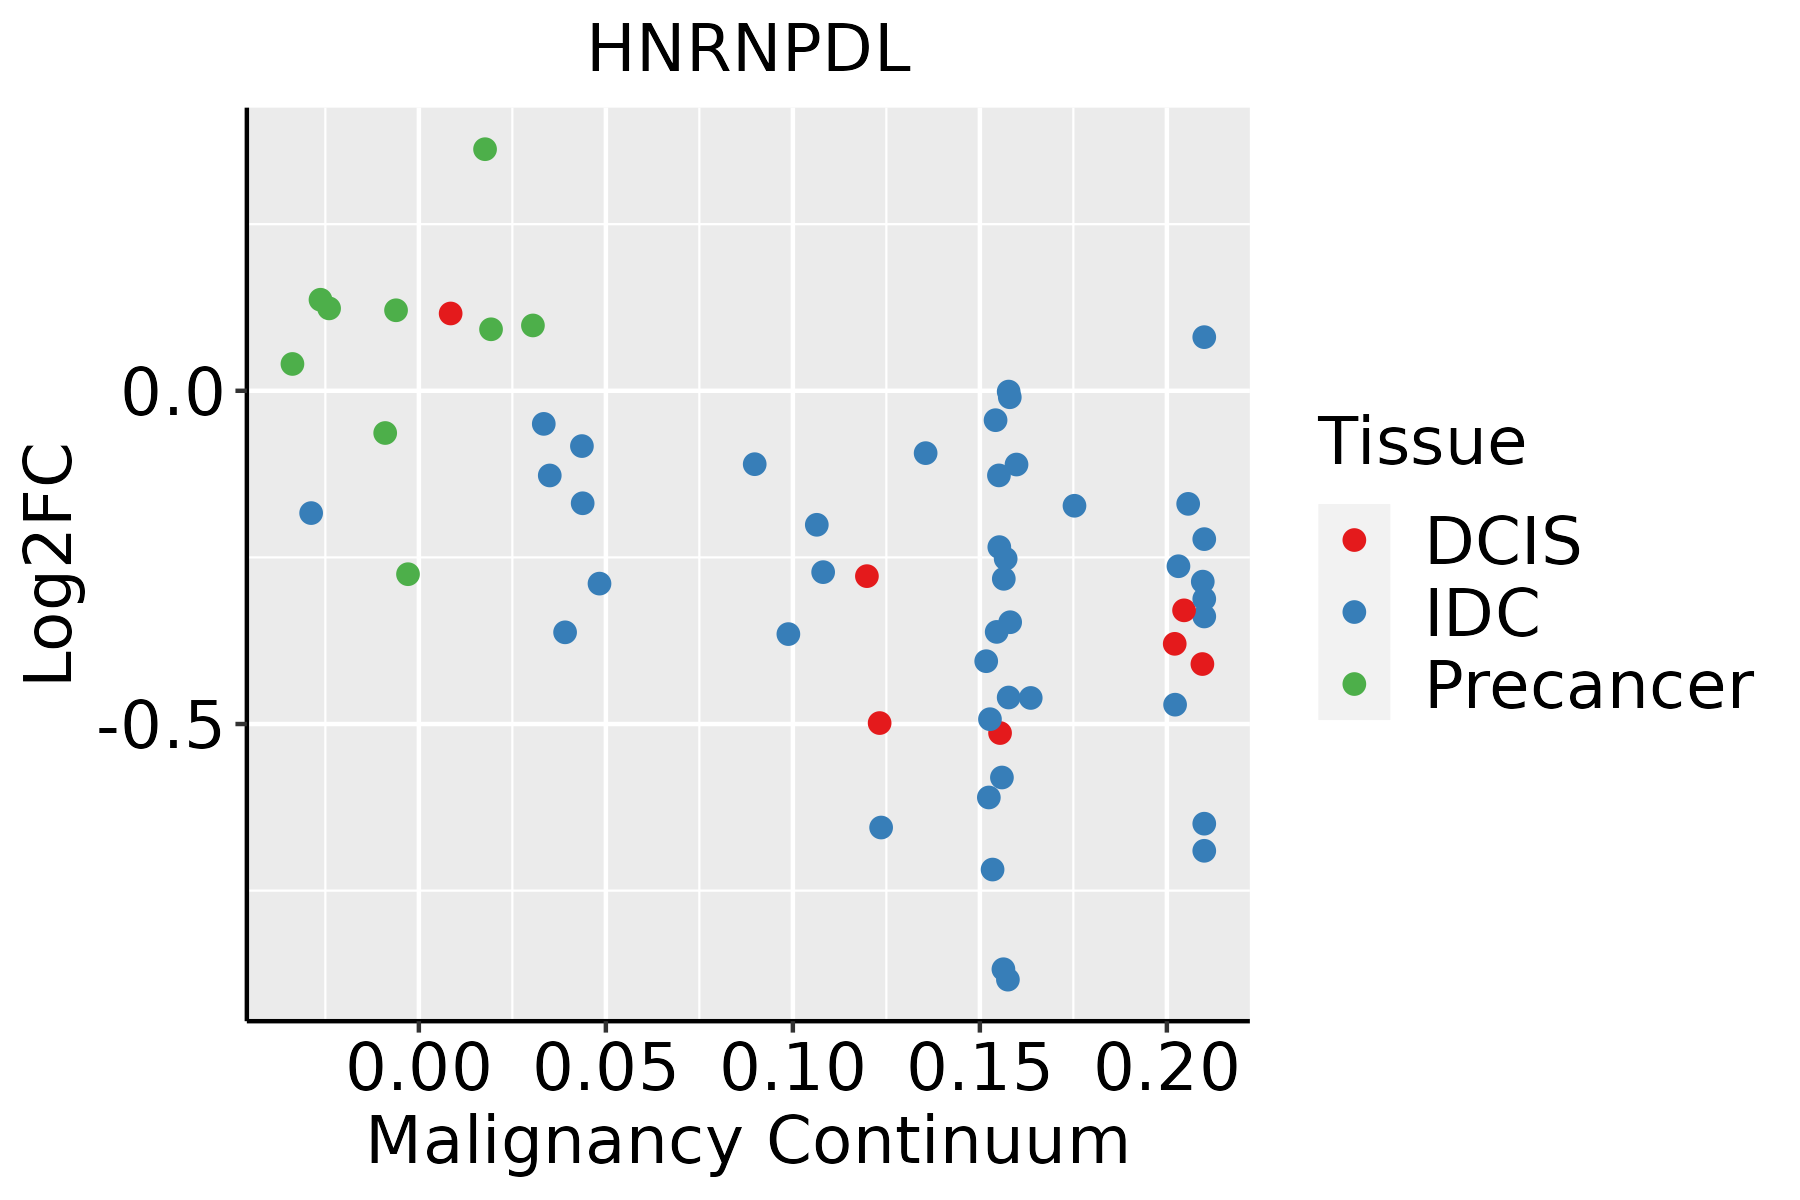
IDC: Invasive ductal carcinoma
DCIS: Ductal carcinoma in situ
Precancer(BRCA1-mut): Precancerous lesion from BRCA1 mutation carriers
Colorectum (GSE201348)The image shows the transcriptomic changes along malignancy continuum.log2FC in expression of this searched gene in stem-like cells from each diseased tissue sample relative to stem-like cells in normal samples in each tissue plotted against the malignancy continuum. Samples are colored based on if they are from different disease stage.FAP: Familial adenomatous polyposis
CRC: Colorectal cancer
Colorectum (HTA11)The image shows the transcriptomic changes along malignancy continuum.log2FC in expression of this searched gene in stem-like cells from each diseased tissue sample relative to stem-like cells in normal samples in each tissue plotted against the malignancy continuum. Samples are colored based on if they are from different disease stage.AD: Adenomas
SER: Sessile serrated lesions
MSI-H: Microsatellite-high colorectal cancer
MSS: Microsatellite stable colorectal cancer
EndometriumThe image shows the transcriptomic changes along malignancy continuum.log2FC in expression of this searched gene in stem-like cells from each diseased tissue sample relative to stem-like cells in normal samples in each tissue plotted against the malignancy continuum. Samples are colored based on if they are from different disease stage.AEH: Atypical endometrial hyperplasia
EEC: Endometrioid Cancer
EsophagusThe image shows the transcriptomic changes along malignancy continuum.log2FC in expression of this searched gene in stem-like cells from each diseased tissue sample relative to stem-like cells in normal samples in each tissue plotted against the malignancy continuum. Samples are colored based on if they are from different disease stage.ESCC: Esophageal squamous cell carcinoma
HGIN: High-grade intraepithelial neoplasias
LGIN: Low-grade intraepithelial neoplasias
LiverThe image shows the transcriptomic changes along malignancy continuum.log2FC in expression of this searched gene in stem-like cells from each diseased tissue sample relative to stem-like cells in normal samples in each tissue plotted against the malignancy continuum. Samples are colored based on if they are from different disease stage.
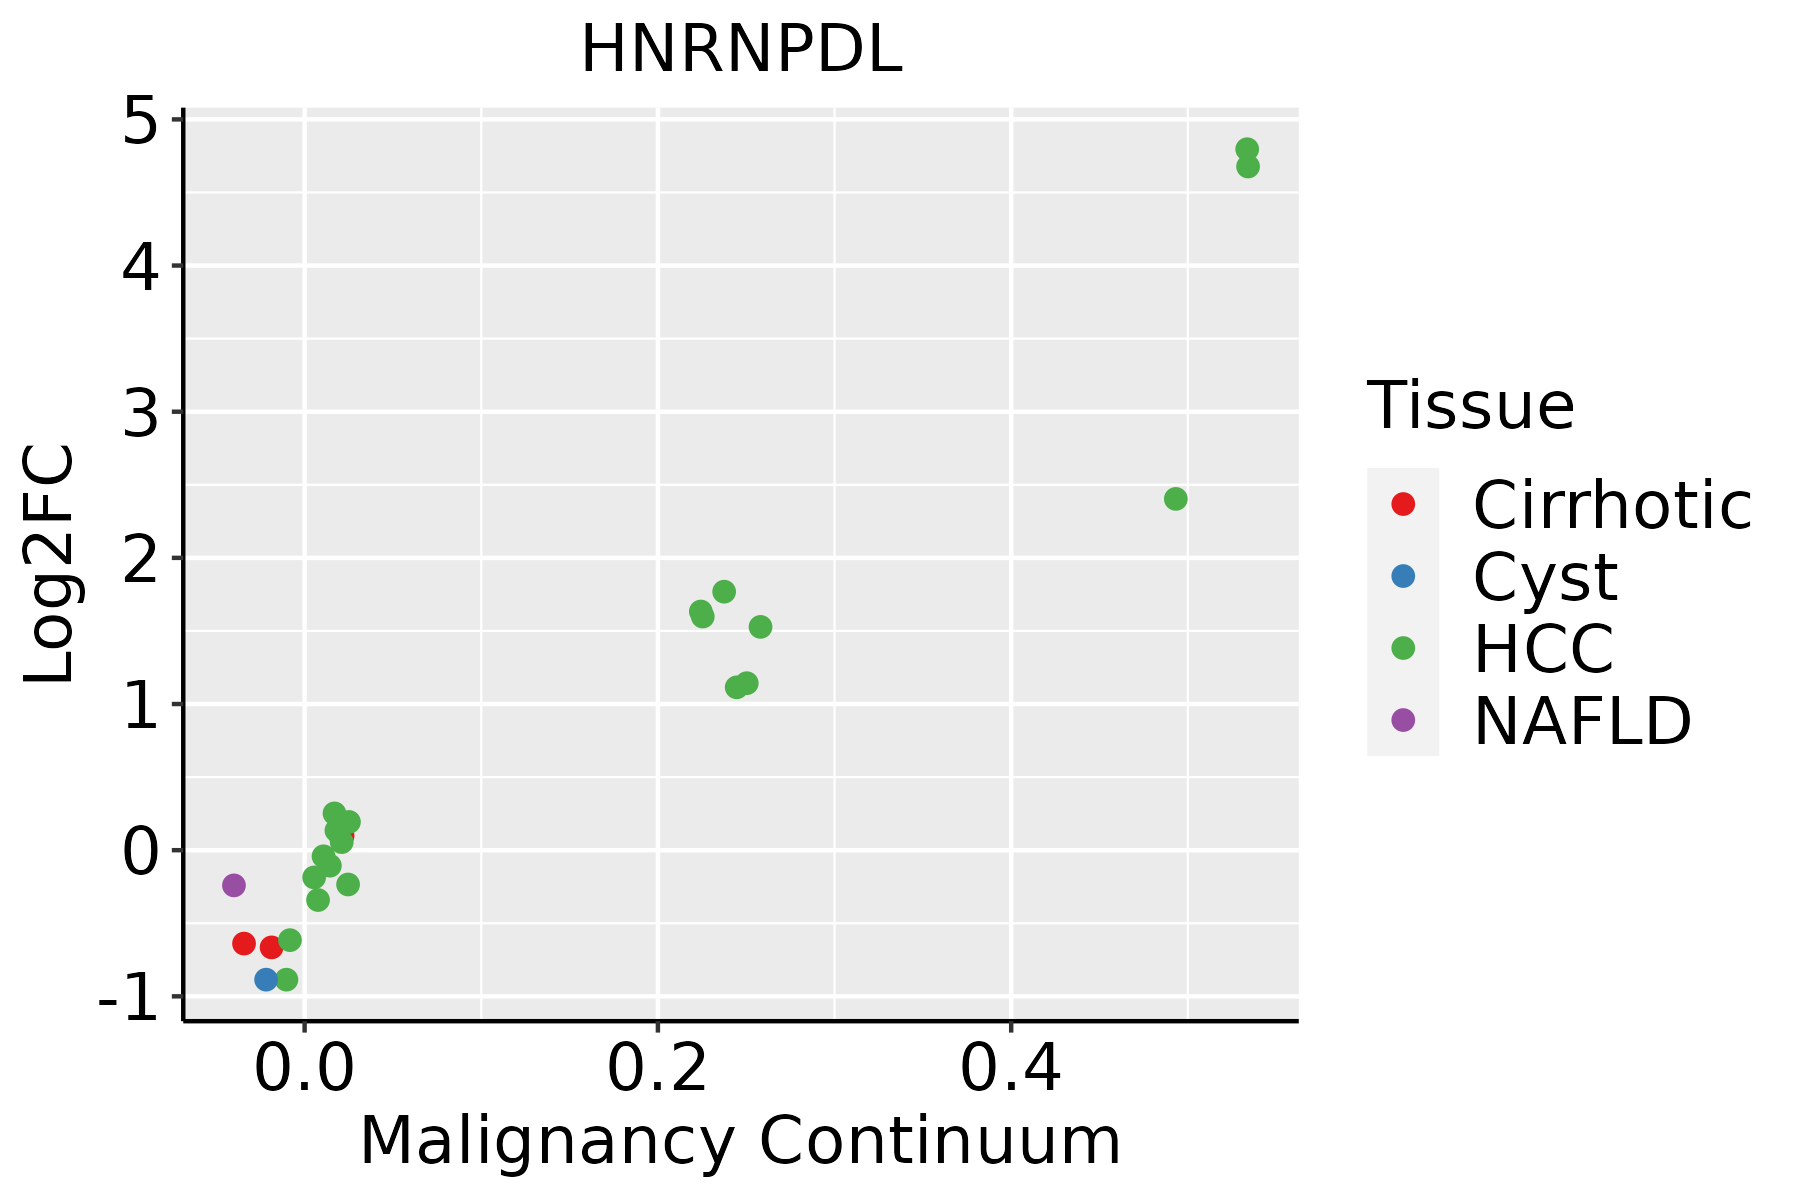
HCC: Hepatocellular carcinoma
NAFLD: Non-alcoholic fatty liver disease
LungThe image shows the transcriptomic changes along malignancy continuum.log2FC in expression of this searched gene in stem-like cells from each diseased tissue sample relative to stem-like cells in normal samples in each tissue plotted against the malignancy continuum. Samples are colored based on if they are from different disease stage.
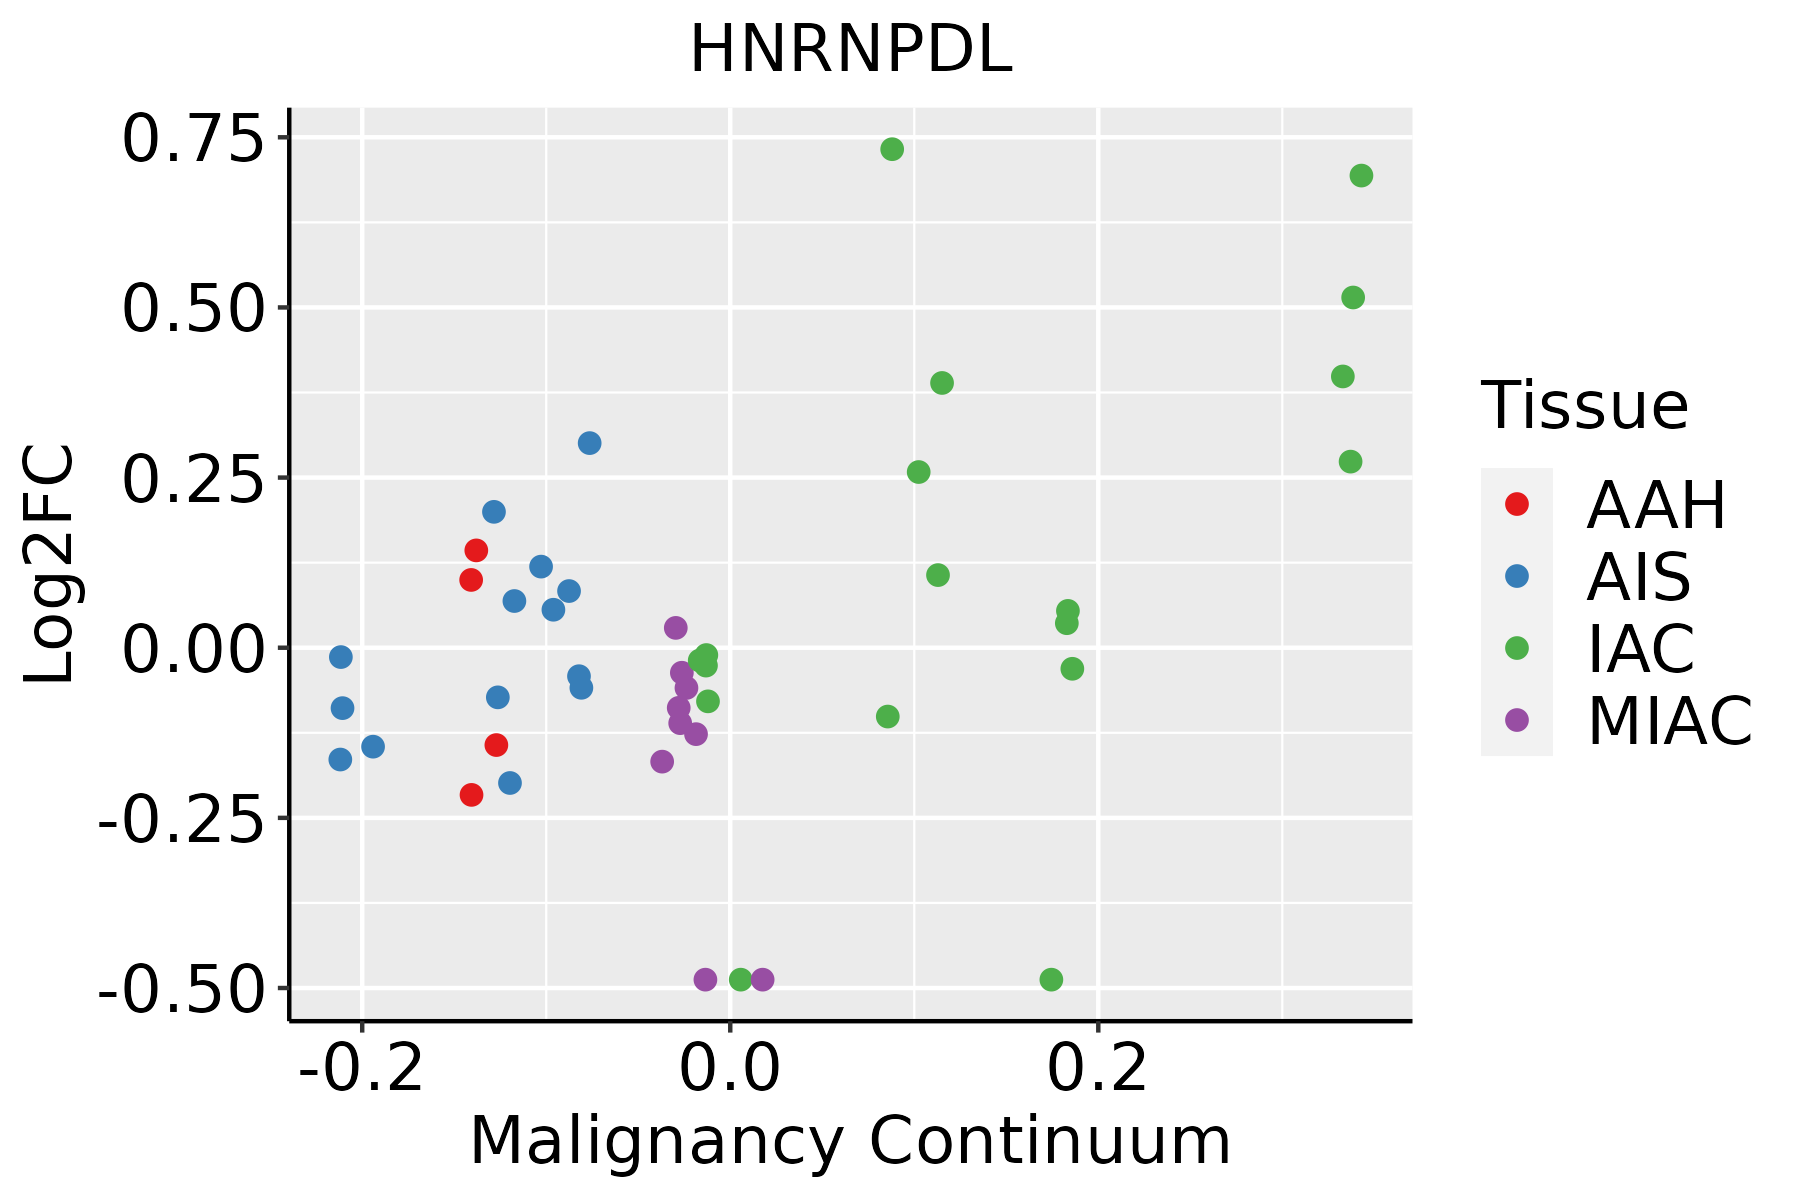
AAH: Atypical adenomatous hyperplasia
AIS: Adenocarcinoma in situ
IAC: Invasive lung adenocarcinoma
MIA: Minimally invasive adenocarcinoma
Oral CavityThe image shows the transcriptomic changes along malignancy continuum.log2FC in expression of this searched gene in stem-like cells from each diseased tissue sample relative to stem-like cells in normal samples in each tissue plotted against the malignancy continuum. Samples are colored based on if they are from different disease stage.EOLP: Erosive Oral lichen planus
LP: leukoplakia
NEOLP: Non-erosive oral lichen planus
OSCC: Oral squamous cell carcinoma
ProstateThe image shows the transcriptomic changes along malignancy continuum.log2FC in expression of this searched gene in stem-like cells from each diseased tissue sample relative to stem-like cells in normal samples in each tissue plotted against the malignancy continuum. Samples are colored based on if they are from different disease stage.
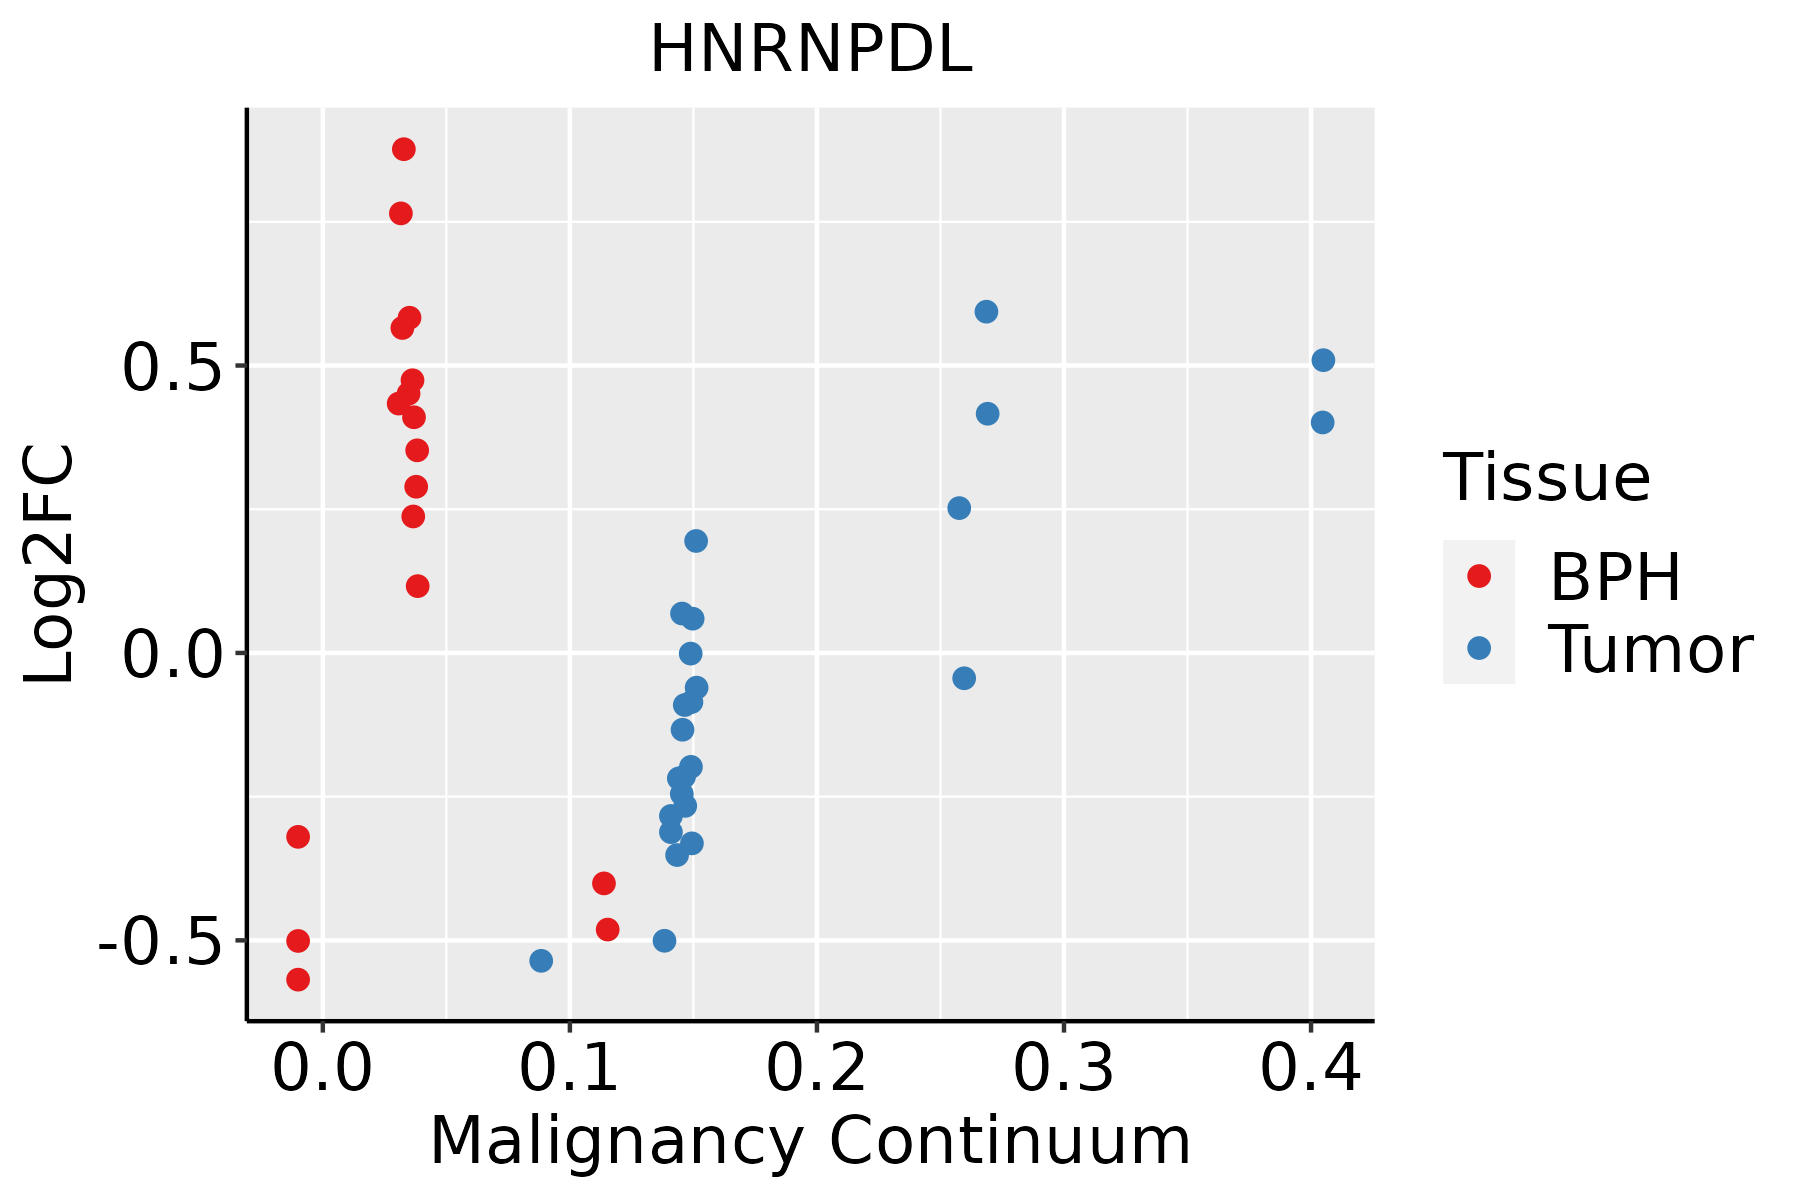
BPH: Benign Prostatic Hyperplasia
SkinThe image shows the transcriptomic changes along malignancy continuum.log2FC in expression of this searched gene in stem-like cells from each diseased tissue sample relative to stem-like cells in normal samples in each tissue plotted against the malignancy continuum. Samples are colored based on if they are from different disease stage.AK: Actinic keratosis
cSCC: Cutaneous squamous cell carcinoma
SCCIS:squamous cell carcinoma in situ
ThyroidThe image shows the transcriptomic changes along malignancy continuum.log2FC in expression of this searched gene in stem-like cells from each diseased tissue sample relative to stem-like cells in normal samples in each tissue plotted against the malignancy continuum. Samples are colored based on if they are from different disease stage.ATC: Anaplastic thyroid cancer
HT: Hashimoto's thyroiditis
PTC: Papillary thyroid cancer
∗log2FC in expression of this searched gene in stem-like cells from each diseased tissue sample relative to stem-like cells in normal samples in each tissue plotted against the malignancy continuum. Samples are colored based on if they are from different disease stage.

Top

Malignant transformation related pathway analysis

check buttonFind out the enriched GO biological processes and KEGG pathways involved in transition from healthy to precancer to cancer
check button Figure of enriched GO biological processes.
TissueDisease StageEnriched GO biological Processes
ColorectumADGO analysis - Figure of enriched GO biological processes: Top 15 enriched GO BP terms are showed in the bar plot of each disease state in each tissue. Each row represents a significant GO biological process which is colored according to the -log10(p.adjust).
ColorectumSERGO analysis - Figure of enriched GO biological processes: Top 15 enriched GO BP terms are showed in the bar plot of each disease state in each tissue. Each row represents a significant GO biological process which is colored according to the -log10(p.adjust).
ColorectumMSSGO analysis - Figure of enriched GO biological processes: Top 15 enriched GO BP terms are showed in the bar plot of each disease state in each tissue. Each row represents a significant GO biological process which is colored according to the -log10(p.adjust).
ColorectumMSI-HGO analysis - Figure of enriched GO biological processes: Top 15 enriched GO BP terms are showed in the bar plot of each disease state in each tissue. Each row represents a significant GO biological process which is colored according to the -log10(p.adjust).
ColorectumFAPGO analysis - Figure of enriched GO biological processes: Top 15 enriched GO BP terms are showed in the bar plot of each disease state in each tissue. Each row represents a significant GO biological process which is colored according to the -log10(p.adjust).
∗Top 15 enriched GO BP terms are showed in the bar plot of each disease state in each tissue. Each row represents a significant GO biological process which is colored according to the -log10(p.adjust).
Page: 1 2 3 4 5 6 7 8 9 

check button Enriched GO biological processes.
GO IDTissueDisease StageDescriptionGene RatioBg Ratiopvaluep.adjustCount
Page: 1 

check button Enriched KEGG pathways.
Pathway IDTissueDisease StageDescriptionGene RatioBg Ratiopvaluep.adjustqvalueCount
Page: 1 

Top

Cell-cell communication analysis

check buttonIdentification of potential cell-cell interactions between two cell types and their ligand-receptor pairs for different disease states
LigandReceptorLRpairPathwayTissueDisease Stage
Page: 1 

Top

Single-cell gene regulatory network inference analysis

check buttonFind out the significant the regulons (TFs) and the target genes of each regulon across cell types for different disease states
TFCell TypeTissueDisease StageTarget GeneRSSRegulon Activity
∗The dot plots of a searched regulon are shown for all cell subpopulations in each disease state of each tissue based on the regulon specific score inferred using pySCENIC and by calculating the average expression.
Page: 1 

Top

Somatic mutation of malignant transformation related genes

check buttonAnnotation of somatic variants for genes involved in malignant transformation
Hugo SymbolVariant ClassVariant ClassificationdbSNP RSHGVScHGVSpHGVSp ShortSWISSPROTBIOTYPESIFTPolyPhenTumor Sample BarcodeTissueHistologySexAgeStageTherapy TypesDrugsOutcome
HNRNPDLSNVMissense_Mutationc.347G>Cp.Ser116Thrp.S116TO14979protein_codingtolerated_low_confidence(0.41)benign(0.05)TCGA-A1-A0SJ-01Breastbreast invasive carcinomaFemale<65III/IVUnknownUnknownSD
HNRNPDLSNVMissense_Mutationc.227A>Cp.Lys76Thrp.K76TO14979protein_codingdeleterious_low_confidence(0)benign(0.129)TCGA-E2-A14Y-01Breastbreast invasive carcinomaFemale<65I/IIChemotherapycarboplatinSD
HNRNPDLSNVMissense_Mutationc.1124N>Ap.Gly375Aspp.G375DO14979protein_codingtolerated_low_confidence(0.1)possibly_damaging(0.808)TCGA-EW-A1IZ-01Breastbreast invasive carcinomaFemale<65III/IVChemotherapytaxotereSD
HNRNPDLSNVMissense_Mutationnovelc.837N>Gp.Ile279Metp.I279MO14979protein_codingdeleterious(0)probably_damaging(0.986)TCGA-VS-A8QM-01Cervixcervical & endocervical cancerFemale<65I/IIChemotherapycisplatinPD
HNRNPDLSNVMissense_Mutationnovelc.1102N>Ap.Asp368Asnp.D368NO14979protein_codingtolerated(0.28)benign(0.01)TCGA-VS-A94Z-01Cervixcervical & endocervical cancerFemale<65I/IIChemotherapycisplatinCR
HNRNPDLSNVMissense_Mutationrs141595181c.337N>Tp.Pro113Serp.P113SO14979protein_codingdeleterious_low_confidence(0.03)benign(0)TCGA-AA-3660-01Colorectumcolon adenocarcinomaFemale<65I/IIUnknownUnknownSD
HNRNPDLSNVMissense_Mutationnovelc.1204A>Gp.Thr402Alap.T402AO14979protein_codingdeleterious_low_confidence(0.04)benign(0.259)TCGA-AA-3811-01Colorectumcolon adenocarcinomaFemale>=65III/IVUnknownUnknownPD
HNRNPDLSNVMissense_Mutationnovelc.411G>Tp.Lys137Asnp.K137NO14979protein_codingdeleterious(0.03)possibly_damaging(0.767)TCGA-AA-3980-01Colorectumcolon adenocarcinomaFemale>=65I/IIUnknownUnknownSD
HNRNPDLSNVMissense_Mutationrs752922266c.380N>Ap.Ser127Asnp.S127NO14979protein_codingtolerated_low_confidence(0.08)benign(0.003)TCGA-AA-A00N-01Colorectumcolon adenocarcinomaMale>=65I/IIUnknownUnknownPD
HNRNPDLSNVMissense_Mutationnovelc.649N>Gp.Leu217Valp.L217VO14979protein_codingtolerated(0.57)benign(0.089)TCGA-CA-6717-01Colorectumcolon adenocarcinomaMale<65I/IIChemotherapyoxaliplatinCR
Page: 1 2 3 4 5 

Top

Related drugs of malignant transformation related genes

check buttonIdentification of chemicals and drugs interact with genes involved in malignant transfromation
(DGIdb 4.0)
Entrez IDSymbolCategoryInteraction TypesDrug Claim NameDrug NamePMIDs
Page: 1