Schematic overview of the cellular and molecular mechanisms involved in the cancer progression, including the proposed cellular and molecular mechanisms in cancer cells trajectory. AT1: alveolar type 1 cells; AT2: alveolar type 2 cells; AAH: atypical adenomatous hyperplasia; AIS: adenocarcinoma in situ; MIA: minimally invasive adenocarcinoma; IA: invasive adenocarcinoma; EMT: epithelial-mesenchymal transition

Home

Download

Statistics

Help

Contact

Center for Computational Systems Medicine
leaf

Gene summary

leaf

Malignant transformation analysis

leaf

Malignant transformation related pathway analysis

leaf

Cell-cell communication analysis

leaf

Single-cell gene regulatory network inference analysis

leaf

Somatic mutation of malignant transformation related genes

leaf

Related drugs of malignant transformation related genes

Gene: GNB2

Gene summary for GNB2

check button Gene summary.

Gene informationSpeciesHuman
Gene symbol

GNB2

Gene ID

2783

Gene nameG protein subunit beta 2
Gene AliasSSS4
Cytomap7q22.1
Gene Typeprotein-coding
GO ID

GO:0007154

UniProtAcc

P62879


Top

Malignant transformation analysis

check button Identification of the aberrant gene expression in precancerous and cancerous lesions by comparing the gene expression of stem-like cells in diseased tissues with normal stem cells
check button Malignant transformation involving gene list.
Entrez IDSymbolReplicatesSpeciesOrganTissueAdj P-valueLog2FCMalignancy
2783GNB2Pat06-BHumanStomachGC2.19e-585.27e-01-0.1961
2783GNB2Pat09-BHumanStomachGC5.48e-123.31e-01-0.0359
2783GNB2Pat11-BHumanStomachGC5.84e-163.20e-01-0.182
2783GNB2Pat12-BHumanStomachGC7.84e-416.74e-010.0325
2783GNB2Pat13-BHumanStomachGC1.14e-061.59e-010.0555
2783GNB2Pat15-BHumanStomachGC5.87e-234.45e-01-0.0778
2783GNB2Pat16-BHumanStomachGC9.08e-052.22e-010.1918
2783GNB2Pat18-BHumanStomachGC9.50e-152.10e-01-0.0432
2783GNB2Pat19-BHumanStomachGC7.24e-122.64e-010.0826
2783GNB2Pat22-BHumanStomachGC1.48e-443.71e-01-0.1042
2783GNB2Pat24-BHumanStomachGC7.81e-245.48e-01-0.1184
2783GNB2Pat25-AHumanStomachCAG with IM9.95e-331.87e-01-0.1648
2783GNB2Pat26-AHumanStomachCSG4.78e-201.34e-01-0.2402
2783GNB2Pat28-AHumanStomachCSG1.33e-121.43e-01-0.2594
2783GNB2Pat29-AHumanStomachCAG with IM4.32e-134.39e-01-0.2769
2783GNB2CAG_3HumanStomachCAG3.37e-052.42e-01-0.2766
2783GNB2male-WTAHumanThyroidPTC2.97e-443.15e-010.1037
2783GNB2PTC01HumanThyroidPTC5.93e-245.80e-010.1899
2783GNB2PTC04HumanThyroidPTC5.10e-237.12e-010.1927
2783GNB2PTC05HumanThyroidPTC6.99e-411.51e+000.2065
Page: 1 2 3 4 5 6 7 8 9 10 11 12 

check button Transcriptomic changes along malignancy continuum.
TissueExpression DynamicsAbbreviation
BreastThe image shows the transcriptomic changes along malignancy continuum.log2FC in expression of this searched gene in stem-like cells from each diseased tissue sample relative to stem-like cells in normal samples in each tissue plotted against the malignancy continuum. Samples are colored based on if they are from different disease stage.
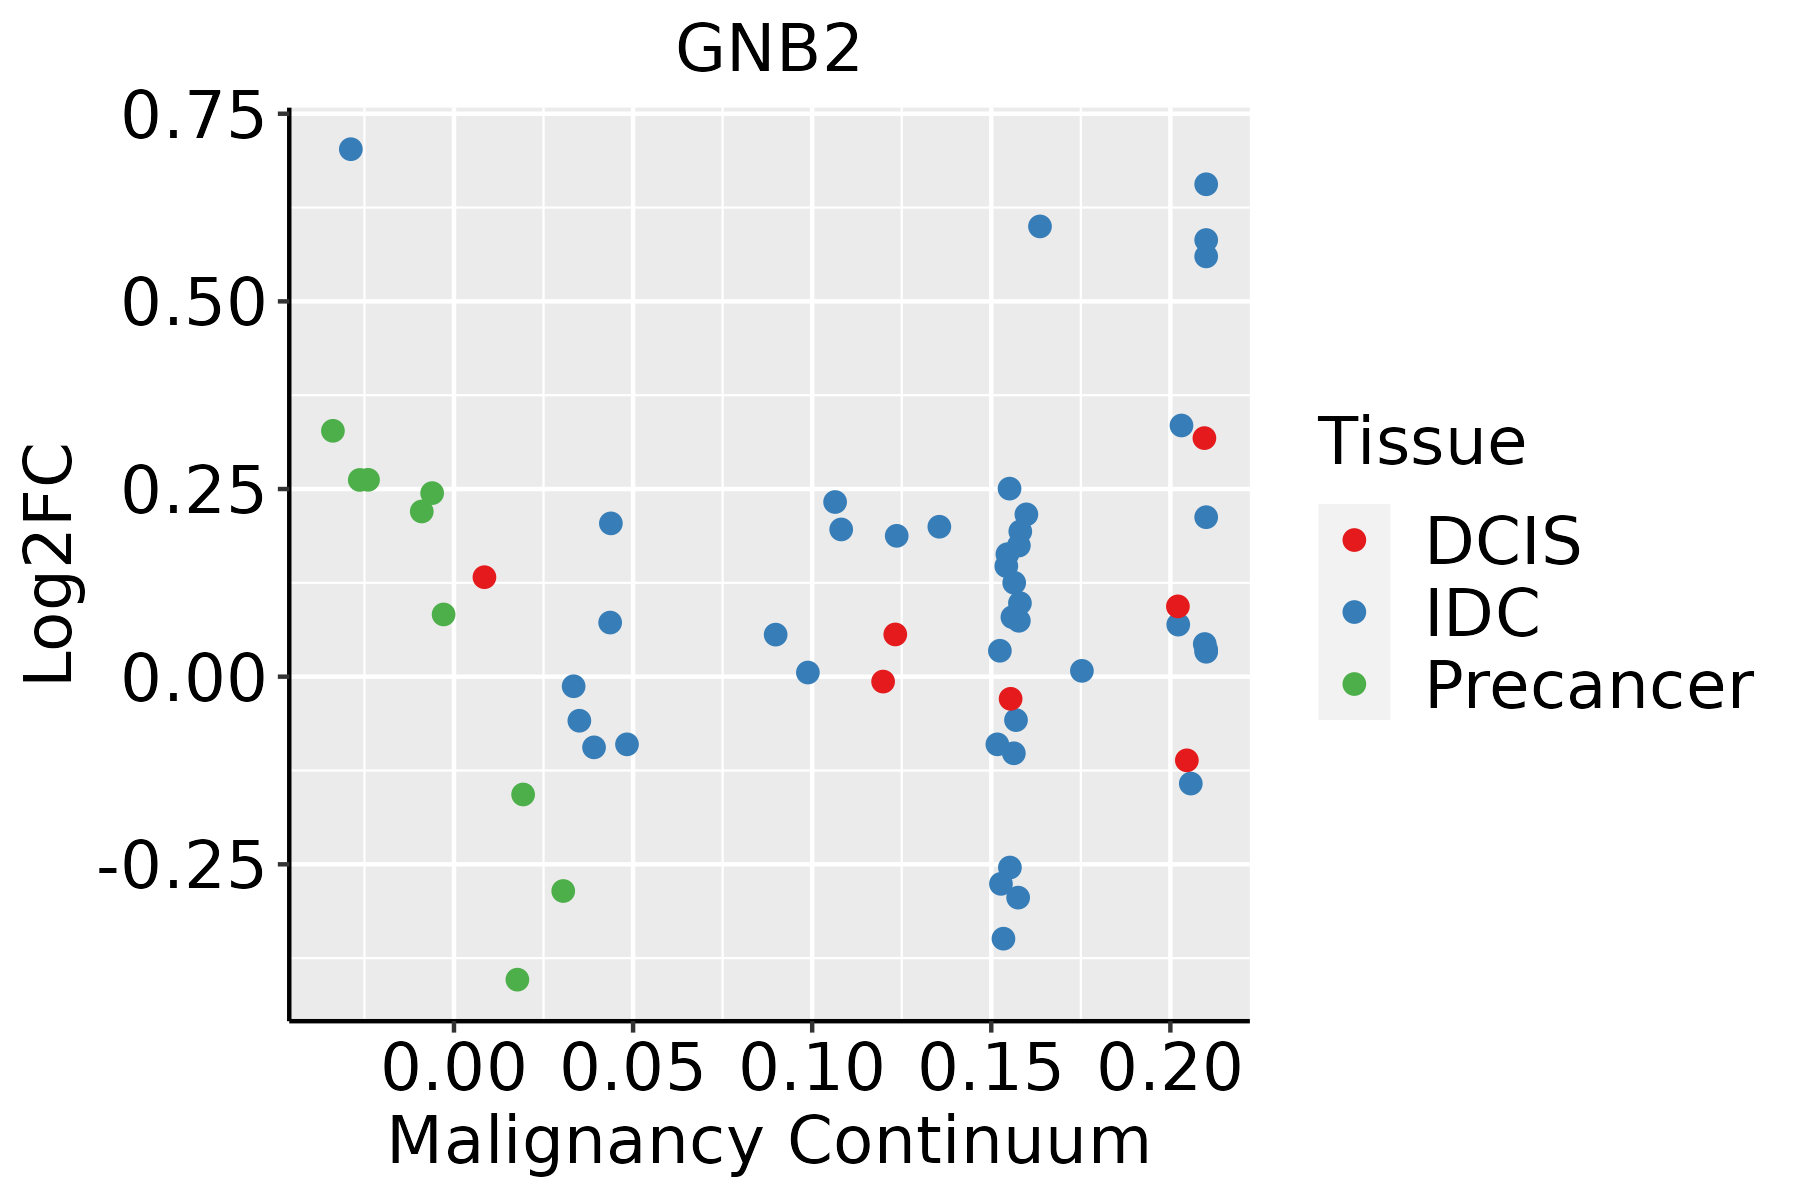
IDC: Invasive ductal carcinoma
DCIS: Ductal carcinoma in situ
Precancer(BRCA1-mut): Precancerous lesion from BRCA1 mutation carriers
Colorectum (GSE201348)The image shows the transcriptomic changes along malignancy continuum.log2FC in expression of this searched gene in stem-like cells from each diseased tissue sample relative to stem-like cells in normal samples in each tissue plotted against the malignancy continuum. Samples are colored based on if they are from different disease stage.FAP: Familial adenomatous polyposis
CRC: Colorectal cancer
Colorectum (HTA11)The image shows the transcriptomic changes along malignancy continuum.log2FC in expression of this searched gene in stem-like cells from each diseased tissue sample relative to stem-like cells in normal samples in each tissue plotted against the malignancy continuum. Samples are colored based on if they are from different disease stage.AD: Adenomas
SER: Sessile serrated lesions
MSI-H: Microsatellite-high colorectal cancer
MSS: Microsatellite stable colorectal cancer
EndometriumThe image shows the transcriptomic changes along malignancy continuum.log2FC in expression of this searched gene in stem-like cells from each diseased tissue sample relative to stem-like cells in normal samples in each tissue plotted against the malignancy continuum. Samples are colored based on if they are from different disease stage.
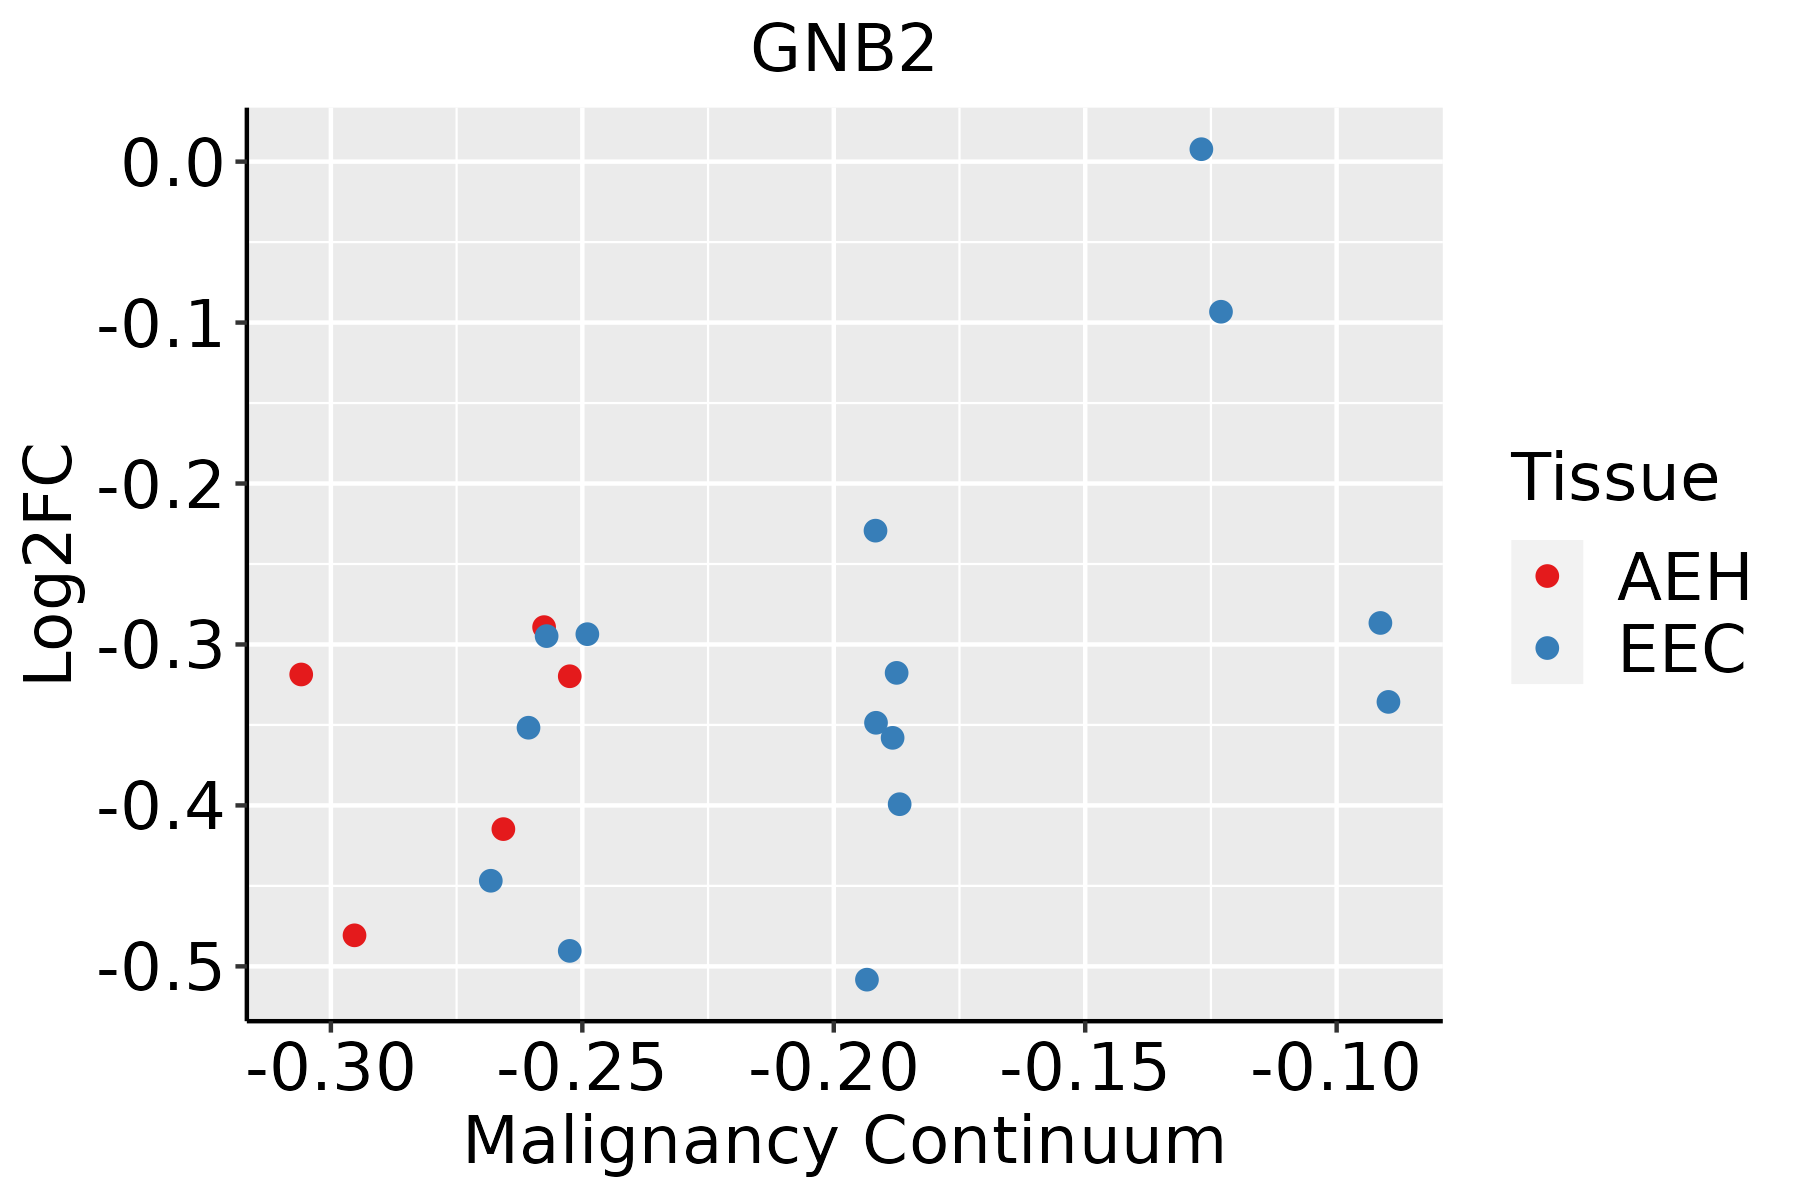
AEH: Atypical endometrial hyperplasia
EEC: Endometrioid Cancer
EsophagusThe image shows the transcriptomic changes along malignancy continuum.log2FC in expression of this searched gene in stem-like cells from each diseased tissue sample relative to stem-like cells in normal samples in each tissue plotted against the malignancy continuum. Samples are colored based on if they are from different disease stage.ESCC: Esophageal squamous cell carcinoma
HGIN: High-grade intraepithelial neoplasias
LGIN: Low-grade intraepithelial neoplasias
GCThe image shows the transcriptomic changes along malignancy continuum.log2FC in expression of this searched gene in stem-like cells from each diseased tissue sample relative to stem-like cells in normal samples in each tissue plotted against the malignancy continuum. Samples are colored based on if they are from different disease stage.
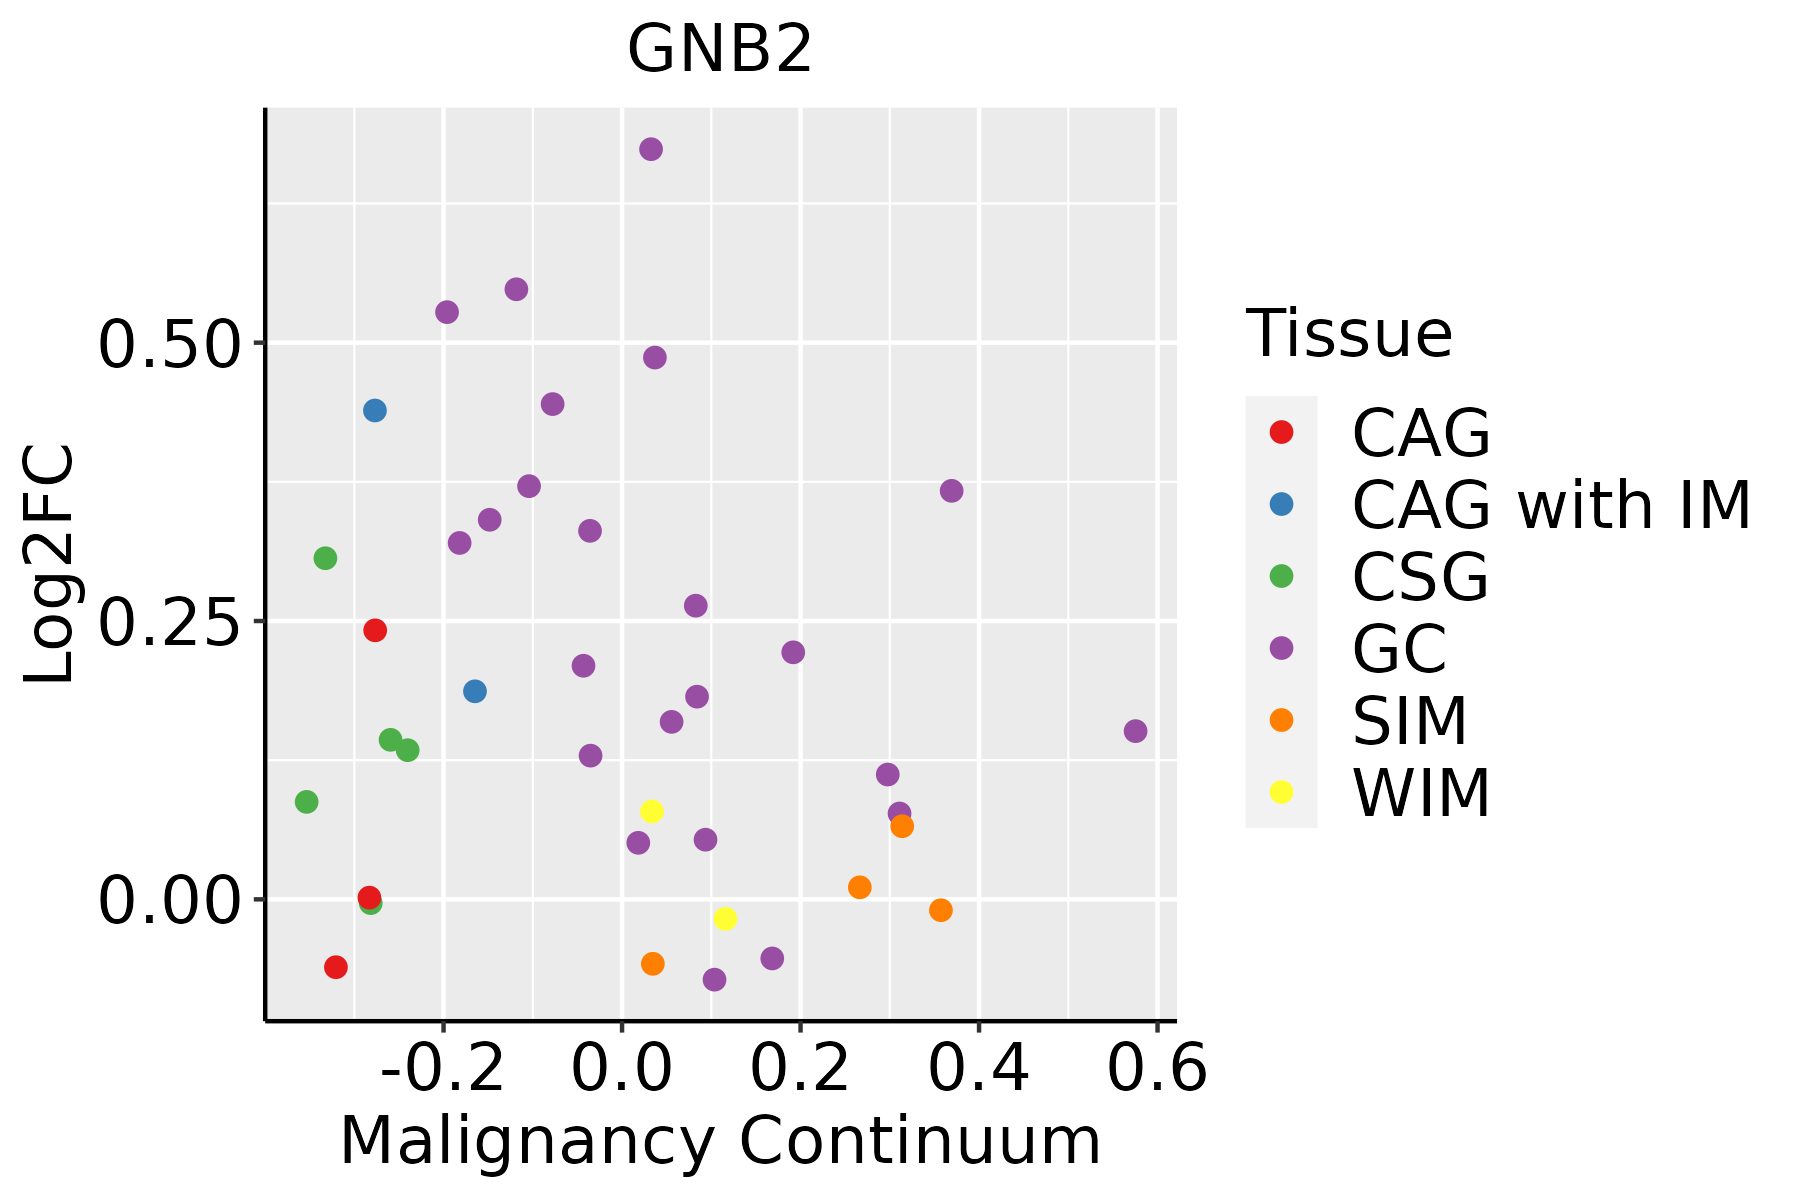
CAG: Chronic atrophic gastritis
CAG with IM: Chronic atrophic gastritis with intestinal metaplasia
CSG: Chronic superficial gastritis
GC: Gastric cancer
SIM: Severe intestinal metaplasia
WIM: Wild intestinal metaplasia
LiverThe image shows the transcriptomic changes along malignancy continuum.log2FC in expression of this searched gene in stem-like cells from each diseased tissue sample relative to stem-like cells in normal samples in each tissue plotted against the malignancy continuum. Samples are colored based on if they are from different disease stage.
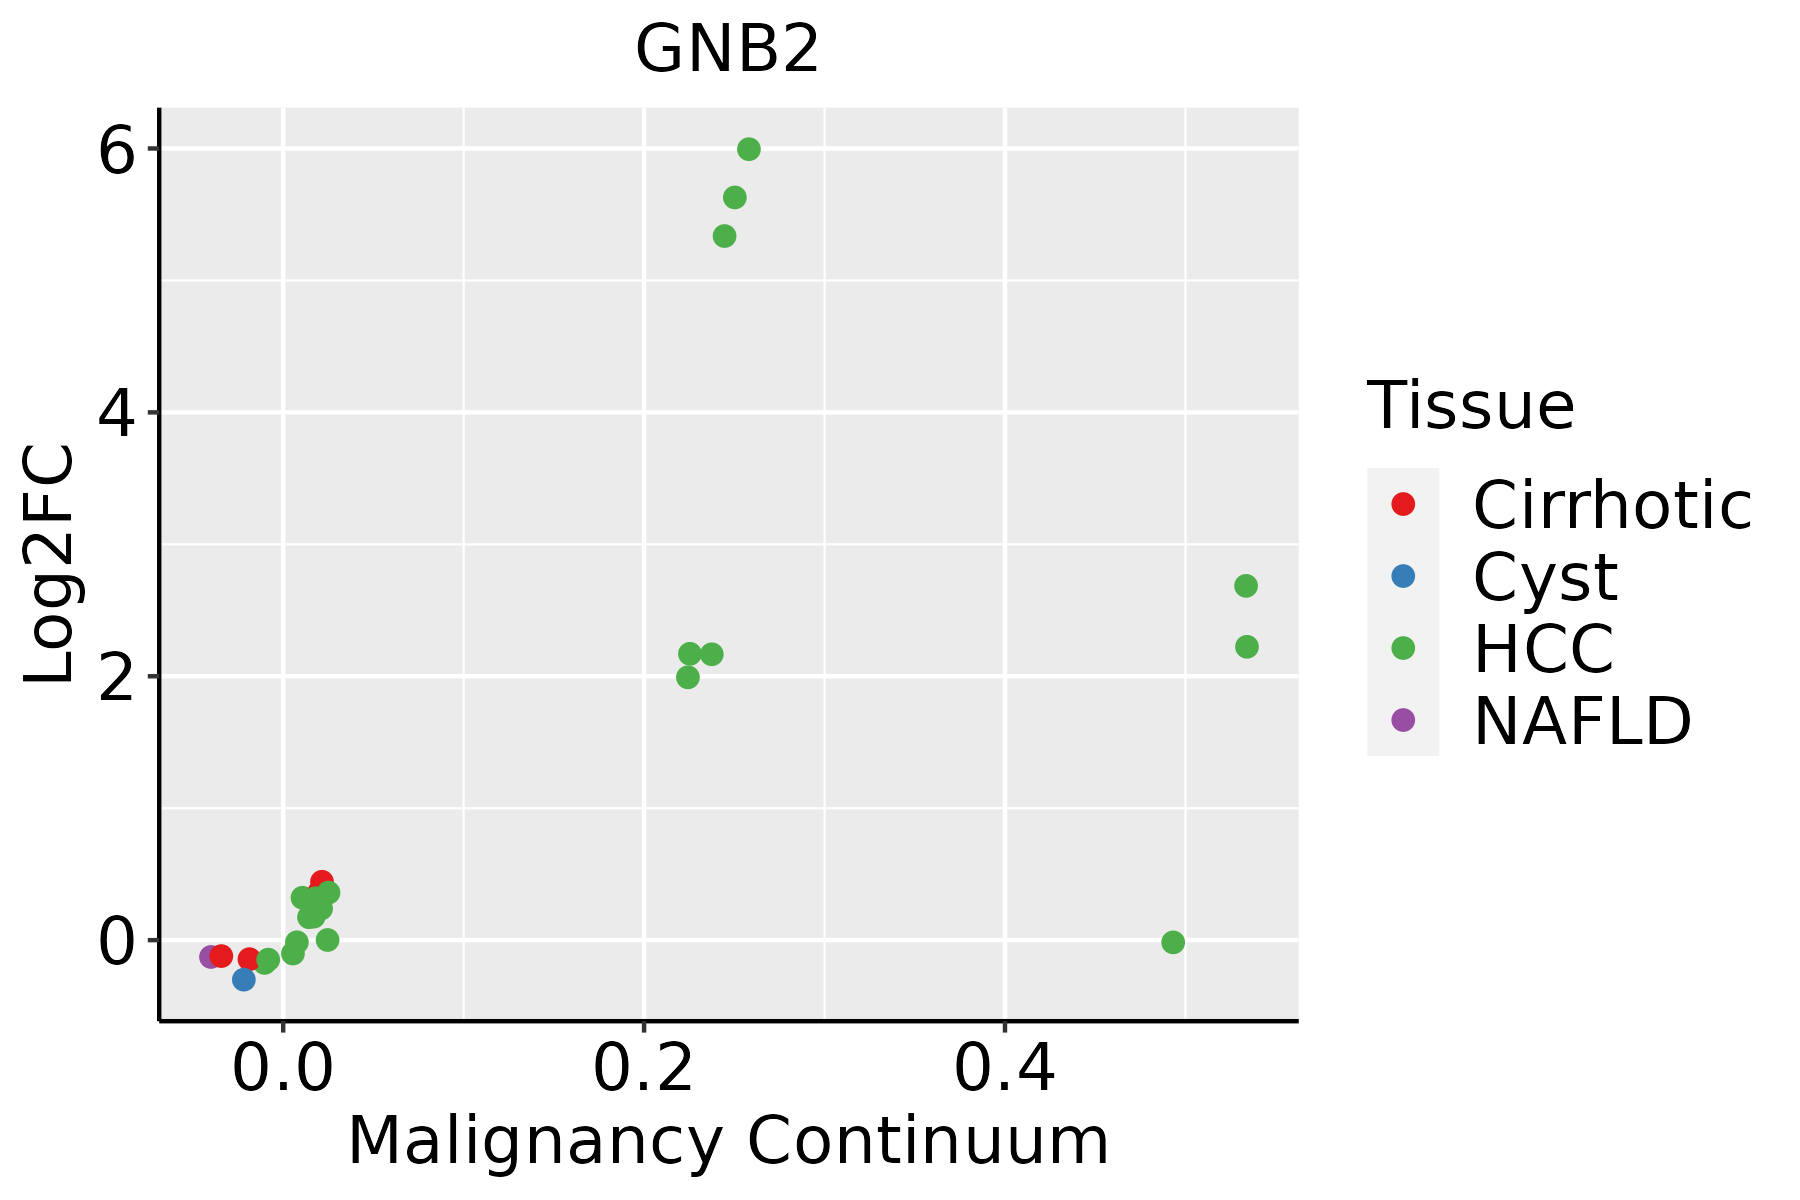
HCC: Hepatocellular carcinoma
NAFLD: Non-alcoholic fatty liver disease
Oral CavityThe image shows the transcriptomic changes along malignancy continuum.log2FC in expression of this searched gene in stem-like cells from each diseased tissue sample relative to stem-like cells in normal samples in each tissue plotted against the malignancy continuum. Samples are colored based on if they are from different disease stage.
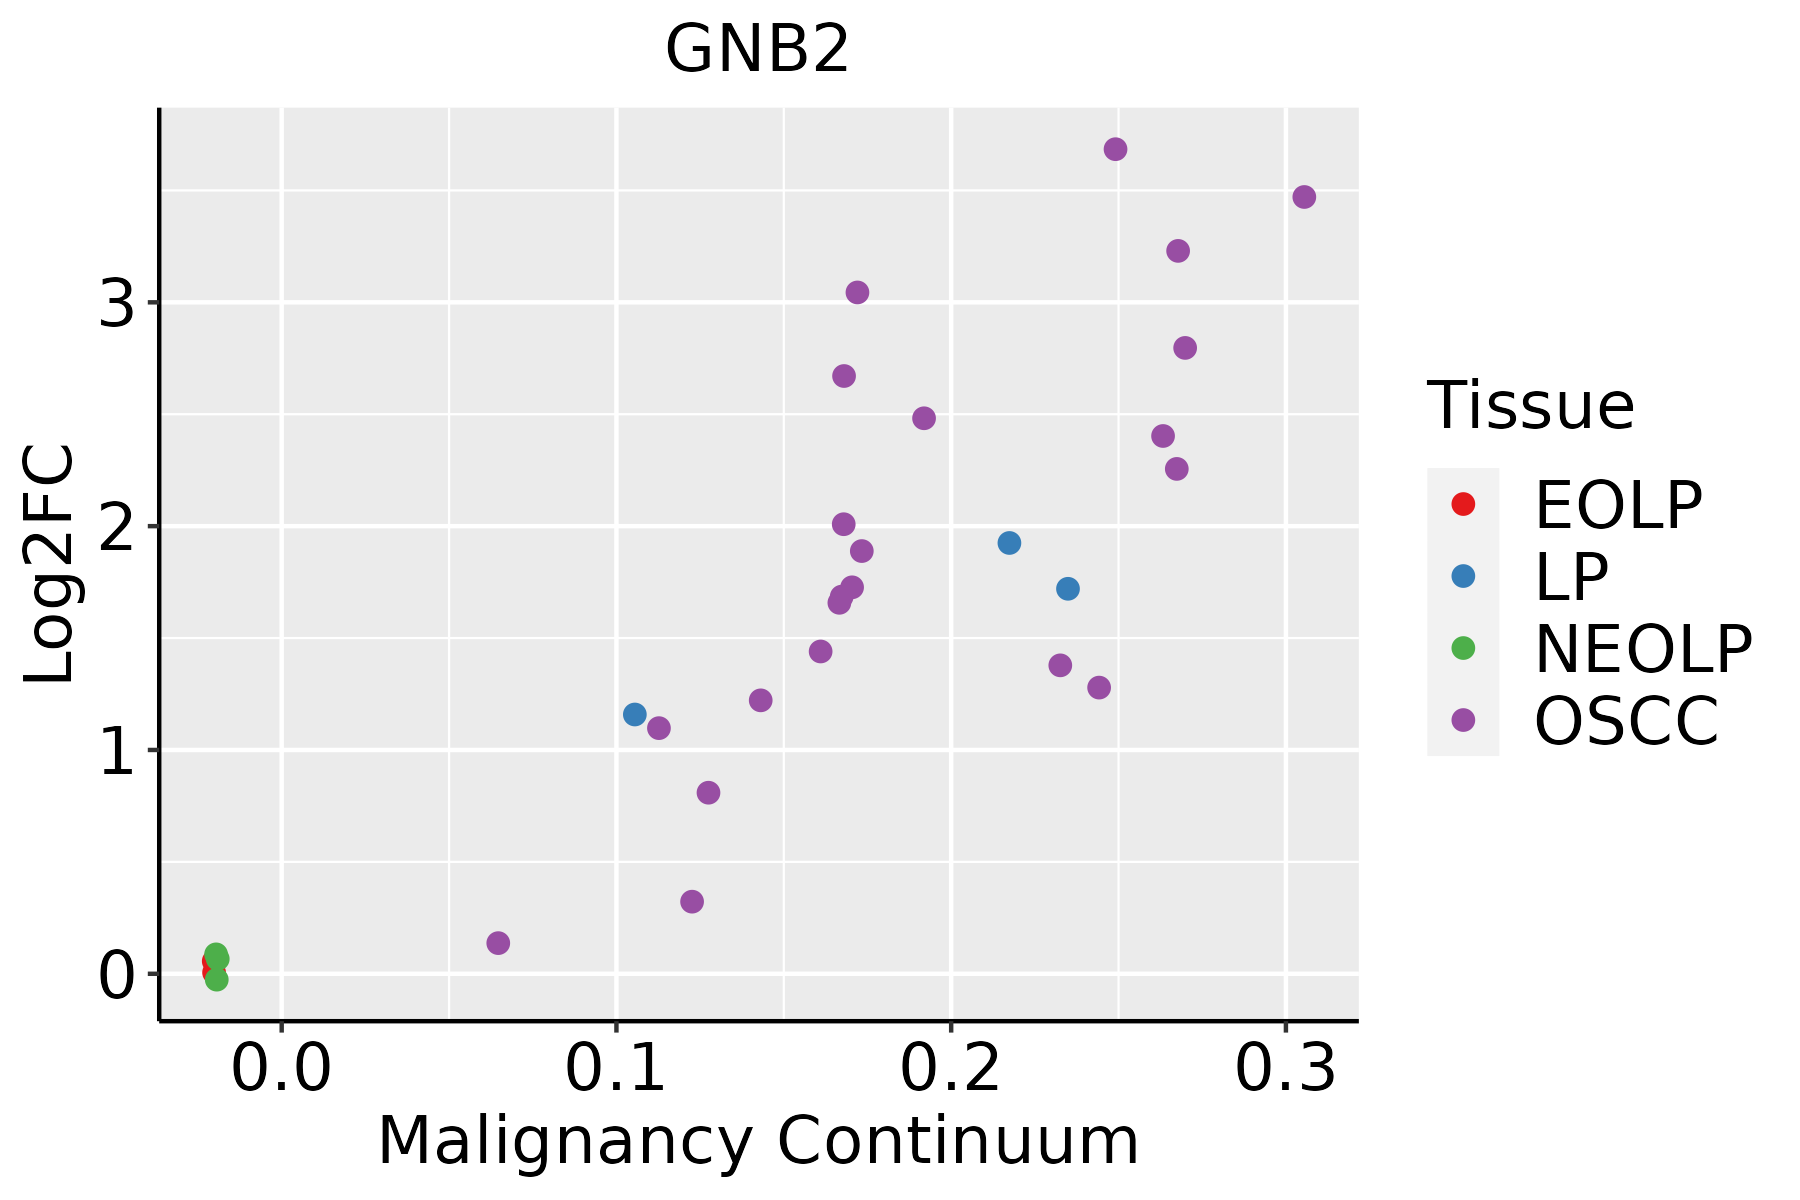
EOLP: Erosive Oral lichen planus
LP: leukoplakia
NEOLP: Non-erosive oral lichen planus
OSCC: Oral squamous cell carcinoma
ProstateThe image shows the transcriptomic changes along malignancy continuum.log2FC in expression of this searched gene in stem-like cells from each diseased tissue sample relative to stem-like cells in normal samples in each tissue plotted against the malignancy continuum. Samples are colored based on if they are from different disease stage.
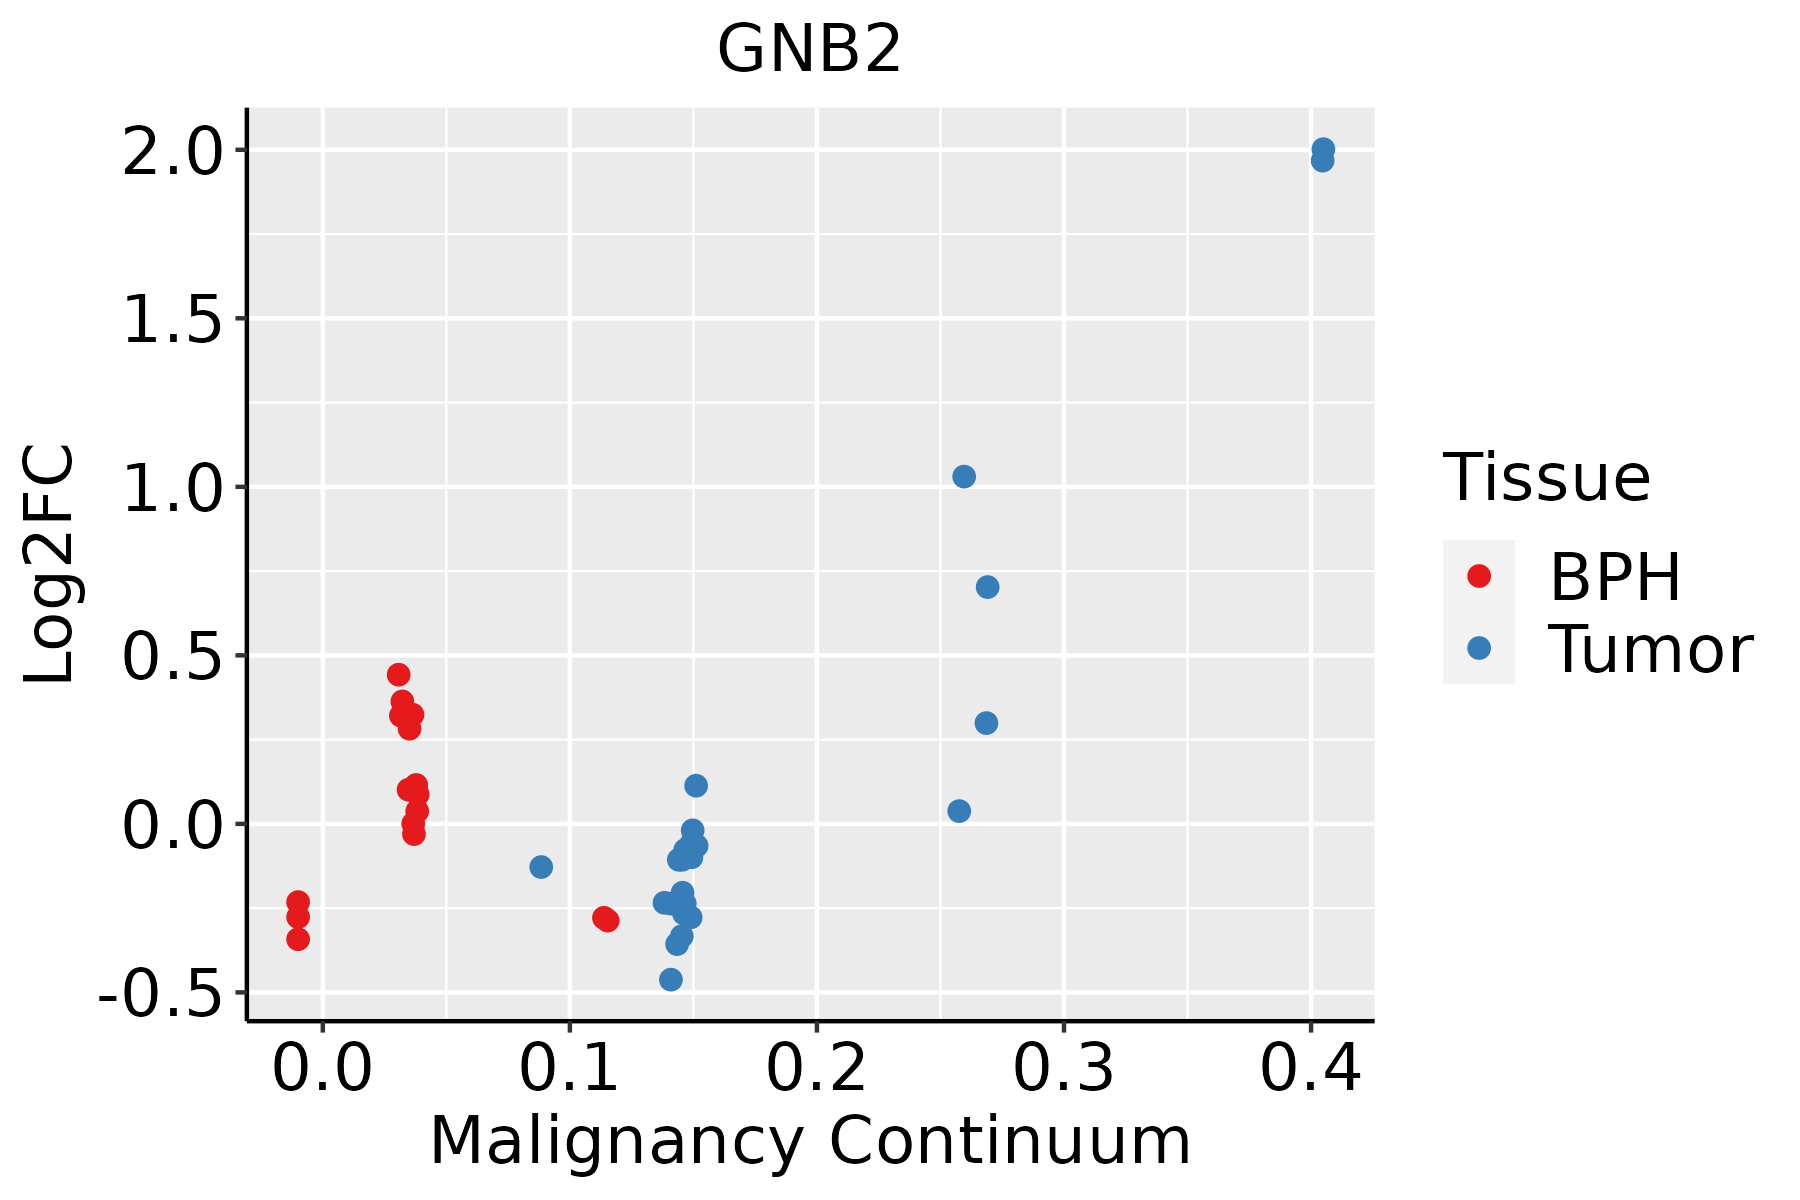
BPH: Benign Prostatic Hyperplasia
SkinThe image shows the transcriptomic changes along malignancy continuum.log2FC in expression of this searched gene in stem-like cells from each diseased tissue sample relative to stem-like cells in normal samples in each tissue plotted against the malignancy continuum. Samples are colored based on if they are from different disease stage.
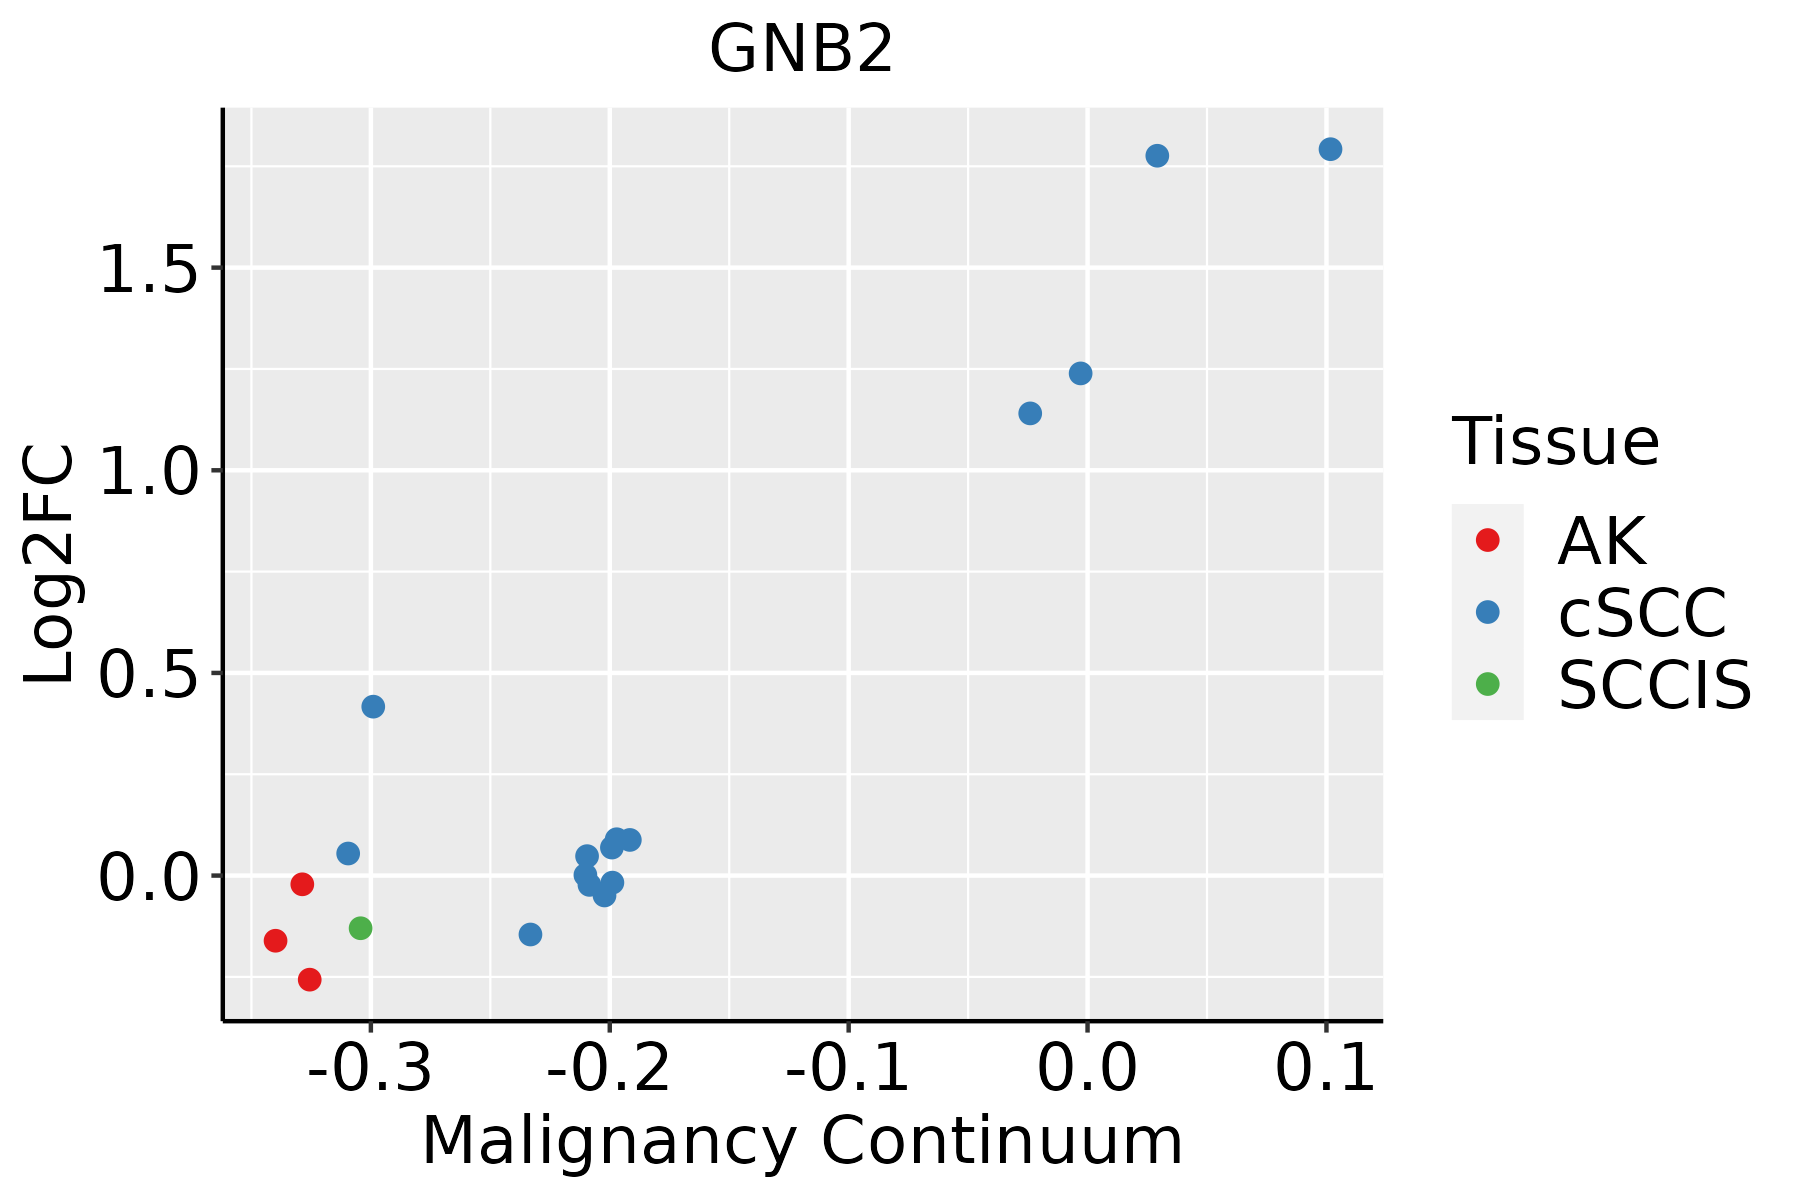
AK: Actinic keratosis
cSCC: Cutaneous squamous cell carcinoma
SCCIS:squamous cell carcinoma in situ
ThyroidThe image shows the transcriptomic changes along malignancy continuum.log2FC in expression of this searched gene in stem-like cells from each diseased tissue sample relative to stem-like cells in normal samples in each tissue plotted against the malignancy continuum. Samples are colored based on if they are from different disease stage.
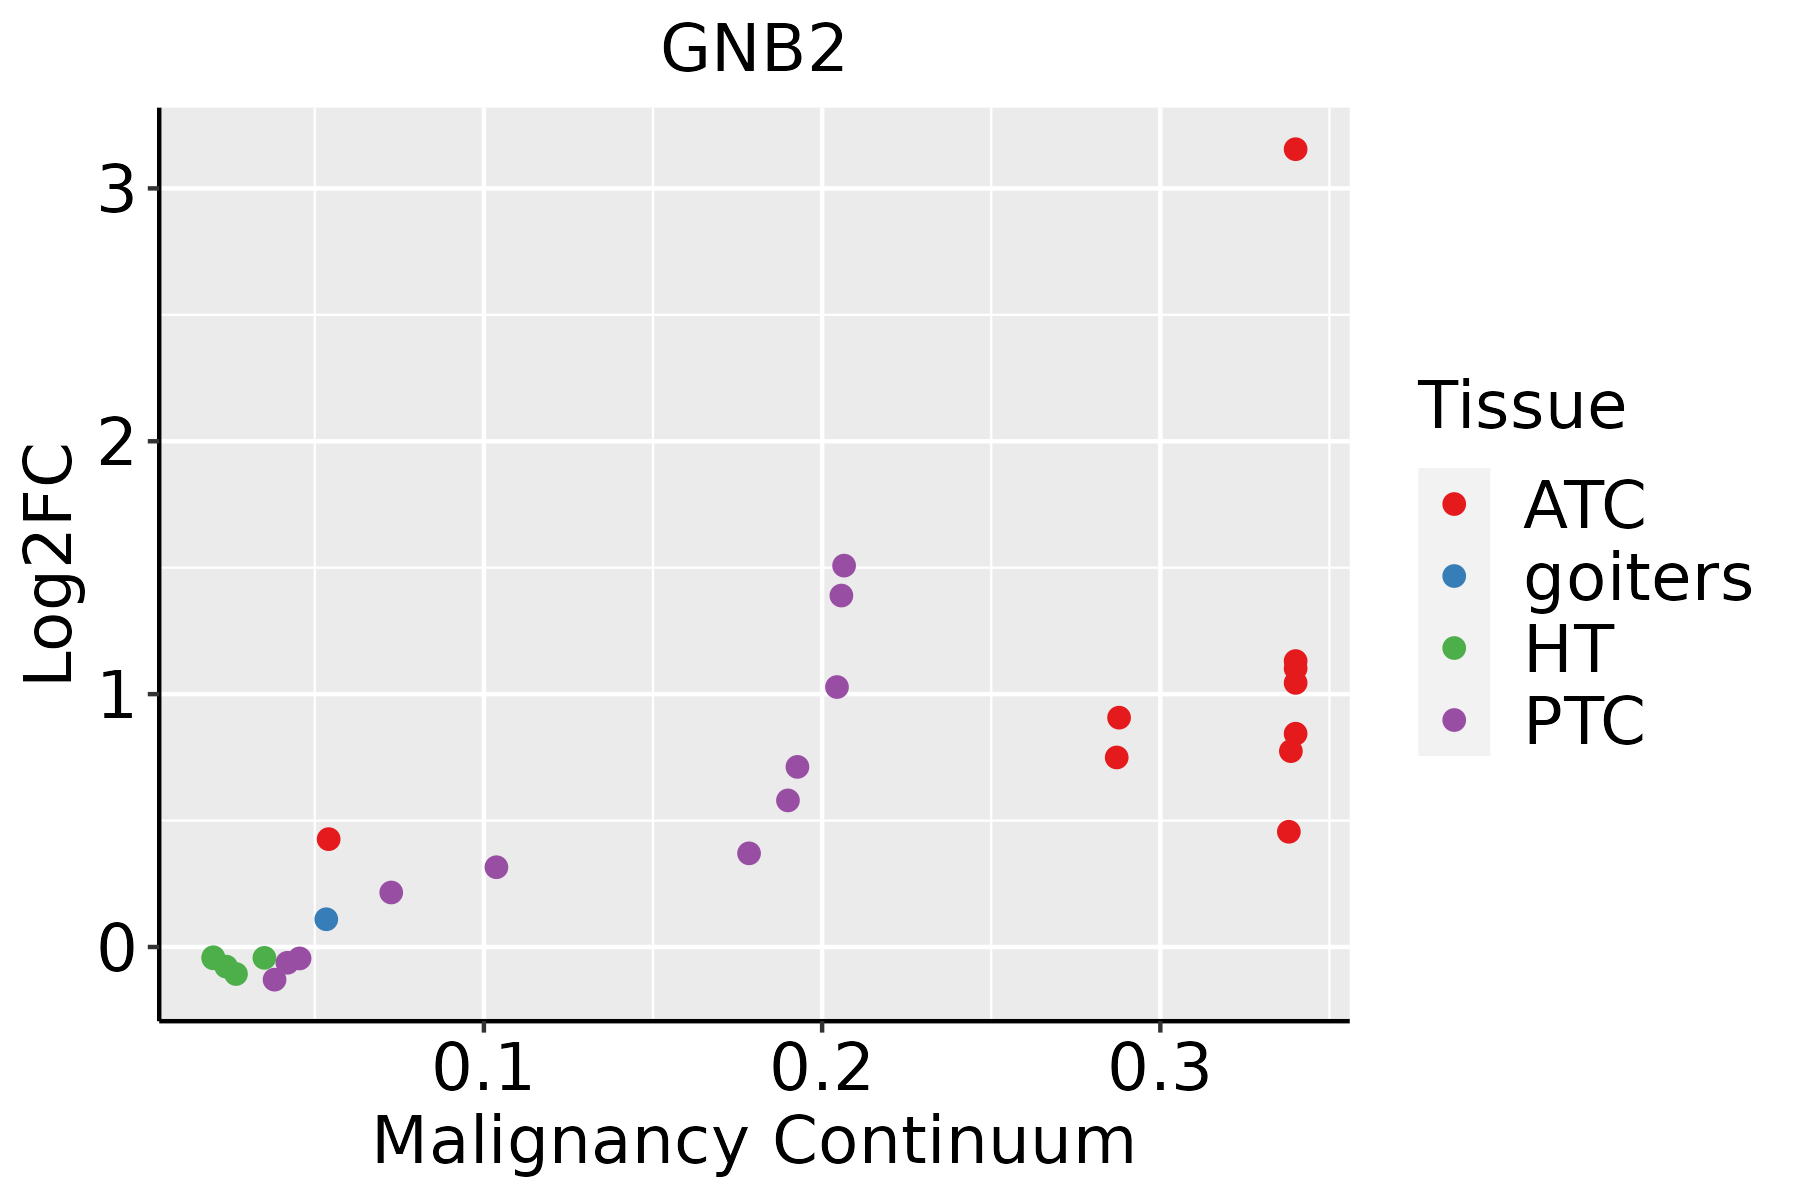
ATC: Anaplastic thyroid cancer
HT: Hashimoto's thyroiditis
PTC: Papillary thyroid cancer
∗log2FC in expression of this searched gene in stem-like cells from each diseased tissue sample relative to stem-like cells in normal samples in each tissue plotted against the malignancy continuum. Samples are colored based on if they are from different disease stage.

Top

Malignant transformation related pathway analysis

check buttonFind out the enriched GO biological processes and KEGG pathways involved in transition from healthy to precancer to cancer
check button Figure of enriched GO biological processes.
TissueDisease StageEnriched GO biological Processes
ColorectumADGO analysis - Figure of enriched GO biological processes: Top 15 enriched GO BP terms are showed in the bar plot of each disease state in each tissue. Each row represents a significant GO biological process which is colored according to the -log10(p.adjust).
ColorectumSERGO analysis - Figure of enriched GO biological processes: Top 15 enriched GO BP terms are showed in the bar plot of each disease state in each tissue. Each row represents a significant GO biological process which is colored according to the -log10(p.adjust).
ColorectumMSSGO analysis - Figure of enriched GO biological processes: Top 15 enriched GO BP terms are showed in the bar plot of each disease state in each tissue. Each row represents a significant GO biological process which is colored according to the -log10(p.adjust).
ColorectumMSI-HGO analysis - Figure of enriched GO biological processes: Top 15 enriched GO BP terms are showed in the bar plot of each disease state in each tissue. Each row represents a significant GO biological process which is colored according to the -log10(p.adjust).
ColorectumFAPGO analysis - Figure of enriched GO biological processes: Top 15 enriched GO BP terms are showed in the bar plot of each disease state in each tissue. Each row represents a significant GO biological process which is colored according to the -log10(p.adjust).
∗Top 15 enriched GO BP terms are showed in the bar plot of each disease state in each tissue. Each row represents a significant GO biological process which is colored according to the -log10(p.adjust).
Page: 1 2 3 4 5 6 7 8 9 

check button Enriched GO biological processes.
GO IDTissueDisease StageDescriptionGene RatioBg Ratiopvaluep.adjustCount
Page: 1 

check button Enriched KEGG pathways.
Pathway IDTissueDisease StageDescriptionGene RatioBg Ratiopvaluep.adjustqvalueCount
hsa0516718BreastPrecancerKaposi sarcoma-associated herpesvirus infection36/684194/84651.68e-062.53e-051.94e-0536
hsa0472316BreastPrecancerRetrograde endocannabinoid signaling25/684148/84653.05e-042.47e-031.89e-0325
hsa0516316BreastPrecancerHuman cytomegalovirus infection32/684225/84651.13e-037.57e-035.80e-0332
hsa0516719BreastPrecancerKaposi sarcoma-associated herpesvirus infection36/684194/84651.68e-062.53e-051.94e-0536
hsa0472317BreastPrecancerRetrograde endocannabinoid signaling25/684148/84653.05e-042.47e-031.89e-0325
hsa0516317BreastPrecancerHuman cytomegalovirus infection32/684225/84651.13e-037.57e-035.80e-0332
hsa0516723BreastIDCKaposi sarcoma-associated herpesvirus infection38/867194/84655.87e-055.96e-044.46e-0438
hsa0472323BreastIDCRetrograde endocannabinoid signaling31/867148/84657.62e-057.50e-045.61e-0431
hsa0516324BreastIDCHuman cytomegalovirus infection39/867225/84656.66e-045.41e-034.05e-0339
hsa0517014BreastIDCHuman immunodeficiency virus 1 infection33/867212/84659.28e-034.37e-023.27e-0233
hsa0516733BreastIDCKaposi sarcoma-associated herpesvirus infection38/867194/84655.87e-055.96e-044.46e-0438
hsa0472333BreastIDCRetrograde endocannabinoid signaling31/867148/84657.62e-057.50e-045.61e-0431
hsa0516334BreastIDCHuman cytomegalovirus infection39/867225/84656.66e-045.41e-034.05e-0339
hsa0517015BreastIDCHuman immunodeficiency virus 1 infection33/867212/84659.28e-034.37e-023.27e-0233
hsa0516743BreastDCISKaposi sarcoma-associated herpesvirus infection38/846194/84653.43e-053.69e-042.72e-0438
hsa0472342BreastDCISRetrograde endocannabinoid signaling29/846148/84652.82e-042.34e-031.72e-0329
hsa0516344BreastDCISHuman cytomegalovirus infection38/846225/84658.11e-045.95e-034.38e-0338
hsa0517024BreastDCISHuman immunodeficiency virus 1 infection33/846212/84656.49e-033.22e-022.37e-0233
hsa0516753BreastDCISKaposi sarcoma-associated herpesvirus infection38/846194/84653.43e-053.69e-042.72e-0438
hsa0472352BreastDCISRetrograde endocannabinoid signaling29/846148/84652.82e-042.34e-031.72e-0329
Page: 1 2 3 4 5 6 7 8 9 

Top

Cell-cell communication analysis

check buttonIdentification of potential cell-cell interactions between two cell types and their ligand-receptor pairs for different disease states
LigandReceptorLRpairPathwayTissueDisease Stage
Page: 1 

Top

Single-cell gene regulatory network inference analysis

check buttonFind out the significant the regulons (TFs) and the target genes of each regulon across cell types for different disease states
TFCell TypeTissueDisease StageTarget GeneRSSRegulon Activity
∗The dot plots of a searched regulon are shown for all cell subpopulations in each disease state of each tissue based on the regulon specific score inferred using pySCENIC and by calculating the average expression.
Page: 1 

Top

Somatic mutation of malignant transformation related genes

check buttonAnnotation of somatic variants for genes involved in malignant transformation
Hugo SymbolVariant ClassVariant ClassificationdbSNP RSHGVScHGVSpHGVSp ShortSWISSPROTBIOTYPESIFTPolyPhenTumor Sample BarcodeTissueHistologySexAgeStageTherapy TypesDrugsOutcome
GNB2SNVMissense_Mutationc.922N>Tp.Leu308Phep.L308FP62879protein_codingdeleterious(0.01)probably_damaging(0.999)TCGA-C8-A26W-01Breastbreast invasive carcinomaFemale<65I/IIChemotherapydoxorubicinCR
GNB2insertionFrame_Shift_Insnovelc.235_236insCAGGGCAGGATCACTTGAGCTCAGGAGTTp.Leu79ProfsTer32p.L79Pfs*32P62879protein_codingTCGA-A8-A08H-01Breastbreast invasive carcinomaFemale>=65I/IIUnknownUnknownSD
GNB2insertionFrame_Shift_Insnovelc.193_194insTGTTCTCTTCTCTCCCTTTCCTCp.Thr65MetfsTer44p.T65Mfs*44P62879protein_codingTCGA-BH-A0B1-01Breastbreast invasive carcinomaFemale>=65I/IIChemotherapyadriamycinSD
GNB2SNVMissense_Mutationrs760148387c.964G>Ap.Asp322Asnp.D322NP62879protein_codingtolerated(0.17)benign(0.217)TCGA-FU-A3HZ-01Cervixcervical & endocervical cancerFemale<65I/IIChemotherapycisplatinCR
GNB2SNVMissense_Mutationc.955G>Ap.Gly319Argp.G319RP62879protein_codingtolerated(0.33)probably_damaging(1)TCGA-DM-A1DB-01Colorectumcolon adenocarcinomaMale>=65I/IIUnknownUnknownSD
GNB2SNVMissense_Mutationc.449G>Ap.Arg150Hisp.R150HP62879protein_codingdeleterious(0.02)probably_damaging(0.999)TCGA-A5-A0G2-01Endometriumuterine corpus endometrioid carcinomaFemale<65III/IVUnknownUnknownSD
GNB2SNVMissense_Mutationc.449G>Ap.Arg150Hisp.R150HP62879protein_codingdeleterious(0.02)probably_damaging(0.999)TCGA-A5-A1OF-01Endometriumuterine corpus endometrioid carcinomaFemale<65I/IIUnknownUnknownSD
GNB2SNVMissense_Mutationnovelc.766N>Tp.Arg256Trpp.R256WP62879protein_codingdeleterious(0)probably_damaging(0.996)TCGA-AJ-A3EK-01Endometriumuterine corpus endometrioid carcinomaFemale<65I/IIChemotherapycarboplatinCR
GNB2SNVMissense_Mutationc.217N>Ap.Ala73Thrp.A73TP62879protein_codingdeleterious(0)probably_damaging(0.971)TCGA-AJ-A3OK-01Endometriumuterine corpus endometrioid carcinomaFemale>=65I/IIChemotherapycarboplatinCR
GNB2SNVMissense_Mutationc.682G>Ap.Asp228Asnp.D228NP62879protein_codingdeleterious(0)possibly_damaging(0.818)TCGA-AX-A2HC-01Endometriumuterine corpus endometrioid carcinomaFemale<65III/IVChemotherapypaclitaxelPD
Page: 1 2 3 4 

Top

Related drugs of malignant transformation related genes

check buttonIdentification of chemicals and drugs interact with genes involved in malignant transfromation
(DGIdb 4.0)
Entrez IDSymbolCategoryInteraction TypesDrug Claim NameDrug NamePMIDs
Page: 1