| Entrez ID | Symbol | Replicates | Species | Organ | Tissue | Adj P-value | Log2FC | Malignancy |
| 2317 | FLNB | P7 | Human | Prostate | Tumor | 3.22e-02 | 6.43e-01 | -0.1025 |
| 2317 | FLNB | P10 | Human | Prostate | Tumor | 4.48e-03 | 5.20e-01 | -0.0902 |
| 2317 | FLNB | GSM5353215_PA_AUG_PB_1B_S2 | Human | Prostate | Tumor | 1.46e-08 | 9.85e-01 | 0.1557 |
| 2317 | FLNB | GSM5353216_PA_PB1A_Pool_1_3_S50_L002 | Human | Prostate | Tumor | 5.23e-04 | 6.80e-01 | 0.159 |
| 2317 | FLNB | GSM5353217_PA_PB1A_Pool_2_S107_L004 | Human | Prostate | Tumor | 3.41e-04 | 9.59e-01 | 0.156 |
| 2317 | FLNB | GSM5353221_PA_PB2A_Pool_1_3_S25_L001 | Human | Prostate | Tumor | 1.56e-12 | 7.54e-01 | 0.1633 |
| 2317 | FLNB | GSM5353222_PA_PB2B_Pool_1_3_S52_L002 | Human | Prostate | Tumor | 5.41e-19 | 8.05e-01 | 0.1608 |
| 2317 | FLNB | GSM5353223_PA_PB2B_Pool_2_S26_L001 | Human | Prostate | Tumor | 1.12e-17 | 9.23e-01 | 0.1604 |
| 2317 | FLNB | GSM5353224_PA_PR5186_Pool_1_2_3_S27_L001 | Human | Prostate | Tumor | 1.54e-10 | 7.13e-01 | 0.1621 |
| 2317 | FLNB | GSM5353225_PA_PR5196-1_Pool_1_2_3_S53_L002 | Human | Prostate | Tumor | 8.45e-07 | 7.68e-01 | 0.1619 |
| 2317 | FLNB | GSM5353226_PA_PR5196-2_Pool_1_2_3_S54_L002 | Human | Prostate | Tumor | 4.13e-04 | 7.67e-01 | 0.159 |
| 2317 | FLNB | GSM5353227_PA_PR5199-193K_Pool_1_2_3_S55_L002 | Human | Prostate | Tumor | 6.41e-09 | 6.63e-01 | 0.1602 |
| 2317 | FLNB | GSM5353232_PA_PR5249_T1_S3_L001 | Human | Prostate | Tumor | 1.64e-06 | 8.11e-01 | 0.1439 |
| 2317 | FLNB | GSM5353236_PA_PR5251_T1_S7_L001 | Human | Prostate | Tumor | 2.98e-13 | 9.75e-01 | 0.1608 |
| 2317 | FLNB | GSM5353237_PA_PR5251_T2_S8_L001 | Human | Prostate | Tumor | 1.91e-09 | 9.80e-01 | 0.1622 |
| 2317 | FLNB | GSM5353240_PA_PR5254_T1_S15_L001 | Human | Prostate | Tumor | 4.49e-18 | 7.55e-01 | 0.1575 |
| 2317 | FLNB | GSM5353243_PA_PR5261_T1_S23_L002 | Human | Prostate | Tumor | 1.23e-14 | 6.31e-01 | 0.1545 |
| 2317 | FLNB | GSM5353244_PA_PR5261_T2_S24_L002 | Human | Prostate | Tumor | 2.61e-14 | 7.23e-01 | 0.1569 |
| 2317 | FLNB | GSM5353248_PA_PR5269_4_S28_L002 | Human | Prostate | Tumor | 1.55e-05 | 7.41e-01 | 0.1541 |
| 2317 | FLNB | P1_S1_AK | Human | Skin | AK | 5.45e-19 | 5.19e-01 | -0.3399 |
| Tissue | Expression Dynamics | Abbreviation |
| Breast | 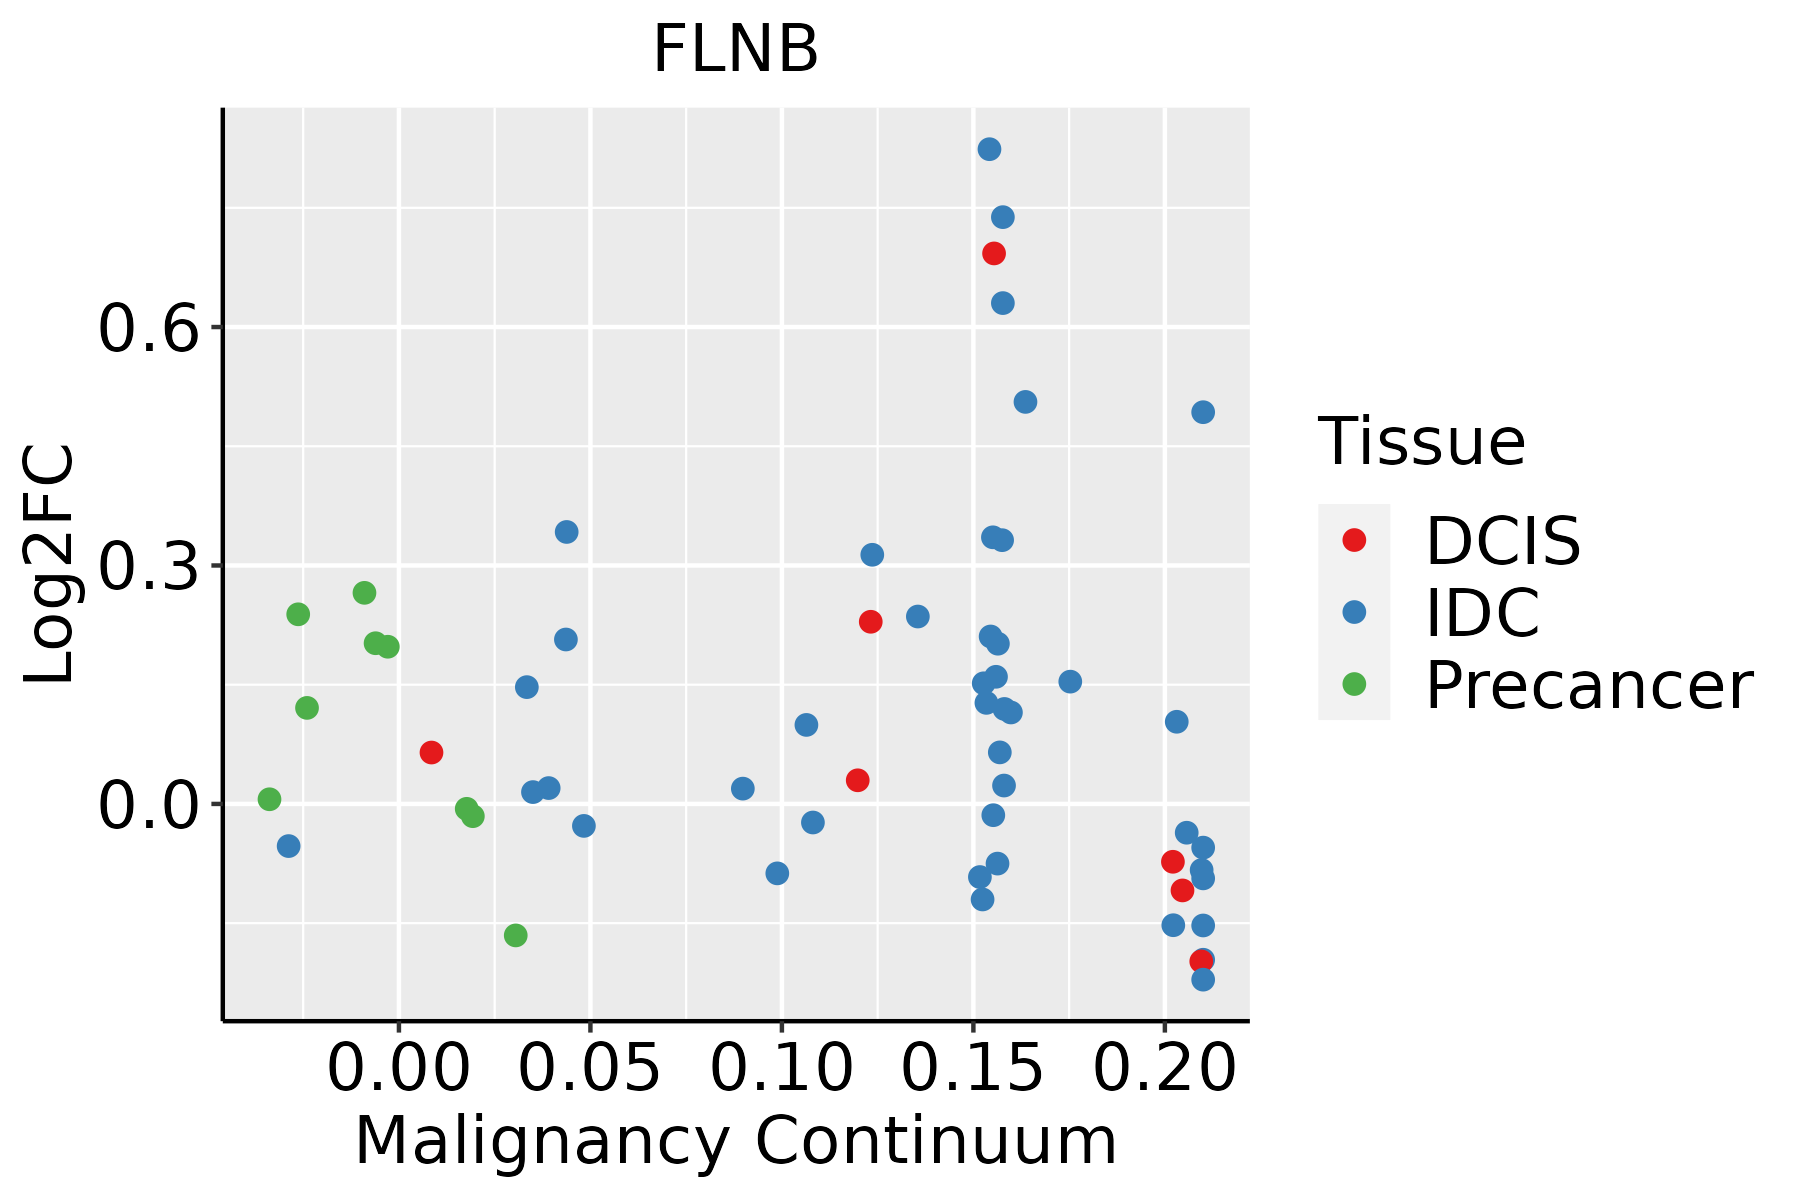 | IDC: Invasive ductal carcinoma |
| DCIS: Ductal carcinoma in situ |
| Precancer(BRCA1-mut): Precancerous lesion from BRCA1 mutation carriers |
| Cervix |  | CC: Cervix cancer |
| HSIL_HPV: HPV-infected high-grade squamous intraepithelial lesions |
| N_HPV: HPV-infected normal cervix |
| Colorectum (GSE201348) |  | FAP: Familial adenomatous polyposis |
| CRC: Colorectal cancer |
| Colorectum (HTA11) | 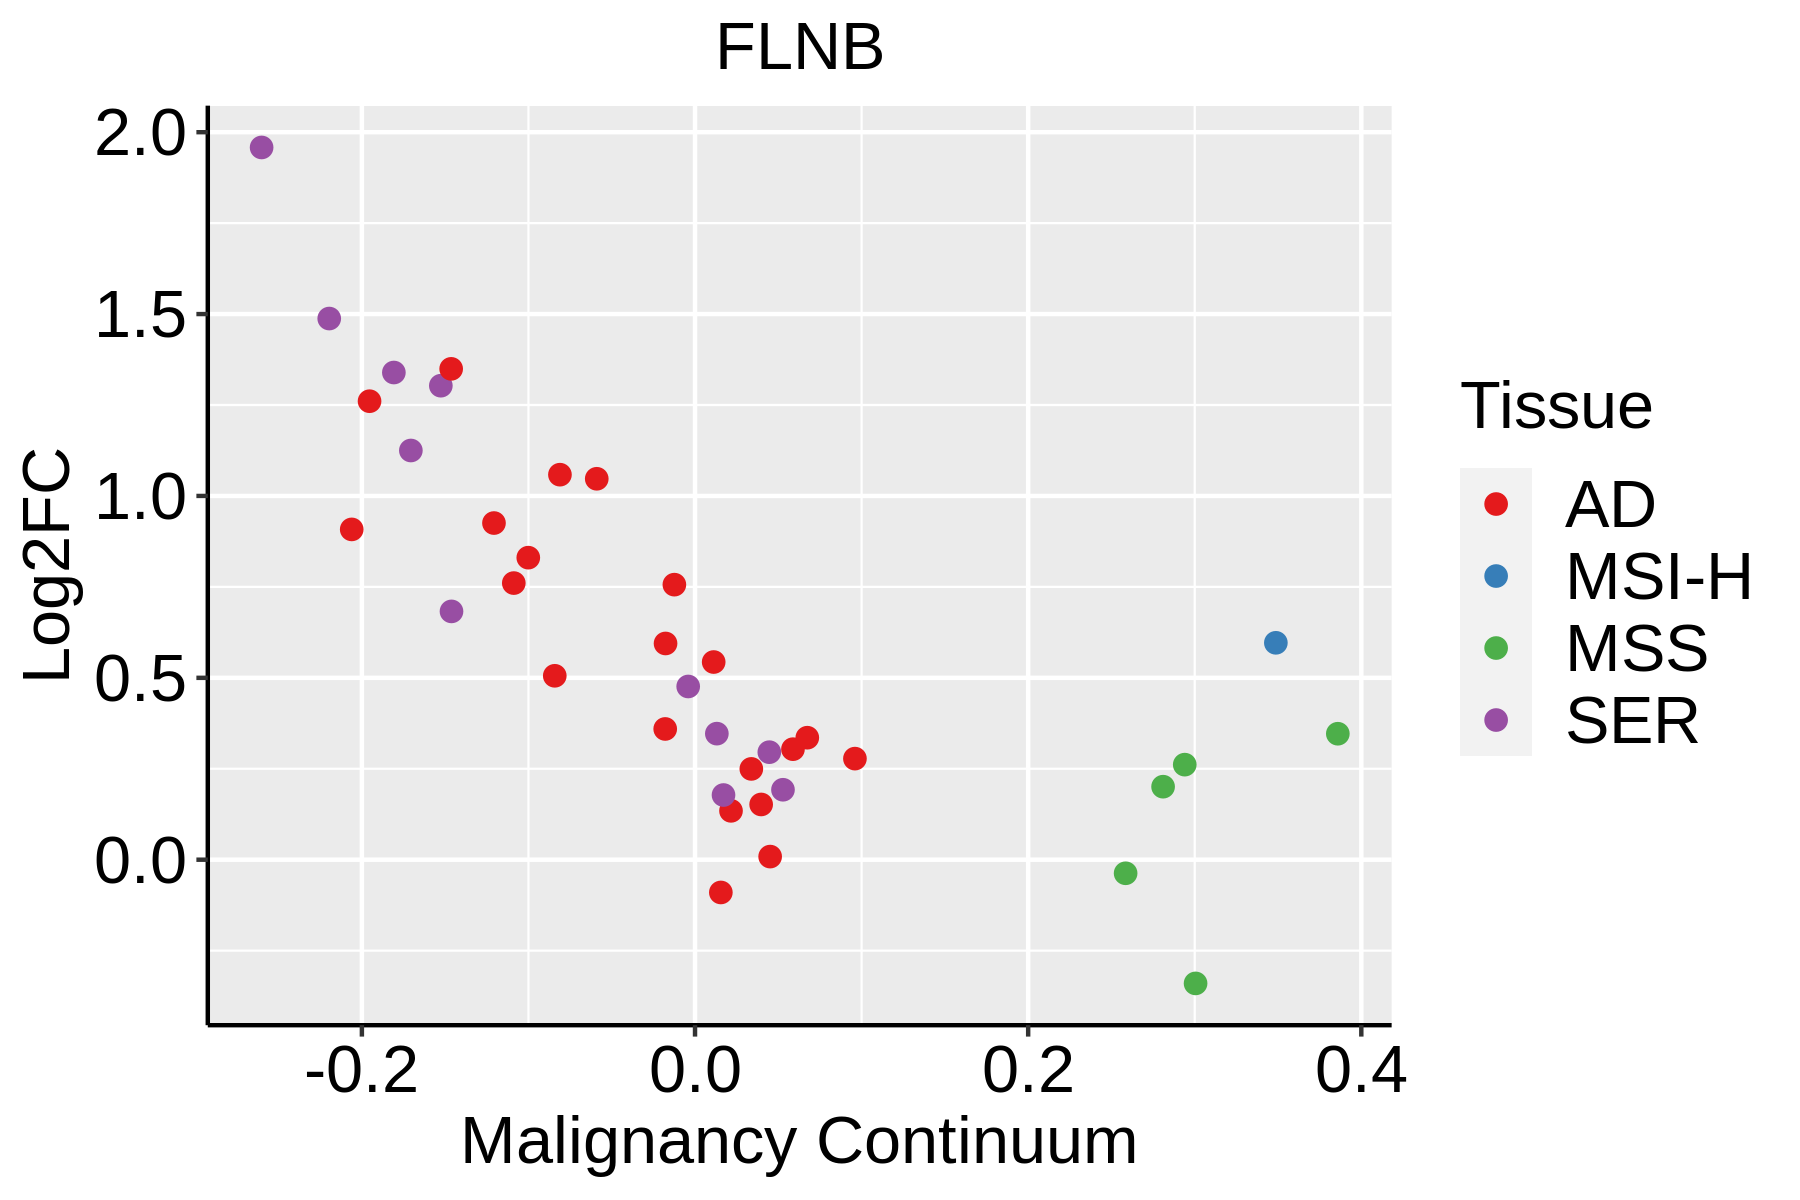 | AD: Adenomas |
| SER: Sessile serrated lesions |
| MSI-H: Microsatellite-high colorectal cancer |
| MSS: Microsatellite stable colorectal cancer |
| Endometrium | 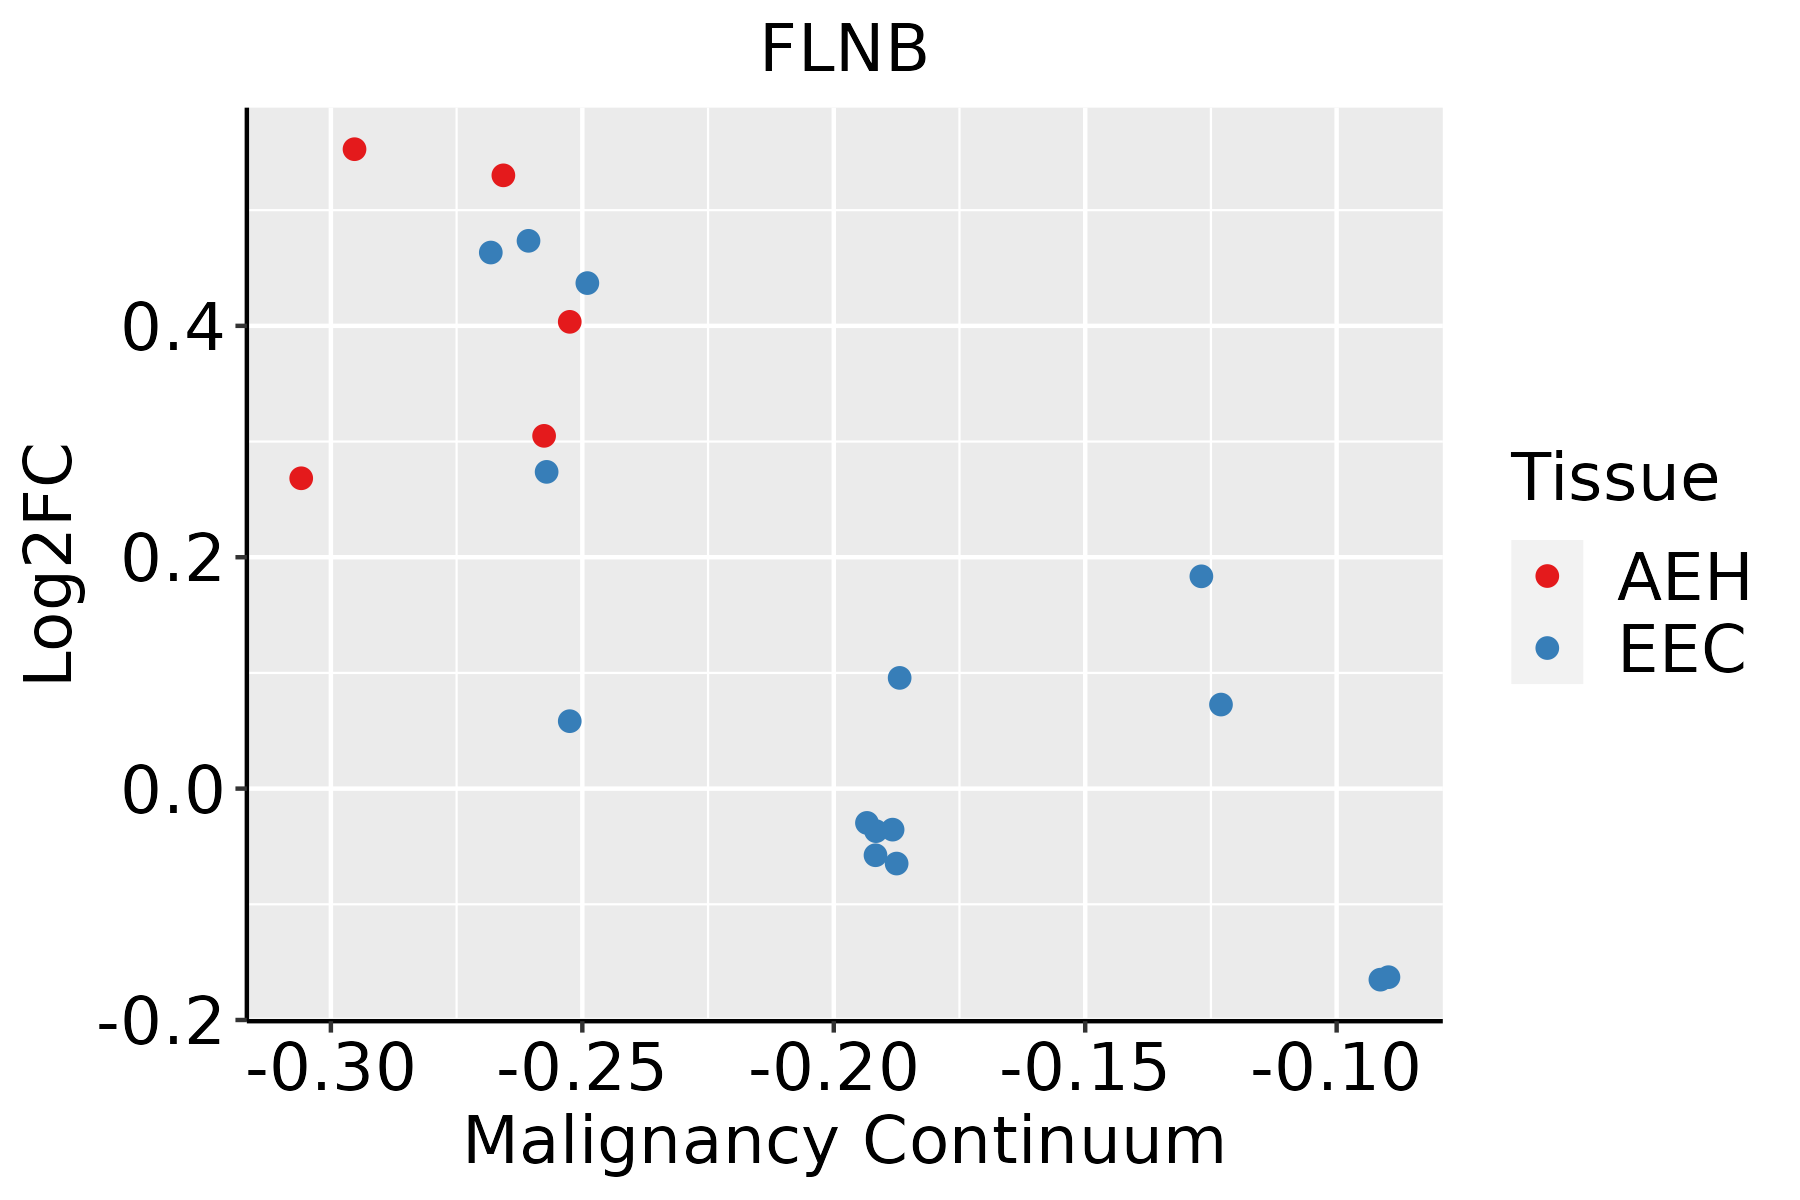 | AEH: Atypical endometrial hyperplasia |
| EEC: Endometrioid Cancer |
| Esophagus | 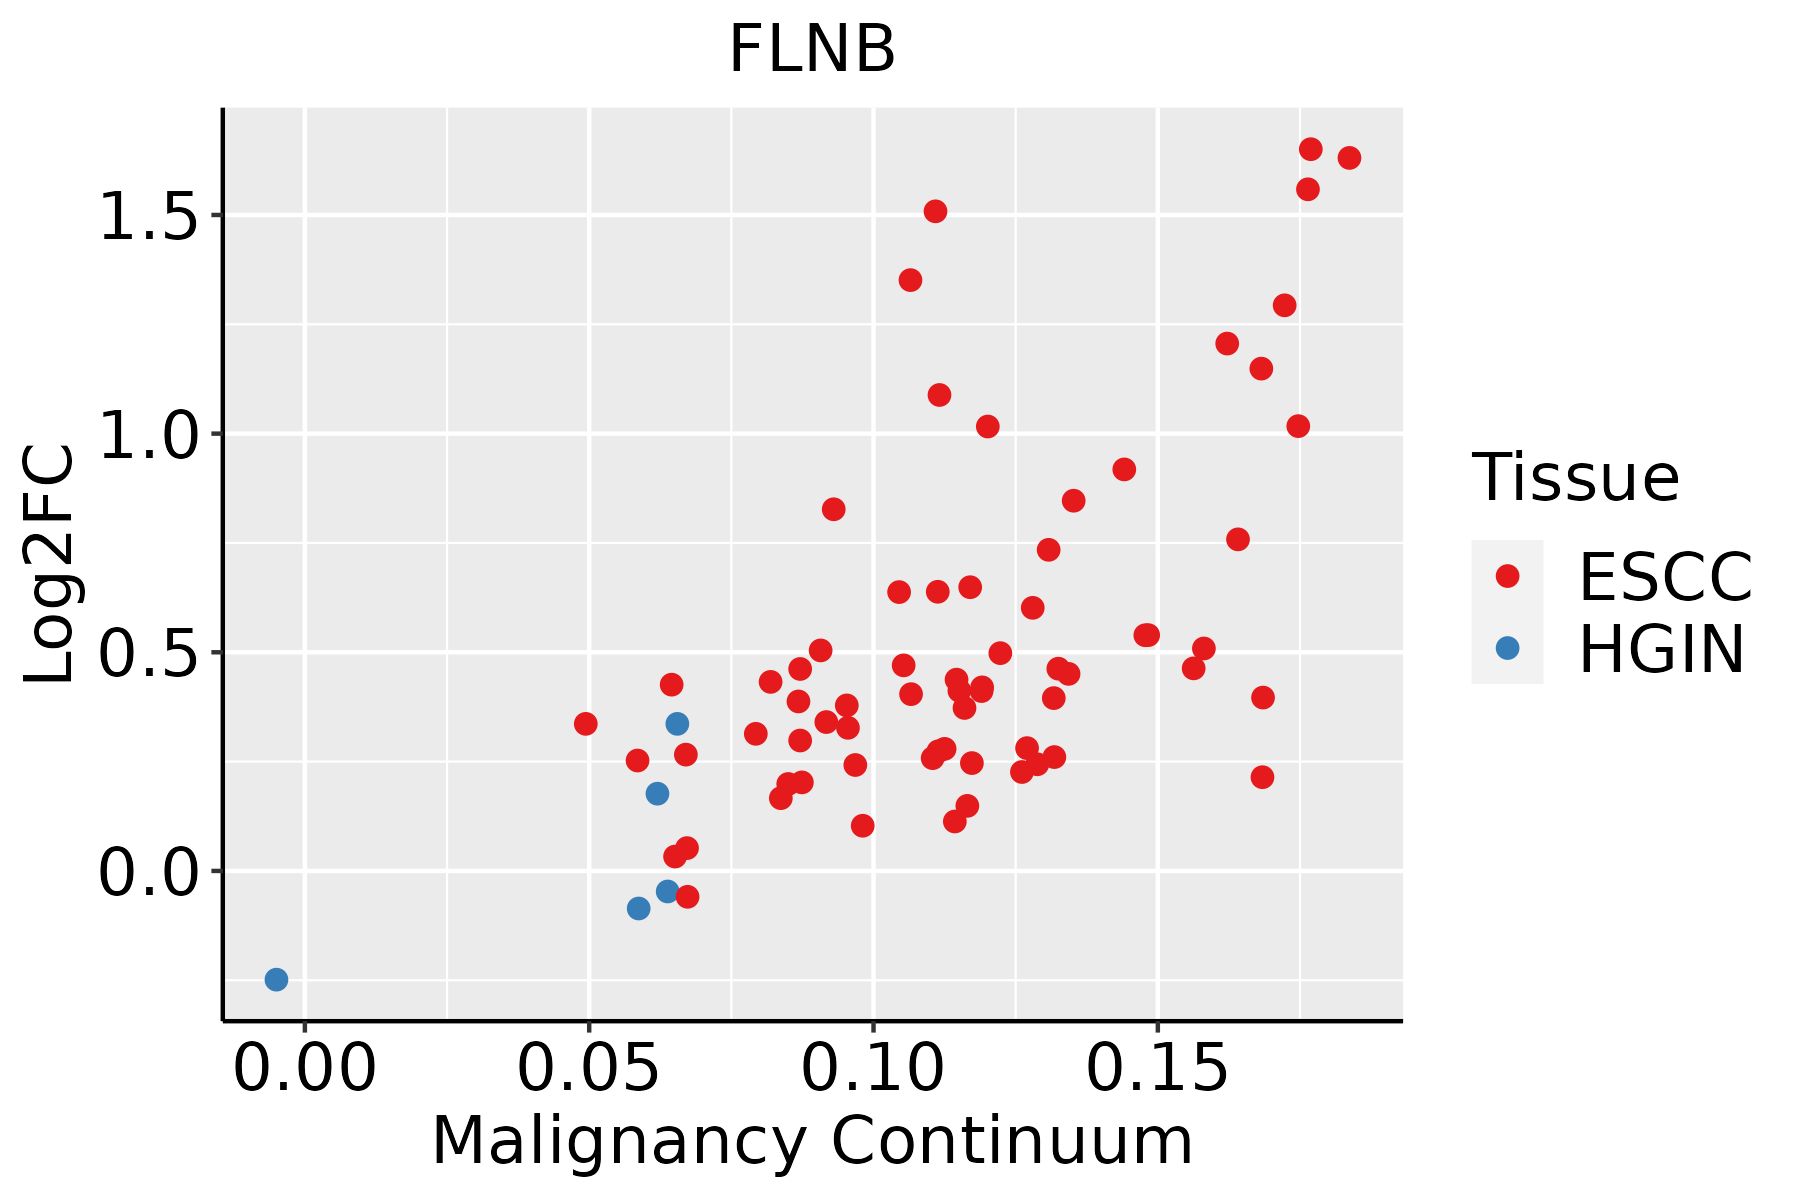 | ESCC: Esophageal squamous cell carcinoma |
| HGIN: High-grade intraepithelial neoplasias |
| LGIN: Low-grade intraepithelial neoplasias |
| GC | 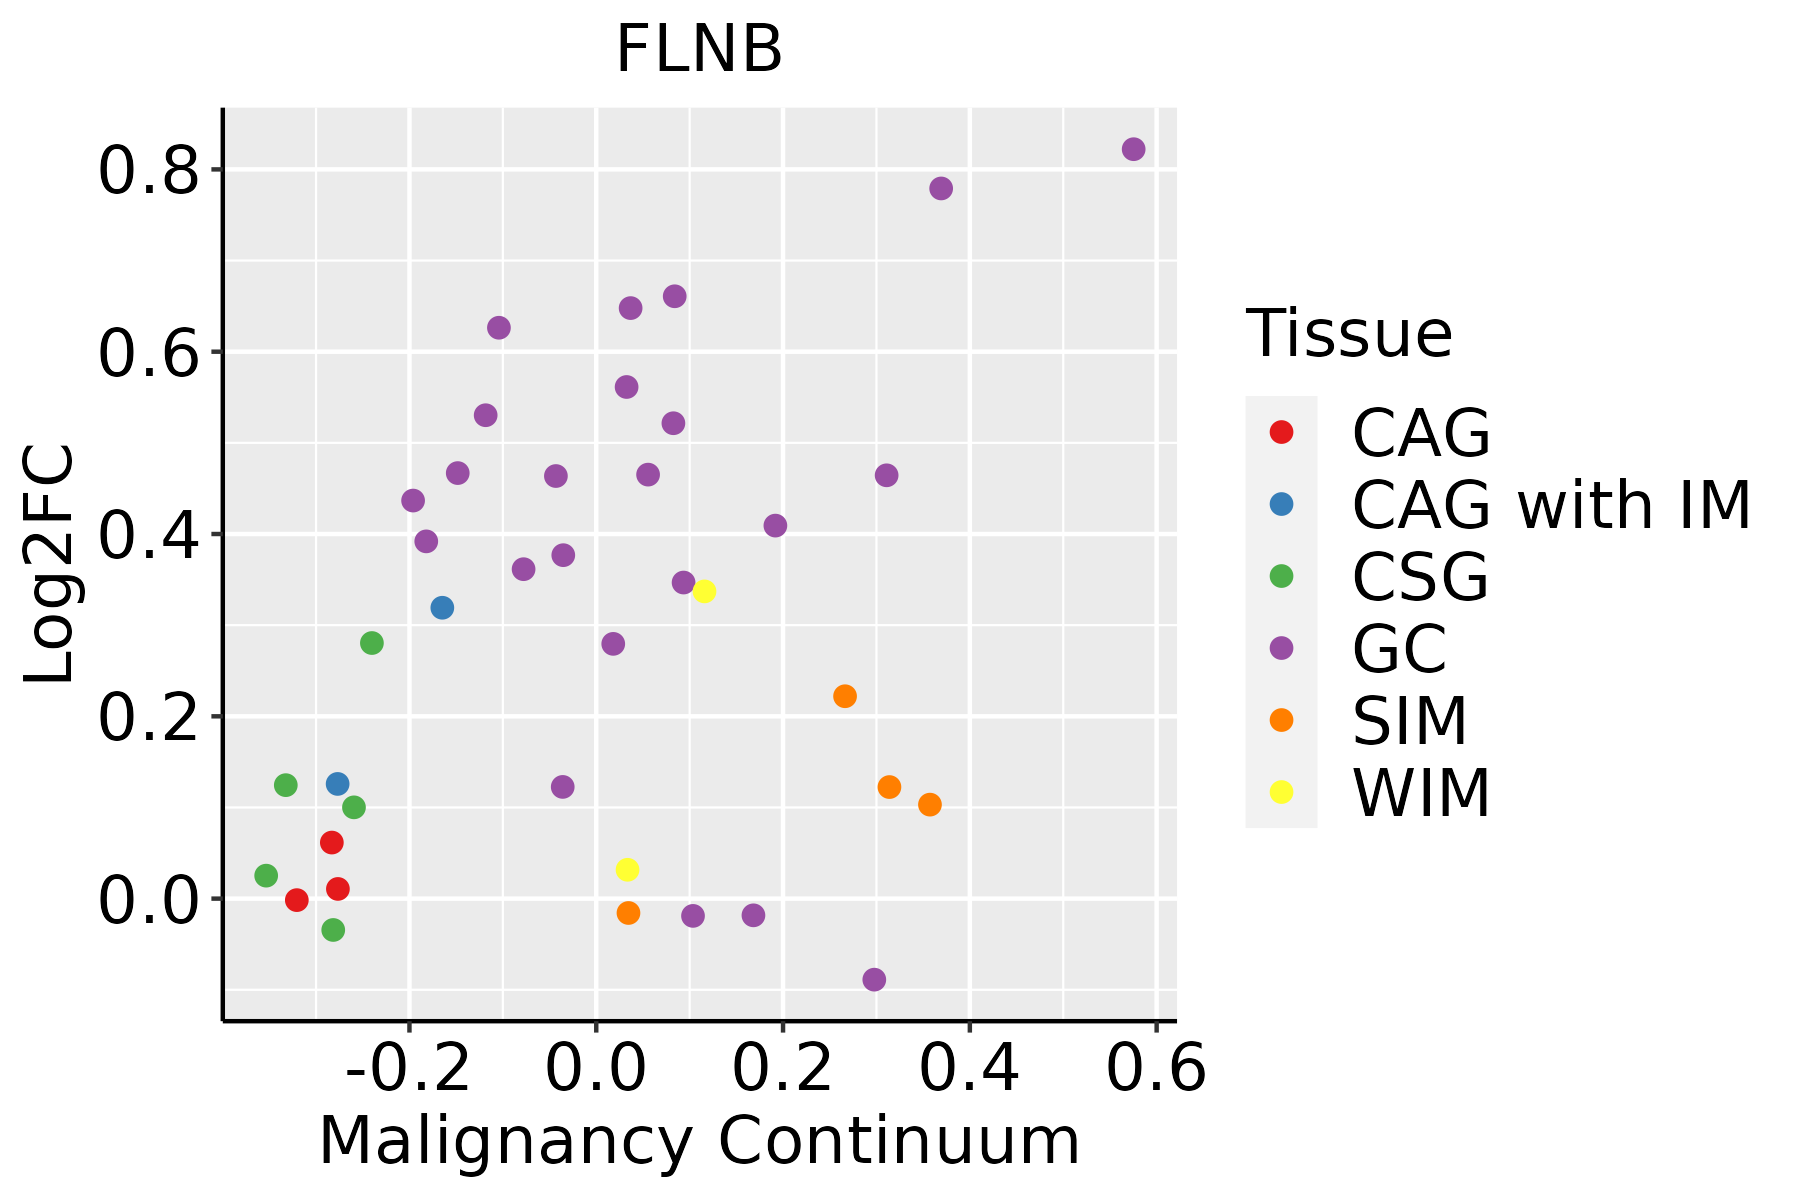 | CAG: Chronic atrophic gastritis |
| CAG with IM: Chronic atrophic gastritis with intestinal metaplasia |
| CSG: Chronic superficial gastritis |
| GC: Gastric cancer |
| SIM: Severe intestinal metaplasia |
| WIM: Wild intestinal metaplasia |
| Liver | 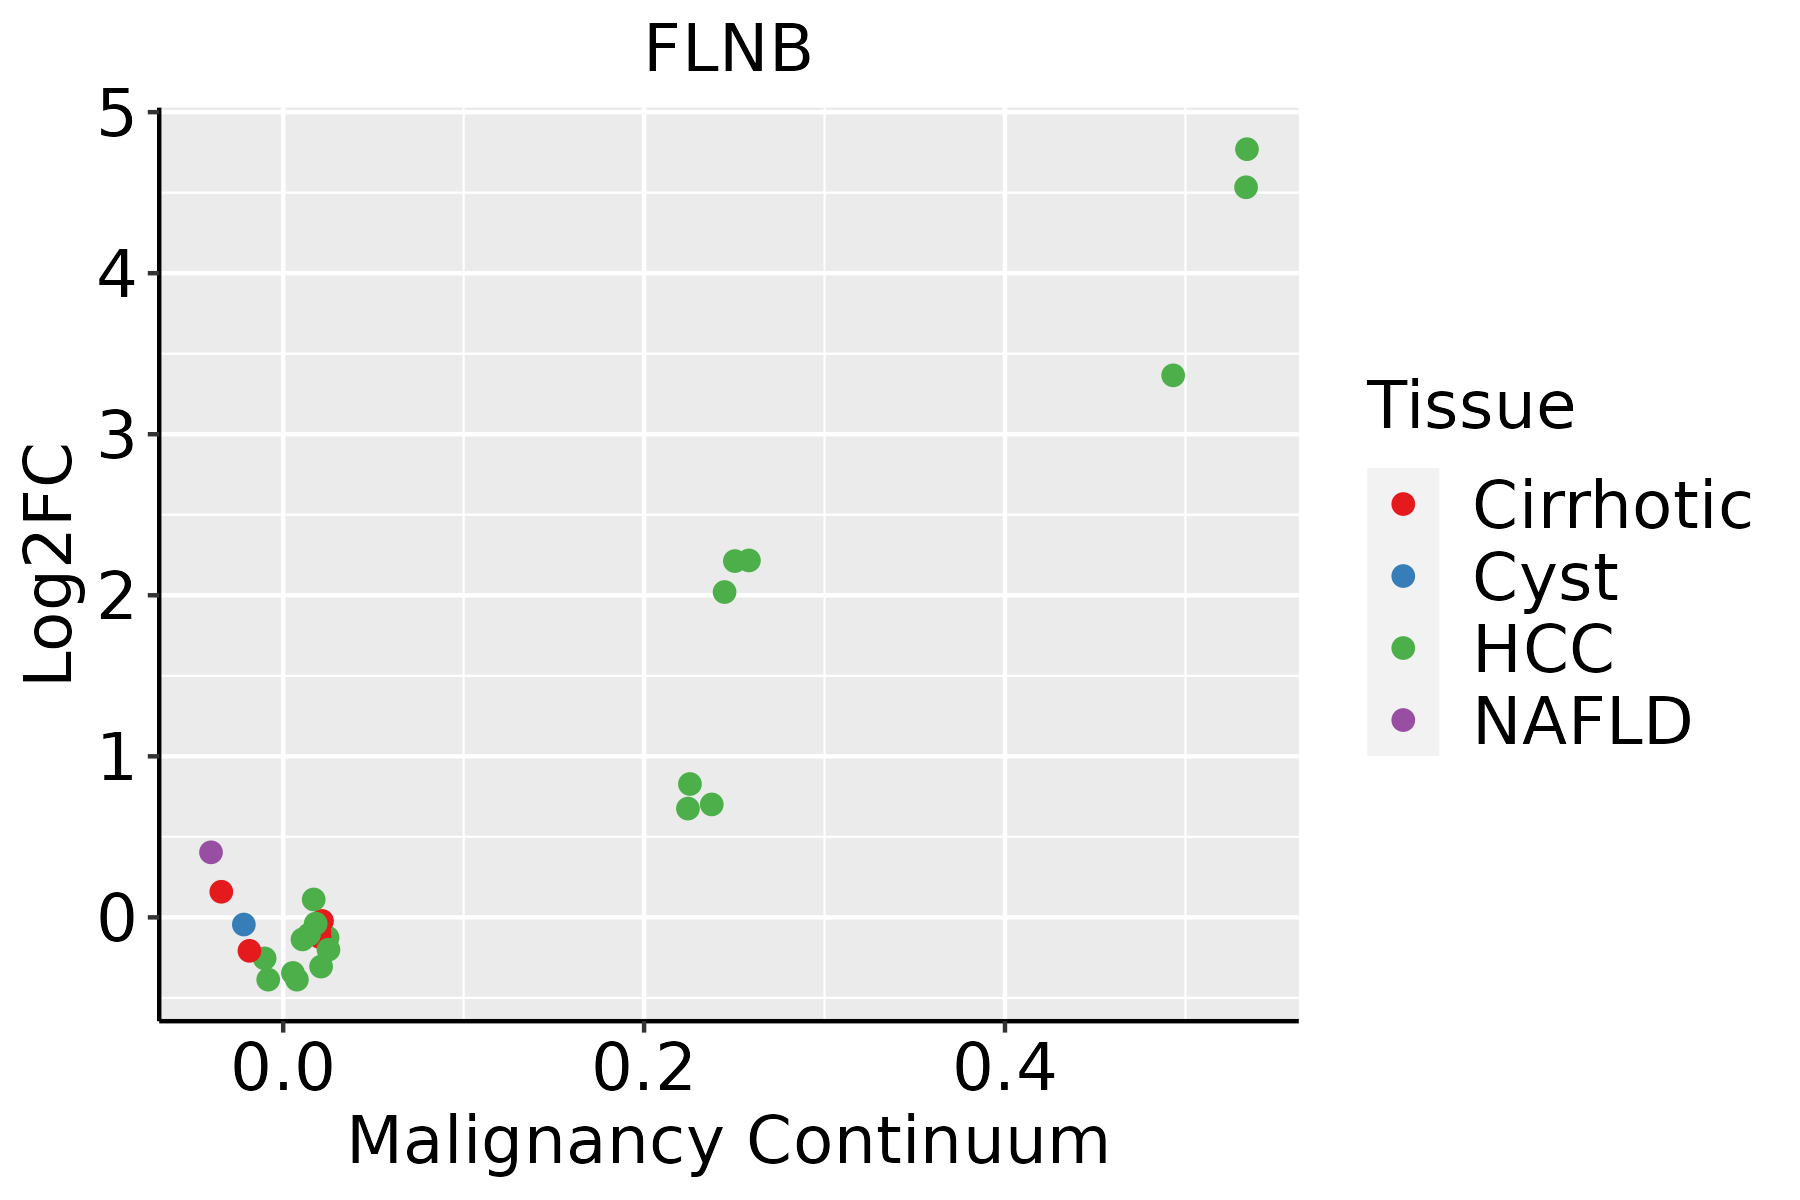 | HCC: Hepatocellular carcinoma |
| NAFLD: Non-alcoholic fatty liver disease |
| Lung | 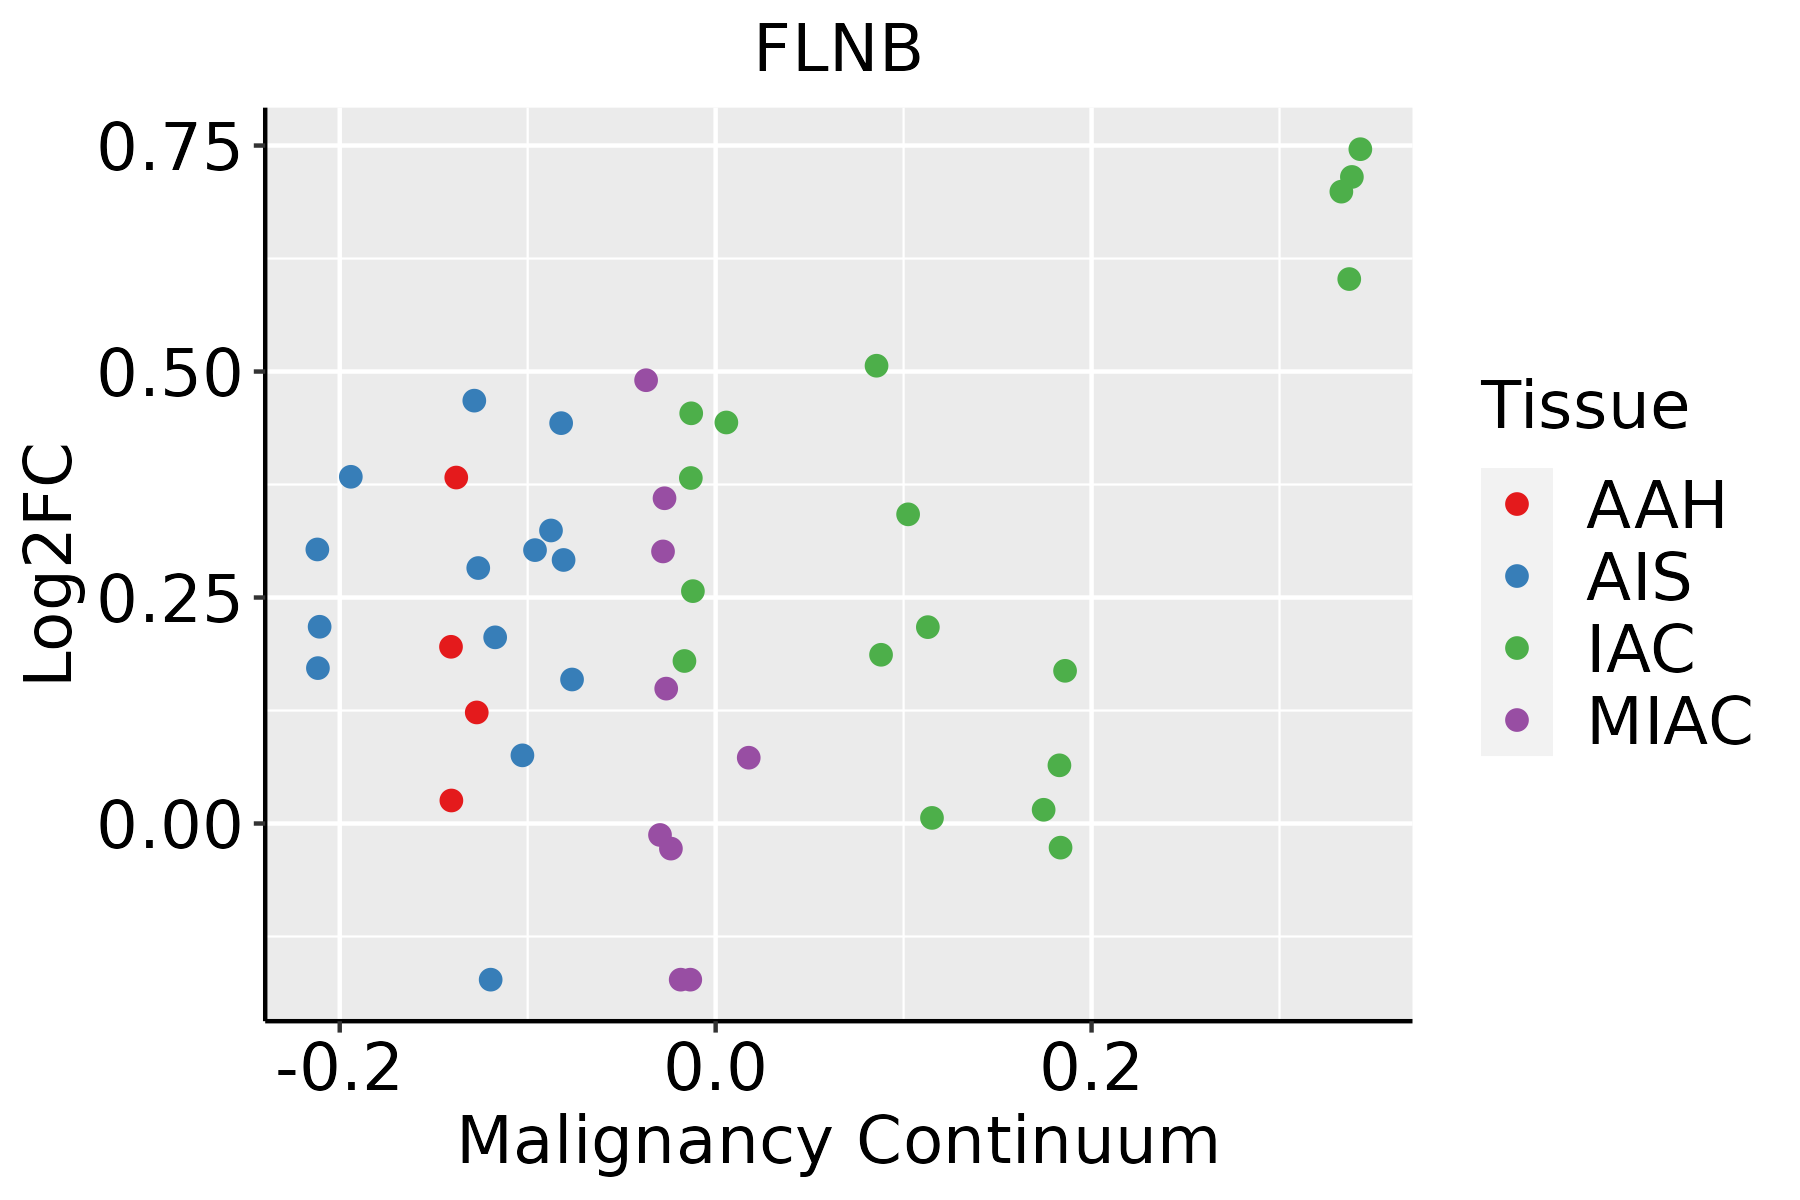 | AAH: Atypical adenomatous hyperplasia |
| AIS: Adenocarcinoma in situ |
| IAC: Invasive lung adenocarcinoma |
| MIA: Minimally invasive adenocarcinoma |
| Oral Cavity | 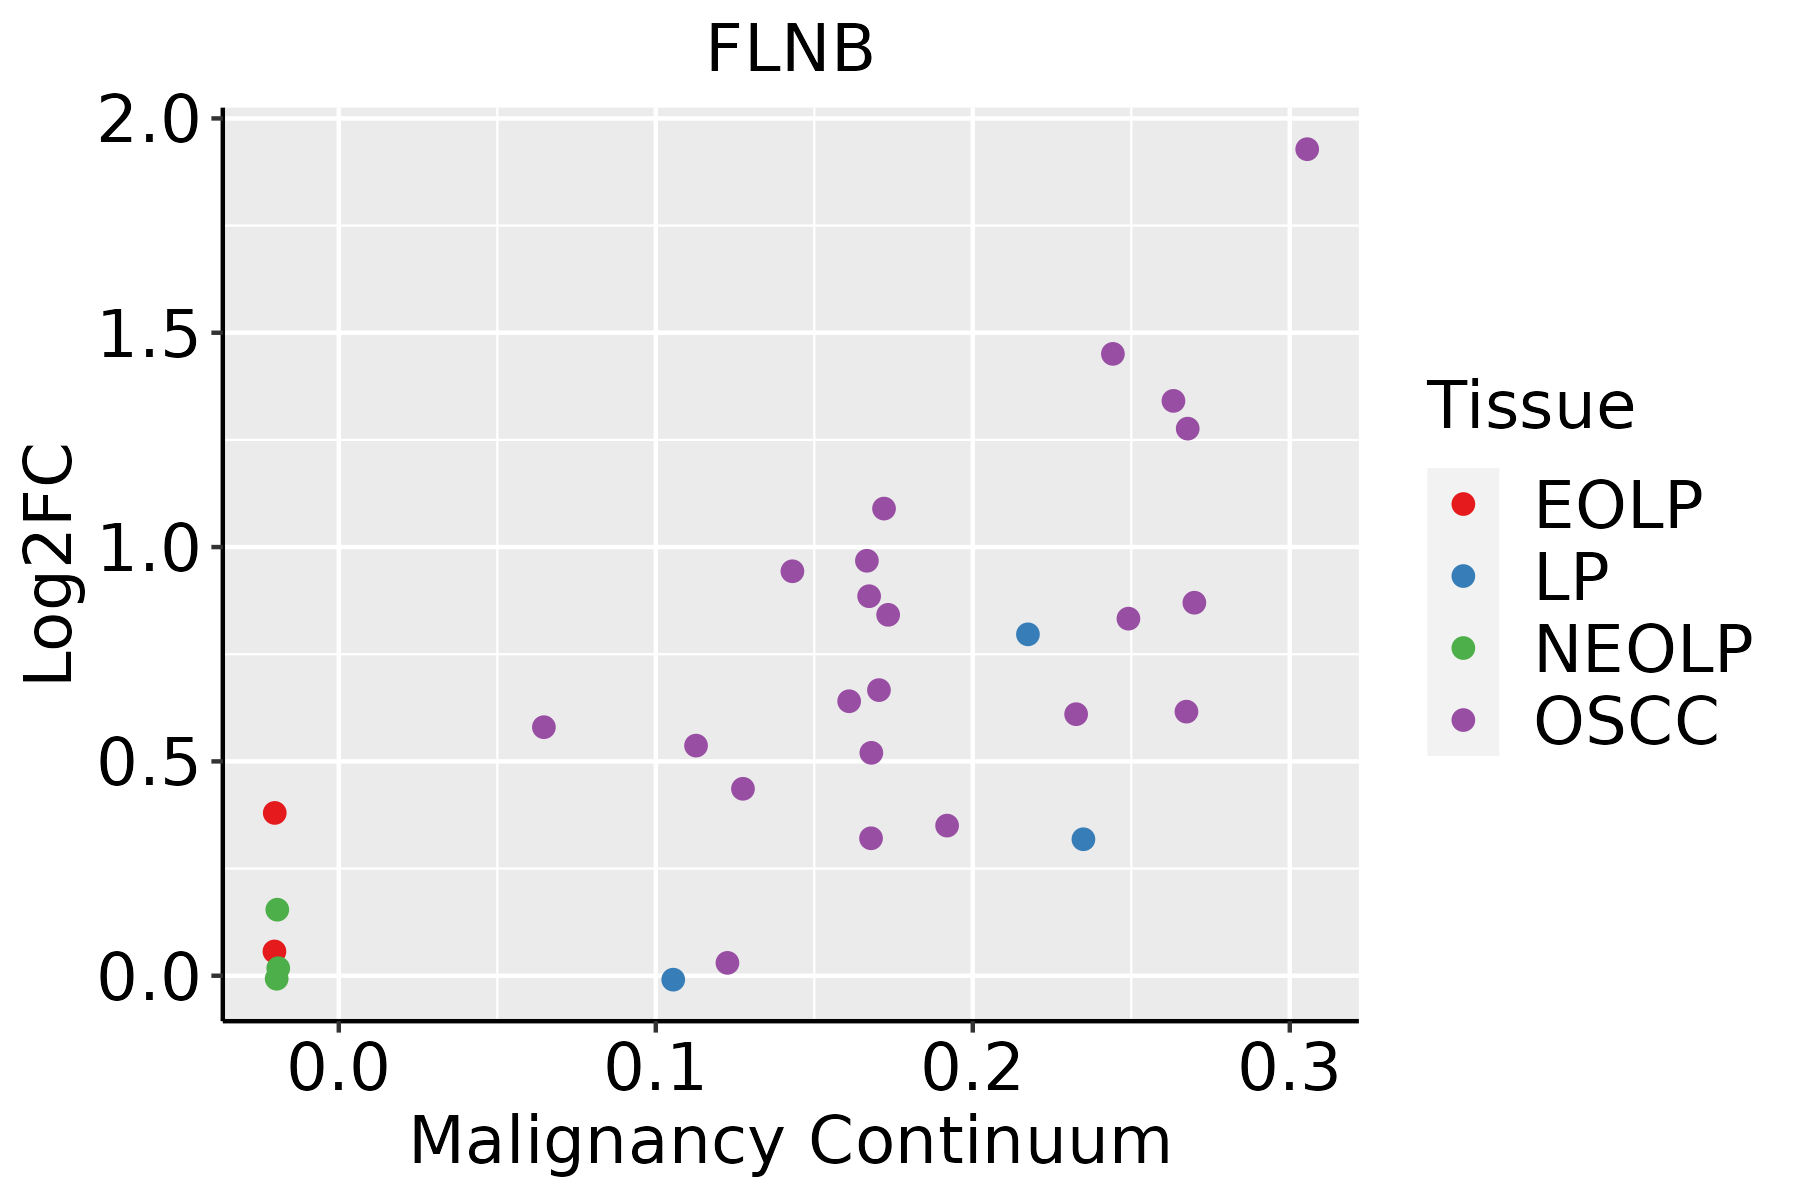 | EOLP: Erosive Oral lichen planus |
| LP: leukoplakia |
| NEOLP: Non-erosive oral lichen planus |
| OSCC: Oral squamous cell carcinoma |
| Prostate |  | BPH: Benign Prostatic Hyperplasia |
| Skin | 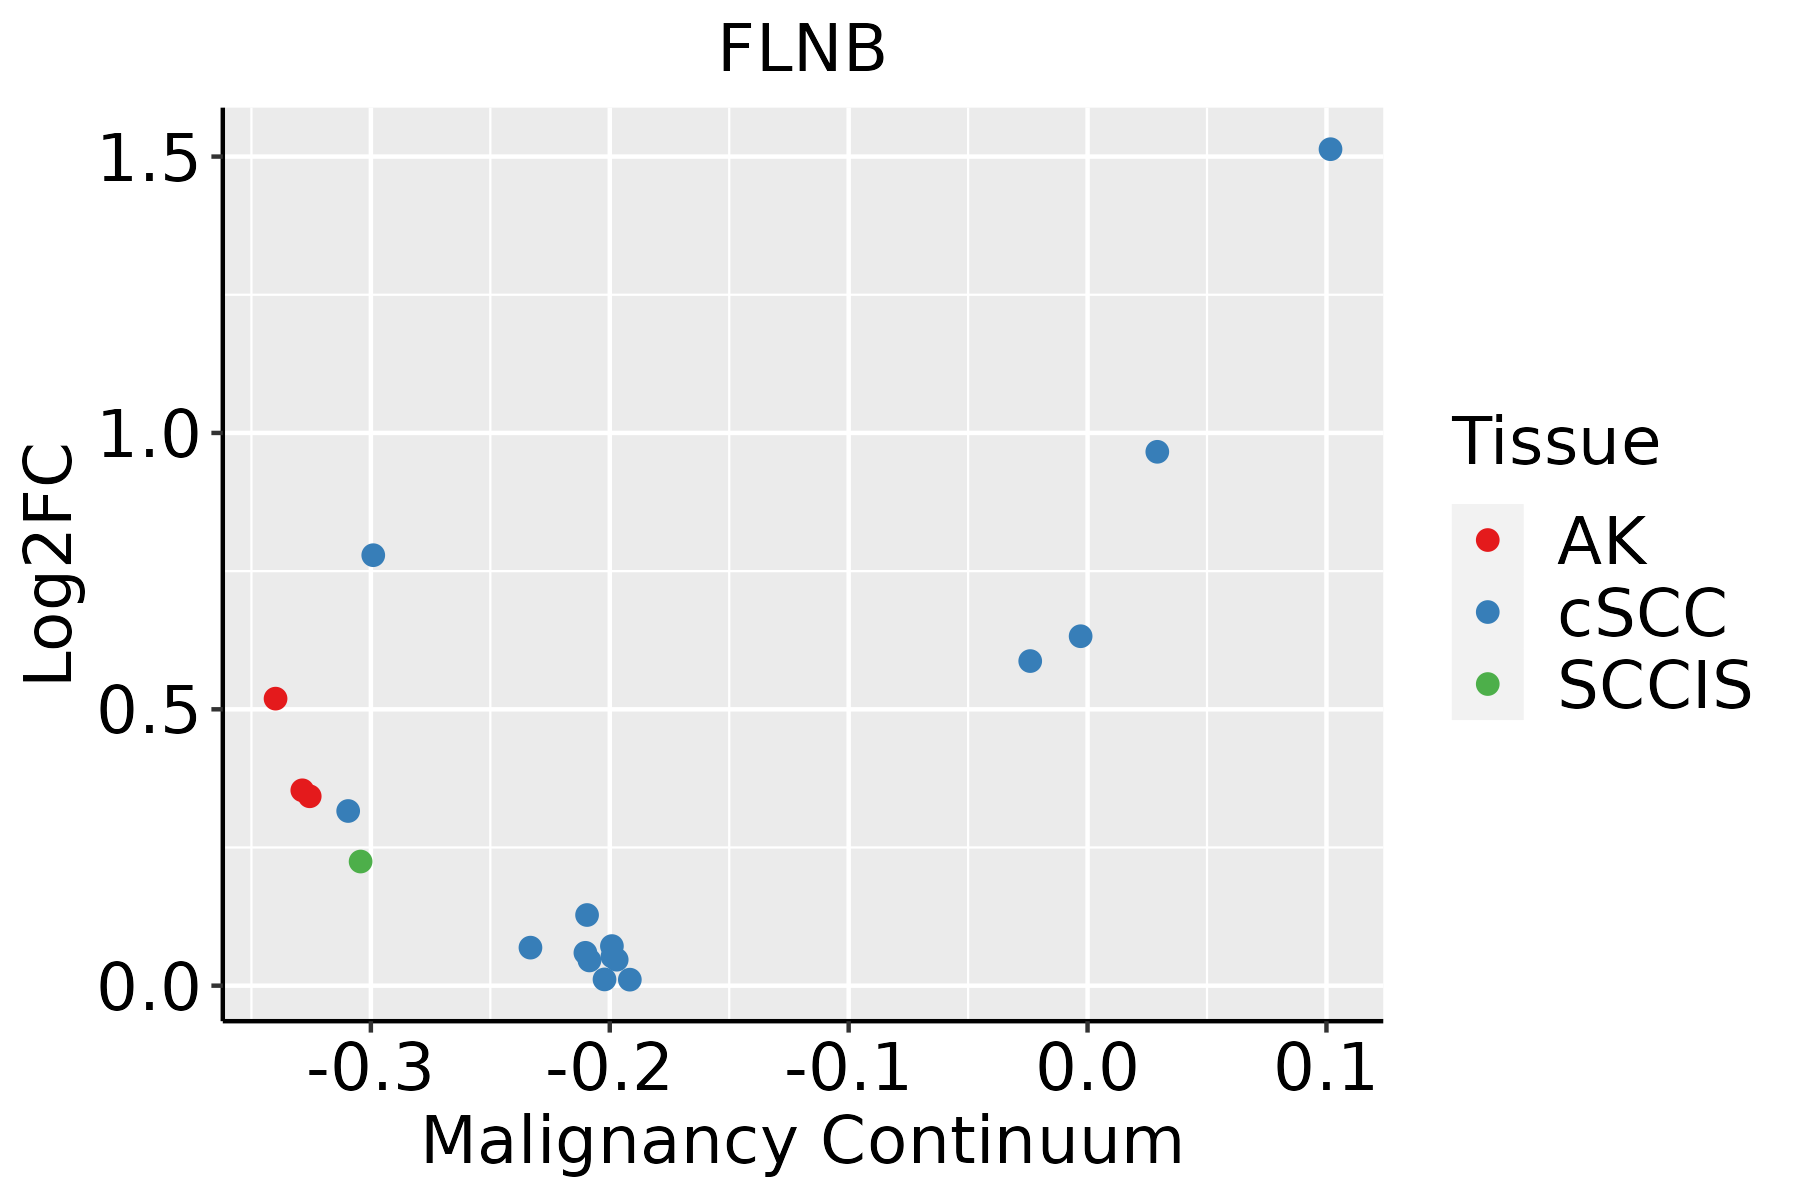 | AK: Actinic keratosis |
| cSCC: Cutaneous squamous cell carcinoma |
| SCCIS:squamous cell carcinoma in situ |
| Thyroid | 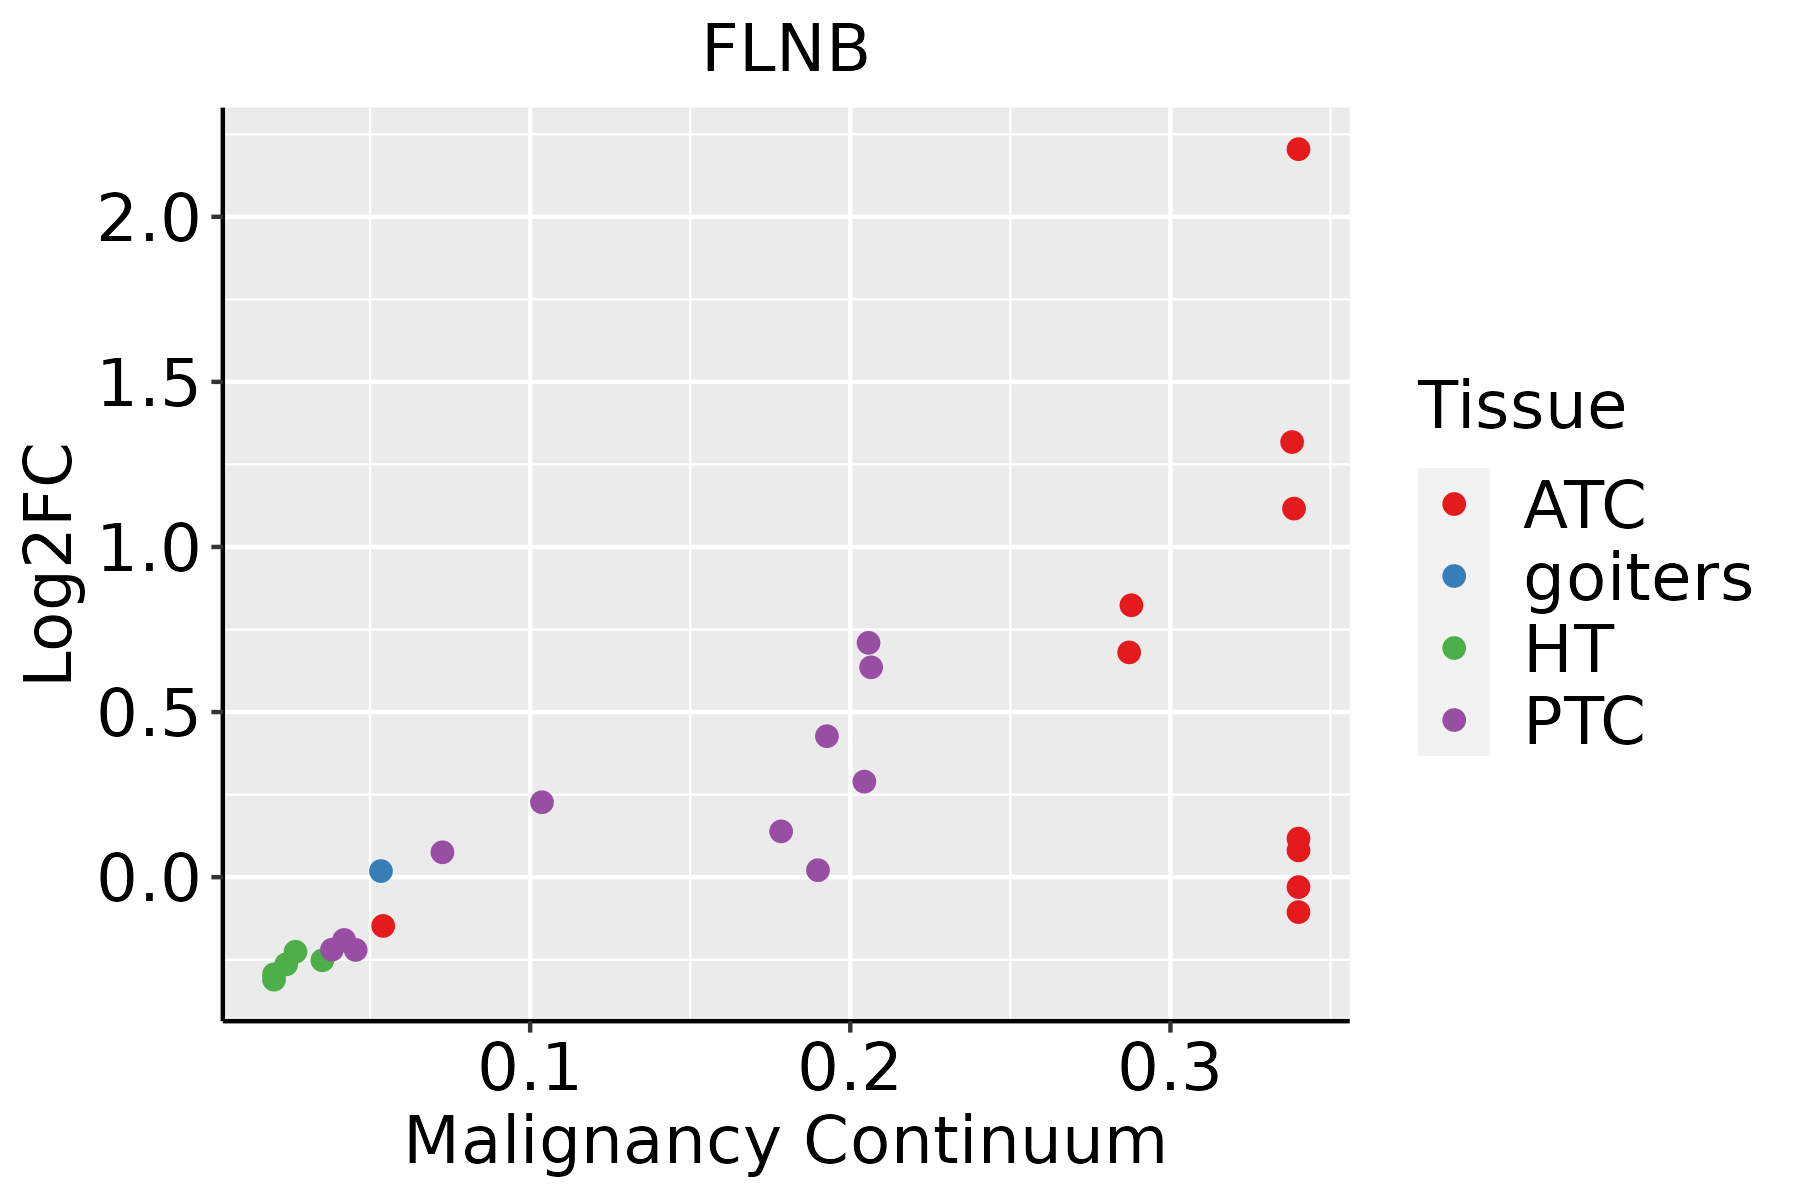 | ATC: Anaplastic thyroid cancer |
| HT: Hashimoto's thyroiditis |
| PTC: Papillary thyroid cancer |
| GO ID | Tissue | Disease Stage | Description | Gene Ratio | Bg Ratio | pvalue | p.adjust | Count |
| GO:00085445 | Breast | Precancer | epidermis development | 35/1080 | 324/18723 | 2.71e-04 | 3.96e-03 | 35 |
| GO:00099136 | Breast | Precancer | epidermal cell differentiation | 23/1080 | 202/18723 | 1.43e-03 | 1.50e-02 | 23 |
| GO:00302163 | Breast | Precancer | keratinocyte differentiation | 17/1080 | 139/18723 | 2.71e-03 | 2.39e-02 | 17 |
| GO:00605374 | Breast | Precancer | muscle tissue development | 37/1080 | 403/18723 | 3.60e-03 | 2.98e-02 | 37 |
| GO:00020649 | Breast | Precancer | epithelial cell development | 23/1080 | 220/18723 | 4.28e-03 | 3.35e-02 | 23 |
| GO:00147063 | Breast | Precancer | striated muscle tissue development | 35/1080 | 384/18723 | 5.10e-03 | 3.83e-02 | 35 |
| GO:006053711 | Breast | IDC | muscle tissue development | 50/1434 | 403/18723 | 4.91e-04 | 6.45e-03 | 50 |
| GO:000854412 | Breast | IDC | epidermis development | 41/1434 | 324/18723 | 1.03e-03 | 1.14e-02 | 41 |
| GO:000991312 | Breast | IDC | epidermal cell differentiation | 28/1434 | 202/18723 | 1.62e-03 | 1.60e-02 | 28 |
| GO:00147061 | Breast | IDC | striated muscle tissue development | 46/1434 | 384/18723 | 1.67e-03 | 1.63e-02 | 46 |
| GO:00302161 | Breast | IDC | keratinocyte differentiation | 21/1434 | 139/18723 | 2.06e-03 | 1.95e-02 | 21 |
| GO:00343414 | Breast | IDC | response to interferon-gamma | 21/1434 | 141/18723 | 2.46e-03 | 2.22e-02 | 21 |
| GO:00435883 | Breast | IDC | skin development | 33/1434 | 263/18723 | 3.46e-03 | 2.87e-02 | 33 |
| GO:000206414 | Breast | IDC | epithelial cell development | 28/1434 | 220/18723 | 5.53e-03 | 4.05e-02 | 28 |
| GO:00075172 | Breast | IDC | muscle organ development | 38/1434 | 327/18723 | 6.63e-03 | 4.62e-02 | 38 |
| GO:006053721 | Breast | DCIS | muscle tissue development | 50/1390 | 403/18723 | 2.39e-04 | 3.74e-03 | 50 |
| GO:00147062 | Breast | DCIS | striated muscle tissue development | 46/1390 | 384/18723 | 8.88e-04 | 1.01e-02 | 46 |
| GO:000854422 | Breast | DCIS | epidermis development | 40/1390 | 324/18723 | 1.05e-03 | 1.16e-02 | 40 |
| GO:000991322 | Breast | DCIS | epidermal cell differentiation | 27/1390 | 202/18723 | 2.11e-03 | 1.97e-02 | 27 |
| GO:00302162 | Breast | DCIS | keratinocyte differentiation | 20/1390 | 139/18723 | 3.24e-03 | 2.74e-02 | 20 |
| Hugo Symbol | Variant Class | Variant Classification | dbSNP RS | HGVSc | HGVSp | HGVSp Short | SWISSPROT | BIOTYPE | SIFT | PolyPhen | Tumor Sample Barcode | Tissue | Histology | Sex | Age | Stage | Therapy Types | Drugs | Outcome |
| FLNB | SNV | Missense_Mutation | novel | c.1132G>A | p.Asp378Asn | p.D378N | O75369 | protein_coding | deleterious(0.03) | probably_damaging(0.924) | TCGA-5L-AAT1-01 | Breast | breast invasive carcinoma | Female | <65 | III/IV | Hormone Therapy | letrozol | SD |
| FLNB | SNV | Missense_Mutation | novel | c.1797N>T | p.Gln599His | p.Q599H | O75369 | protein_coding | deleterious(0.01) | possibly_damaging(0.726) | TCGA-A2-A25A-01 | Breast | breast invasive carcinoma | Female | <65 | I/II | Unspecific | Cytoxan | SD |
| FLNB | SNV | Missense_Mutation | | c.1202N>A | p.Thr401Asn | p.T401N | O75369 | protein_coding | deleterious(0.02) | benign(0.03) | TCGA-A7-A26J-01 | Breast | breast invasive carcinoma | Female | <65 | I/II | Hormone Therapy | tamoxiphen | SD |
| FLNB | SNV | Missense_Mutation | rs144158201 | c.2035N>T | p.Pro679Ser | p.P679S | O75369 | protein_coding | tolerated(0.15) | benign(0.314) | TCGA-A8-A08F-01 | Breast | breast invasive carcinoma | Female | <65 | III/IV | Chemotherapy | 5-fluorouracil | CR |
| FLNB | SNV | Missense_Mutation | rs768998920 | c.163N>C | p.Glu55Gln | p.E55Q | O75369 | protein_coding | deleterious(0) | probably_damaging(0.98) | TCGA-AC-A23H-01 | Breast | breast invasive carcinoma | Female | >=65 | I/II | Unknown | Unknown | PD |
| FLNB | SNV | Missense_Mutation | | c.2166G>C | p.Trp722Cys | p.W722C | O75369 | protein_coding | tolerated(0.1) | probably_damaging(0.997) | TCGA-AR-A0TS-01 | Breast | breast invasive carcinoma | Female | <65 | I/II | Chemotherapy | doxorubicin | SD |
| FLNB | SNV | Missense_Mutation | rs80356520 | c.4912C>G | p.Arg1638Gly | p.R1638G | O75369 | protein_coding | deleterious(0.02) | possibly_damaging(0.726) | TCGA-AR-A1AP-01 | Breast | breast invasive carcinoma | Female | >=65 | I/II | Hormone Therapy | anastrozole | SD |
| FLNB | SNV | Missense_Mutation | novel | c.6208N>T | p.Val2070Leu | p.V2070L | O75369 | protein_coding | deleterious(0.01) | possibly_damaging(0.626) | TCGA-AR-A24M-01 | Breast | breast invasive carcinoma | Female | <65 | III/IV | Hormone Therapy | tamoxiphen | SD |
| FLNB | SNV | Missense_Mutation | novel | c.3056N>T | p.Thr1019Ile | p.T1019I | O75369 | protein_coding | deleterious(0.02) | possibly_damaging(0.673) | TCGA-BH-A0HF-01 | Breast | breast invasive carcinoma | Female | >=65 | I/II | Hormone Therapy | arimidex | SD |
| FLNB | SNV | Missense_Mutation | rs142229998 | c.7462N>A | p.Gly2488Ser | p.G2488S | O75369 | protein_coding | deleterious(0.02) | probably_damaging(0.926) | TCGA-BH-A208-01 | Breast | breast invasive carcinoma | Female | <65 | I/II | Unknown | Unknown | SD |


