
|
|||||
|
 | |
| |
| |
| |
| |
| |
|
Gene: EXOC4 |
Gene summary for EXOC4 |
| Gene information | Species | Human | Gene symbol | EXOC4 | Gene ID | 60412 |
| Gene name | exocyst complex component 4 | |
| Gene Alias | SEC8 | |
| Cytomap | 7q33 | |
| Gene Type | protein-coding | GO ID | GO:0001704 | UniProtAcc | Q6NX51 |
Top |
Malignant transformation analysis |
| Identification of the aberrant gene expression in precancerous and cancerous lesions by comparing the gene expression of stem-like cells in diseased tissues with normal stem cells |
| Entrez ID | Symbol | Replicates | Species | Organ | Tissue | Adj P-value | Log2FC | Malignancy |
| 60412 | EXOC4 | 052099_1652-all-cells | Human | Prostate | BPH | 1.05e-39 | 8.01e-01 | 0.1038 |
| 60412 | EXOC4 | Dong_P1 | Human | Prostate | Tumor | 5.33e-04 | 4.47e-02 | 0.035 |
| 60412 | EXOC4 | Dong_P3 | Human | Prostate | Tumor | 9.97e-09 | 1.16e-01 | 0.0278 |
| 60412 | EXOC4 | Dong_P5 | Human | Prostate | Tumor | 2.22e-26 | 1.50e-01 | 0.053 |
| 60412 | EXOC4 | GSM5353221_PA_PB2A_Pool_1_3_S25_L001 | Human | Prostate | Tumor | 1.34e-03 | 3.47e-01 | 0.1633 |
| 60412 | EXOC4 | GSM5353222_PA_PB2B_Pool_1_3_S52_L002 | Human | Prostate | Tumor | 5.85e-04 | 3.87e-01 | 0.1608 |
| 60412 | EXOC4 | GSM5353223_PA_PB2B_Pool_2_S26_L001 | Human | Prostate | Tumor | 1.33e-05 | 4.53e-01 | 0.1604 |
| 60412 | EXOC4 | GSM5353243_PA_PR5261_T1_S23_L002 | Human | Prostate | Tumor | 2.79e-03 | 3.66e-01 | 0.1545 |
| 60412 | EXOC4 | P1_S1_AK | Human | Skin | AK | 2.64e-29 | 6.34e-01 | -0.3399 |
| 60412 | EXOC4 | P2_S3_AK | Human | Skin | AK | 1.13e-23 | 5.57e-01 | -0.3287 |
| 60412 | EXOC4 | P2_S4_SCCIS | Human | Skin | SCCIS | 7.71e-13 | 4.16e-01 | -0.3043 |
| 60412 | EXOC4 | P3_S6_AK | Human | Skin | AK | 1.18e-17 | 6.44e-01 | -0.3256 |
| 60412 | EXOC4 | P4_S8_cSCC | Human | Skin | cSCC | 8.38e-24 | 5.66e-01 | -0.3095 |
| 60412 | EXOC4 | P5_S10_cSCC | Human | Skin | cSCC | 1.67e-26 | 4.70e-01 | -0.299 |
| 60412 | EXOC4 | P1_cSCC | Human | Skin | cSCC | 7.38e-17 | 4.68e-01 | 0.0292 |
| 60412 | EXOC4 | P2_cSCC | Human | Skin | cSCC | 1.32e-05 | 2.08e-01 | -0.024 |
| 60412 | EXOC4 | P4_cSCC | Human | Skin | cSCC | 3.60e-07 | 2.04e-01 | -0.00290000000000005 |
| 60412 | EXOC4 | P10_cSCC | Human | Skin | cSCC | 2.63e-19 | 4.58e-01 | 0.1017 |
| 60412 | EXOC4 | Pat01-B | Human | Stomach | GC | 3.78e-11 | 2.87e-01 | 0.5754 |
| 60412 | EXOC4 | Pat02-B | Human | Stomach | GC | 4.78e-28 | 4.03e-01 | 0.0368 |
| Page: 1 2 3 4 5 6 7 8 9 10 11 12 13 |
| Tissue | Expression Dynamics | Abbreviation |
| Cervix | 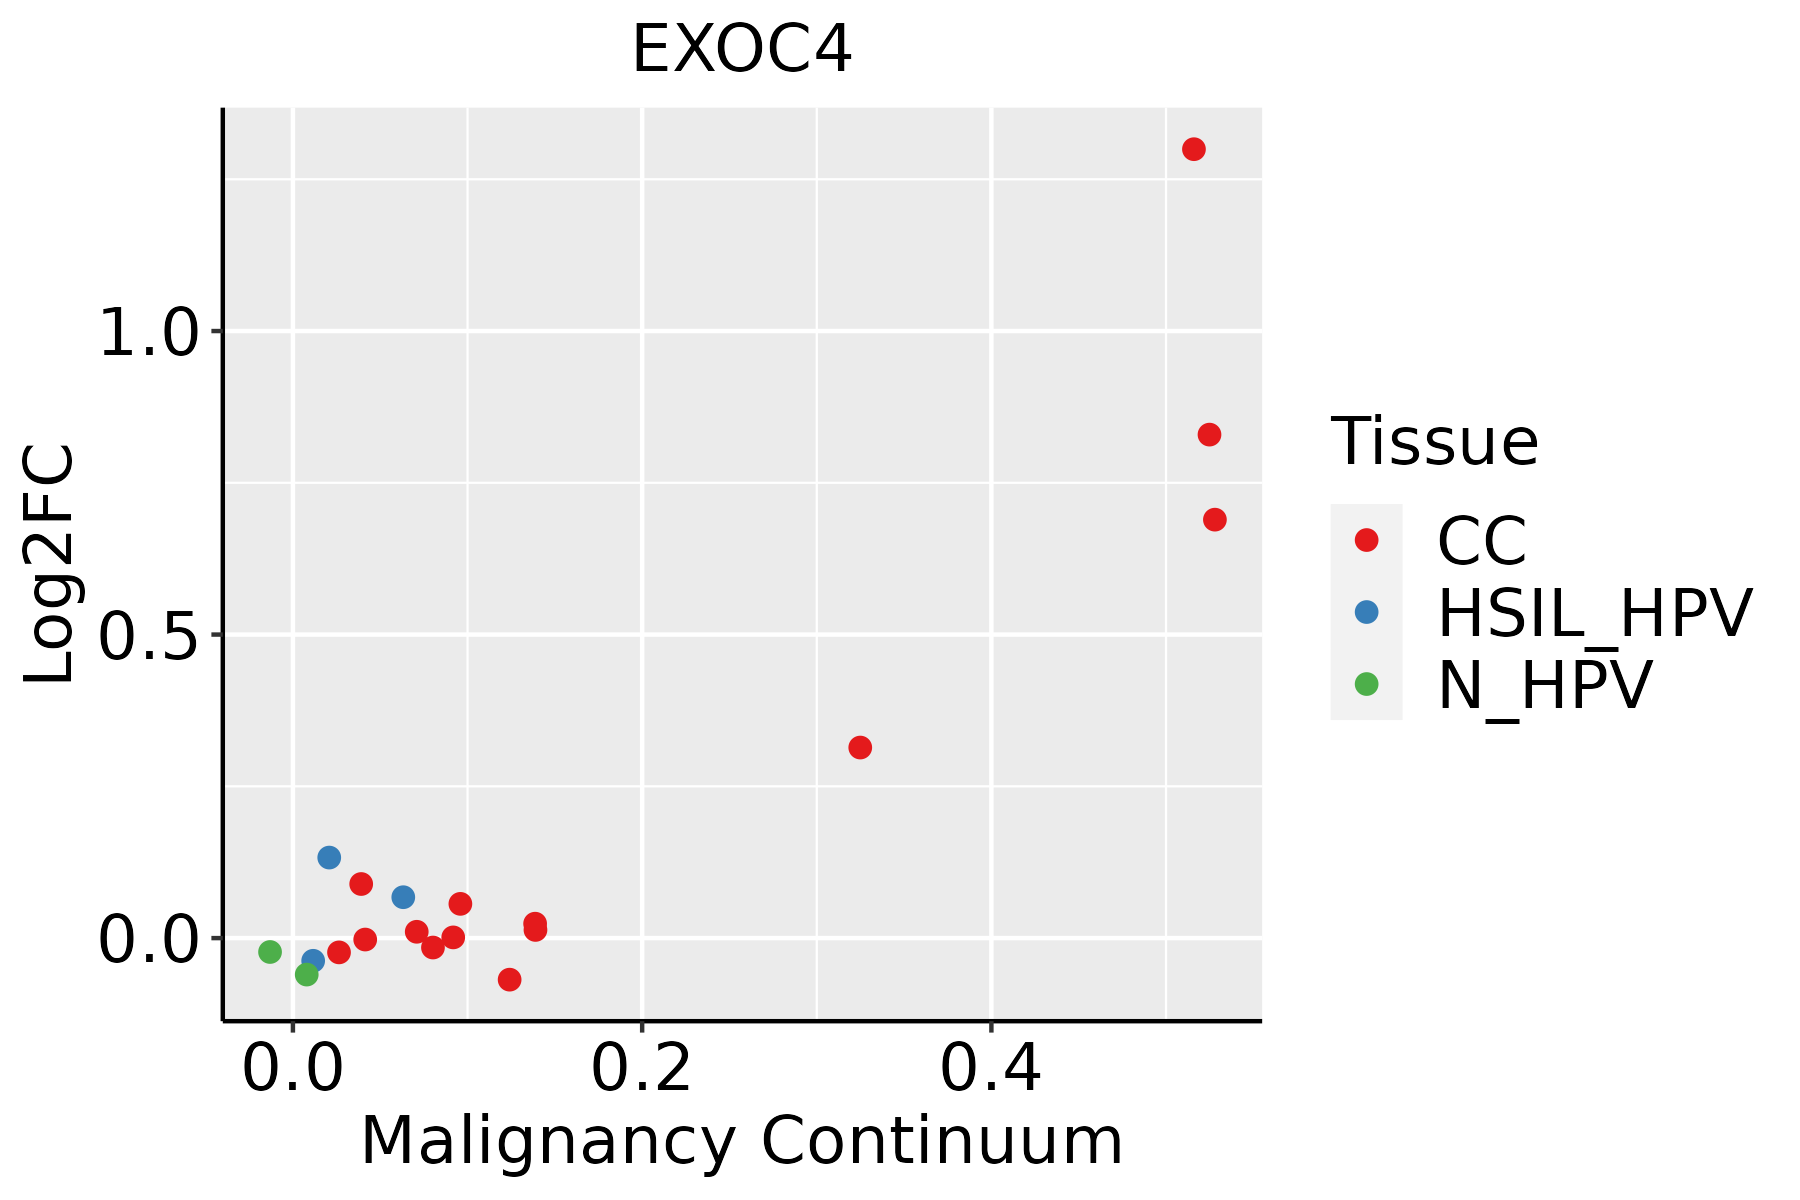 | CC: Cervix cancer |
| HSIL_HPV: HPV-infected high-grade squamous intraepithelial lesions | ||
| N_HPV: HPV-infected normal cervix | ||
| Colorectum (GSE201348) |  | FAP: Familial adenomatous polyposis |
| CRC: Colorectal cancer | ||
| Colorectum (HTA11) |  | AD: Adenomas |
| SER: Sessile serrated lesions | ||
| MSI-H: Microsatellite-high colorectal cancer | ||
| MSS: Microsatellite stable colorectal cancer | ||
| Endometrium |  | AEH: Atypical endometrial hyperplasia |
| EEC: Endometrioid Cancer | ||
| Esophagus | 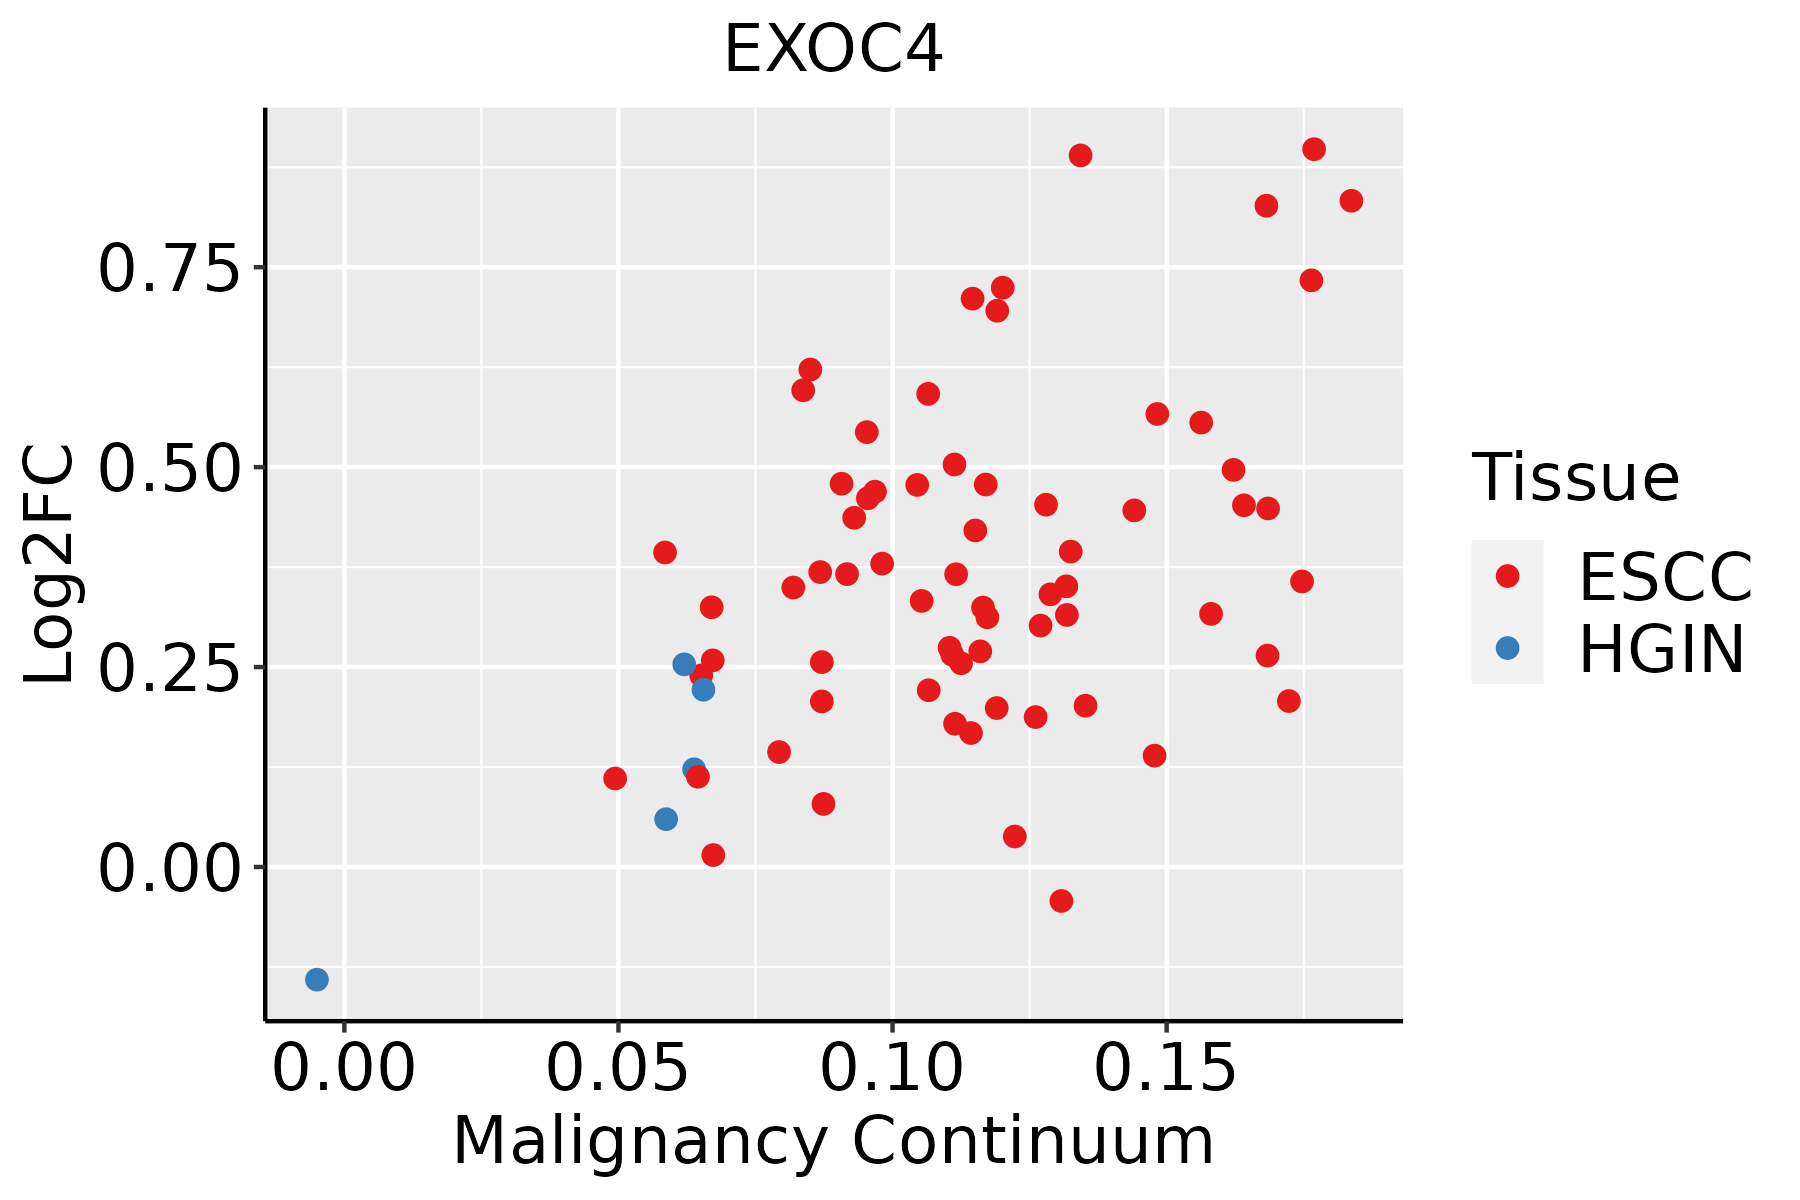 | ESCC: Esophageal squamous cell carcinoma |
| HGIN: High-grade intraepithelial neoplasias | ||
| LGIN: Low-grade intraepithelial neoplasias | ||
| GC | 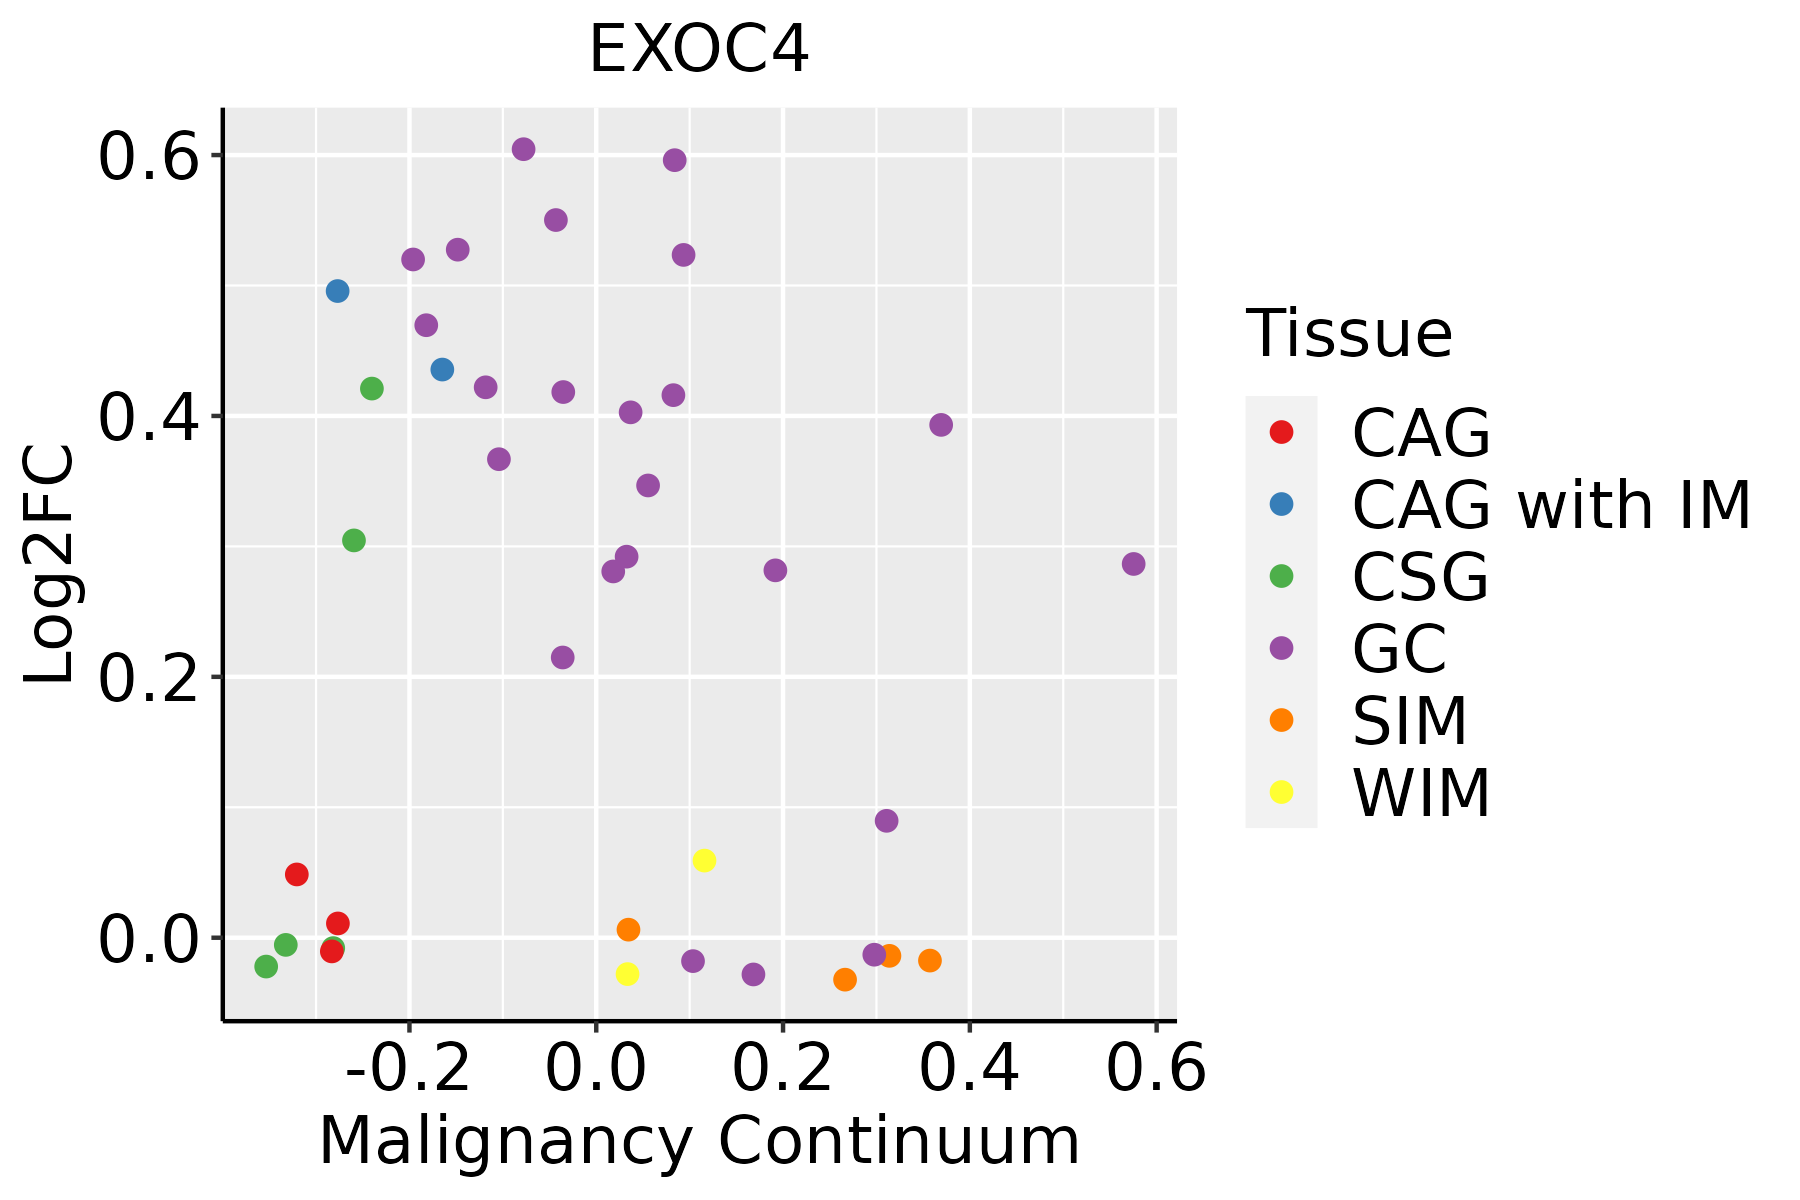 | CAG: Chronic atrophic gastritis |
| CAG with IM: Chronic atrophic gastritis with intestinal metaplasia | ||
| CSG: Chronic superficial gastritis | ||
| GC: Gastric cancer | ||
| SIM: Severe intestinal metaplasia | ||
| WIM: Wild intestinal metaplasia | ||
| Liver | 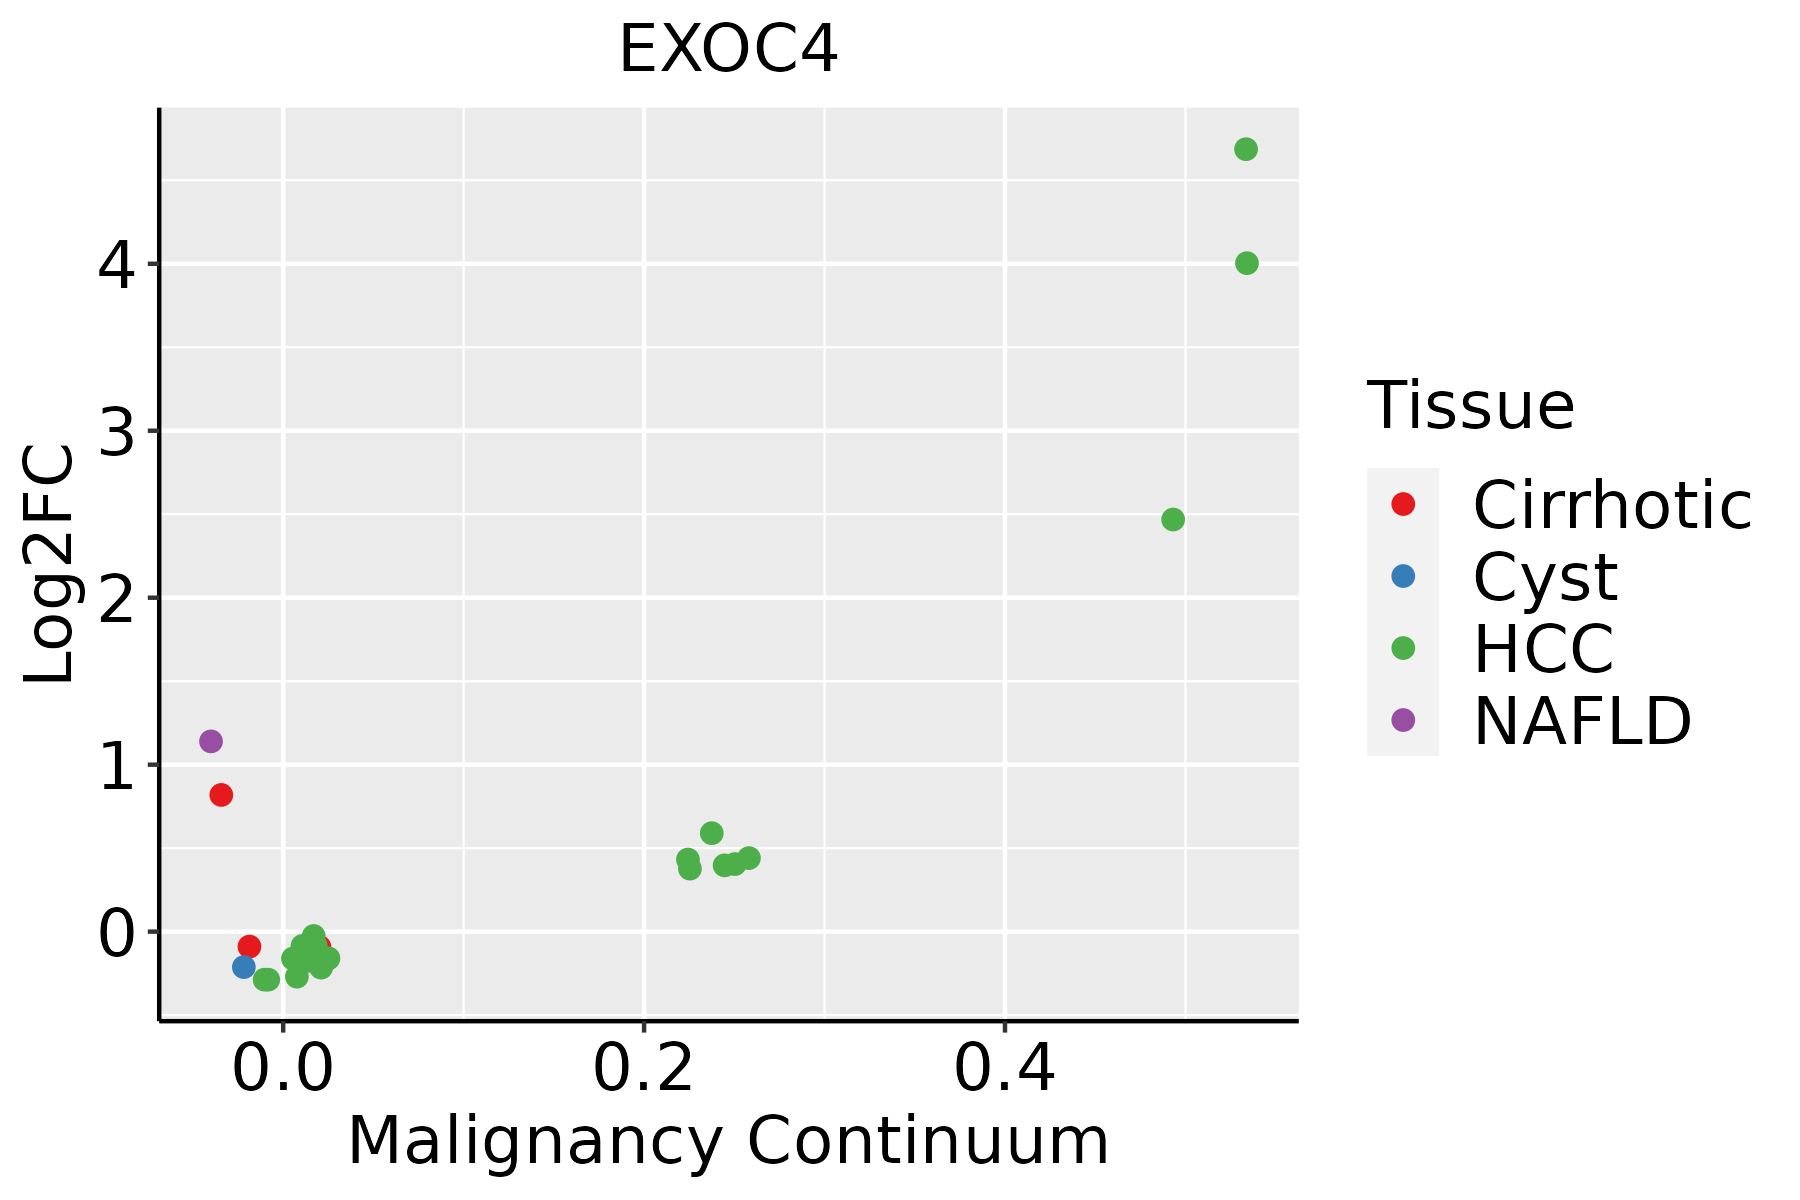 | HCC: Hepatocellular carcinoma |
| NAFLD: Non-alcoholic fatty liver disease | ||
| Lung |  | AAH: Atypical adenomatous hyperplasia |
| AIS: Adenocarcinoma in situ | ||
| IAC: Invasive lung adenocarcinoma | ||
| MIA: Minimally invasive adenocarcinoma | ||
| Oral Cavity | 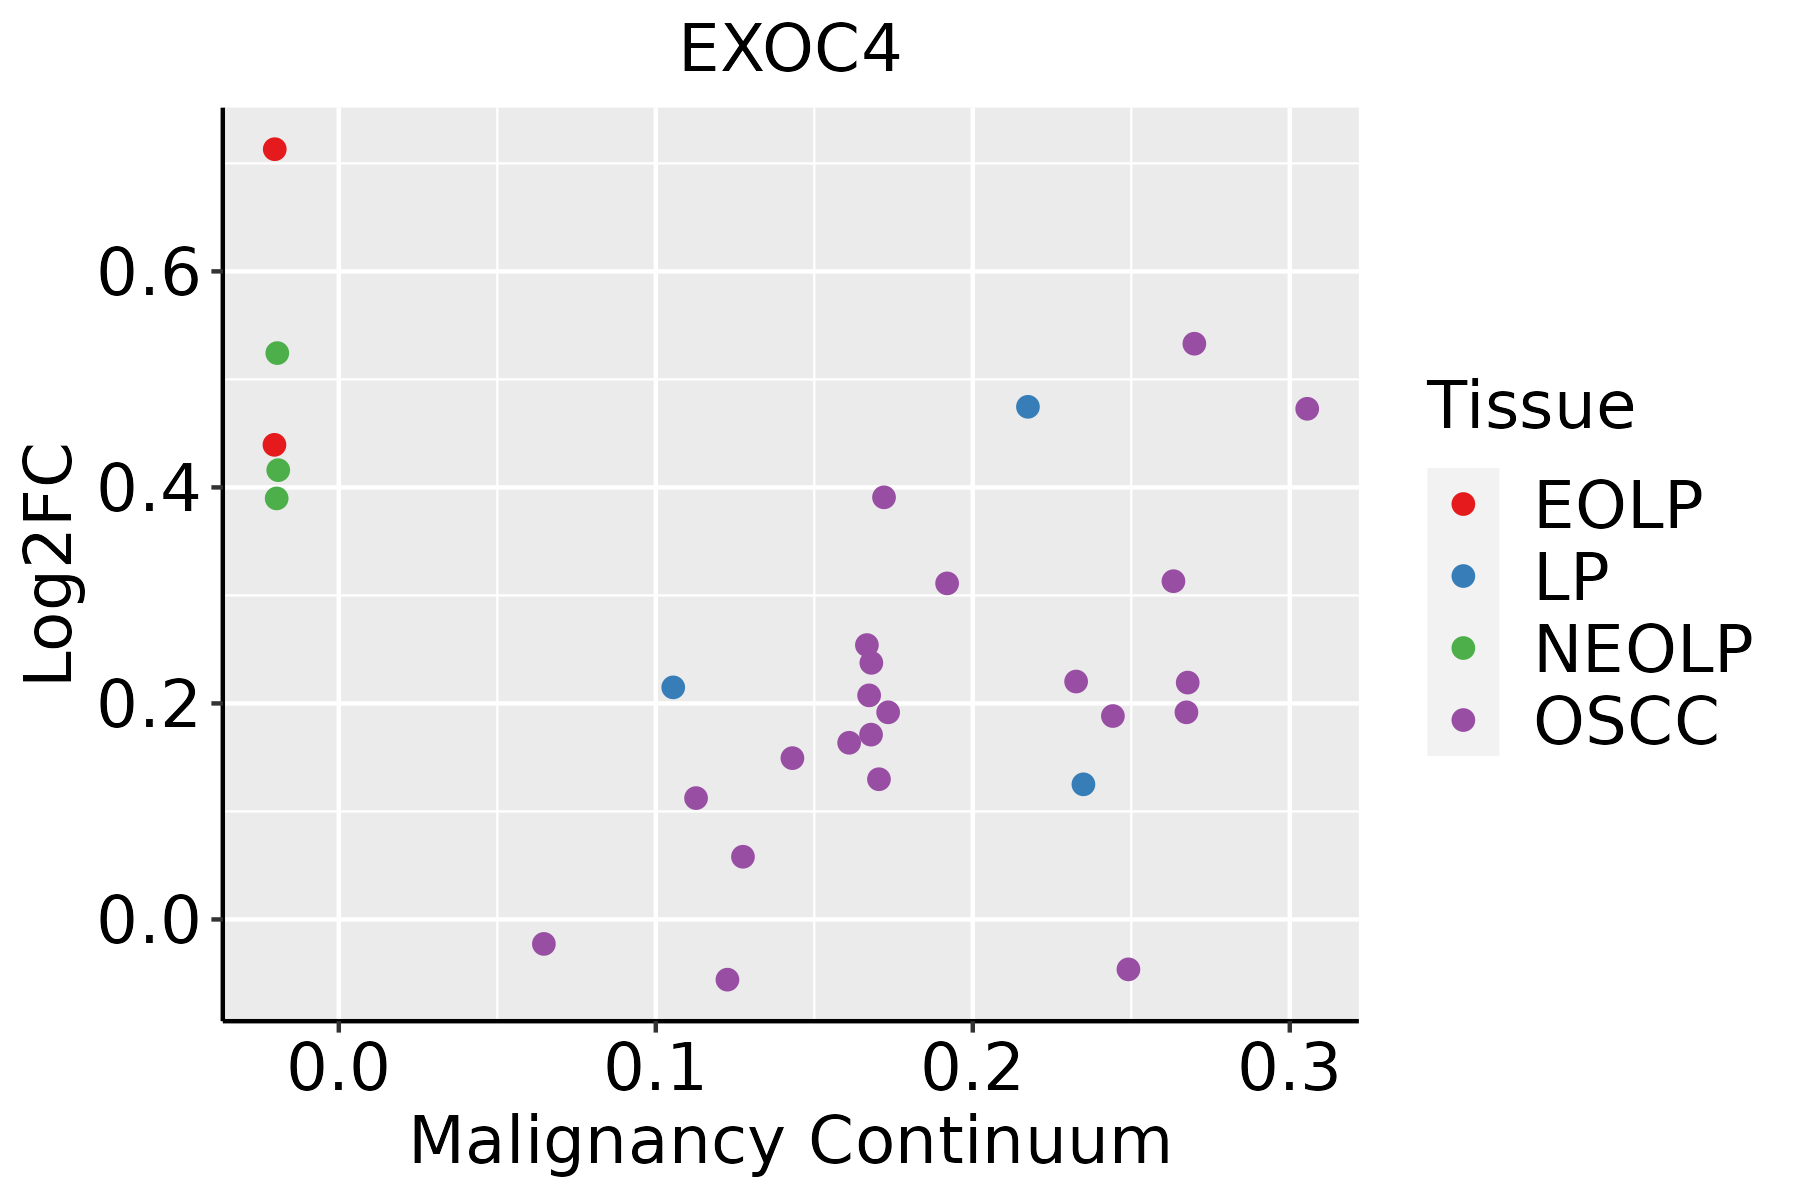 | EOLP: Erosive Oral lichen planus |
| LP: leukoplakia | ||
| NEOLP: Non-erosive oral lichen planus | ||
| OSCC: Oral squamous cell carcinoma | ||
| Prostate | 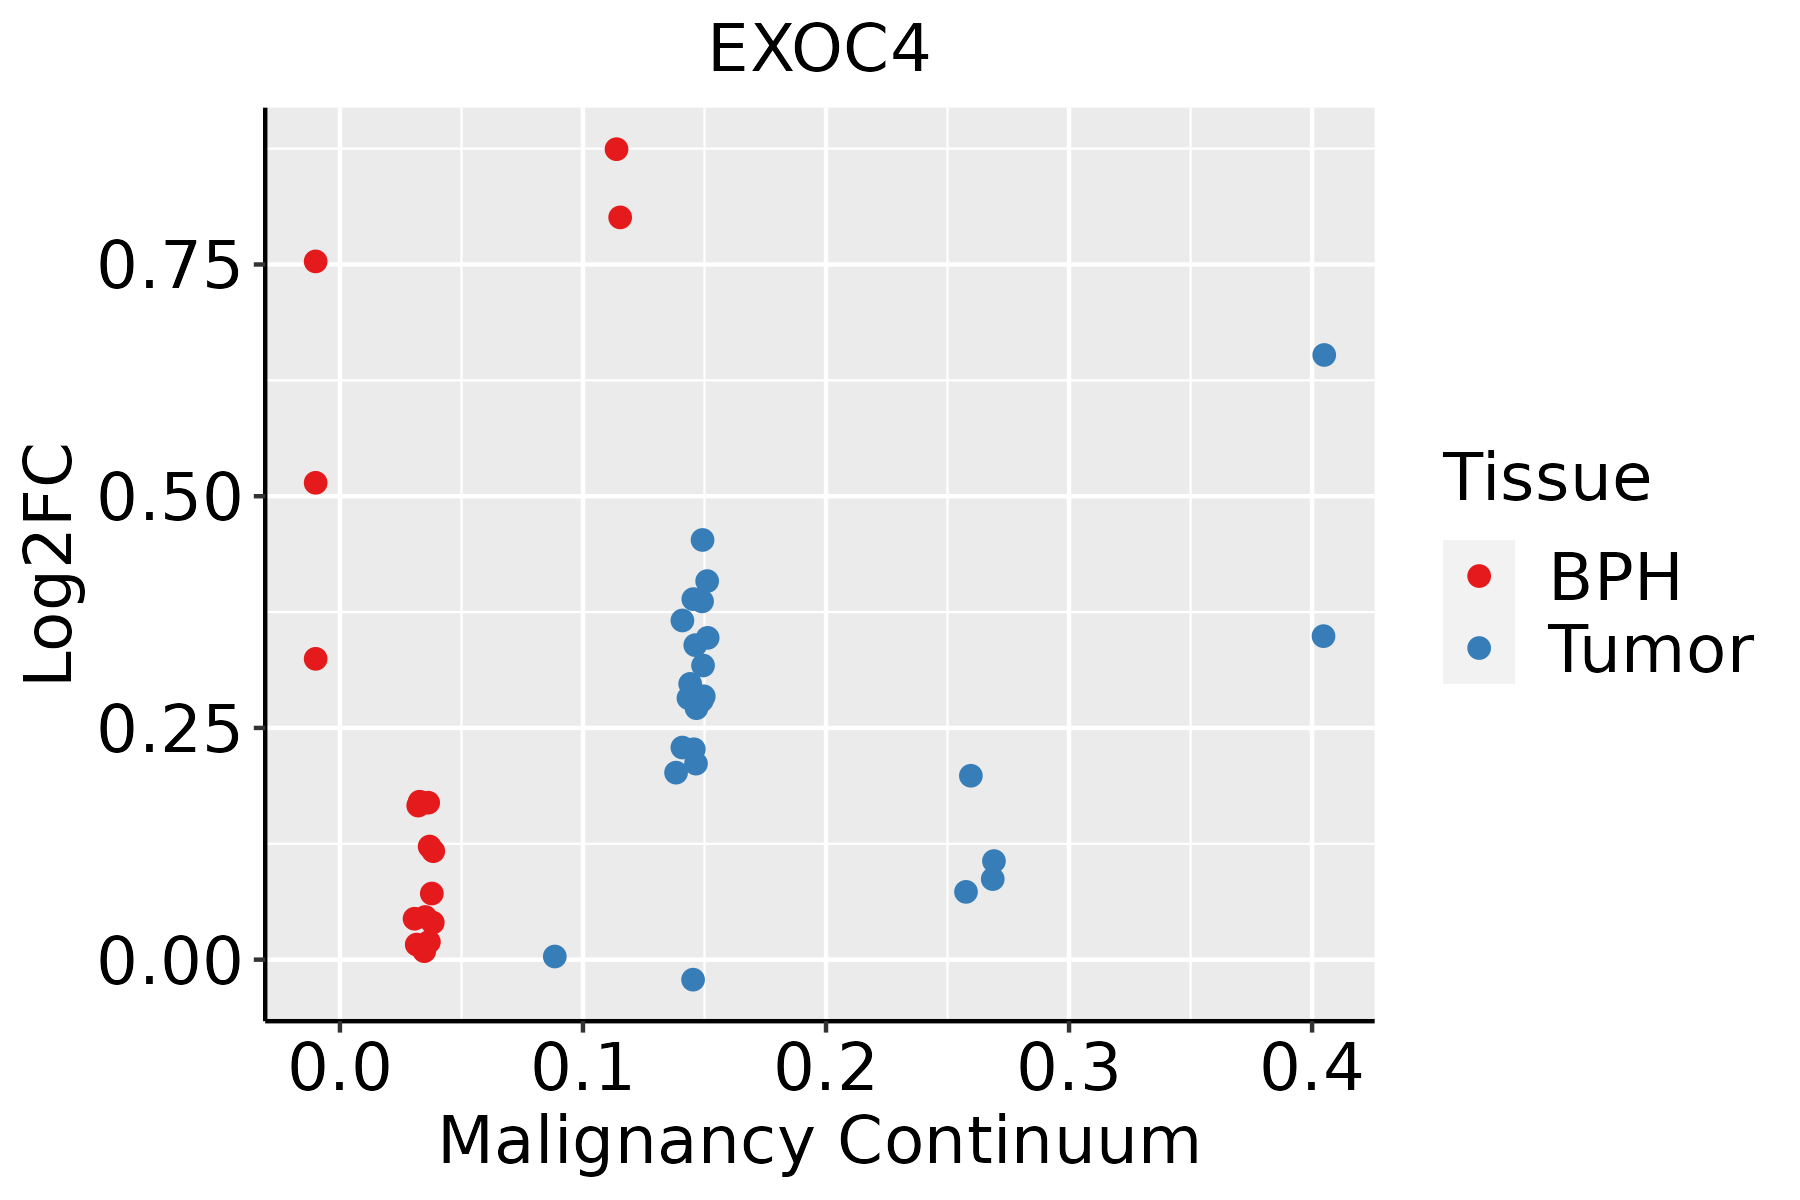 | BPH: Benign Prostatic Hyperplasia |
| Skin | 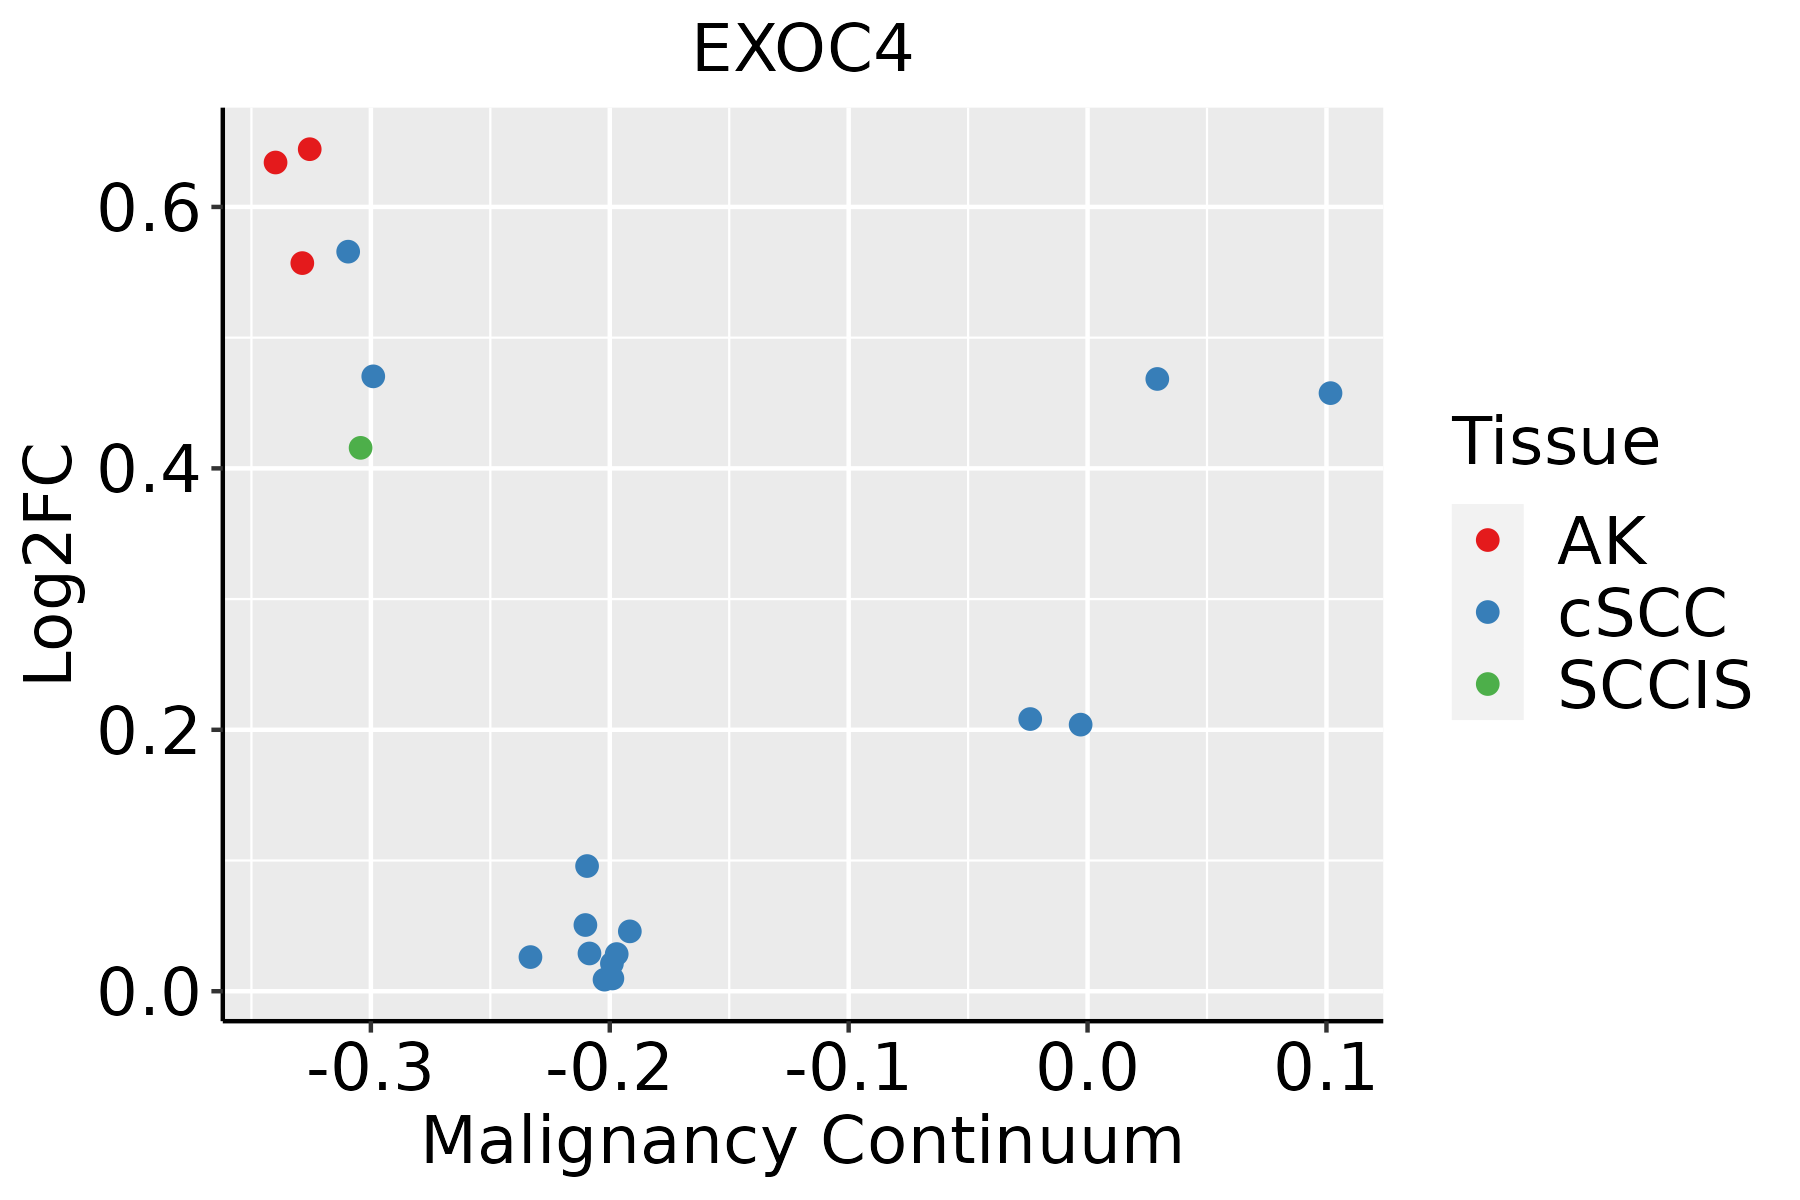 | AK: Actinic keratosis |
| cSCC: Cutaneous squamous cell carcinoma | ||
| SCCIS:squamous cell carcinoma in situ | ||
| Thyroid | 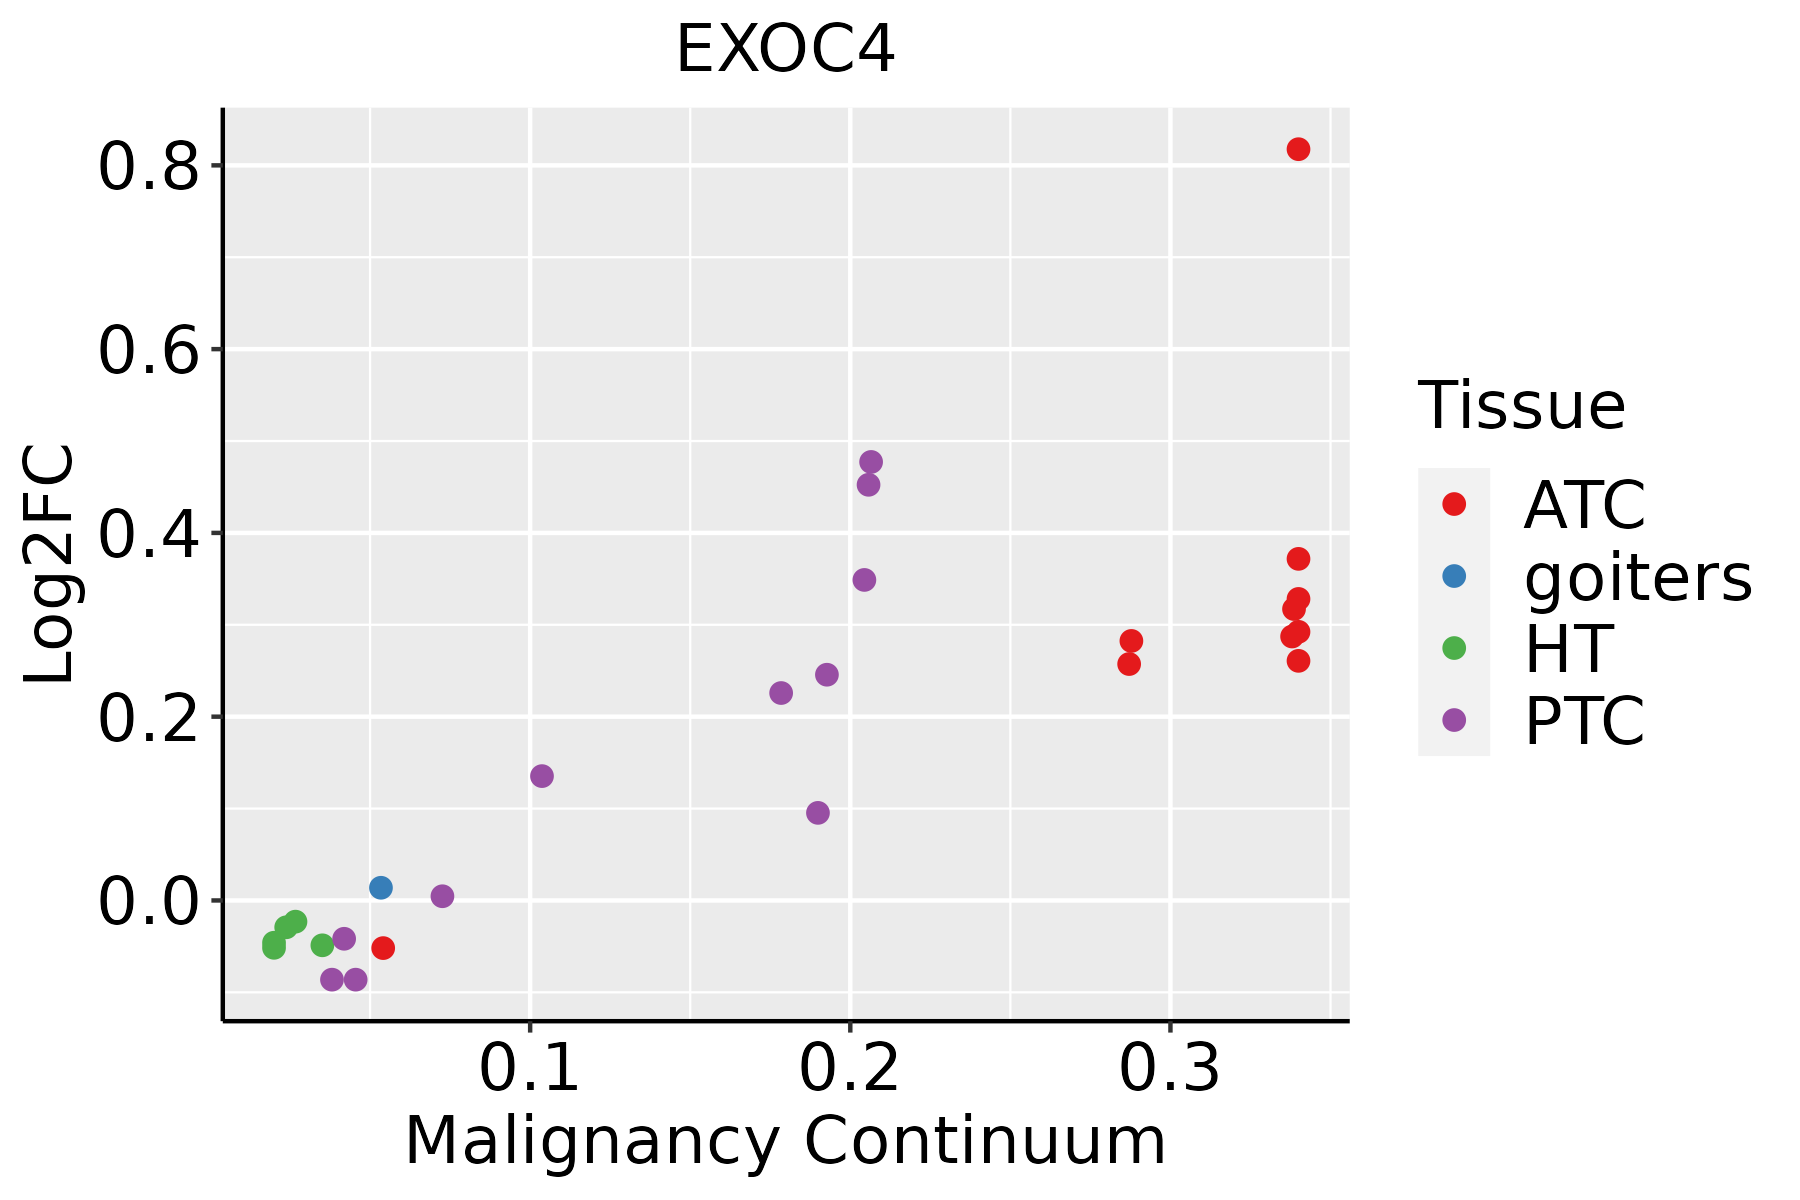 | ATC: Anaplastic thyroid cancer |
| HT: Hashimoto's thyroiditis | ||
| PTC: Papillary thyroid cancer |
| ∗log2FC in expression of this searched gene in stem-like cells from each diseased tissue sample relative to stem-like cells in normal samples in each tissue plotted against the malignancy continuum. Samples are colored based on if they are from different disease stage. |
Top |
Malignant transformation related pathway analysis |
| Find out the enriched GO biological processes and KEGG pathways involved in transition from healthy to precancer to cancer |
| Tissue | Disease Stage | Enriched GO biological Processes |
| Colorectum | AD |  |
| Colorectum | SER |  |
| Colorectum | MSS |  |
| Colorectum | MSI-H |  |
| Colorectum | FAP |  |
| ∗Top 15 enriched GO BP terms are showed in the bar plot of each disease state in each tissue. Each row represents a significant GO biological process which is colored according to the -log10(p.adjust). |
| Page: 1 2 3 4 5 6 7 8 9 |
| GO ID | Tissue | Disease Stage | Description | Gene Ratio | Bg Ratio | pvalue | p.adjust | Count |
| GO:00516567 | Cervix | CC | establishment of organelle localization | 76/2311 | 390/18723 | 3.17e-05 | 5.21e-04 | 76 |
| GO:00988767 | Cervix | CC | vesicle-mediated transport to the plasma membrane | 34/2311 | 136/18723 | 3.75e-05 | 5.91e-04 | 34 |
| GO:00068927 | Cervix | CC | post-Golgi vesicle-mediated transport | 28/2311 | 104/18723 | 4.31e-05 | 6.61e-04 | 28 |
| GO:00073695 | Cervix | CC | gastrulation | 42/2311 | 185/18723 | 5.83e-05 | 8.46e-04 | 42 |
| GO:00162367 | Cervix | CC | macroautophagy | 58/2311 | 291/18723 | 1.40e-04 | 1.70e-03 | 58 |
| GO:00481938 | Cervix | CC | Golgi vesicle transport | 58/2311 | 296/18723 | 2.24e-04 | 2.54e-03 | 58 |
| GO:00105067 | Cervix | CC | regulation of autophagy | 61/2311 | 317/18723 | 2.61e-04 | 2.87e-03 | 61 |
| GO:0001704 | Cervix | CC | formation of primary germ layer | 27/2311 | 121/18723 | 1.49e-03 | 1.16e-02 | 27 |
| GO:00068936 | Cervix | CC | Golgi to plasma membrane transport | 16/2311 | 60/18723 | 2.00e-03 | 1.46e-02 | 16 |
| GO:00068873 | Cervix | CC | exocytosis | 59/2311 | 352/18723 | 8.74e-03 | 4.48e-02 | 59 |
| GO:0048193 | Colorectum | AD | Golgi vesicle transport | 109/3918 | 296/18723 | 1.80e-10 | 1.68e-08 | 109 |
| GO:0051656 | Colorectum | AD | establishment of organelle localization | 131/3918 | 390/18723 | 3.00e-09 | 2.06e-07 | 131 |
| GO:0010506 | Colorectum | AD | regulation of autophagy | 111/3918 | 317/18723 | 3.57e-09 | 2.35e-07 | 111 |
| GO:0016236 | Colorectum | AD | macroautophagy | 103/3918 | 291/18723 | 6.76e-09 | 4.15e-07 | 103 |
| GO:0098876 | Colorectum | AD | vesicle-mediated transport to the plasma membrane | 57/3918 | 136/18723 | 2.30e-08 | 1.27e-06 | 57 |
| GO:0006892 | Colorectum | AD | post-Golgi vesicle-mediated transport | 45/3918 | 104/18723 | 2.22e-07 | 9.26e-06 | 45 |
| GO:0051650 | Colorectum | AD | establishment of vesicle localization | 57/3918 | 161/18723 | 1.47e-05 | 3.15e-04 | 57 |
| GO:0006893 | Colorectum | AD | Golgi to plasma membrane transport | 27/3918 | 60/18723 | 2.41e-05 | 4.66e-04 | 27 |
| GO:0016241 | Colorectum | AD | regulation of macroautophagy | 50/3918 | 141/18723 | 4.55e-05 | 7.92e-04 | 50 |
| GO:0051648 | Colorectum | AD | vesicle localization | 59/3918 | 177/18723 | 7.83e-05 | 1.25e-03 | 59 |
| Page: 1 2 3 4 5 6 7 8 9 10 11 12 13 14 15 16 17 |
| Pathway ID | Tissue | Disease Stage | Description | Gene Ratio | Bg Ratio | pvalue | p.adjust | qvalue | Count |
| hsa0513220 | Cervix | CC | Salmonella infection | 74/1267 | 249/8465 | 1.33e-09 | 2.54e-08 | 1.50e-08 | 74 |
| hsa05132110 | Cervix | CC | Salmonella infection | 74/1267 | 249/8465 | 1.33e-09 | 2.54e-08 | 1.50e-08 | 74 |
| hsa05132 | Colorectum | AD | Salmonella infection | 102/2092 | 249/8465 | 7.65e-09 | 1.28e-07 | 8.17e-08 | 102 |
| hsa051321 | Colorectum | AD | Salmonella infection | 102/2092 | 249/8465 | 7.65e-09 | 1.28e-07 | 8.17e-08 | 102 |
| hsa051322 | Colorectum | SER | Salmonella infection | 77/1580 | 249/8465 | 1.56e-06 | 2.35e-05 | 1.71e-05 | 77 |
| hsa051323 | Colorectum | SER | Salmonella infection | 77/1580 | 249/8465 | 1.56e-06 | 2.35e-05 | 1.71e-05 | 77 |
| hsa051324 | Colorectum | MSS | Salmonella infection | 92/1875 | 249/8465 | 5.23e-08 | 9.74e-07 | 5.97e-07 | 92 |
| hsa051325 | Colorectum | MSS | Salmonella infection | 92/1875 | 249/8465 | 5.23e-08 | 9.74e-07 | 5.97e-07 | 92 |
| hsa051326 | Colorectum | MSI-H | Salmonella infection | 43/797 | 249/8465 | 5.91e-05 | 8.33e-04 | 6.98e-04 | 43 |
| hsa051327 | Colorectum | MSI-H | Salmonella infection | 43/797 | 249/8465 | 5.91e-05 | 8.33e-04 | 6.98e-04 | 43 |
| hsa051328 | Colorectum | FAP | Salmonella infection | 67/1404 | 249/8465 | 2.04e-05 | 2.52e-04 | 1.53e-04 | 67 |
| hsa051329 | Colorectum | FAP | Salmonella infection | 67/1404 | 249/8465 | 2.04e-05 | 2.52e-04 | 1.53e-04 | 67 |
| hsa0513210 | Colorectum | CRC | Salmonella infection | 48/1091 | 249/8465 | 2.43e-03 | 1.69e-02 | 1.15e-02 | 48 |
| hsa0513211 | Colorectum | CRC | Salmonella infection | 48/1091 | 249/8465 | 2.43e-03 | 1.69e-02 | 1.15e-02 | 48 |
| hsa0513226 | Endometrium | AEH | Salmonella infection | 71/1197 | 249/8465 | 1.69e-09 | 3.44e-08 | 2.52e-08 | 71 |
| hsa05132112 | Endometrium | AEH | Salmonella infection | 71/1197 | 249/8465 | 1.69e-09 | 3.44e-08 | 2.52e-08 | 71 |
| hsa0513227 | Endometrium | EEC | Salmonella infection | 71/1237 | 249/8465 | 7.11e-09 | 1.30e-07 | 9.69e-08 | 71 |
| hsa0513236 | Endometrium | EEC | Salmonella infection | 71/1237 | 249/8465 | 7.11e-09 | 1.30e-07 | 9.69e-08 | 71 |
| hsa0513239 | Esophagus | HGIN | Salmonella infection | 69/1383 | 249/8465 | 3.02e-06 | 4.47e-05 | 3.55e-05 | 69 |
| hsa05132115 | Esophagus | HGIN | Salmonella infection | 69/1383 | 249/8465 | 3.02e-06 | 4.47e-05 | 3.55e-05 | 69 |
| Page: 1 2 3 |
Top |
Cell-cell communication analysis |
| Identification of potential cell-cell interactions between two cell types and their ligand-receptor pairs for different disease states |
| Ligand | Receptor | LRpair | Pathway | Tissue | Disease Stage |
| Page: 1 |
Top |
Single-cell gene regulatory network inference analysis |
| Find out the significant the regulons (TFs) and the target genes of each regulon across cell types for different disease states |
| TF | Cell Type | Tissue | Disease Stage | Target Gene | RSS | Regulon Activity |
| ∗The dot plots of a searched regulon are shown for all cell subpopulations in each disease state of each tissue based on the regulon specific score inferred using pySCENIC and by calculating the average expression. |
| Page: 1 |
Top |
Somatic mutation of malignant transformation related genes |
| Annotation of somatic variants for genes involved in malignant transformation |
| Hugo Symbol | Variant Class | Variant Classification | dbSNP RS | HGVSc | HGVSp | HGVSp Short | SWISSPROT | BIOTYPE | SIFT | PolyPhen | Tumor Sample Barcode | Tissue | Histology | Sex | Age | Stage | Therapy Types | Drugs | Outcome |
| EXOC4 | SNV | Missense_Mutation | rs200509714 | c.2801N>A | p.Arg934His | p.R934H | Q96A65 | protein_coding | deleterious(0) | possibly_damaging(0.664) | TCGA-A1-A0SQ-01 | Breast | breast invasive carcinoma | Female | <65 | I/II | Chemotherapy | ac | SD |
| EXOC4 | SNV | Missense_Mutation | rs183280115 | c.62N>T | p.Ser21Leu | p.S21L | Q96A65 | protein_coding | deleterious(0) | benign(0.444) | TCGA-AC-A23H-01 | Breast | breast invasive carcinoma | Female | >=65 | I/II | Unknown | Unknown | PD |
| EXOC4 | SNV | Missense_Mutation | novel | c.1051N>T | p.Ala351Ser | p.A351S | Q96A65 | protein_coding | tolerated(0.42) | benign(0.091) | TCGA-AC-A3BB-01 | Breast | breast invasive carcinoma | Female | <65 | III/IV | Chemotherapy | cytoxan | CR |
| EXOC4 | SNV | Missense_Mutation | rs183280115 | c.62N>T | p.Ser21Leu | p.S21L | Q96A65 | protein_coding | deleterious(0) | benign(0.444) | TCGA-AC-A3YI-01 | Breast | breast invasive carcinoma | Female | >=65 | III/IV | Chemotherapy | cytoxan | CR |
| EXOC4 | SNV | Missense_Mutation | rs183280115 | c.62N>T | p.Ser21Leu | p.S21L | Q96A65 | protein_coding | deleterious(0) | benign(0.444) | TCGA-AO-A12D-01 | Breast | breast invasive carcinoma | Female | <65 | I/II | Chemotherapy | cyclophosphamide | SD |
| EXOC4 | SNV | Missense_Mutation | c.2683N>A | p.Ala895Thr | p.A895T | Q96A65 | protein_coding | deleterious(0) | probably_damaging(0.946) | TCGA-AQ-A04J-01 | Breast | breast invasive carcinoma | Female | <65 | I/II | Chemotherapy | cytoxan | SD | |
| EXOC4 | SNV | Missense_Mutation | c.1243N>G | p.Gln415Glu | p.Q415E | Q96A65 | protein_coding | tolerated(0.85) | benign(0.258) | TCGA-C8-A1HM-01 | Breast | breast invasive carcinoma | Female | >=65 | I/II | Chemotherapy | doxorubicin | CR | |
| EXOC4 | SNV | Missense_Mutation | novel | c.1055N>A | p.Val352Glu | p.V352E | Q96A65 | protein_coding | deleterious(0) | probably_damaging(0.981) | TCGA-E2-A1LE-01 | Breast | breast invasive carcinoma | Female | >=65 | III/IV | Chemotherapy | herceptin | PD |
| EXOC4 | SNV | Missense_Mutation | novel | c.1537N>T | p.Ala513Ser | p.A513S | Q96A65 | protein_coding | tolerated(0.36) | benign(0.003) | TCGA-OL-A6VQ-01 | Breast | breast invasive carcinoma | Female | <65 | I/II | Unknown | Unknown | SD |
| EXOC4 | insertion | Frame_Shift_Ins | novel | c.2634_2635insCCTC | p.Gln879ProfsTer30 | p.Q879Pfs*30 | Q96A65 | protein_coding | TCGA-AR-A0TY-01 | Breast | breast invasive carcinoma | Female | <65 | I/II | Unspecific | Paclitaxel | PD |
| Page: 1 2 3 4 5 6 7 8 9 10 11 12 13 14 |
Top |
Related drugs of malignant transformation related genes |
| Identification of chemicals and drugs interact with genes involved in malignant transfromation |
| (DGIdb 4.0) |
| Entrez ID | Symbol | Category | Interaction Types | Drug Claim Name | Drug Name | PMIDs |
| Page: 1 |

Copyright 2023-Present -The University of Texas Health Science Center at Houston |