Schematic overview of the cellular and molecular mechanisms involved in the cancer progression, including the proposed cellular and molecular mechanisms in cancer cells trajectory. AT1: alveolar type 1 cells; AT2: alveolar type 2 cells; AAH: atypical adenomatous hyperplasia; AIS: adenocarcinoma in situ; MIA: minimally invasive adenocarcinoma; IA: invasive adenocarcinoma; EMT: epithelial-mesenchymal transition

Home

Download

Statistics

Help

Contact

Center for Computational Systems Medicine
leaf

Gene summary

leaf

Malignant transformation analysis

leaf

Malignant transformation related pathway analysis

leaf

Cell-cell communication analysis

leaf

Single-cell gene regulatory network inference analysis

leaf

Somatic mutation of malignant transformation related genes

leaf

Related drugs of malignant transformation related genes

Gene: ANKRD11

Gene summary for ANKRD11

check button Gene summary.

Gene informationSpeciesHuman
Gene symbol

ANKRD11

Gene ID

29123

Gene nameankyrin repeat domain 11
Gene AliasANCO-1
Cytomap16q24.3
Gene Typeprotein-coding
GO ID

GO:0001501

UniProtAcc

Q6UB99


Top

Malignant transformation analysis

check button Identification of the aberrant gene expression in precancerous and cancerous lesions by comparing the gene expression of stem-like cells in diseased tissues with normal stem cells
check button Malignant transformation involving gene list.
Entrez IDSymbolReplicatesSpeciesOrganTissueAdj P-valueLog2FCMalignancy
29123ANKRD11GSM5353223_PA_PB2B_Pool_2_S26_L001HumanProstateTumor2.89e-034.11e-010.1604
29123ANKRD11GSM5353227_PA_PR5199-193K_Pool_1_2_3_S55_L002HumanProstateTumor4.57e-041.16e-010.1602
29123ANKRD11GSM5353228_PA_PR5199-640K_Pool_1_3_S108_L004HumanProstateTumor1.69e-038.09e-020.1537
29123ANKRD11GSM5353236_PA_PR5251_T1_S7_L001HumanProstateTumor5.01e-033.35e-010.1608
29123ANKRD11GSM5353240_PA_PR5254_T1_S15_L001HumanProstateTumor3.20e-144.94e-010.1575
29123ANKRD11GSM5353243_PA_PR5261_T1_S23_L002HumanProstateTumor4.51e-233.21e-010.1545
29123ANKRD11GSM5353244_PA_PR5261_T2_S24_L002HumanProstateTumor3.07e-204.70e-010.1569
29123ANKRD11GSM5353247_PA_PR5269_3_S27_L002HumanProstateTumor1.69e-02-1.20e-010.1532
29123ANKRD11GSM5353248_PA_PR5269_4_S28_L002HumanProstateTumor3.25e-093.70e-010.1541
29123ANKRD11P1_S1_AKHumanSkinAK6.99e-266.94e-01-0.3399
29123ANKRD11P2_S3_AKHumanSkinAK2.49e-175.68e-01-0.3287
29123ANKRD11P3_S6_AKHumanSkinAK8.27e-064.34e-01-0.3256
29123ANKRD11P4_S8_cSCCHumanSkincSCC2.66e-114.19e-01-0.3095
29123ANKRD11P5_S10_cSCCHumanSkincSCC5.50e-305.86e-01-0.299
29123ANKRD11P1_cSCCHumanSkincSCC1.28e-239.96e-010.0292
29123ANKRD11P2_cSCCHumanSkincSCC1.41e-085.16e-01-0.024
29123ANKRD11P4_cSCCHumanSkincSCC2.70e-085.48e-01-0.00290000000000005
29123ANKRD11P10_cSCCHumanSkincSCC1.56e-097.01e-010.1017
29123ANKRD11cSCC_p8HumanSkincSCC7.55e-035.44e-02-0.1971
29123ANKRD11Pat01-BHumanStomachGC2.41e-417.89e-010.5754
Page: 1 2 3 4 5 6 7 8 9 10 11 12 13 

check button Transcriptomic changes along malignancy continuum.
TissueExpression DynamicsAbbreviation
CervixThe image shows the transcriptomic changes along malignancy continuum.log2FC in expression of this searched gene in stem-like cells from each diseased tissue sample relative to stem-like cells in normal samples in each tissue plotted against the malignancy continuum. Samples are colored based on if they are from different disease stage.CC: Cervix cancer
HSIL_HPV: HPV-infected high-grade squamous intraepithelial lesions
N_HPV: HPV-infected normal cervix
Colorectum (GSE201348)The image shows the transcriptomic changes along malignancy continuum.log2FC in expression of this searched gene in stem-like cells from each diseased tissue sample relative to stem-like cells in normal samples in each tissue plotted against the malignancy continuum. Samples are colored based on if they are from different disease stage.FAP: Familial adenomatous polyposis
CRC: Colorectal cancer
Colorectum (HTA11)The image shows the transcriptomic changes along malignancy continuum.log2FC in expression of this searched gene in stem-like cells from each diseased tissue sample relative to stem-like cells in normal samples in each tissue plotted against the malignancy continuum. Samples are colored based on if they are from different disease stage.AD: Adenomas
SER: Sessile serrated lesions
MSI-H: Microsatellite-high colorectal cancer
MSS: Microsatellite stable colorectal cancer
EndometriumThe image shows the transcriptomic changes along malignancy continuum.log2FC in expression of this searched gene in stem-like cells from each diseased tissue sample relative to stem-like cells in normal samples in each tissue plotted against the malignancy continuum. Samples are colored based on if they are from different disease stage.AEH: Atypical endometrial hyperplasia
EEC: Endometrioid Cancer
EsophagusThe image shows the transcriptomic changes along malignancy continuum.log2FC in expression of this searched gene in stem-like cells from each diseased tissue sample relative to stem-like cells in normal samples in each tissue plotted against the malignancy continuum. Samples are colored based on if they are from different disease stage.ESCC: Esophageal squamous cell carcinoma
HGIN: High-grade intraepithelial neoplasias
LGIN: Low-grade intraepithelial neoplasias
GCThe image shows the transcriptomic changes along malignancy continuum.log2FC in expression of this searched gene in stem-like cells from each diseased tissue sample relative to stem-like cells in normal samples in each tissue plotted against the malignancy continuum. Samples are colored based on if they are from different disease stage.CAG: Chronic atrophic gastritis
CAG with IM: Chronic atrophic gastritis with intestinal metaplasia
CSG: Chronic superficial gastritis
GC: Gastric cancer
SIM: Severe intestinal metaplasia
WIM: Wild intestinal metaplasia
LiverThe image shows the transcriptomic changes along malignancy continuum.log2FC in expression of this searched gene in stem-like cells from each diseased tissue sample relative to stem-like cells in normal samples in each tissue plotted against the malignancy continuum. Samples are colored based on if they are from different disease stage.
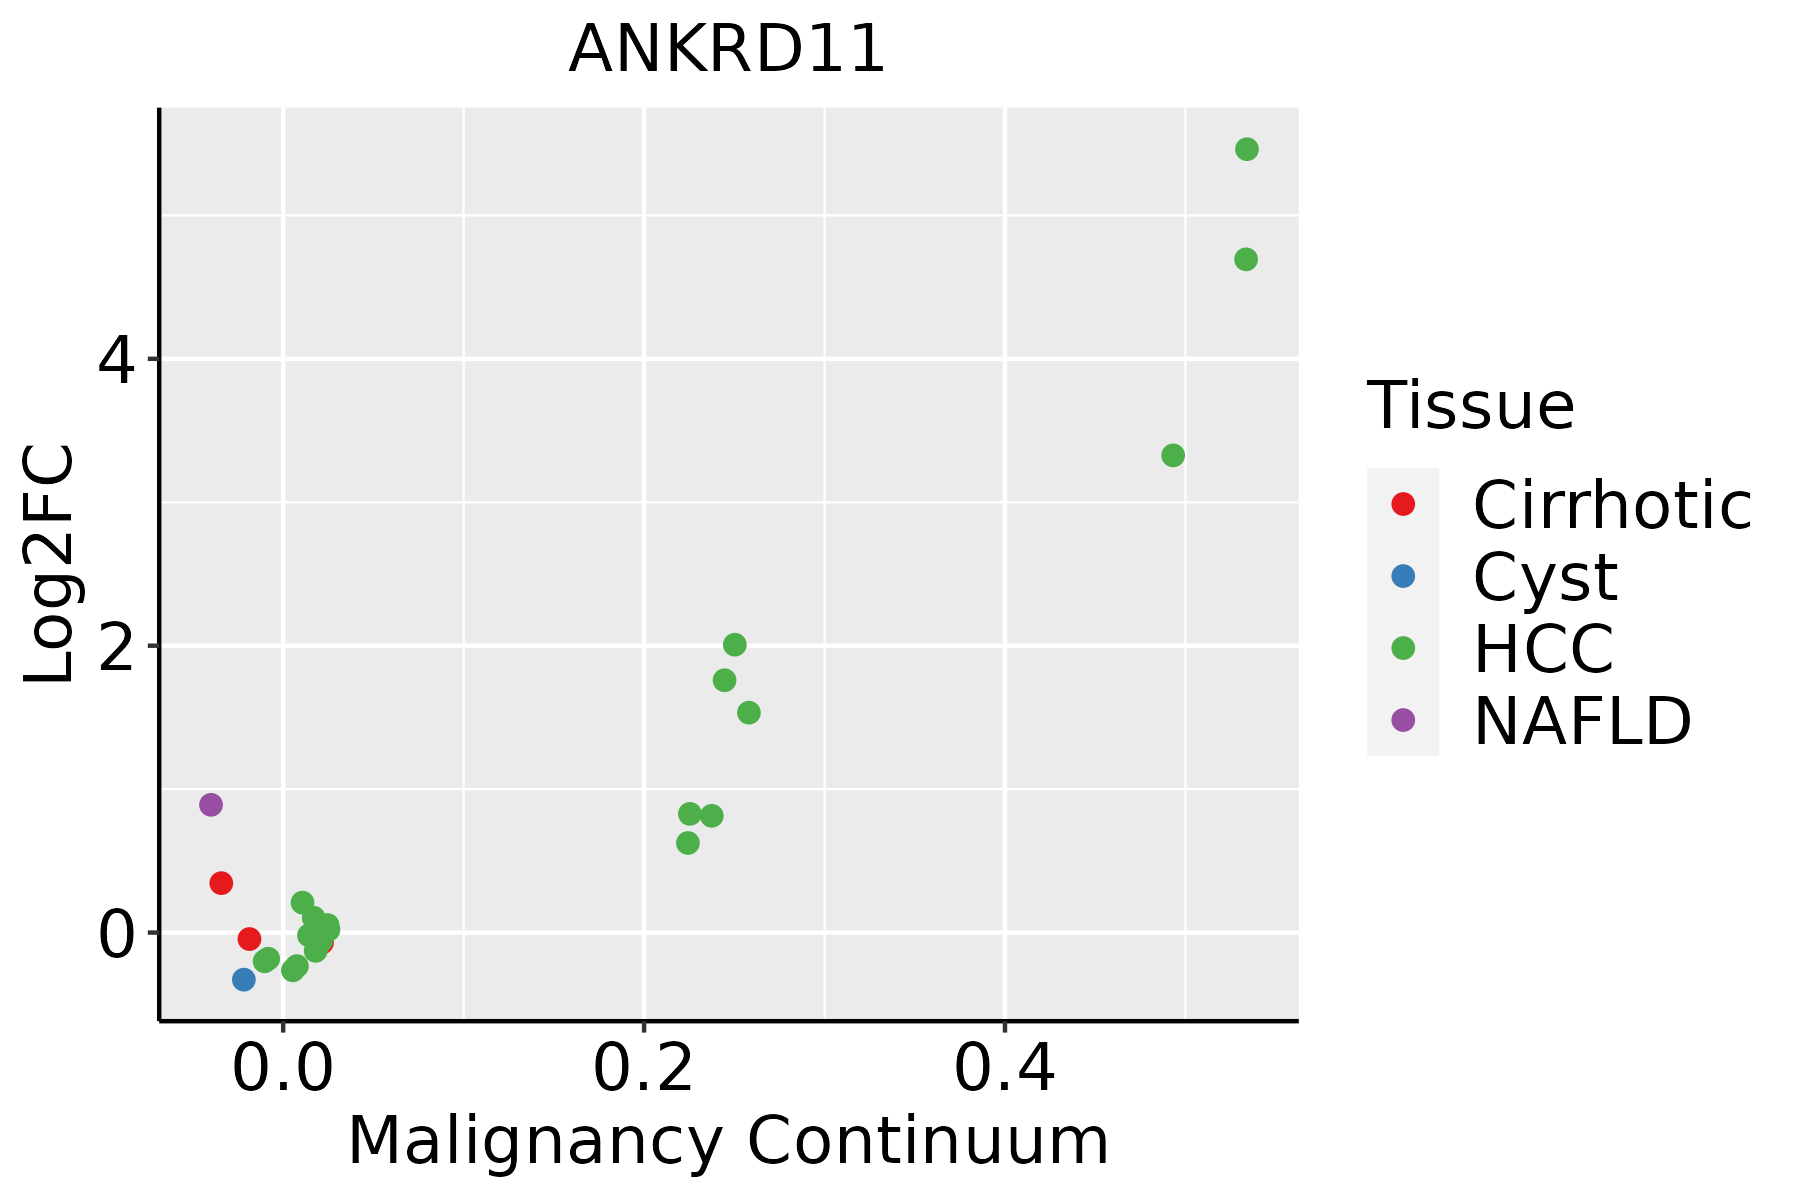
HCC: Hepatocellular carcinoma
NAFLD: Non-alcoholic fatty liver disease
LungThe image shows the transcriptomic changes along malignancy continuum.log2FC in expression of this searched gene in stem-like cells from each diseased tissue sample relative to stem-like cells in normal samples in each tissue plotted against the malignancy continuum. Samples are colored based on if they are from different disease stage.
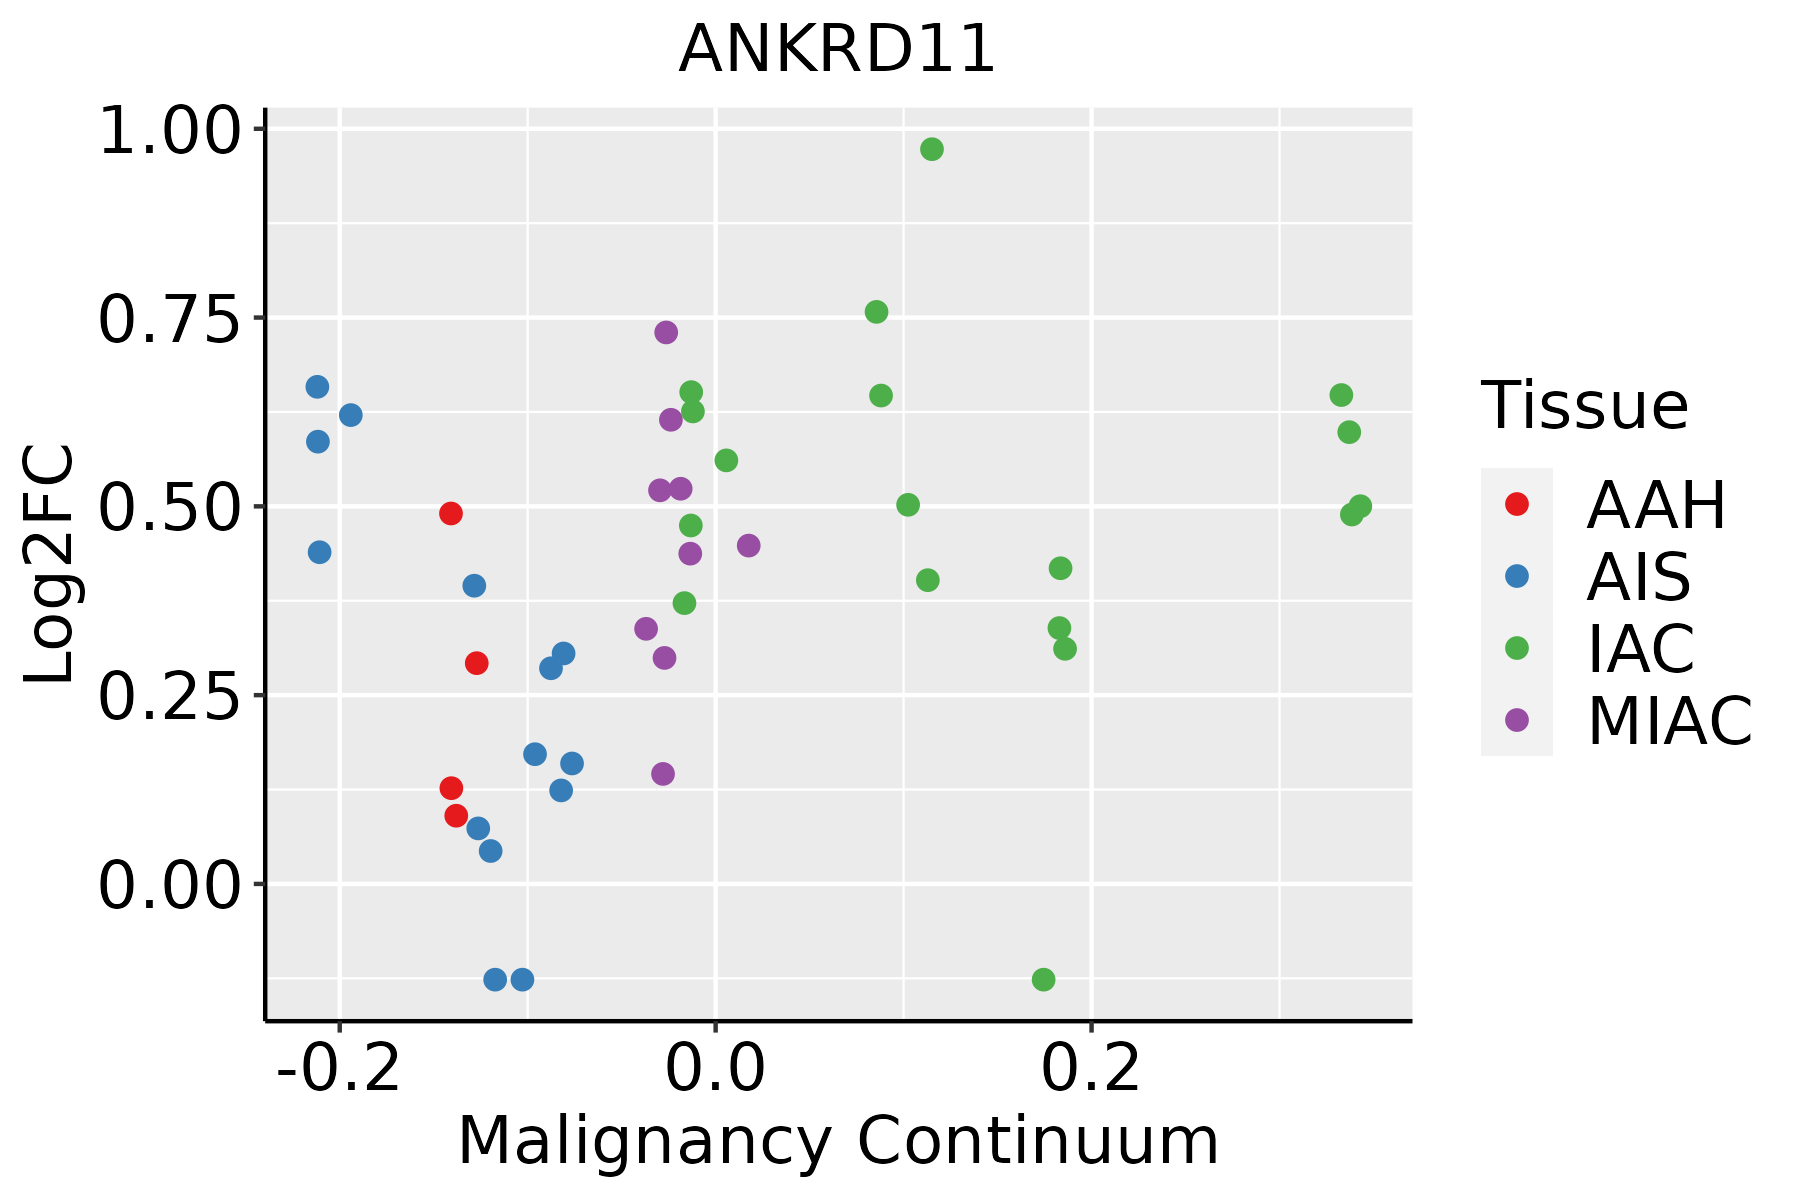
AAH: Atypical adenomatous hyperplasia
AIS: Adenocarcinoma in situ
IAC: Invasive lung adenocarcinoma
MIA: Minimally invasive adenocarcinoma
Oral CavityThe image shows the transcriptomic changes along malignancy continuum.log2FC in expression of this searched gene in stem-like cells from each diseased tissue sample relative to stem-like cells in normal samples in each tissue plotted against the malignancy continuum. Samples are colored based on if they are from different disease stage.
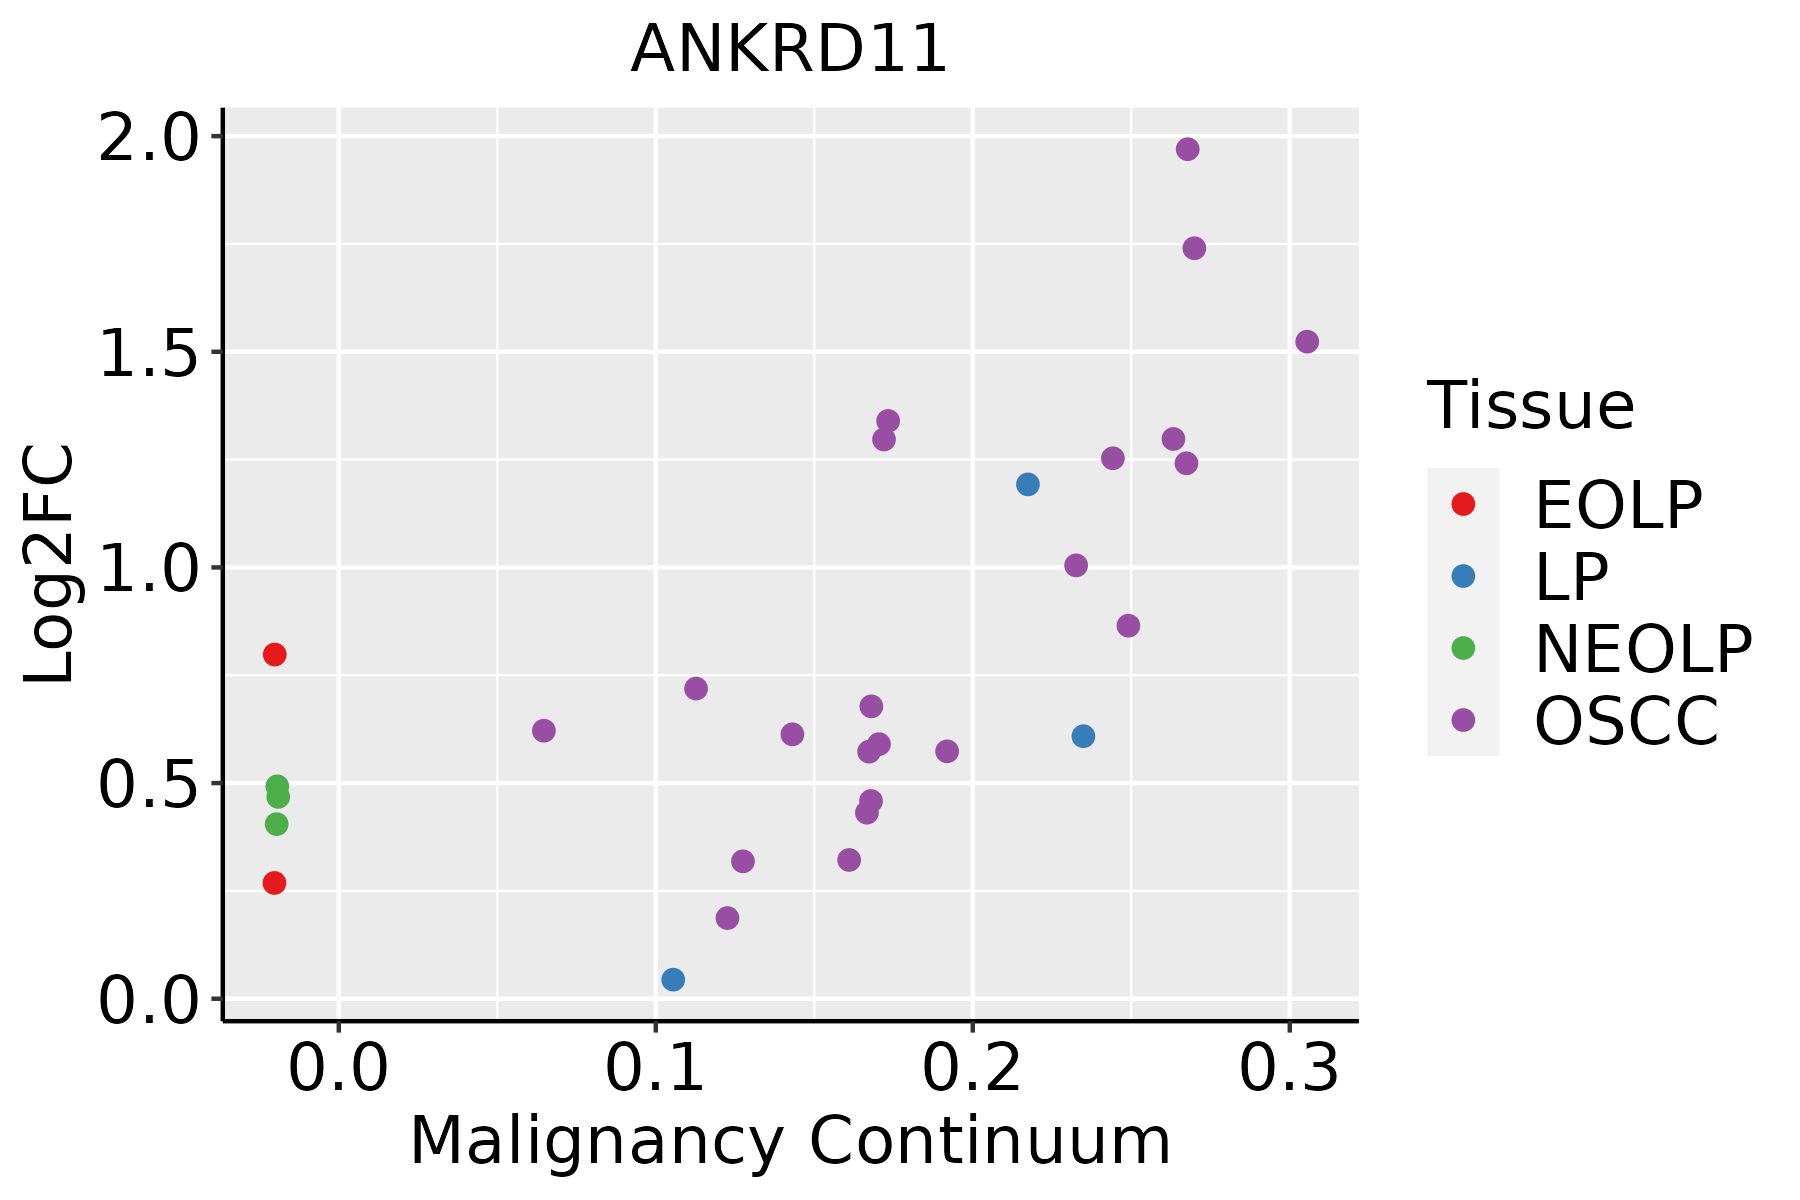
EOLP: Erosive Oral lichen planus
LP: leukoplakia
NEOLP: Non-erosive oral lichen planus
OSCC: Oral squamous cell carcinoma
ProstateThe image shows the transcriptomic changes along malignancy continuum.log2FC in expression of this searched gene in stem-like cells from each diseased tissue sample relative to stem-like cells in normal samples in each tissue plotted against the malignancy continuum. Samples are colored based on if they are from different disease stage.
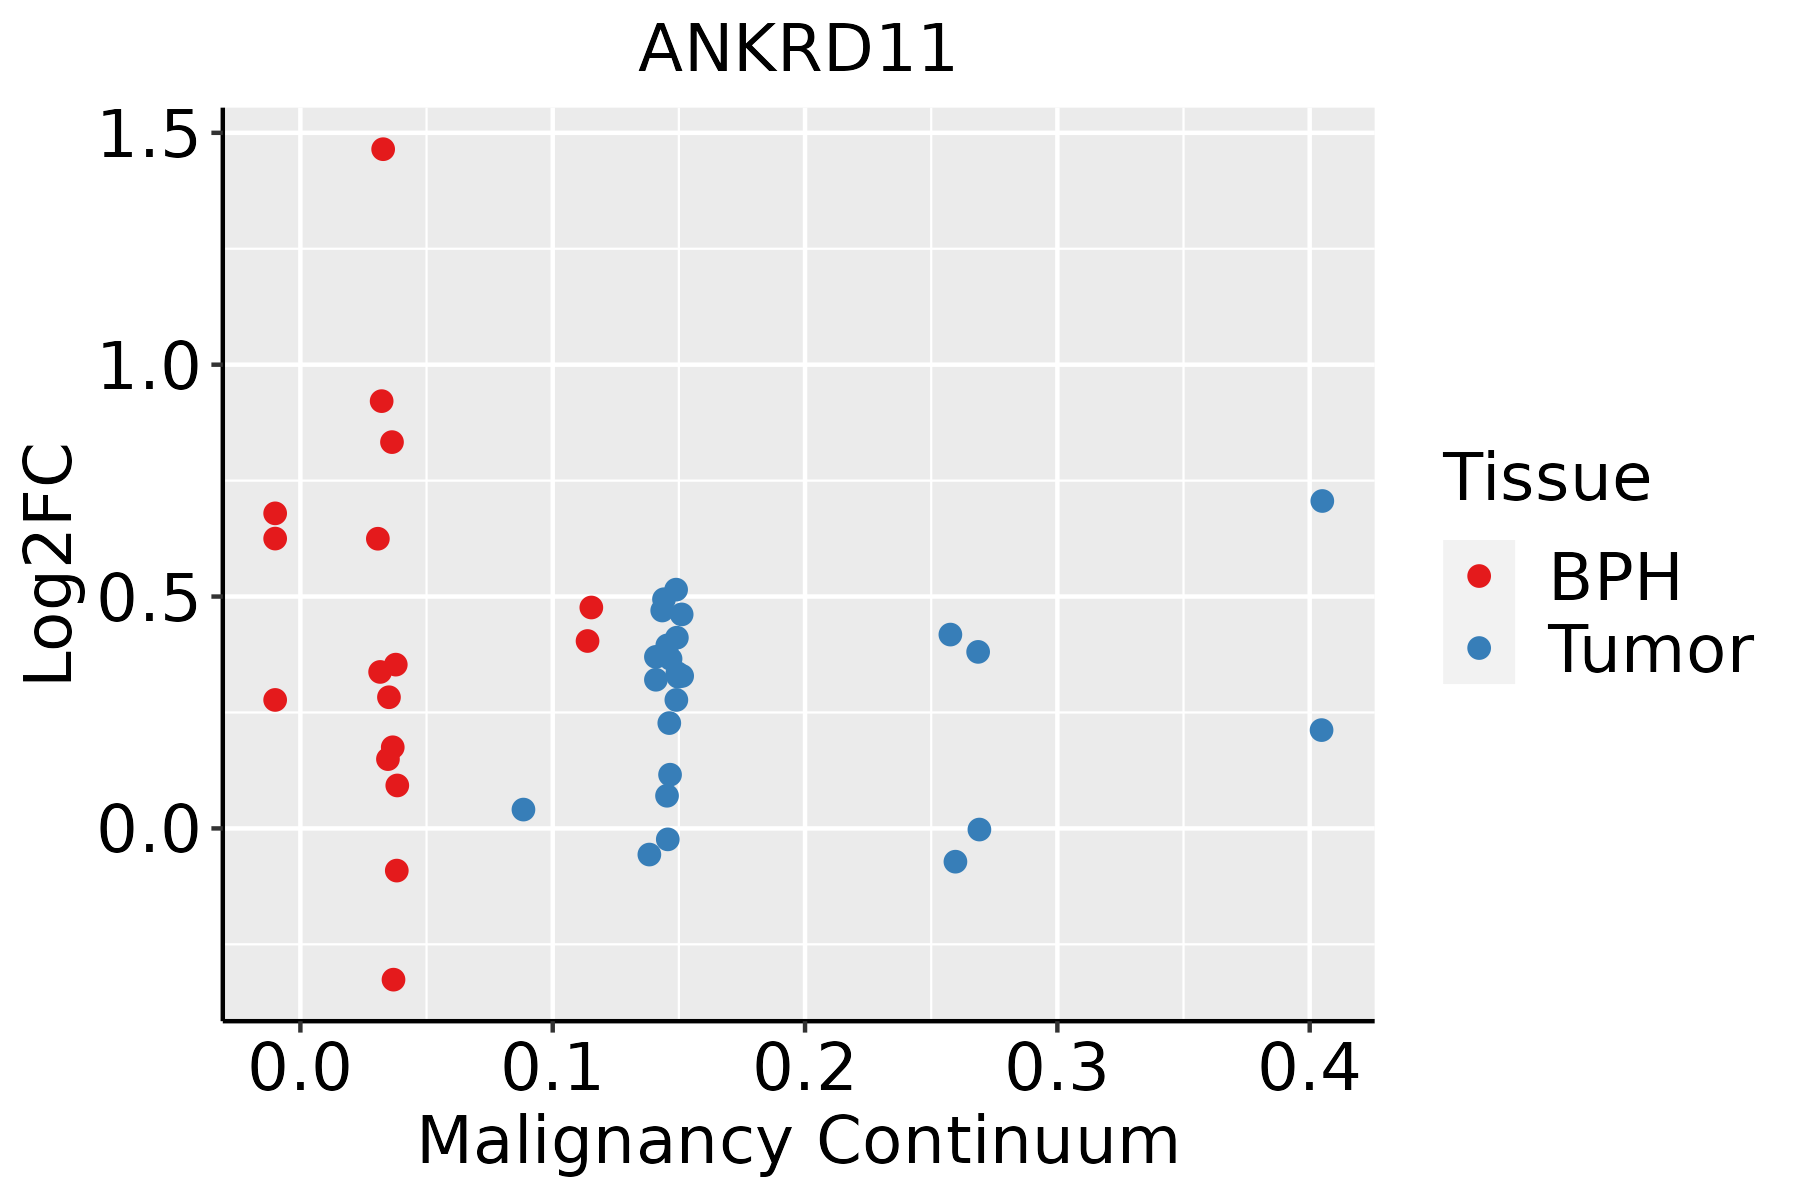
BPH: Benign Prostatic Hyperplasia
SkinThe image shows the transcriptomic changes along malignancy continuum.log2FC in expression of this searched gene in stem-like cells from each diseased tissue sample relative to stem-like cells in normal samples in each tissue plotted against the malignancy continuum. Samples are colored based on if they are from different disease stage.
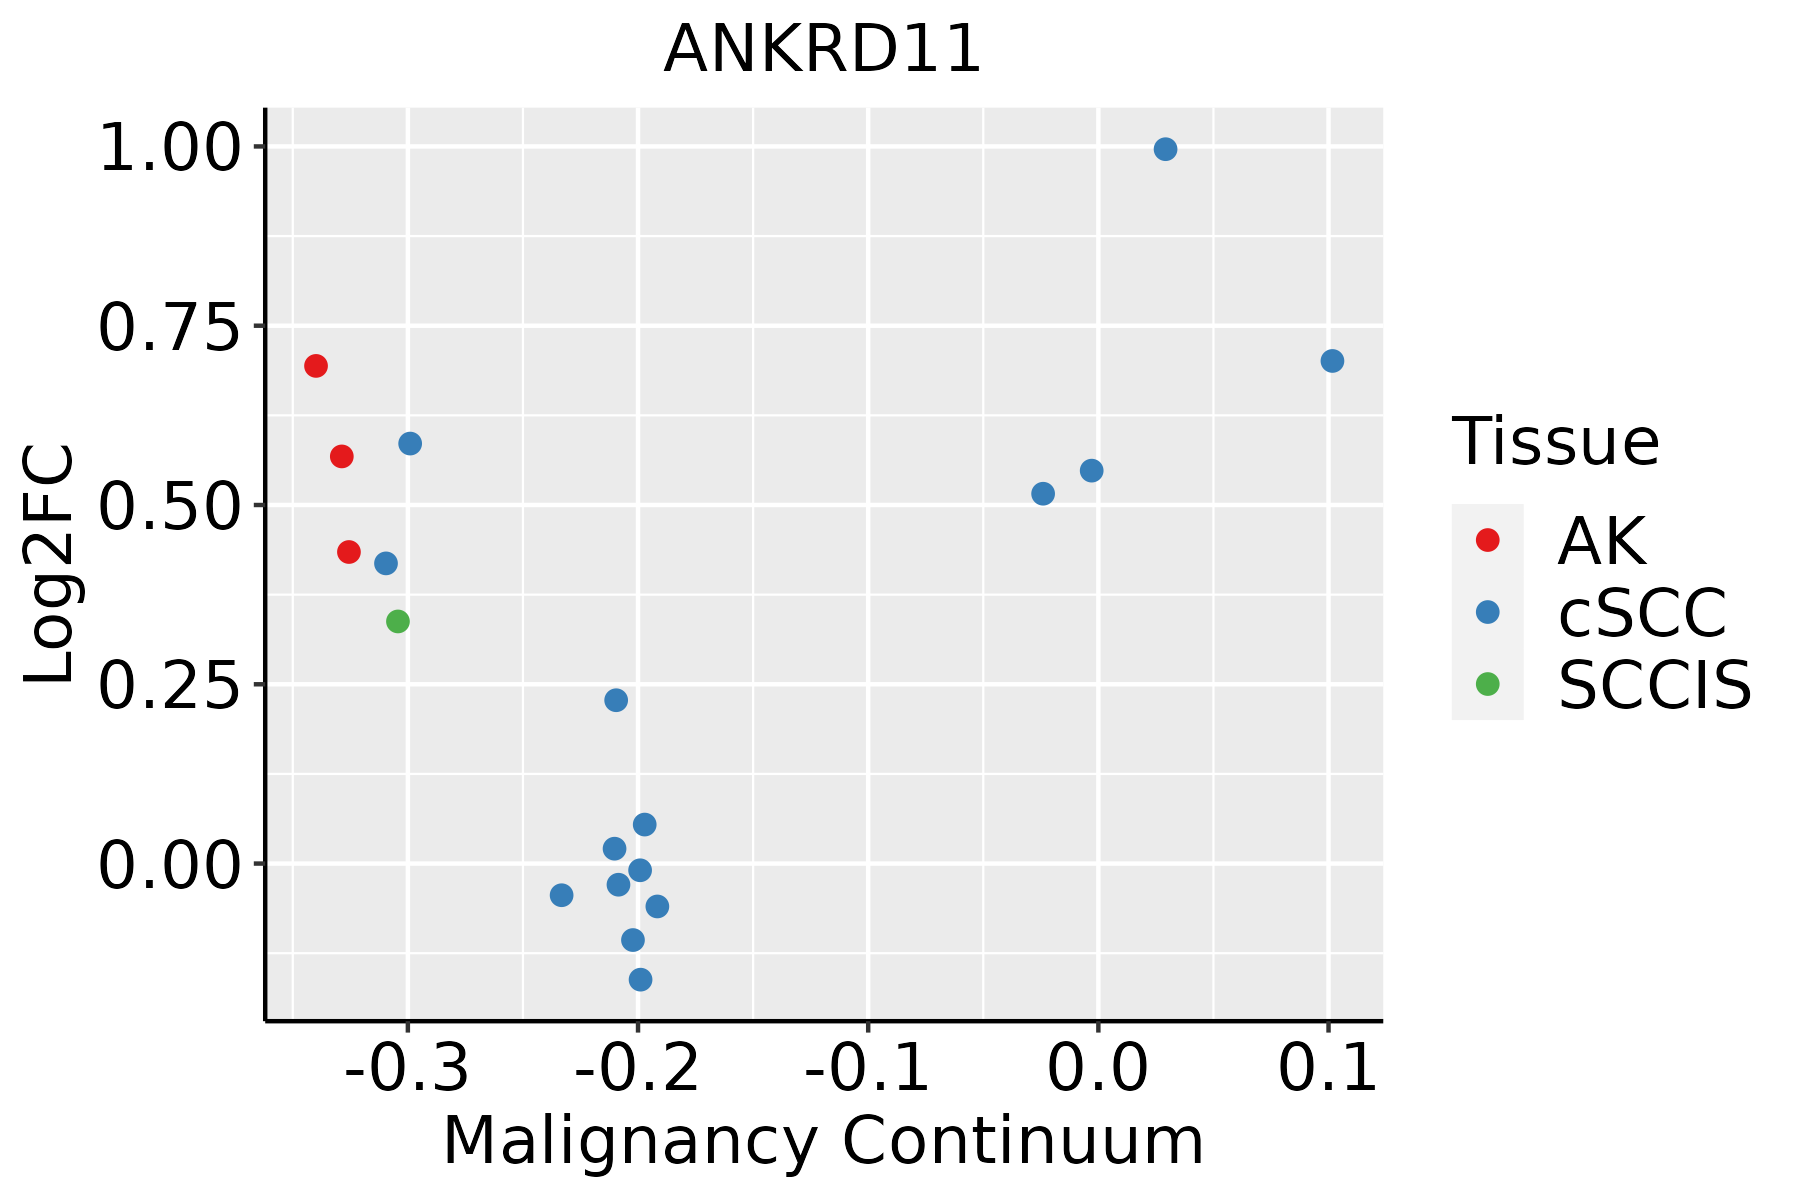
AK: Actinic keratosis
cSCC: Cutaneous squamous cell carcinoma
SCCIS:squamous cell carcinoma in situ
ThyroidThe image shows the transcriptomic changes along malignancy continuum.log2FC in expression of this searched gene in stem-like cells from each diseased tissue sample relative to stem-like cells in normal samples in each tissue plotted against the malignancy continuum. Samples are colored based on if they are from different disease stage.
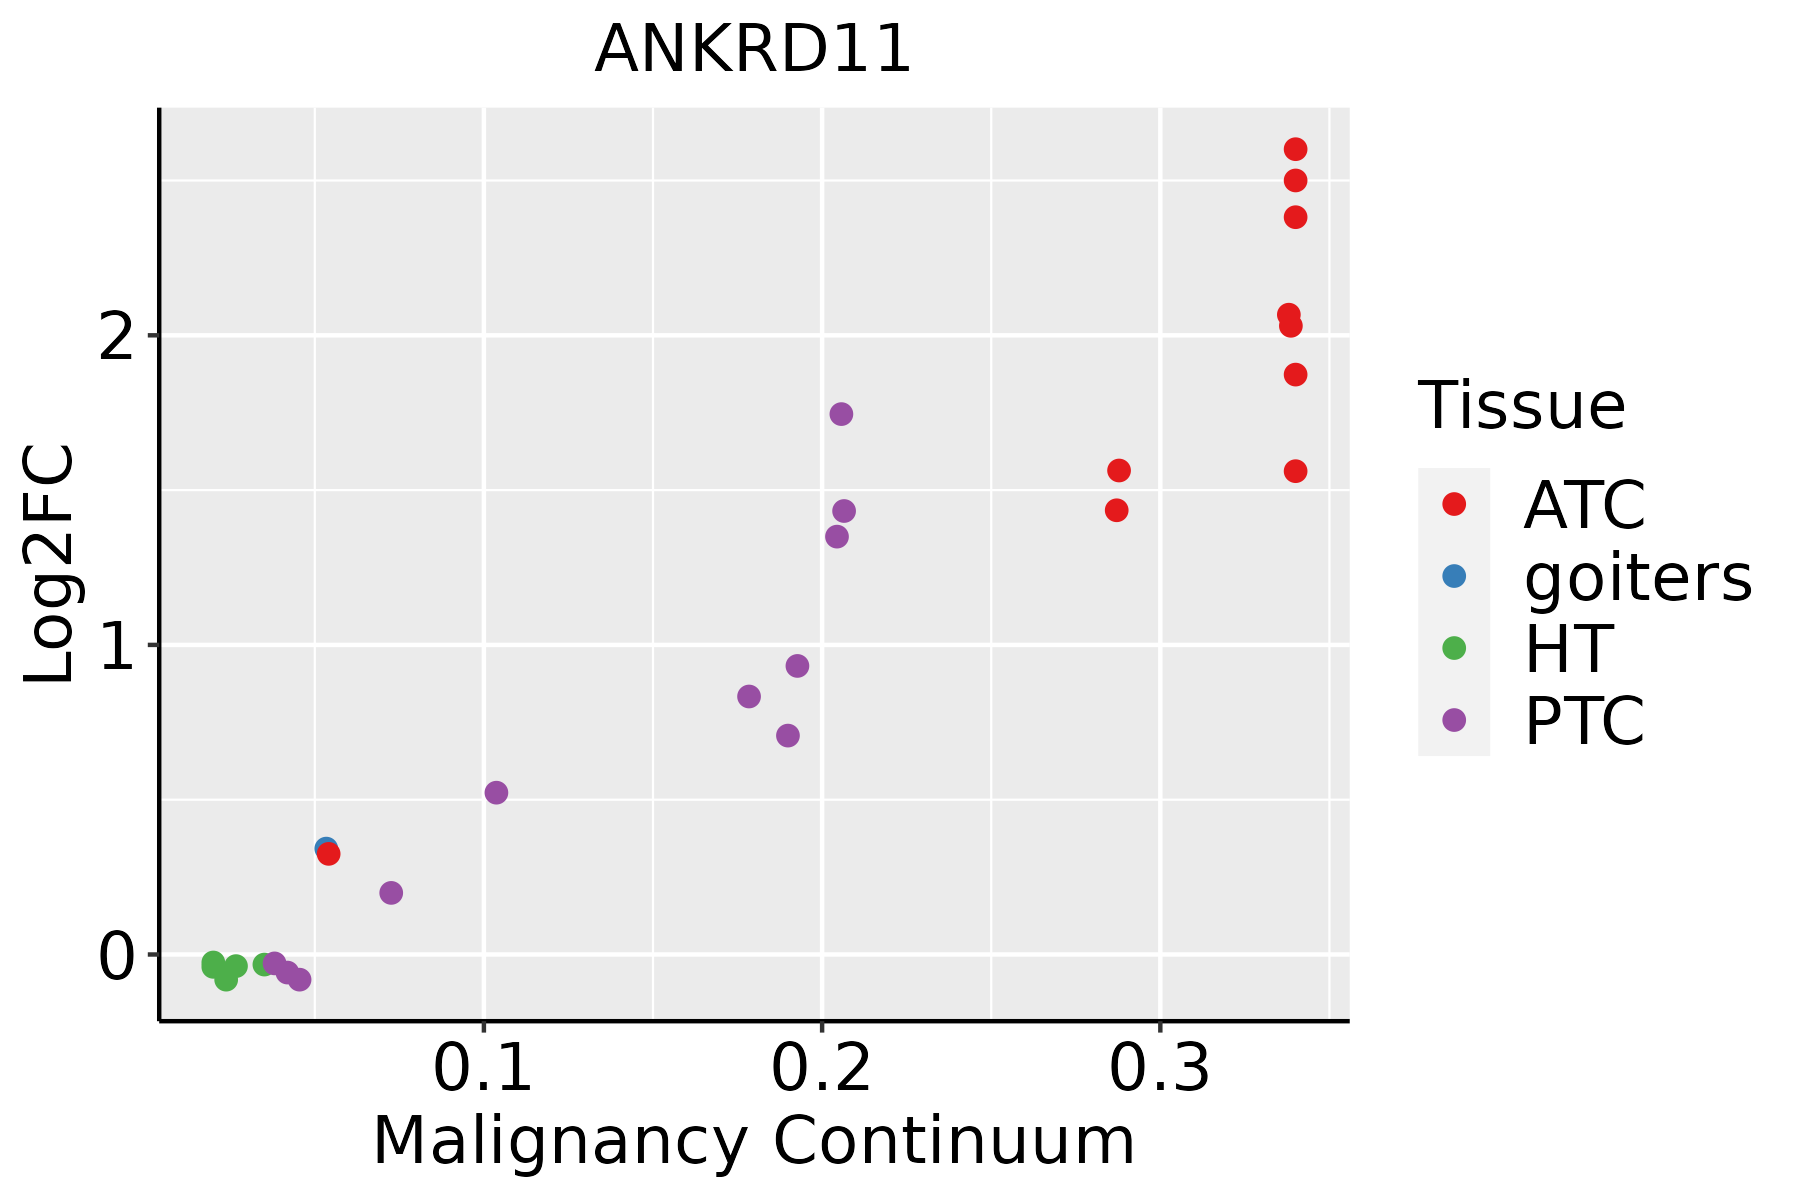
ATC: Anaplastic thyroid cancer
HT: Hashimoto's thyroiditis
PTC: Papillary thyroid cancer
∗log2FC in expression of this searched gene in stem-like cells from each diseased tissue sample relative to stem-like cells in normal samples in each tissue plotted against the malignancy continuum. Samples are colored based on if they are from different disease stage.

Top

Malignant transformation related pathway analysis

check buttonFind out the enriched GO biological processes and KEGG pathways involved in transition from healthy to precancer to cancer
check button Figure of enriched GO biological processes.
TissueDisease StageEnriched GO biological Processes
ColorectumADGO analysis - Figure of enriched GO biological processes: Top 15 enriched GO BP terms are showed in the bar plot of each disease state in each tissue. Each row represents a significant GO biological process which is colored according to the -log10(p.adjust).
ColorectumSERGO analysis - Figure of enriched GO biological processes: Top 15 enriched GO BP terms are showed in the bar plot of each disease state in each tissue. Each row represents a significant GO biological process which is colored according to the -log10(p.adjust).
ColorectumMSSGO analysis - Figure of enriched GO biological processes: Top 15 enriched GO BP terms are showed in the bar plot of each disease state in each tissue. Each row represents a significant GO biological process which is colored according to the -log10(p.adjust).
ColorectumMSI-HGO analysis - Figure of enriched GO biological processes: Top 15 enriched GO BP terms are showed in the bar plot of each disease state in each tissue. Each row represents a significant GO biological process which is colored according to the -log10(p.adjust).
ColorectumFAPGO analysis - Figure of enriched GO biological processes: Top 15 enriched GO BP terms are showed in the bar plot of each disease state in each tissue. Each row represents a significant GO biological process which is colored according to the -log10(p.adjust).
∗Top 15 enriched GO BP terms are showed in the bar plot of each disease state in each tissue. Each row represents a significant GO biological process which is colored according to the -log10(p.adjust).
Page: 1 2 3 4 5 6 7 8 9 

check button Enriched GO biological processes.
GO IDTissueDisease StageDescriptionGene RatioBg Ratiopvaluep.adjustCount
GO:0048705ColorectumCRCskeletal system morphogenesis37/2078220/187236.58e-034.71e-0237
GO:00603242EsophagusESCCface development34/855244/187231.90e-051.67e-0434
GO:00101711EsophagusESCCbody morphogenesis30/855243/187231.21e-035.88e-0330
GO:00603253EsophagusESCCface morphogenesis21/855228/187231.57e-037.33e-0321
GO:00487052EsophagusESCCskeletal system morphogenesis120/8552220/187234.90e-031.89e-02120
GO:00603232EsophagusESCChead morphogenesis22/855232/187237.12e-032.58e-0222
GO:0060325LiverNAFLDface morphogenesis8/188228/187235.07e-033.96e-028
GO:0060324Oral cavityOSCCface development28/730544/187238.15e-044.35e-0328
GO:00603252Oral cavityOSCCface morphogenesis18/730528/187235.96e-032.27e-0218
GO:0060323Oral cavityOSCChead morphogenesis19/730532/187231.56e-025.00e-0219
GO:00603241Oral cavityNEOLPface development16/200544/187236.27e-061.26e-0416
GO:00603231Oral cavityNEOLPhead morphogenesis12/200532/187236.38e-058.40e-0412
GO:00603251Oral cavityNEOLPface morphogenesis11/200528/187237.84e-051.00e-0311
GO:0010171Oral cavityNEOLPbody morphogenesis14/200543/187239.66e-051.18e-0314
GO:00487051Oral cavityNEOLPskeletal system morphogenesis36/2005220/187236.47e-033.33e-0236
GO:00603254SkinAKface morphogenesis10/191028/187232.78e-042.94e-0310
GO:00101712SkinAKbody morphogenesis12/191043/187239.25e-047.53e-0312
GO:00603233SkinAKhead morphogenesis10/191032/187239.35e-047.56e-0310
GO:00603243SkinAKface development12/191044/187231.16e-038.88e-0312
GO:00603244ThyroidPTCface development24/596844/187231.52e-038.49e-0324
Page: 1 2 

check button Enriched KEGG pathways.
Pathway IDTissueDisease StageDescriptionGene RatioBg Ratiopvaluep.adjustqvalueCount
Page: 1 

Top

Cell-cell communication analysis

check buttonIdentification of potential cell-cell interactions between two cell types and their ligand-receptor pairs for different disease states
LigandReceptorLRpairPathwayTissueDisease Stage
Page: 1 

Top

Single-cell gene regulatory network inference analysis

check buttonFind out the significant the regulons (TFs) and the target genes of each regulon across cell types for different disease states
TFCell TypeTissueDisease StageTarget GeneRSSRegulon Activity
∗The dot plots of a searched regulon are shown for all cell subpopulations in each disease state of each tissue based on the regulon specific score inferred using pySCENIC and by calculating the average expression.
Page: 1 

Top

Somatic mutation of malignant transformation related genes

check buttonAnnotation of somatic variants for genes involved in malignant transformation
Hugo SymbolVariant ClassVariant ClassificationdbSNP RSHGVScHGVSpHGVSp ShortSWISSPROTBIOTYPESIFTPolyPhenTumor Sample BarcodeTissueHistologySexAgeStageTherapy TypesDrugsOutcome
ANKRD11SNVMissense_Mutationc.4129N>Tp.Gly1377Cysp.G1377CQ6UB99protein_codingdeleterious(0.01)benign(0.43)TCGA-A2-A04P-01Breastbreast invasive carcinomaFemale<65III/IVChemotherapytaxolPD
ANKRD11SNVMissense_Mutationc.3844N>Ap.Glu1282Lysp.E1282KQ6UB99protein_codingdeleterious_low_confidence(0)possibly_damaging(0.906)TCGA-A2-A0SX-01Breastbreast invasive carcinomaFemale<65I/IIChemotherapyadriamycinPD
ANKRD11SNVMissense_Mutationc.907G>Ap.Glu303Lysp.E303KQ6UB99protein_codingdeleterious(0)probably_damaging(0.965)TCGA-A7-A0CE-01Breastbreast invasive carcinomaFemale<65I/IIChemotherapyadriamycinSD
ANKRD11SNVMissense_Mutationnovelc.1042N>Ap.Glu348Lysp.E348KQ6UB99protein_codingdeleterious(0.01)probably_damaging(0.965)TCGA-A7-A5ZW-01Breastbreast invasive carcinomaFemale<65I/IIChemotherapycyclophosphamideCR
ANKRD11SNVMissense_Mutationc.5149N>Ap.Glu1717Lysp.E1717KQ6UB99protein_codingdeleterious(0)probably_damaging(0.991)TCGA-AC-A23H-01Breastbreast invasive carcinomaFemale>=65I/IIUnknownUnknownPD
ANKRD11SNVMissense_Mutationc.4737N>Ap.Met1579Ilep.M1579IQ6UB99protein_codingdeleterious(0)benign(0.041)TCGA-AC-A23H-01Breastbreast invasive carcinomaFemale>=65I/IIUnknownUnknownPD
ANKRD11SNVMissense_Mutationc.461N>Tp.Ala154Valp.A154VQ6UB99protein_codingdeleterious(0)probably_damaging(0.995)TCGA-AC-A23H-01Breastbreast invasive carcinomaFemale>=65I/IIUnknownUnknownPD
ANKRD11SNVMissense_Mutationc.1571N>Tp.Ser524Leup.S524LQ6UB99protein_codingdeleterious(0.01)probably_damaging(0.945)TCGA-AN-A0AK-01Breastbreast invasive carcinomaFemale>=65I/IIUnknownUnknownSD
ANKRD11SNVMissense_Mutationc.2150N>Tp.Ser717Leup.S717LQ6UB99protein_codingtolerated(0.06)benign(0.035)TCGA-AO-A1KS-01Breastbreast invasive carcinomaFemale>=65I/IIHormone TherapyarimidexSD
ANKRD11SNVMissense_Mutationc.3172N>Cp.Glu1058Glnp.E1058QQ6UB99protein_codingdeleterious_low_confidence(0)possibly_damaging(0.69)TCGA-AR-A250-01Breastbreast invasive carcinomaFemale<65I/IIChemotherapydoxorubicinSD
Page: 1 2 3 4 5 6 7 8 9 10 11 12 13 14 15 16 17 18 19 20 21 22 23 24 25 26 27 

Top

Related drugs of malignant transformation related genes

check buttonIdentification of chemicals and drugs interact with genes involved in malignant transfromation
(DGIdb 4.0)
Entrez IDSymbolCategoryInteraction TypesDrug Claim NameDrug NamePMIDs
Page: 1