| Entrez ID | Symbol | Replicates | Species | Organ | Tissue | Adj P-value | Log2FC | Malignancy |
| 23036 | ZNF292 | 052097_1595-all-cells | Human | Prostate | BPH | 4.70e-04 | 2.67e-01 | 0.0972 |
| 23036 | ZNF292 | 052099_1652-all-cells | Human | Prostate | BPH | 8.76e-08 | 3.40e-01 | 0.1038 |
| 23036 | ZNF292 | Dong_P1 | Human | Prostate | Tumor | 3.10e-11 | 4.08e-02 | 0.035 |
| 23036 | ZNF292 | Dong_P3 | Human | Prostate | Tumor | 5.10e-12 | 1.97e-01 | 0.0278 |
| 23036 | ZNF292 | Dong_P4 | Human | Prostate | Tumor | 6.60e-07 | 3.21e-01 | 0.0292 |
| 23036 | ZNF292 | Dong_P5 | Human | Prostate | Tumor | 1.68e-19 | 3.91e-02 | 0.053 |
| 23036 | ZNF292 | GSM5353215_PA_AUG_PB_1B_S2 | Human | Prostate | Tumor | 8.16e-08 | 7.91e-01 | 0.1557 |
| 23036 | ZNF292 | GSM5353216_PA_PB1A_Pool_1_3_S50_L002 | Human | Prostate | Tumor | 6.19e-03 | 6.30e-01 | 0.159 |
| 23036 | ZNF292 | GSM5353220_PA_PB1B_Pool_3_S51_L002 | Human | Prostate | Tumor | 2.22e-02 | 4.59e-01 | 0.1531 |
| 23036 | ZNF292 | GSM5353221_PA_PB2A_Pool_1_3_S25_L001 | Human | Prostate | Tumor | 4.31e-22 | 8.61e-01 | 0.1633 |
| 23036 | ZNF292 | GSM5353222_PA_PB2B_Pool_1_3_S52_L002 | Human | Prostate | Tumor | 4.03e-19 | 7.76e-01 | 0.1608 |
| 23036 | ZNF292 | GSM5353223_PA_PB2B_Pool_2_S26_L001 | Human | Prostate | Tumor | 3.09e-07 | 5.86e-01 | 0.1604 |
| 23036 | ZNF292 | GSM5353224_PA_PR5186_Pool_1_2_3_S27_L001 | Human | Prostate | Tumor | 3.19e-14 | 7.85e-01 | 0.1621 |
| 23036 | ZNF292 | GSM5353225_PA_PR5196-1_Pool_1_2_3_S53_L002 | Human | Prostate | Tumor | 3.85e-11 | 8.35e-01 | 0.1619 |
| 23036 | ZNF292 | GSM5353227_PA_PR5199-193K_Pool_1_2_3_S55_L002 | Human | Prostate | Tumor | 3.89e-16 | 8.18e-01 | 0.1602 |
| 23036 | ZNF292 | GSM5353228_PA_PR5199-640K_Pool_1_3_S108_L004 | Human | Prostate | Tumor | 5.37e-08 | 8.98e-01 | 0.1537 |
| 23036 | ZNF292 | GSM5353236_PA_PR5251_T1_S7_L001 | Human | Prostate | Tumor | 7.24e-05 | 5.46e-01 | 0.1608 |
| 23036 | ZNF292 | GSM5353237_PA_PR5251_T2_S8_L001 | Human | Prostate | Tumor | 6.54e-05 | 7.18e-01 | 0.1622 |
| 23036 | ZNF292 | GSM5353240_PA_PR5254_T1_S15_L001 | Human | Prostate | Tumor | 9.30e-05 | 3.65e-01 | 0.1575 |
| 23036 | ZNF292 | GSM5353243_PA_PR5261_T1_S23_L002 | Human | Prostate | Tumor | 4.53e-08 | 3.65e-01 | 0.1545 |
| Tissue | Expression Dynamics | Abbreviation |
| Cervix | 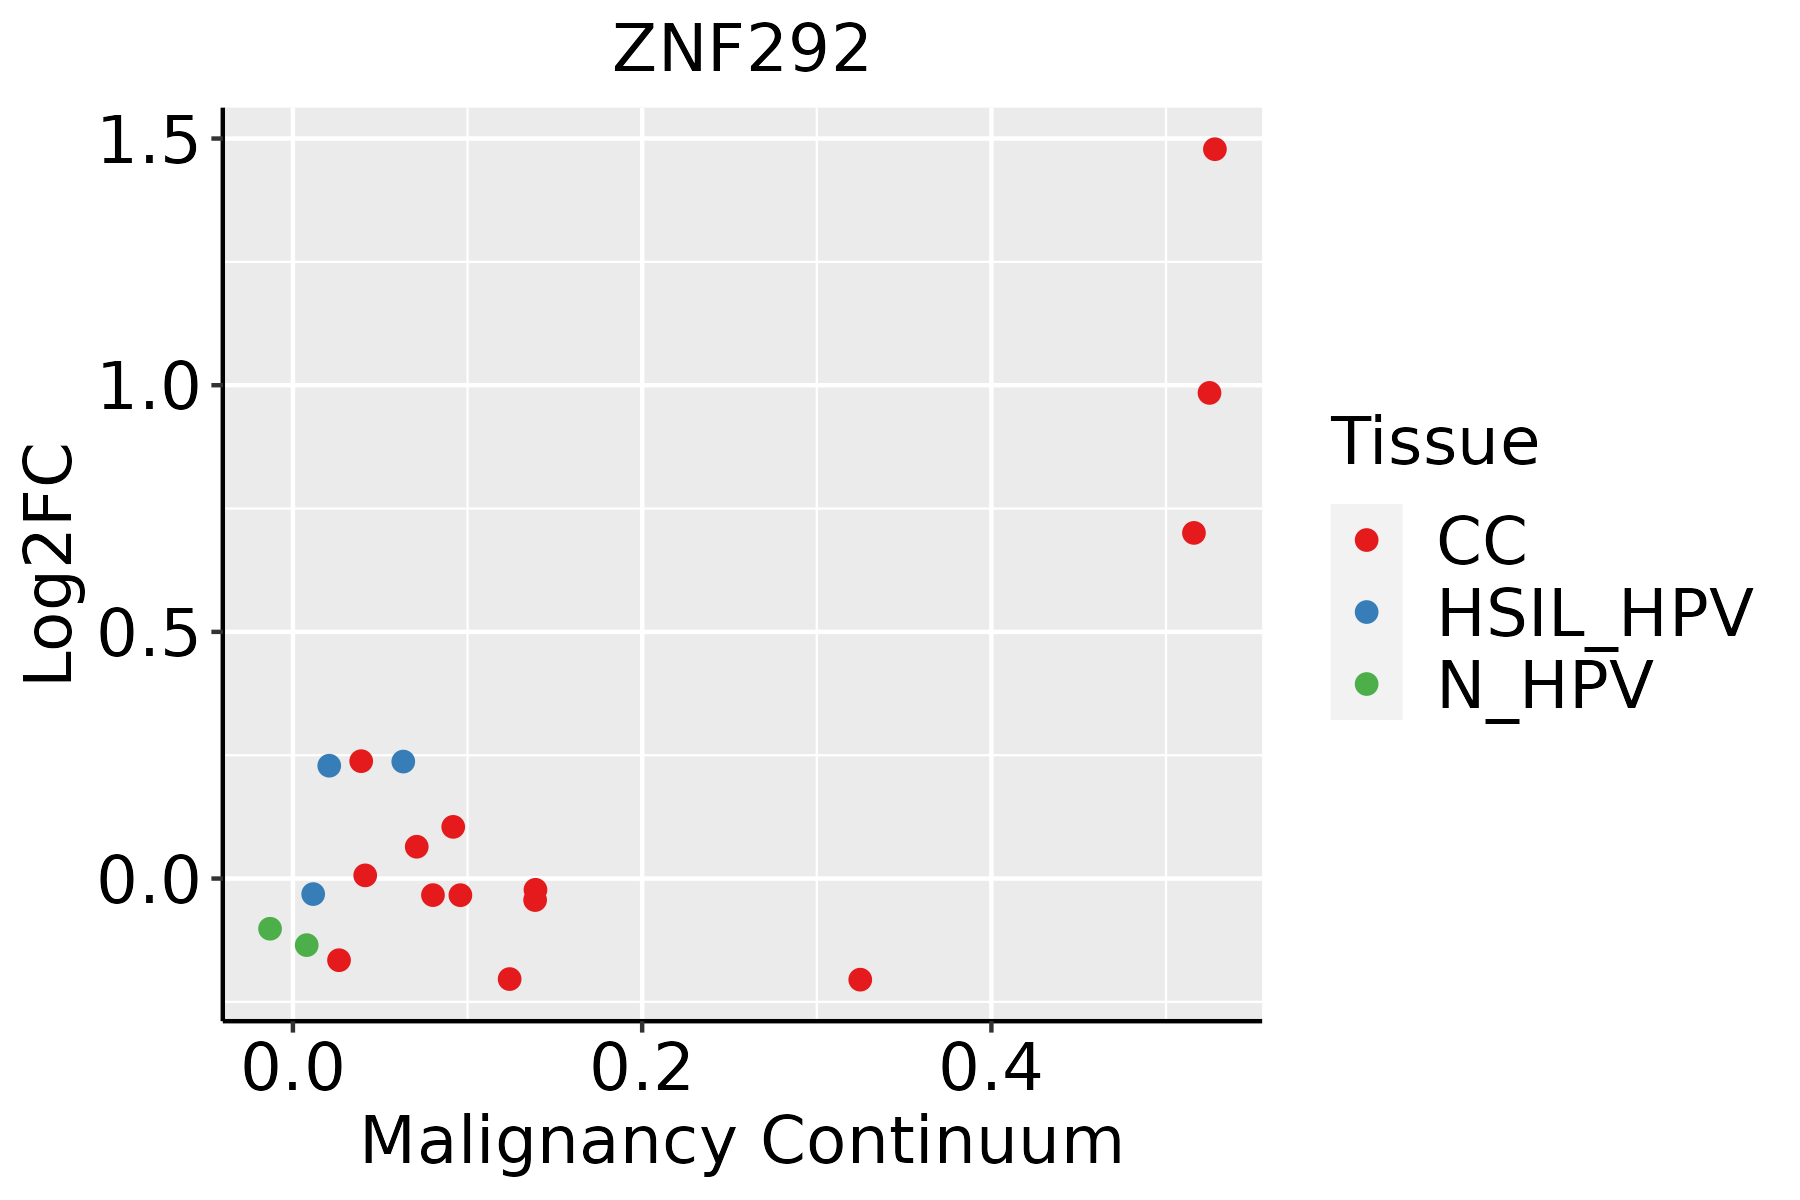 | CC: Cervix cancer |
| HSIL_HPV: HPV-infected high-grade squamous intraepithelial lesions |
| N_HPV: HPV-infected normal cervix |
| Colorectum (GSE201348) |  | FAP: Familial adenomatous polyposis |
| CRC: Colorectal cancer |
| Colorectum (HTA11) |  | AD: Adenomas |
| SER: Sessile serrated lesions |
| MSI-H: Microsatellite-high colorectal cancer |
| MSS: Microsatellite stable colorectal cancer |
| Esophagus |  | ESCC: Esophageal squamous cell carcinoma |
| HGIN: High-grade intraepithelial neoplasias |
| LGIN: Low-grade intraepithelial neoplasias |
| Liver | 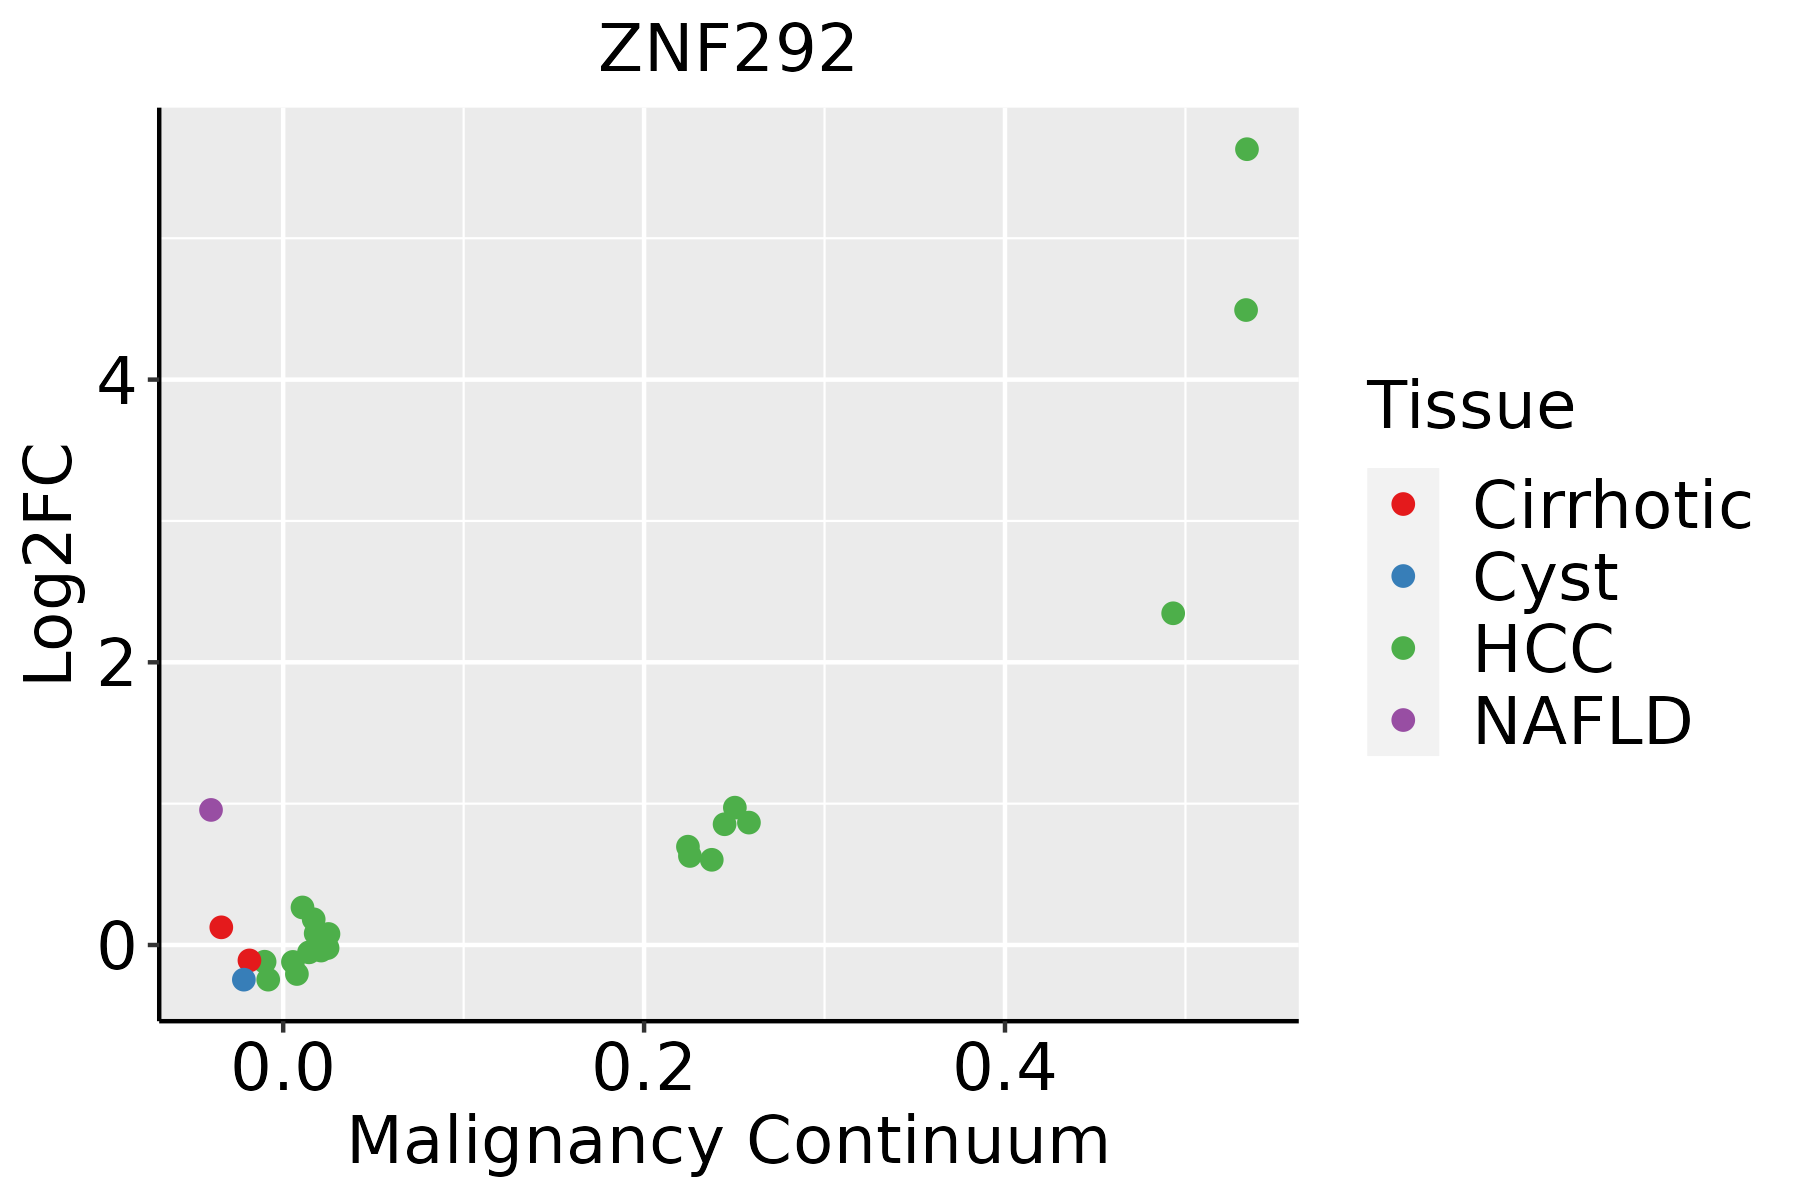 | HCC: Hepatocellular carcinoma |
| NAFLD: Non-alcoholic fatty liver disease |
| Lung |  | AAH: Atypical adenomatous hyperplasia |
| AIS: Adenocarcinoma in situ |
| IAC: Invasive lung adenocarcinoma |
| MIA: Minimally invasive adenocarcinoma |
| Oral Cavity | 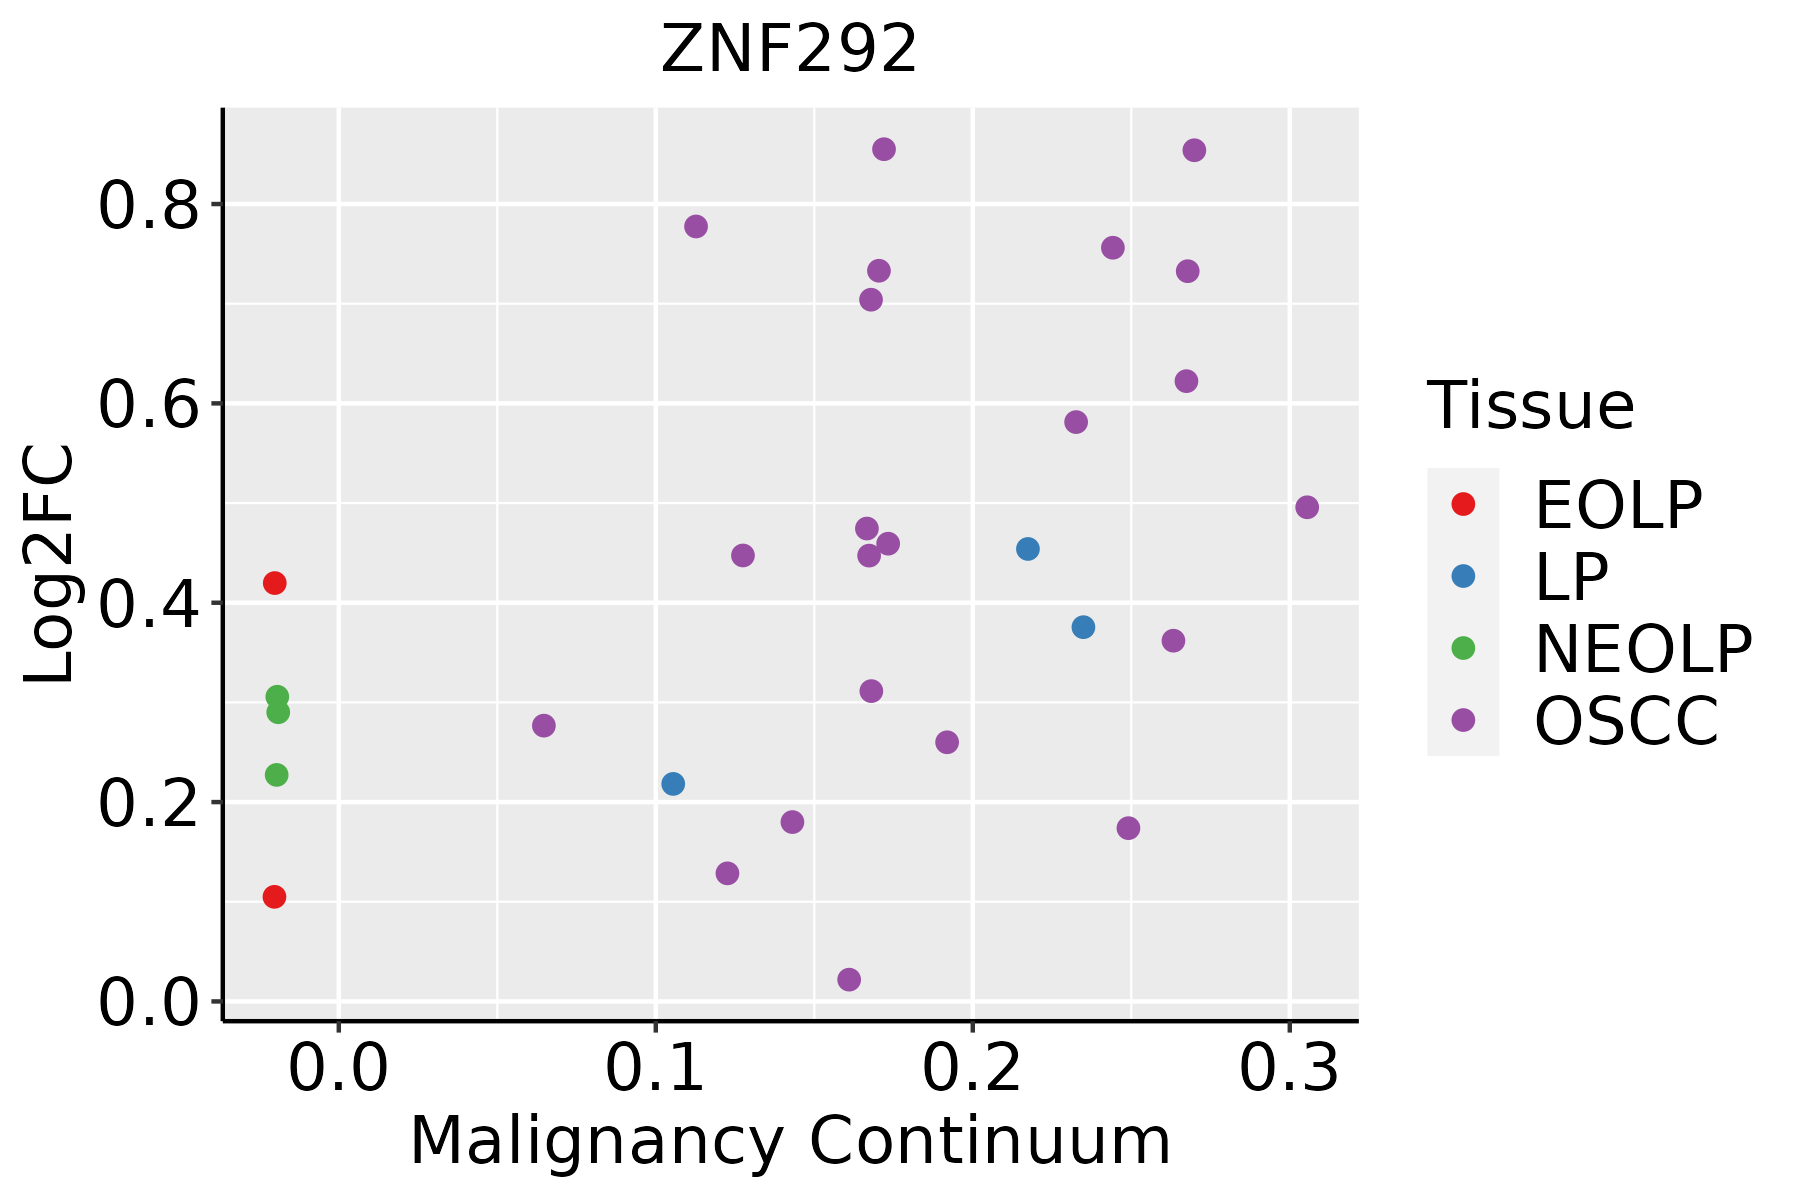 | EOLP: Erosive Oral lichen planus |
| LP: leukoplakia |
| NEOLP: Non-erosive oral lichen planus |
| OSCC: Oral squamous cell carcinoma |
| Prostate | 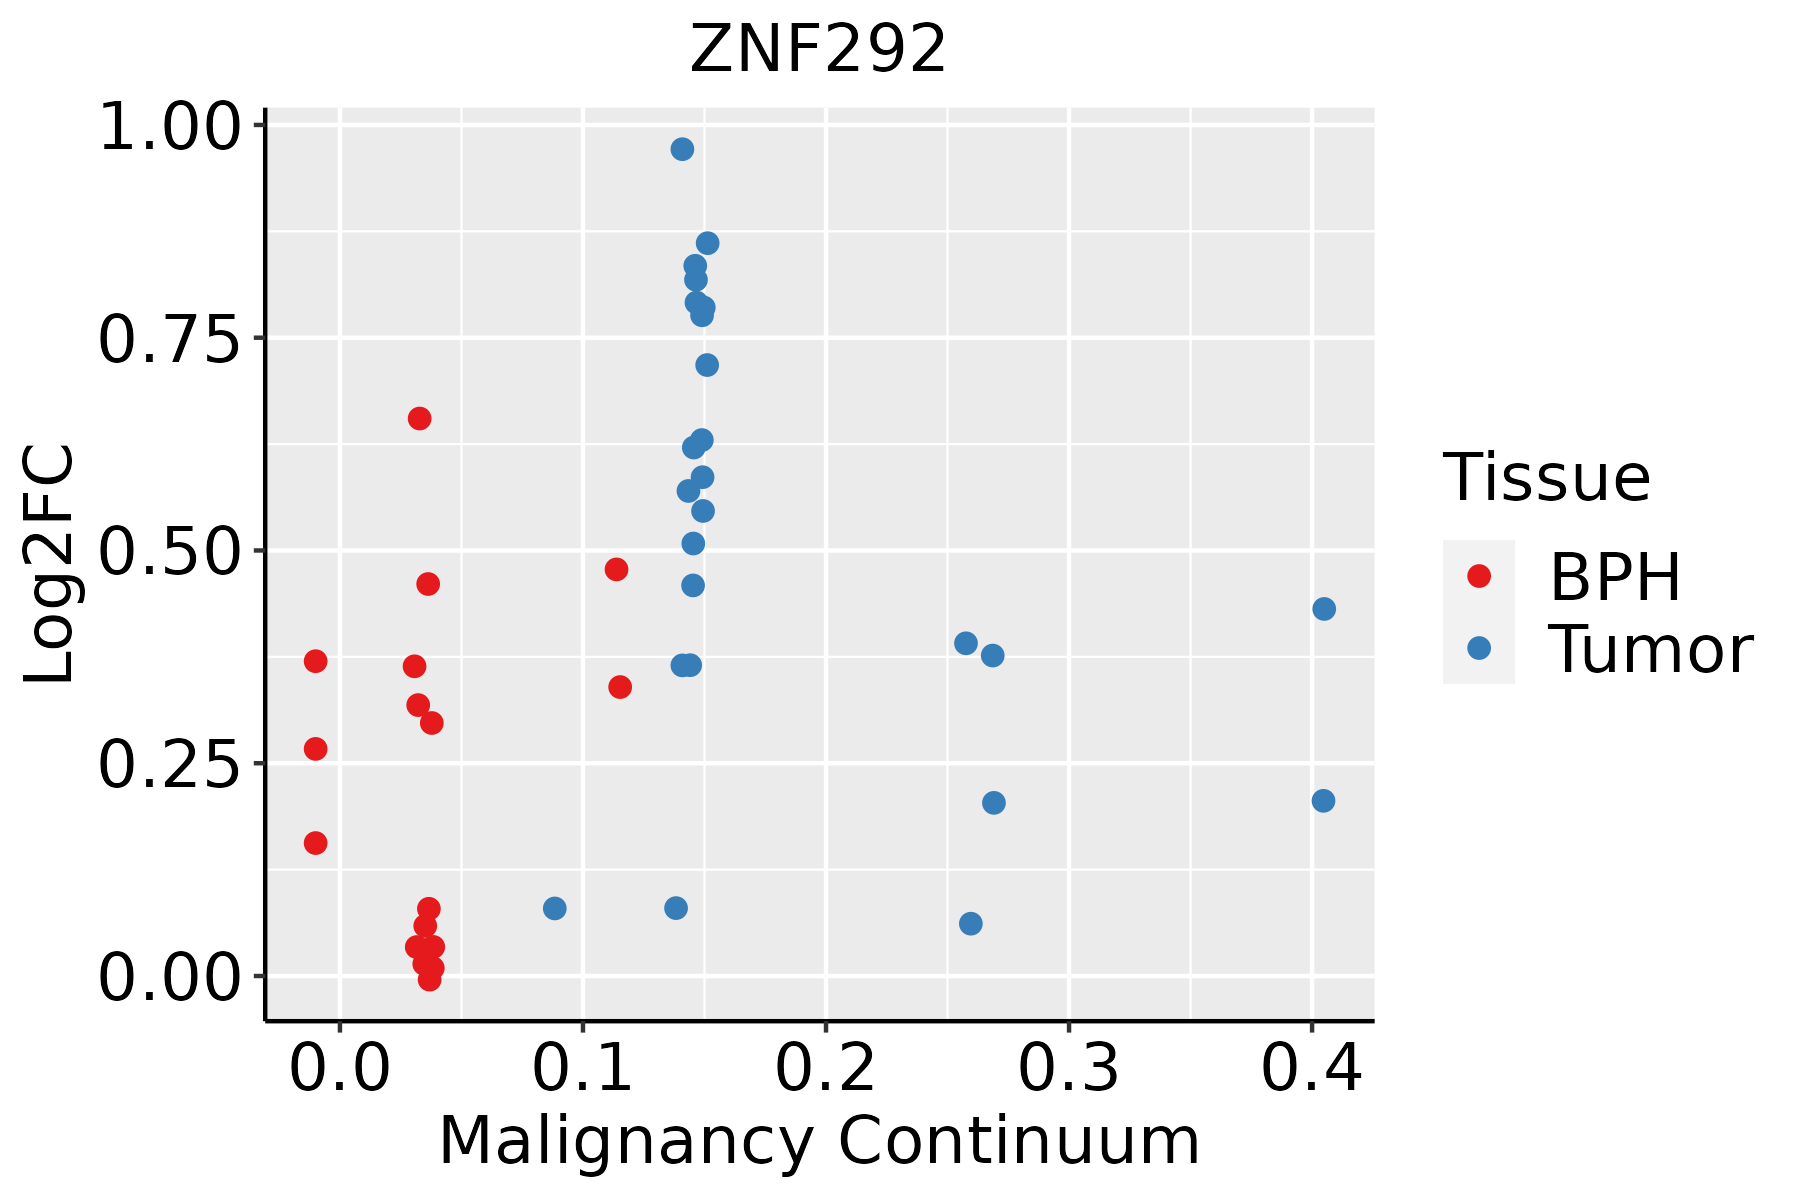 | BPH: Benign Prostatic Hyperplasia |
| Skin | 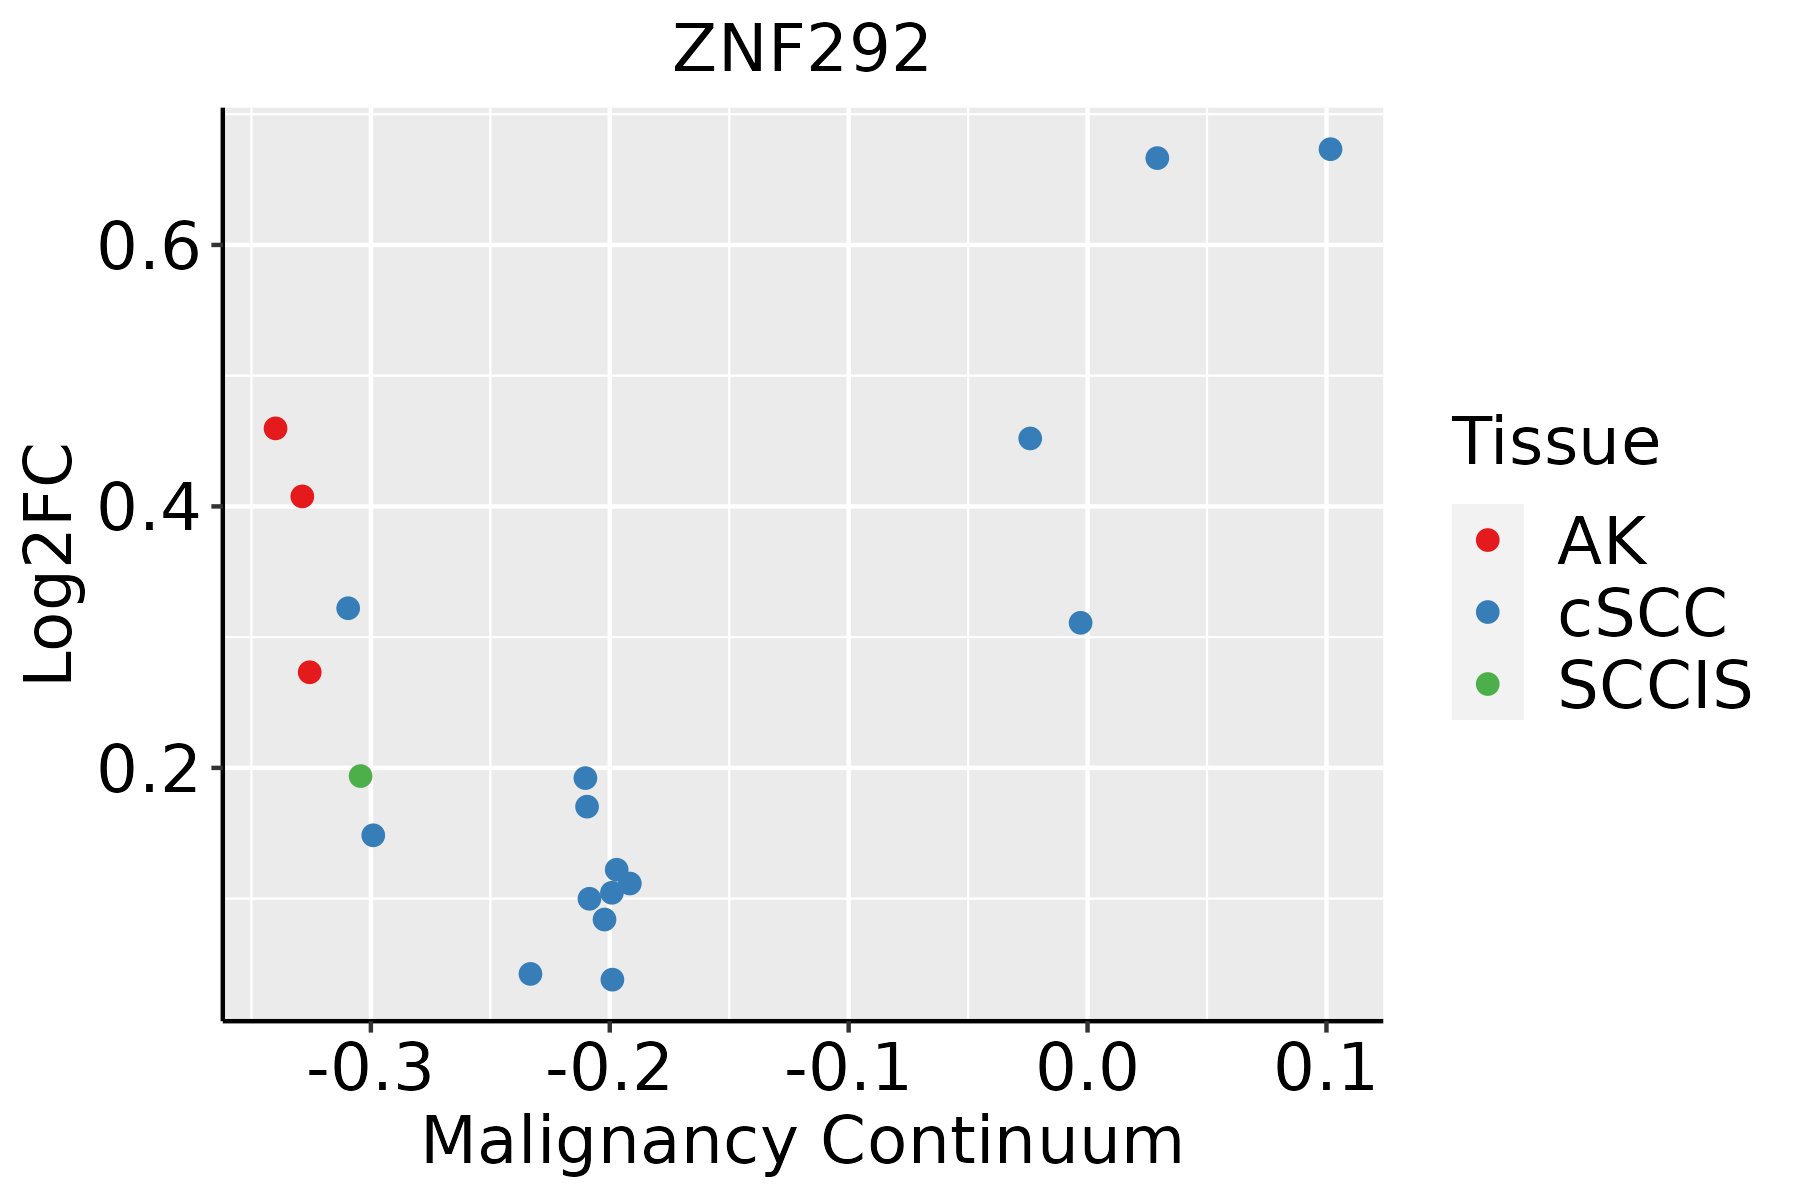 | AK: Actinic keratosis |
| cSCC: Cutaneous squamous cell carcinoma |
| SCCIS:squamous cell carcinoma in situ |
| Thyroid | 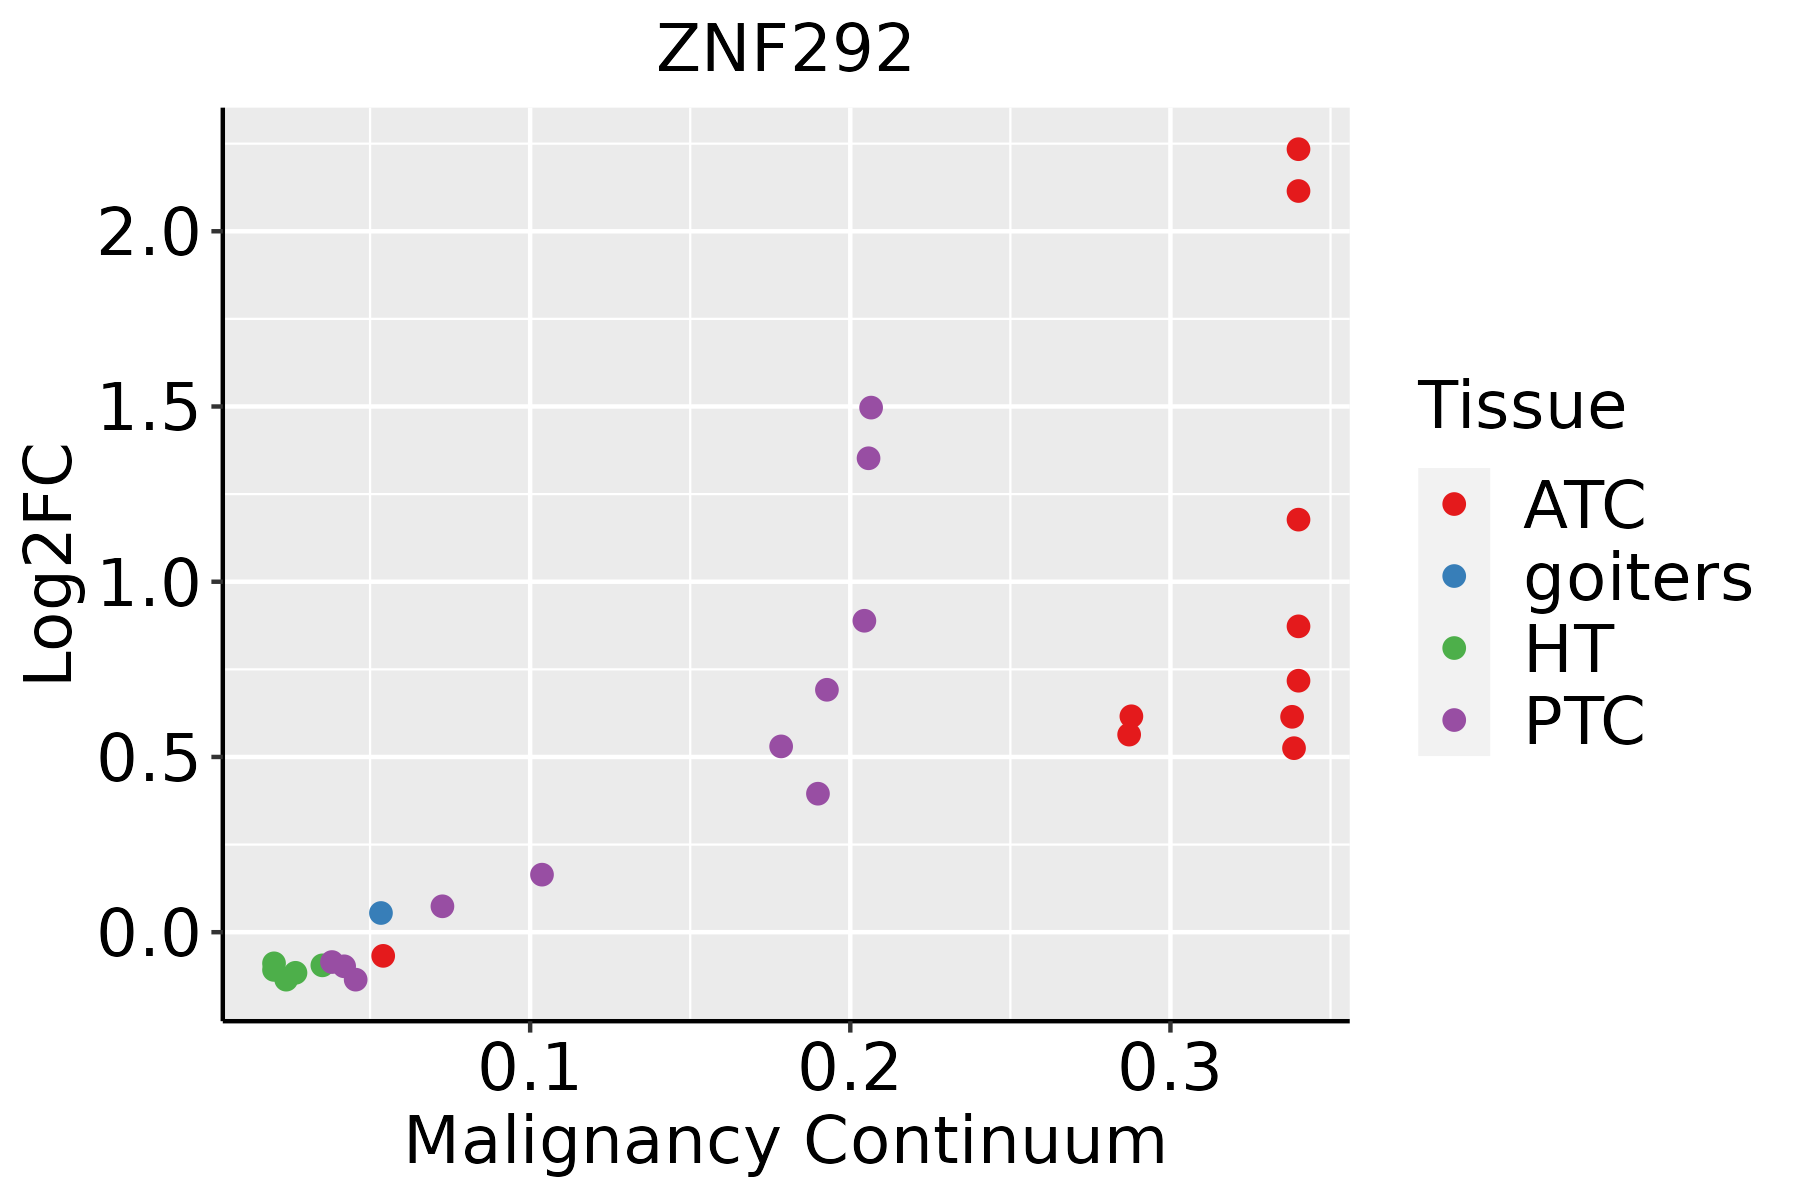 | ATC: Anaplastic thyroid cancer |
| HT: Hashimoto's thyroiditis |
| PTC: Papillary thyroid cancer |
| Hugo Symbol | Variant Class | Variant Classification | dbSNP RS | HGVSc | HGVSp | HGVSp Short | SWISSPROT | BIOTYPE | SIFT | PolyPhen | Tumor Sample Barcode | Tissue | Histology | Sex | Age | Stage | Therapy Types | Drugs | Outcome |
| ZNF292 | SNV | Missense_Mutation | novel | c.6965N>A | p.Arg2322Lys | p.R2322K | O60281 | protein_coding | tolerated(0.37) | benign(0.003) | TCGA-5L-AAT1-01 | Breast | breast invasive carcinoma | Female | <65 | III/IV | Hormone Therapy | letrozol | SD |
| ZNF292 | SNV | Missense_Mutation | novel | c.8085N>T | p.Lys2695Asn | p.K2695N | O60281 | protein_coding | tolerated(0.08) | benign(0.05) | TCGA-A2-A0ER-01 | Breast | breast invasive carcinoma | Female | <65 | I/II | Chemotherapy | cytoxan | SD |
| ZNF292 | SNV | Missense_Mutation | novel | c.4842N>A | p.Asn1614Lys | p.N1614K | O60281 | protein_coding | deleterious_low_confidence(0.01) | benign(0.076) | TCGA-A2-A25C-01 | Breast | breast invasive carcinoma | Female | <65 | I/II | Chemotherapy | taxotere | SD |
| ZNF292 | SNV | Missense_Mutation | | c.1202A>T | p.Asp401Val | p.D401V | O60281 | protein_coding | deleterious(0) | probably_damaging(0.991) | TCGA-A8-A09M-01 | Breast | breast invasive carcinoma | Female | >=65 | III/IV | Chemotherapy | paclitaxel | CR |
| ZNF292 | SNV | Missense_Mutation | | c.3904G>C | p.Glu1302Gln | p.E1302Q | O60281 | protein_coding | tolerated(0.25) | benign(0.261) | TCGA-AC-A23H-01 | Breast | breast invasive carcinoma | Female | >=65 | I/II | Unknown | Unknown | PD |
| ZNF292 | SNV | Missense_Mutation | | c.5485G>A | p.Glu1829Lys | p.E1829K | O60281 | protein_coding | tolerated(0.06) | benign(0.003) | TCGA-AC-A23H-01 | Breast | breast invasive carcinoma | Female | >=65 | I/II | Unknown | Unknown | PD |
| ZNF292 | SNV | Missense_Mutation | novel | c.471G>T | p.Glu157Asp | p.E157D | O60281 | protein_coding | deleterious(0.04) | benign(0.189) | TCGA-AN-A046-01 | Breast | breast invasive carcinoma | Female | >=65 | I/II | Unknown | Unknown | SD |
| ZNF292 | SNV | Missense_Mutation | novel | c.1493C>A | p.Ser498Tyr | p.S498Y | O60281 | protein_coding | deleterious(0.02) | possibly_damaging(0.804) | TCGA-AN-A046-01 | Breast | breast invasive carcinoma | Female | >=65 | I/II | Unknown | Unknown | SD |
| ZNF292 | SNV | Missense_Mutation | novel | c.5817G>T | p.Lys1939Asn | p.K1939N | O60281 | protein_coding | deleterious(0) | probably_damaging(0.994) | TCGA-AN-A046-01 | Breast | breast invasive carcinoma | Female | >=65 | I/II | Unknown | Unknown | SD |
| ZNF292 | SNV | Missense_Mutation | rs756555025 | c.2552N>T | p.Ser851Phe | p.S851F | O60281 | protein_coding | tolerated(0.06) | benign(0.046) | TCGA-AN-A04C-01 | Breast | breast invasive carcinoma | Female | <65 | I/II | Unknown | Unknown | SD |


