
|
|||||
|
 | |
| |
| |
| |
| |
| |
|
Gene: ZFAND3 |
Gene summary for ZFAND3 |
| Gene information | Species | Human | Gene symbol | ZFAND3 | Gene ID | 60685 |
| Gene name | zinc finger AN1-type containing 3 | |
| Gene Alias | TEX27 | |
| Cytomap | 6p21.2 | |
| Gene Type | protein-coding | GO ID | GO:0003674 | UniProtAcc | A0A024RD12 |
Top |
Malignant transformation analysis |
| Identification of the aberrant gene expression in precancerous and cancerous lesions by comparing the gene expression of stem-like cells in diseased tissues with normal stem cells |
| Entrez ID | Symbol | Replicates | Species | Organ | Tissue | Adj P-value | Log2FC | Malignancy |
| 60685 | ZFAND3 | EOLP-1 | Human | Oral cavity | EOLP | 5.38e-50 | 9.92e-01 | -0.0202 |
| 60685 | ZFAND3 | EOLP-2 | Human | Oral cavity | EOLP | 9.51e-16 | 6.76e-01 | -0.0203 |
| 60685 | ZFAND3 | NEOLP-1 | Human | Oral cavity | NEOLP | 1.68e-35 | 9.11e-01 | -0.0194 |
| 60685 | ZFAND3 | NEOLP-2 | Human | Oral cavity | NEOLP | 1.37e-17 | 5.64e-01 | -0.0196 |
| 60685 | ZFAND3 | NEOLP-3 | Human | Oral cavity | NEOLP | 1.31e-24 | 6.27e-01 | -0.0191 |
| 60685 | ZFAND3 | SYSMH1 | Human | Oral cavity | OSCC | 7.15e-10 | 6.14e-02 | 0.1127 |
| 60685 | ZFAND3 | SYSMH3 | Human | Oral cavity | OSCC | 5.98e-09 | 1.93e-01 | 0.2442 |
| 60685 | ZFAND3 | SYSMH4 | Human | Oral cavity | OSCC | 1.21e-04 | -1.50e-01 | 0.1226 |
| 60685 | ZFAND3 | SYSMH5 | Human | Oral cavity | OSCC | 1.23e-03 | 2.53e-02 | 0.0647 |
| 60685 | ZFAND3 | HTA12-15-2 | Human | Pancreas | PDAC | 2.46e-14 | 9.28e-01 | 0.2315 |
| 60685 | ZFAND3 | HTA12-16-5 | Human | Pancreas | PDAC | 2.14e-03 | 4.89e-01 | 0.047 |
| 60685 | ZFAND3 | HTA12-23-1 | Human | Pancreas | PDAC | 1.26e-16 | 1.28e+00 | 0.3405 |
| 60685 | ZFAND3 | HTA12-25-1 | Human | Pancreas | PDAC | 6.22e-23 | 1.30e+00 | 0.313 |
| 60685 | ZFAND3 | HTA12-26-1 | Human | Pancreas | PDAC | 1.37e-40 | 1.40e+00 | 0.3728 |
| 60685 | ZFAND3 | HTA12-29-1 | Human | Pancreas | PDAC | 3.06e-79 | 1.35e+00 | 0.3722 |
| 60685 | ZFAND3 | HTA12-30-1 | Human | Pancreas | PDAC | 1.16e-03 | 1.13e+00 | 0.3671 |
| 60685 | ZFAND3 | HTA12-32-1 | Human | Pancreas | PDAC | 3.87e-07 | 1.26e+00 | 0.3624 |
| 60685 | ZFAND3 | HTA12-9-1 | Human | Pancreas | PDAC | 7.90e-03 | 4.38e-01 | 0.1532 |
| 60685 | ZFAND3 | HTA12-9-2 | Human | Pancreas | PDAC | 2.16e-09 | 6.86e-01 | 0.0835 |
| 60685 | ZFAND3 | HTA12-9-3 | Human | Pancreas | PDAC | 3.20e-02 | 6.69e-01 | 0.2045 |
| Page: 1 2 3 4 5 6 7 8 9 10 11 12 13 |
| Tissue | Expression Dynamics | Abbreviation |
| Cervix | 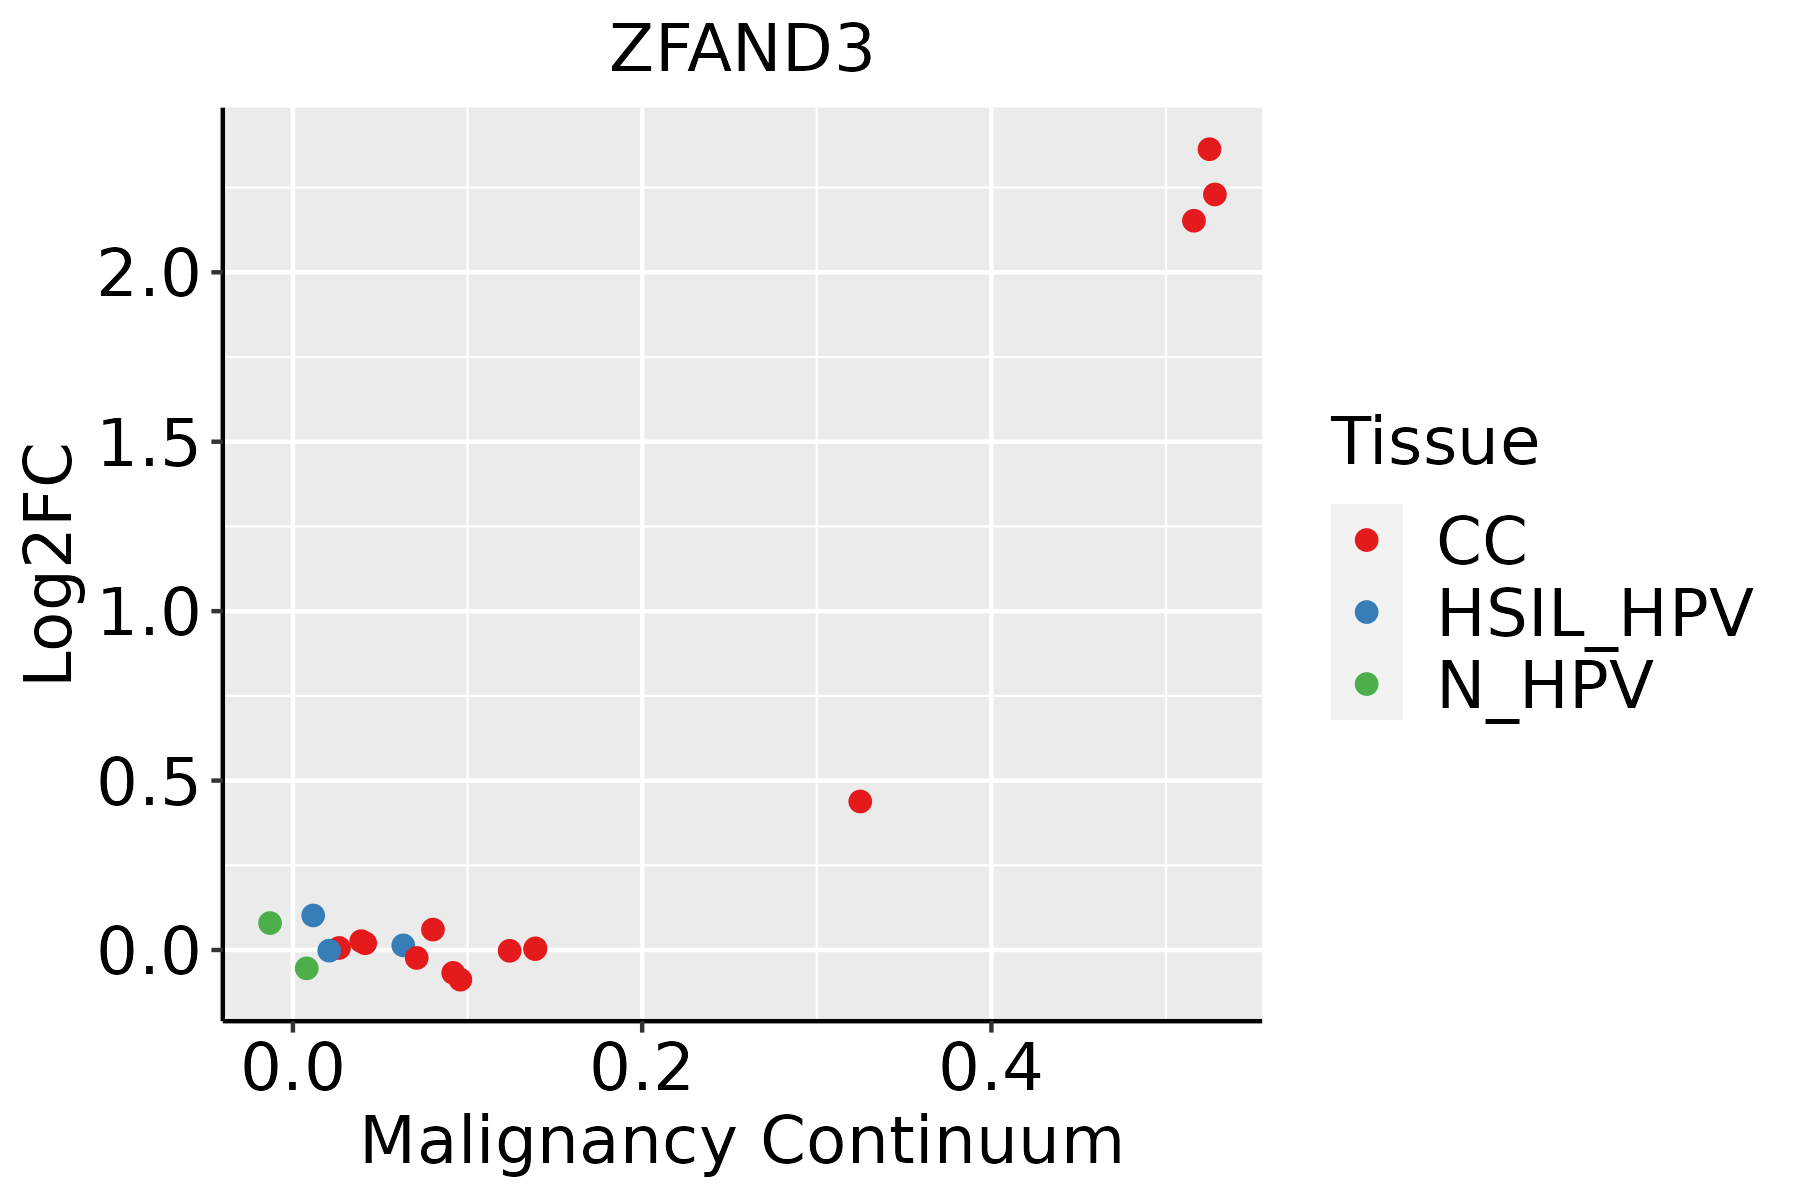 | CC: Cervix cancer |
| HSIL_HPV: HPV-infected high-grade squamous intraepithelial lesions | ||
| N_HPV: HPV-infected normal cervix | ||
| Colorectum (GSE201348) | 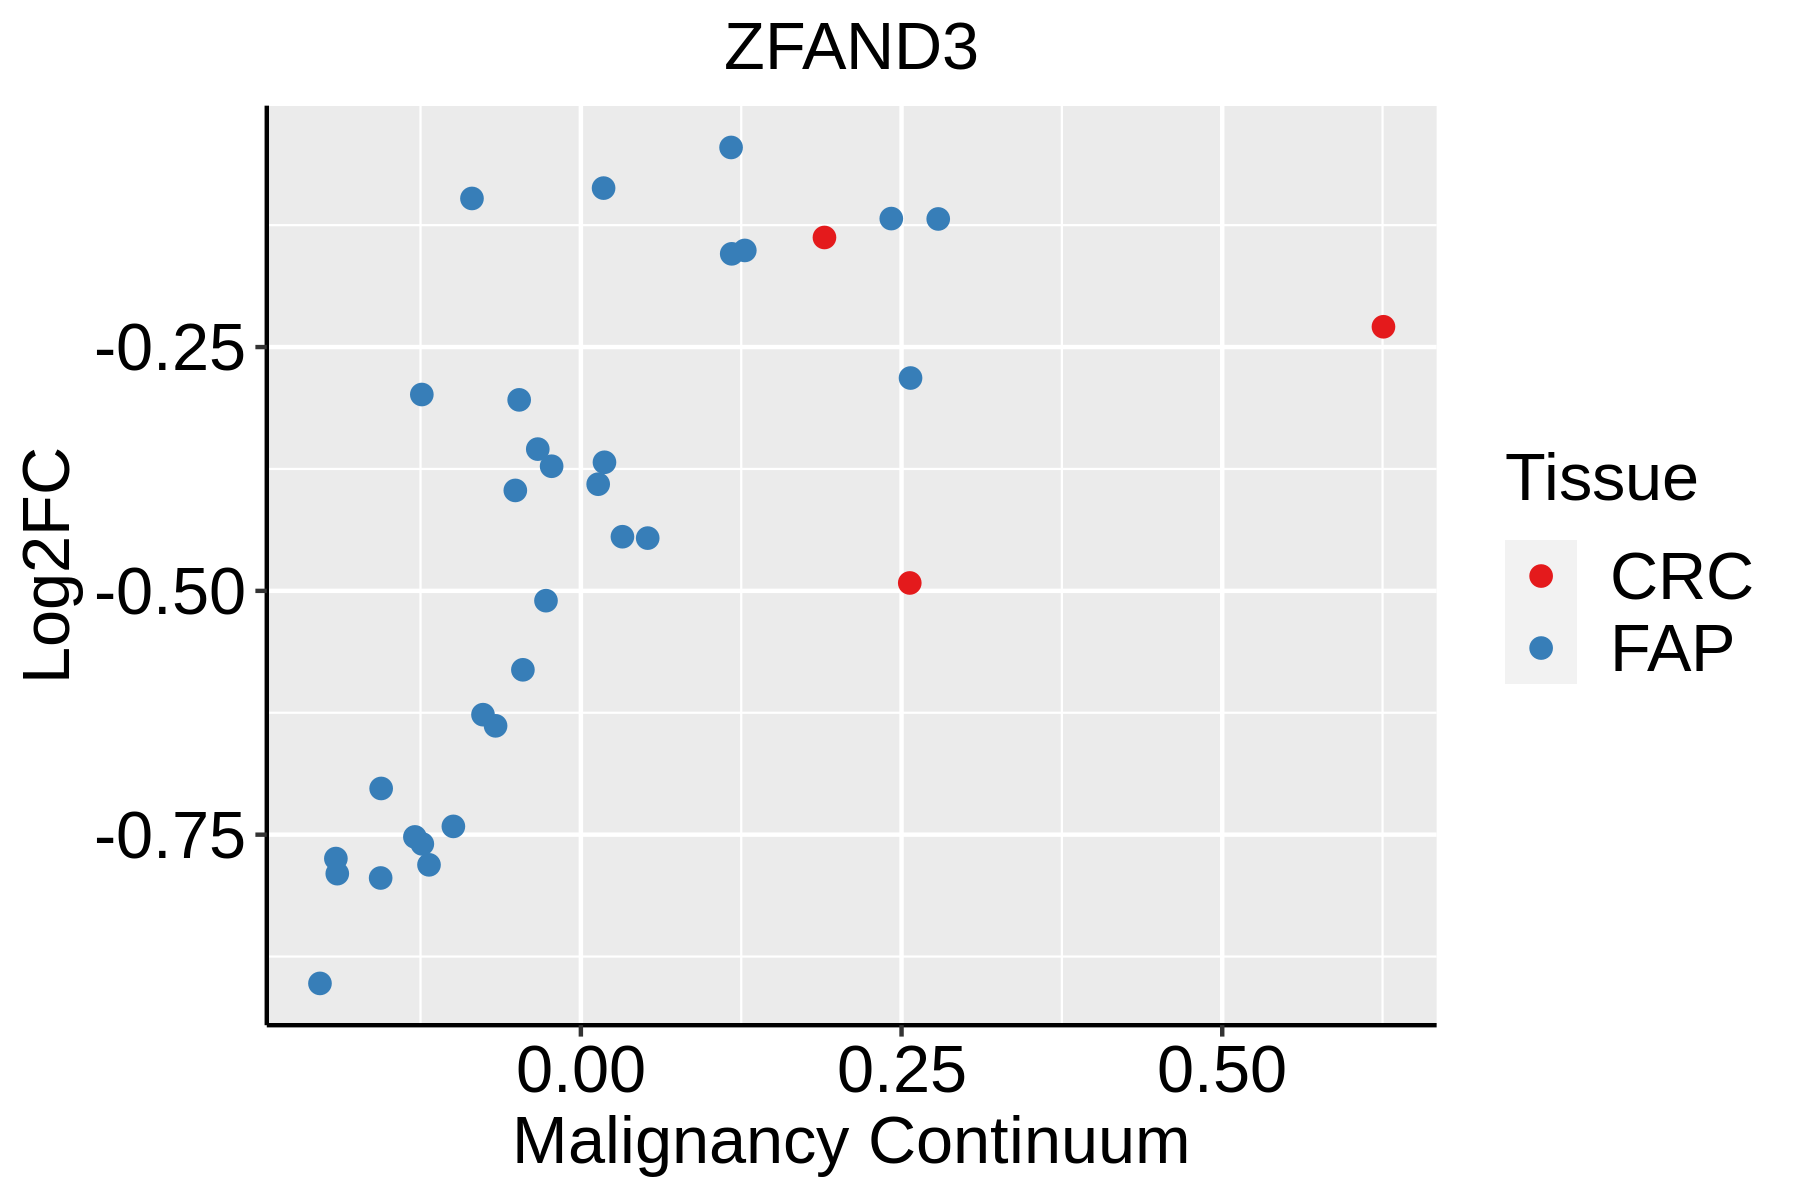 | FAP: Familial adenomatous polyposis |
| CRC: Colorectal cancer | ||
| Colorectum (HTA11) | 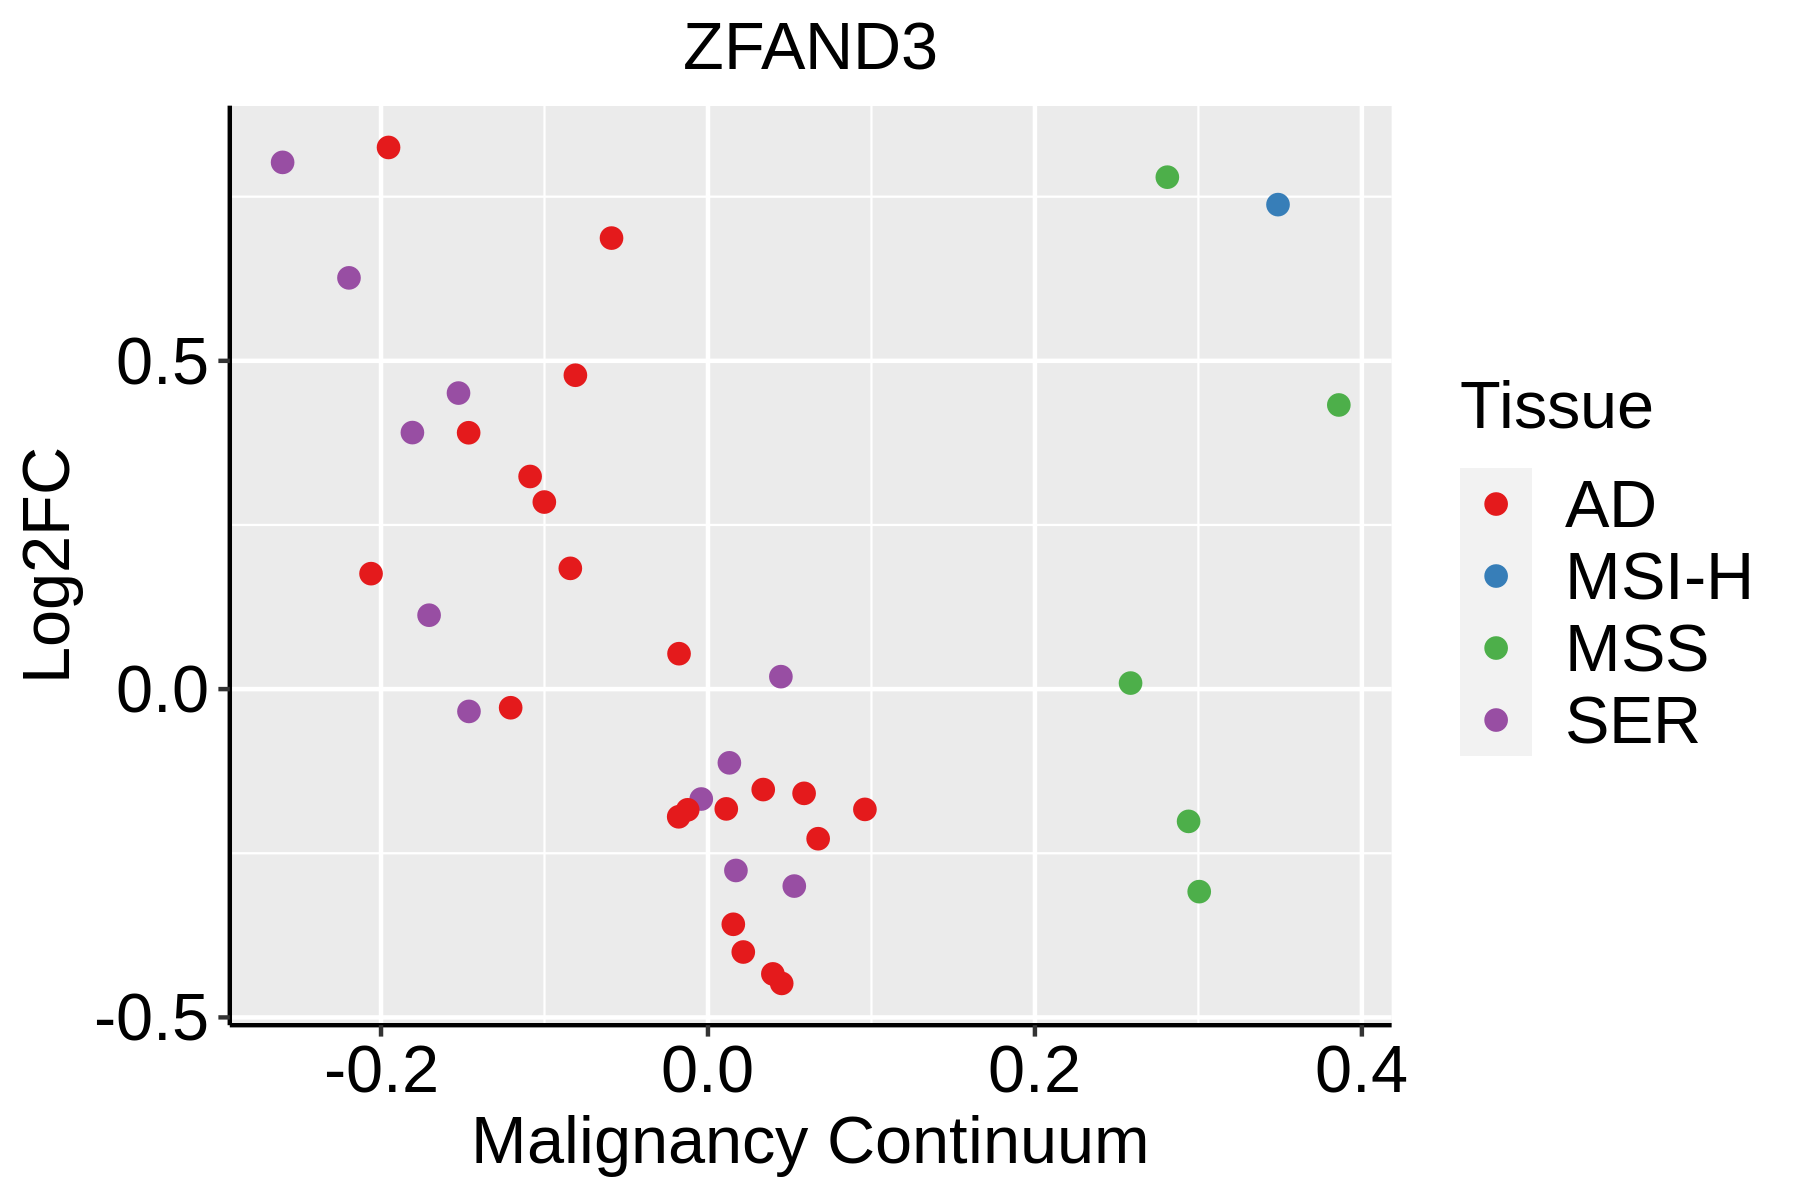 | AD: Adenomas |
| SER: Sessile serrated lesions | ||
| MSI-H: Microsatellite-high colorectal cancer | ||
| MSS: Microsatellite stable colorectal cancer | ||
| Endometrium |  | AEH: Atypical endometrial hyperplasia |
| EEC: Endometrioid Cancer | ||
| Esophagus | 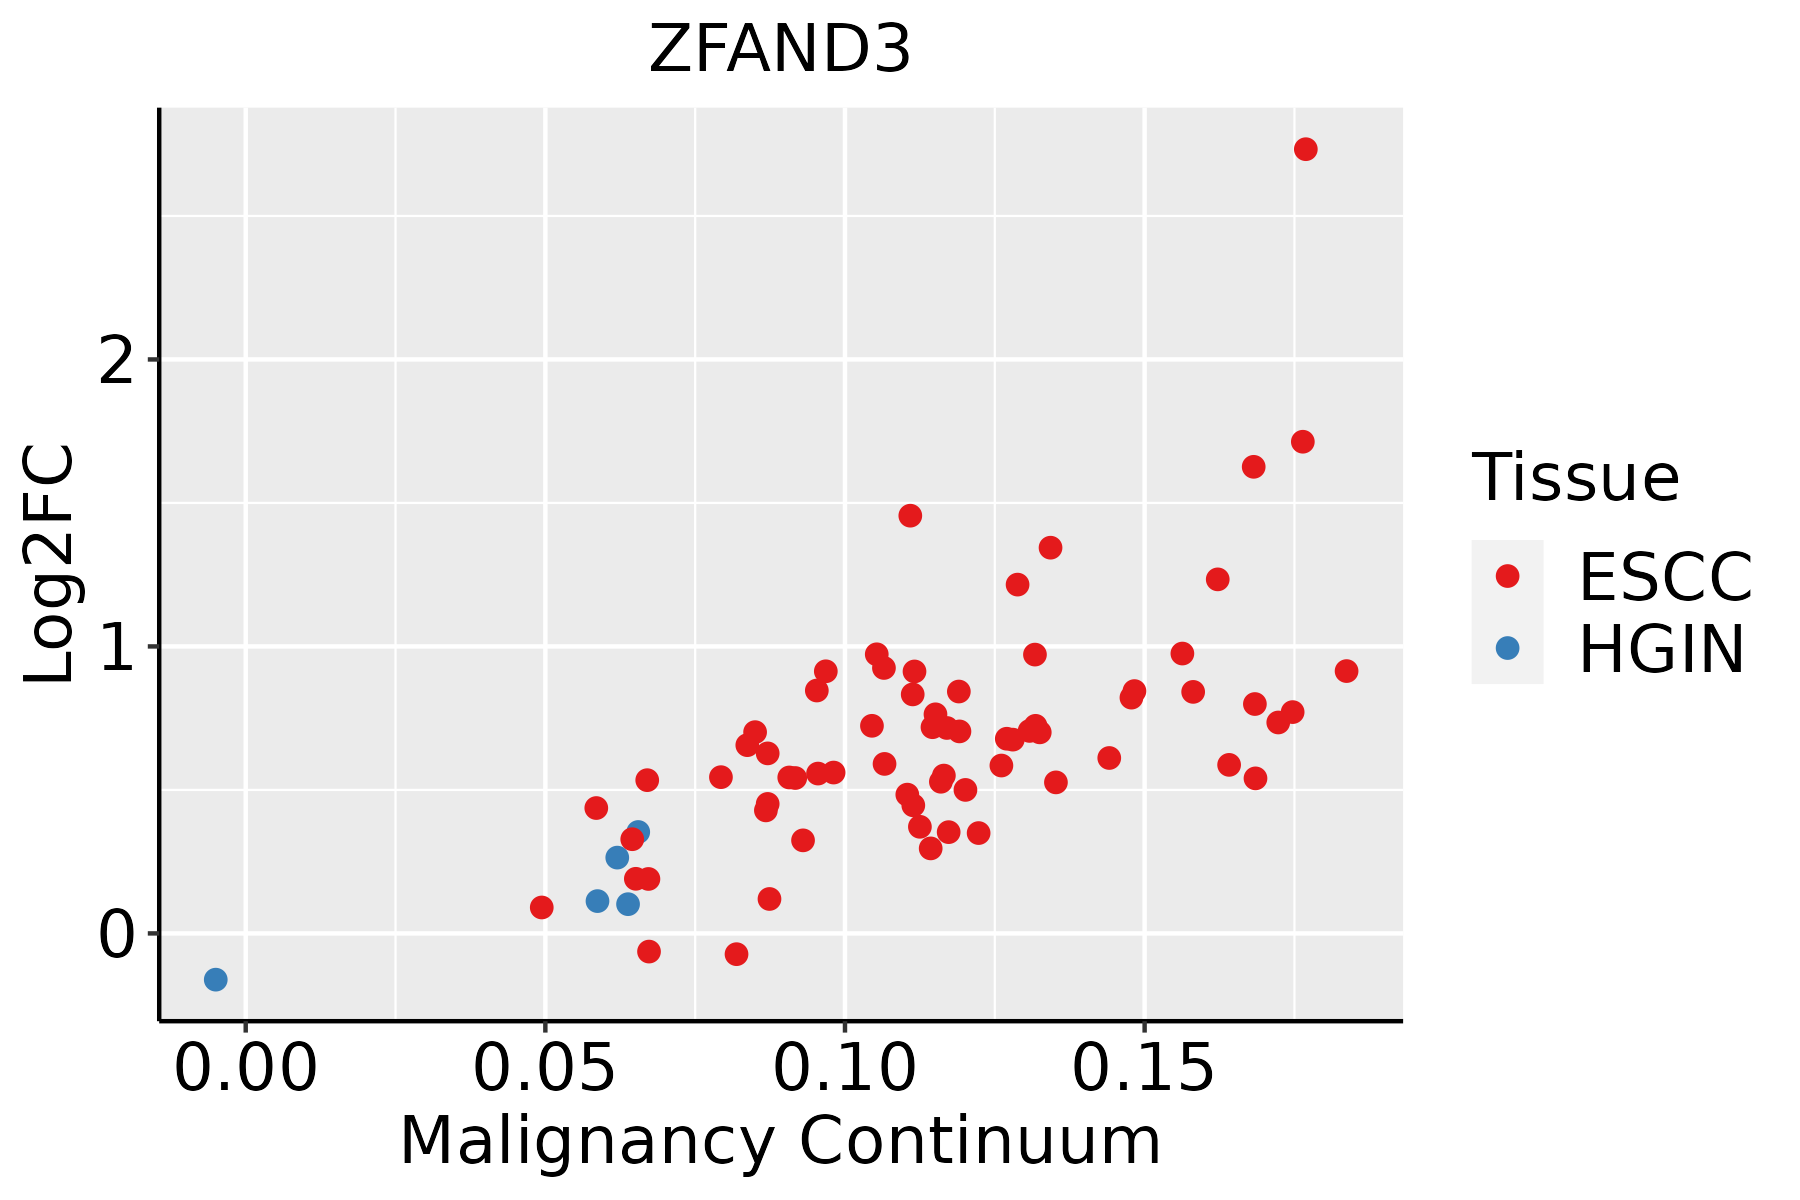 | ESCC: Esophageal squamous cell carcinoma |
| HGIN: High-grade intraepithelial neoplasias | ||
| LGIN: Low-grade intraepithelial neoplasias | ||
| GC | 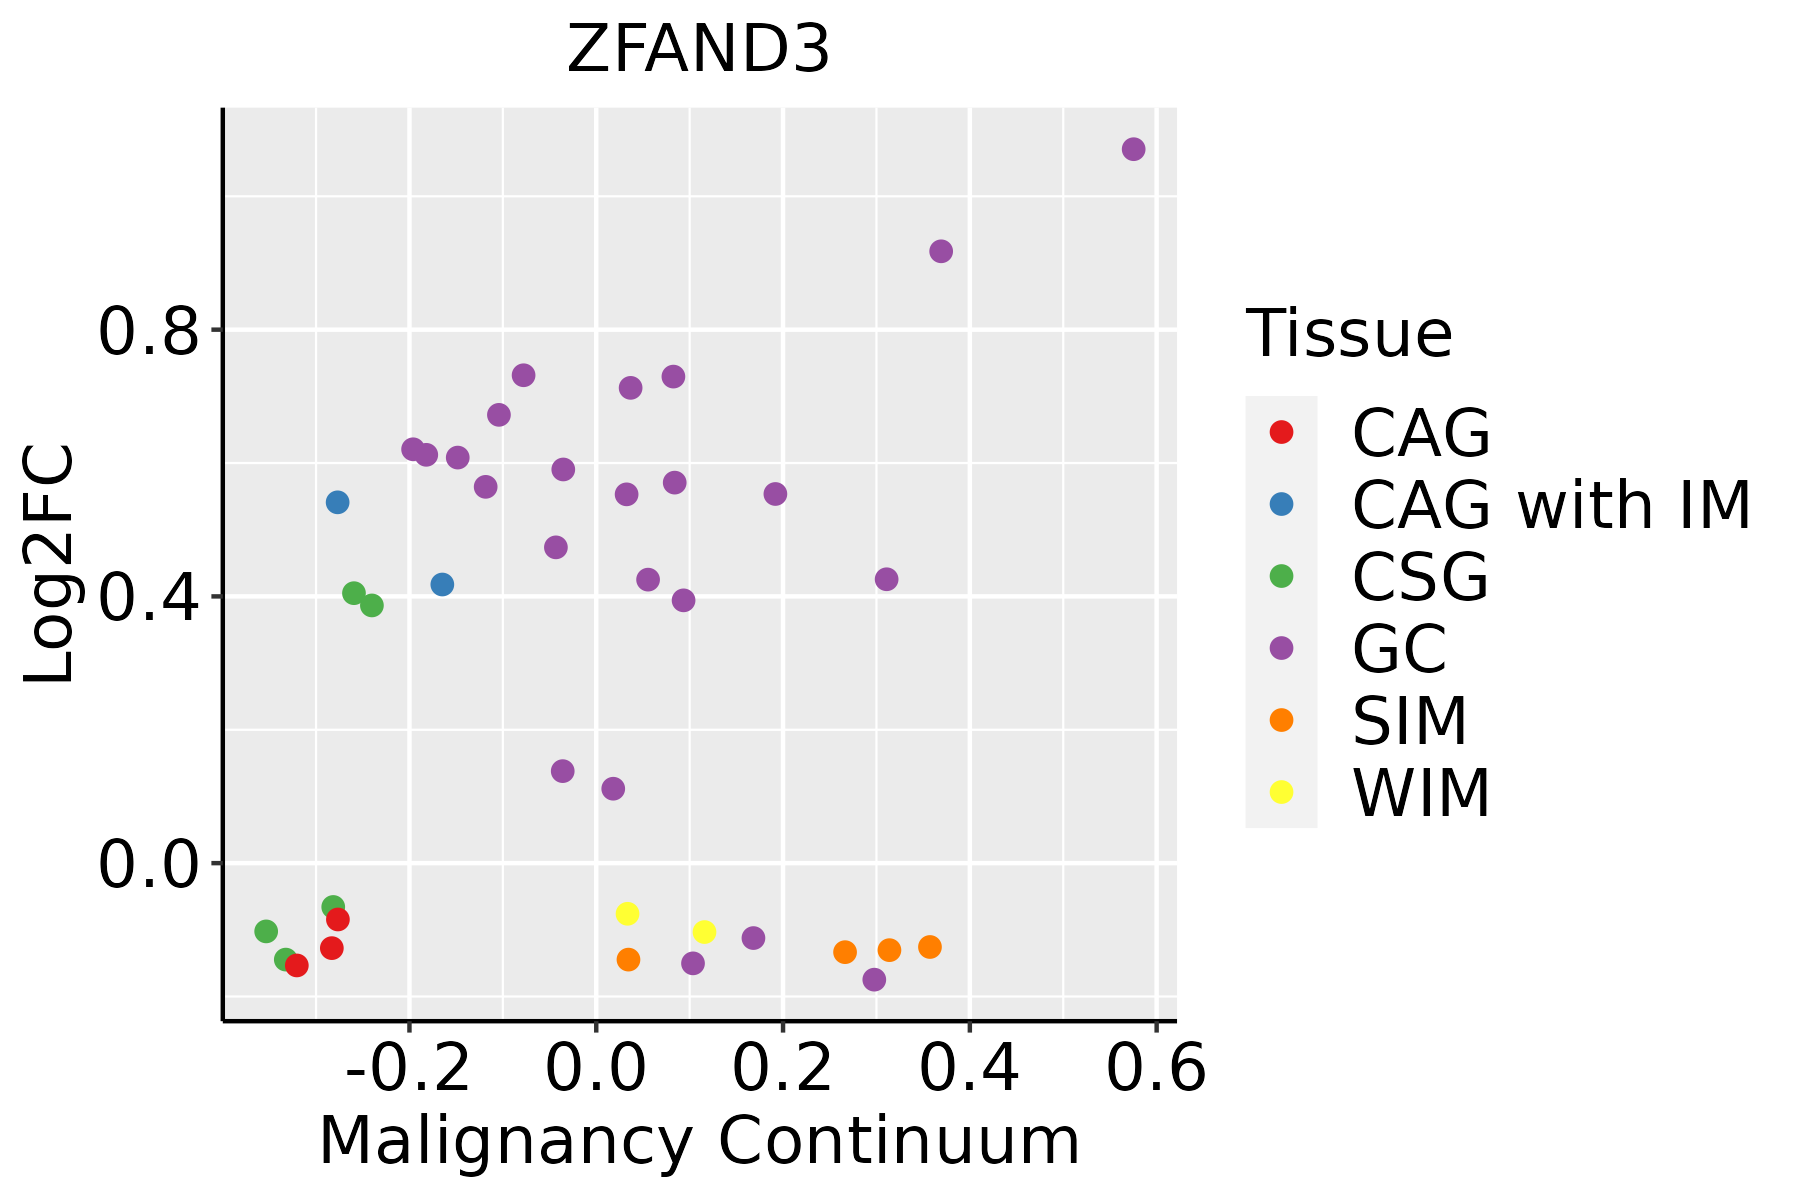 | CAG: Chronic atrophic gastritis |
| CAG with IM: Chronic atrophic gastritis with intestinal metaplasia | ||
| CSG: Chronic superficial gastritis | ||
| GC: Gastric cancer | ||
| SIM: Severe intestinal metaplasia | ||
| WIM: Wild intestinal metaplasia | ||
| Liver |  | HCC: Hepatocellular carcinoma |
| NAFLD: Non-alcoholic fatty liver disease | ||
| Lung |  | AAH: Atypical adenomatous hyperplasia |
| AIS: Adenocarcinoma in situ | ||
| IAC: Invasive lung adenocarcinoma | ||
| MIA: Minimally invasive adenocarcinoma | ||
| Oral Cavity | 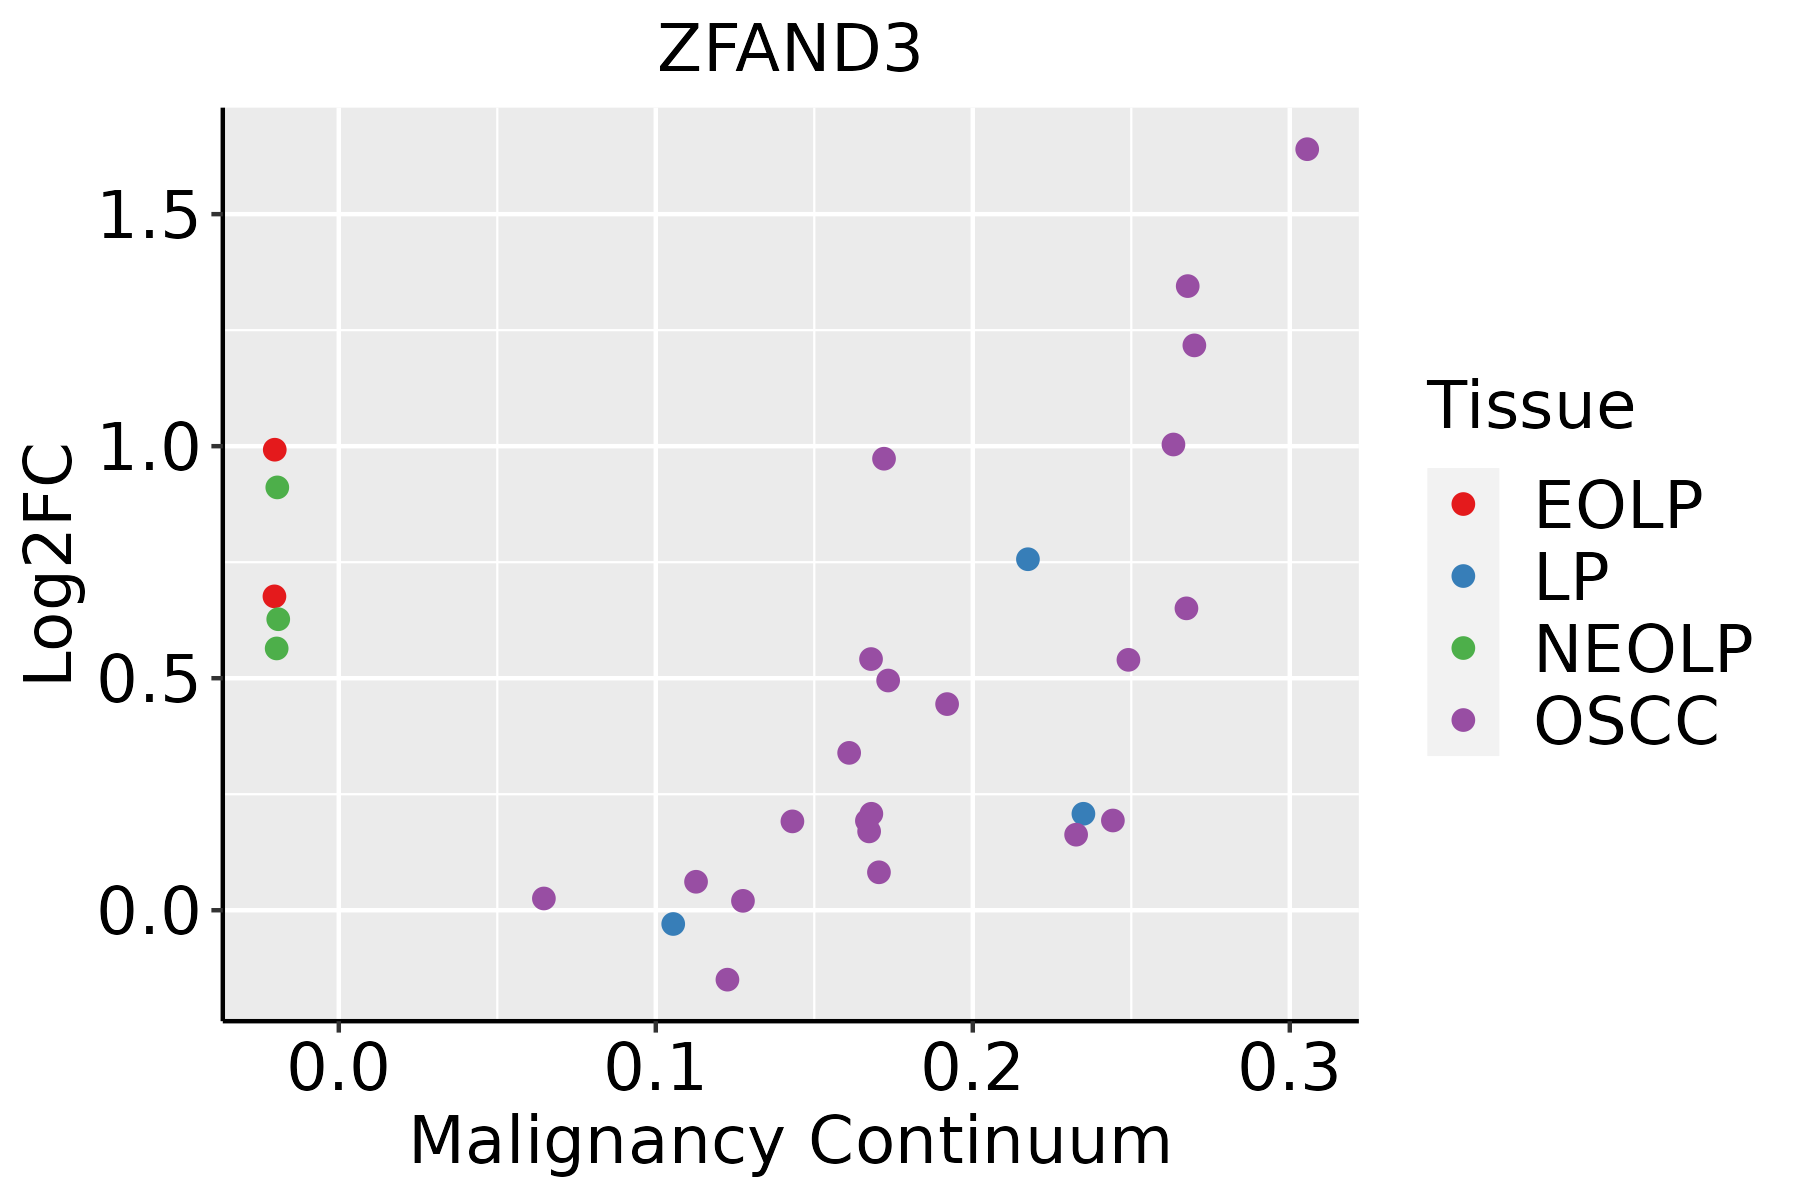 | EOLP: Erosive Oral lichen planus |
| LP: leukoplakia | ||
| NEOLP: Non-erosive oral lichen planus | ||
| OSCC: Oral squamous cell carcinoma | ||
| Prostate | 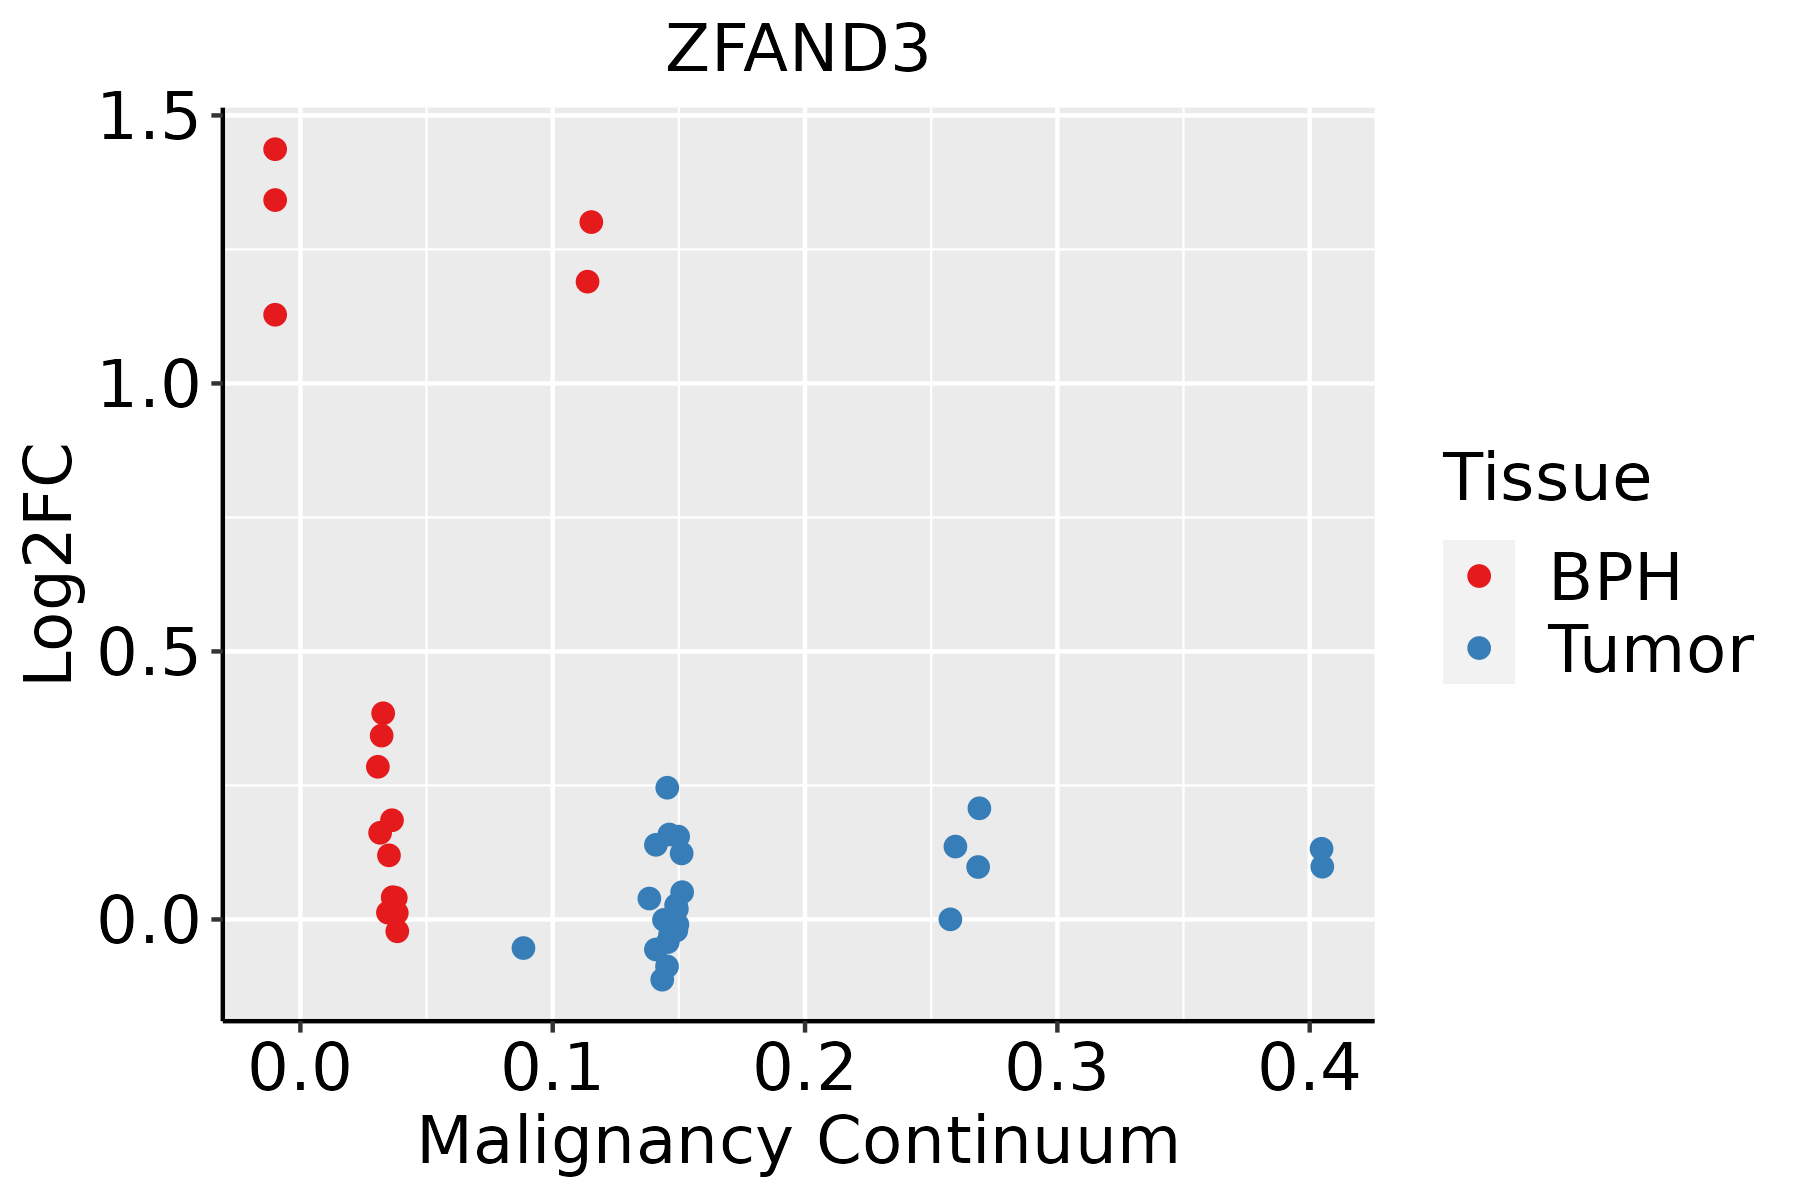 | BPH: Benign Prostatic Hyperplasia |
| Skin | 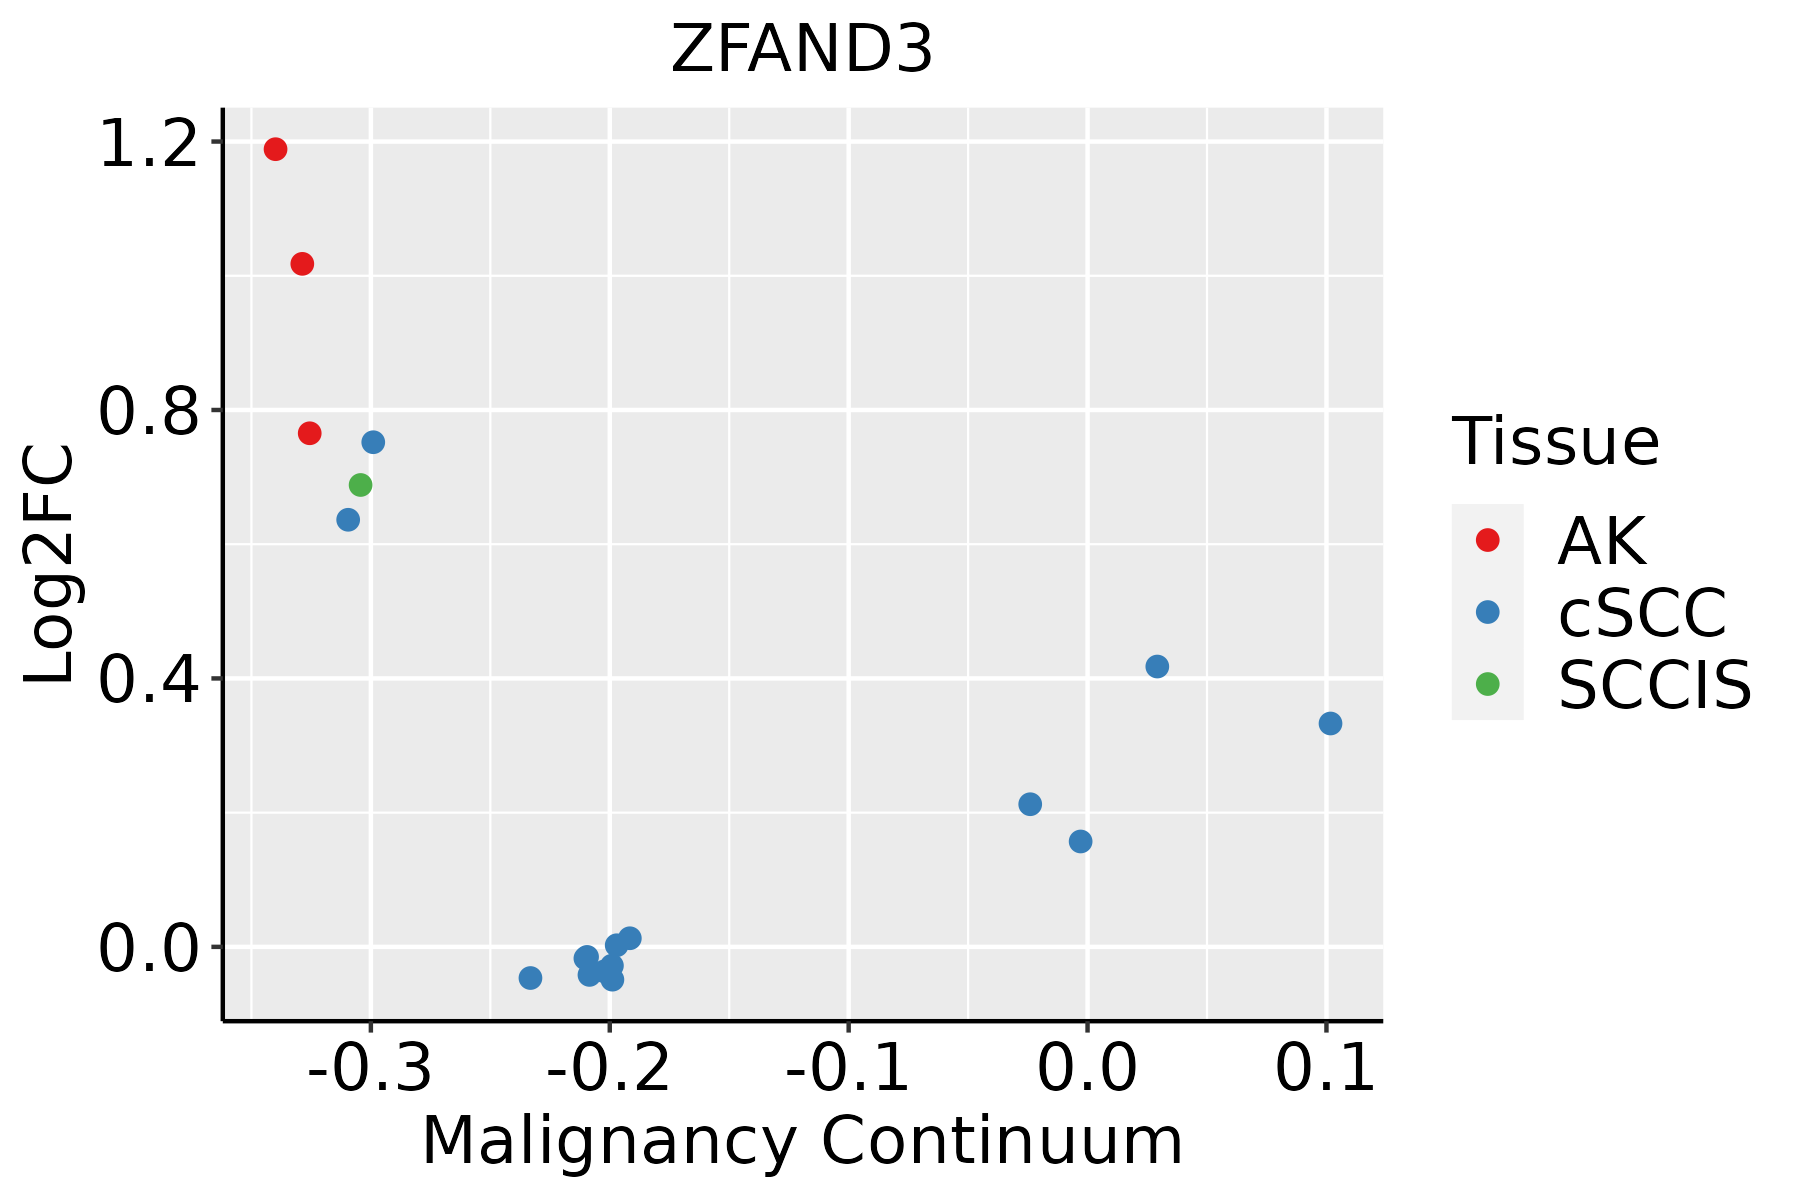 | AK: Actinic keratosis |
| cSCC: Cutaneous squamous cell carcinoma | ||
| SCCIS:squamous cell carcinoma in situ | ||
| Thyroid |  | ATC: Anaplastic thyroid cancer |
| HT: Hashimoto's thyroiditis | ||
| PTC: Papillary thyroid cancer |
| ∗log2FC in expression of this searched gene in stem-like cells from each diseased tissue sample relative to stem-like cells in normal samples in each tissue plotted against the malignancy continuum. Samples are colored based on if they are from different disease stage. |
Top |
Malignant transformation related pathway analysis |
| Find out the enriched GO biological processes and KEGG pathways involved in transition from healthy to precancer to cancer |
| Tissue | Disease Stage | Enriched GO biological Processes |
| Colorectum | AD |  |
| Colorectum | SER |  |
| Colorectum | MSS |  |
| Colorectum | MSI-H |  |
| Colorectum | FAP |  |
| ∗Top 15 enriched GO BP terms are showed in the bar plot of each disease state in each tissue. Each row represents a significant GO biological process which is colored according to the -log10(p.adjust). |
| Page: 1 2 3 4 5 6 7 8 9 |
| GO ID | Tissue | Disease Stage | Description | Gene Ratio | Bg Ratio | pvalue | p.adjust | Count |
| Page: 1 |
| Pathway ID | Tissue | Disease Stage | Description | Gene Ratio | Bg Ratio | pvalue | p.adjust | qvalue | Count |
| Page: 1 |
Top |
Cell-cell communication analysis |
| Identification of potential cell-cell interactions between two cell types and their ligand-receptor pairs for different disease states |
| Ligand | Receptor | LRpair | Pathway | Tissue | Disease Stage |
| Page: 1 |
Top |
Single-cell gene regulatory network inference analysis |
| Find out the significant the regulons (TFs) and the target genes of each regulon across cell types for different disease states |
| TF | Cell Type | Tissue | Disease Stage | Target Gene | RSS | Regulon Activity |
| ∗The dot plots of a searched regulon are shown for all cell subpopulations in each disease state of each tissue based on the regulon specific score inferred using pySCENIC and by calculating the average expression. |
| Page: 1 |
Top |
Somatic mutation of malignant transformation related genes |
| Annotation of somatic variants for genes involved in malignant transformation |
| Hugo Symbol | Variant Class | Variant Classification | dbSNP RS | HGVSc | HGVSp | HGVSp Short | SWISSPROT | BIOTYPE | SIFT | PolyPhen | Tumor Sample Barcode | Tissue | Histology | Sex | Age | Stage | Therapy Types | Drugs | Outcome |
| ZFAND3 | SNV | Missense_Mutation | novel | c.184N>A | p.Glu62Lys | p.E62K | Q9H8U3 | protein_coding | tolerated(0.71) | benign(0.007) | TCGA-D8-A1J9-01 | Breast | breast invasive carcinoma | Female | <65 | I/II | Unknown | Unknown | SD |
| ZFAND3 | insertion | Nonsense_Mutation | novel | c.524_525insAATTGTGAAAGCATAGTGATACAGAGATACATTAGACATAGTCC | p.Cys176IlefsTer5 | p.C176Ifs*5 | Q9H8U3 | protein_coding | TCGA-A8-A08H-01 | Breast | breast invasive carcinoma | Female | >=65 | I/II | Unknown | Unknown | SD | ||
| ZFAND3 | SNV | Missense_Mutation | novel | c.523C>A | p.Arg175Ser | p.R175S | Q9H8U3 | protein_coding | deleterious(0) | probably_damaging(0.999) | TCGA-5M-AATE-01 | Colorectum | colon adenocarcinoma | Male | >=65 | I/II | Unknown | Unknown | PD |
| ZFAND3 | SNV | Missense_Mutation | c.413A>T | p.Glu138Val | p.E138V | Q9H8U3 | protein_coding | deleterious(0.02) | benign(0.036) | TCGA-AA-A00N-01 | Colorectum | colon adenocarcinoma | Male | >=65 | I/II | Unknown | Unknown | PD | |
| ZFAND3 | deletion | Frame_Shift_Del | novel | c.358delA | p.Thr120GlnfsTer12 | p.T120Qfs*12 | Q9H8U3 | protein_coding | TCGA-AA-3667-01 | Colorectum | colon adenocarcinoma | Female | <65 | I/II | Unknown | Unknown | SD | ||
| ZFAND3 | SNV | Missense_Mutation | novel | c.667N>A | p.Gly223Arg | p.G223R | Q9H8U3 | protein_coding | deleterious_low_confidence(0) | probably_damaging(0.999) | TCGA-A5-A0G2-01 | Endometrium | uterine corpus endometrioid carcinoma | Female | <65 | III/IV | Unknown | Unknown | SD |
| ZFAND3 | SNV | Missense_Mutation | novel | c.383N>A | p.Ala128Asp | p.A128D | Q9H8U3 | protein_coding | tolerated(0.1) | benign(0.08) | TCGA-A5-A0GG-01 | Endometrium | uterine corpus endometrioid carcinoma | Female | >=65 | I/II | Unknown | Unknown | SD |
| ZFAND3 | SNV | Missense_Mutation | rs112599440 | c.554N>A | p.Arg185His | p.R185H | Q9H8U3 | protein_coding | deleterious(0.01) | probably_damaging(0.999) | TCGA-A5-A1OF-01 | Endometrium | uterine corpus endometrioid carcinoma | Female | <65 | I/II | Unknown | Unknown | SD |
| ZFAND3 | SNV | Missense_Mutation | novel | c.347G>T | p.Arg116Ile | p.R116I | Q9H8U3 | protein_coding | deleterious(0) | possibly_damaging(0.798) | TCGA-AP-A1E0-01 | Endometrium | uterine corpus endometrioid carcinoma | Female | <65 | III/IV | Chemotherapy | paclitaxel | SD |
| ZFAND3 | SNV | Missense_Mutation | rs765595688 | c.443G>A | p.Arg148Gln | p.R148Q | Q9H8U3 | protein_coding | tolerated(0.21) | benign(0.157) | TCGA-AP-A1E0-01 | Endometrium | uterine corpus endometrioid carcinoma | Female | <65 | III/IV | Chemotherapy | paclitaxel | SD |
| Page: 1 2 3 |
Top |
Related drugs of malignant transformation related genes |
| Identification of chemicals and drugs interact with genes involved in malignant transfromation |
| (DGIdb 4.0) |
| Entrez ID | Symbol | Category | Interaction Types | Drug Claim Name | Drug Name | PMIDs |
| Page: 1 |

Copyright 2023-Present -The University of Texas Health Science Center at Houston |