
|
|||||
|
 | |
| |
| |
| |
| |
| |
|
Gene: RAB2A |
Gene summary for RAB2A |
| Gene information | Species | Human | Gene symbol | RAB2A | Gene ID | 5862 |
| Gene name | RAB2A, member RAS oncogene family | |
| Gene Alias | LHX | |
| Cytomap | 8q12.1-q12.2 | |
| Gene Type | protein-coding | GO ID | GO:0006810 | UniProtAcc | P61019 |
Top |
Malignant transformation analysis |
| Identification of the aberrant gene expression in precancerous and cancerous lesions by comparing the gene expression of stem-like cells in diseased tissues with normal stem cells |
| Entrez ID | Symbol | Replicates | Species | Organ | Tissue | Adj P-value | Log2FC | Malignancy |
| 5862 | RAB2A | C57 | Human | Oral cavity | OSCC | 1.11e-50 | 1.79e+00 | 0.1679 |
| 5862 | RAB2A | C06 | Human | Oral cavity | OSCC | 3.01e-16 | 2.96e+00 | 0.2699 |
| 5862 | RAB2A | C07 | Human | Oral cavity | OSCC | 1.38e-11 | 2.06e+00 | 0.2491 |
| 5862 | RAB2A | C08 | Human | Oral cavity | OSCC | 1.00e-73 | 1.69e+00 | 0.1919 |
| 5862 | RAB2A | C09 | Human | Oral cavity | OSCC | 3.11e-16 | 7.14e-01 | 0.1431 |
| 5862 | RAB2A | LN22 | Human | Oral cavity | OSCC | 1.54e-19 | 1.75e+00 | 0.1733 |
| 5862 | RAB2A | LN38 | Human | Oral cavity | OSCC | 6.54e-16 | 1.94e+00 | 0.168 |
| 5862 | RAB2A | LN46 | Human | Oral cavity | OSCC | 6.14e-18 | 1.12e+00 | 0.1666 |
| 5862 | RAB2A | LP15 | Human | Oral cavity | LP | 5.86e-18 | 2.54e+00 | 0.2174 |
| 5862 | RAB2A | LP17 | Human | Oral cavity | LP | 9.08e-08 | 1.46e+00 | 0.2349 |
| 5862 | RAB2A | EOLP-1 | Human | Oral cavity | EOLP | 1.02e-04 | 3.11e-01 | -0.0202 |
| 5862 | RAB2A | EOLP-2 | Human | Oral cavity | EOLP | 2.38e-02 | 2.40e-01 | -0.0203 |
| 5862 | RAB2A | NEOLP-3 | Human | Oral cavity | NEOLP | 2.51e-04 | 1.56e-01 | -0.0191 |
| 5862 | RAB2A | SYSMH1 | Human | Oral cavity | OSCC | 5.90e-27 | 9.25e-01 | 0.1127 |
| 5862 | RAB2A | SYSMH2 | Human | Oral cavity | OSCC | 2.86e-28 | 1.83e+00 | 0.2326 |
| 5862 | RAB2A | SYSMH3 | Human | Oral cavity | OSCC | 2.97e-35 | 1.65e+00 | 0.2442 |
| 5862 | RAB2A | SYSMH4 | Human | Oral cavity | OSCC | 6.49e-03 | 1.42e-01 | 0.1226 |
| 5862 | RAB2A | SYSMH5 | Human | Oral cavity | OSCC | 1.43e-13 | 7.41e-01 | 0.0647 |
| 5862 | RAB2A | SYSMH6 | Human | Oral cavity | OSCC | 5.40e-17 | 1.00e+00 | 0.1275 |
| 5862 | RAB2A | HTA12-23-1 | Human | Pancreas | PDAC | 2.69e-02 | 6.15e-01 | 0.3405 |
| Page: 1 2 3 4 5 6 7 8 9 10 11 12 13 14 |
| Tissue | Expression Dynamics | Abbreviation |
| Breast | 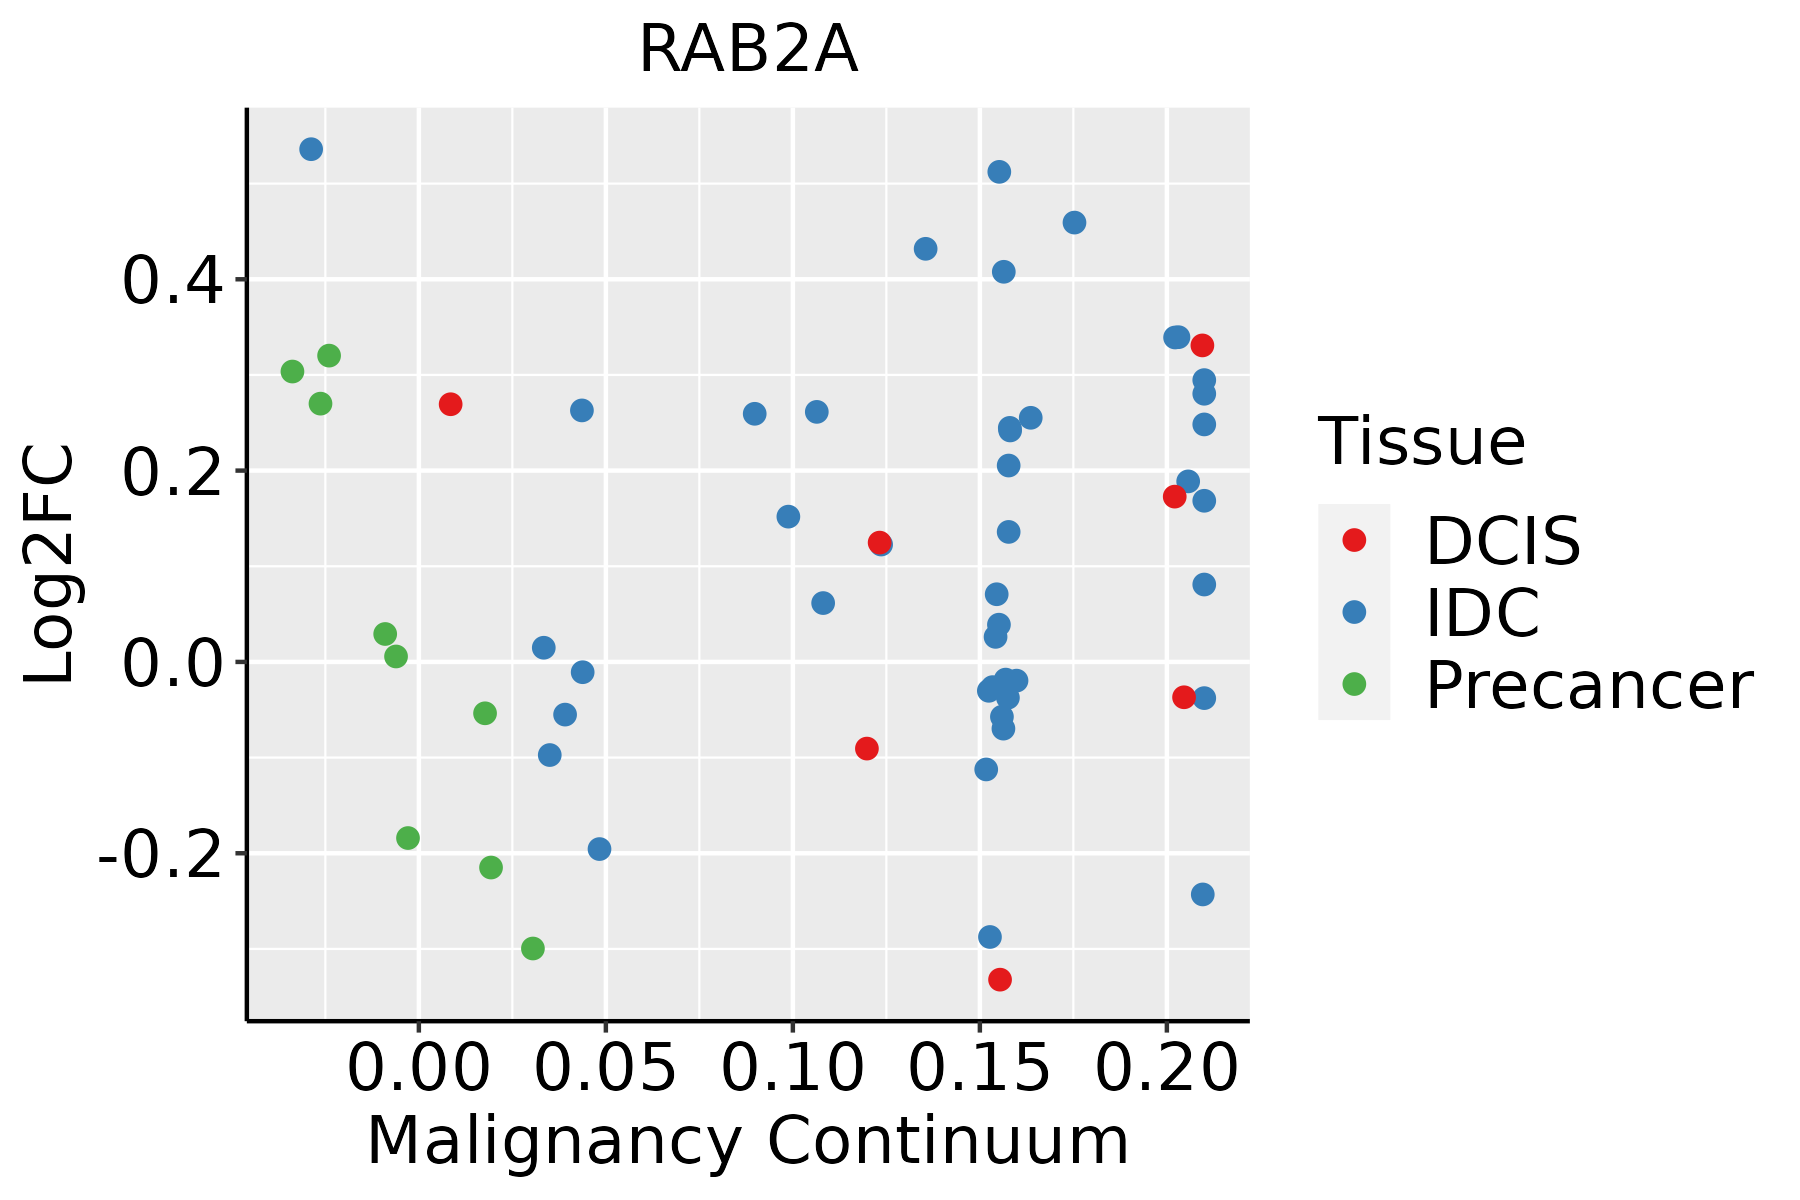 | IDC: Invasive ductal carcinoma |
| DCIS: Ductal carcinoma in situ | ||
| Precancer(BRCA1-mut): Precancerous lesion from BRCA1 mutation carriers | ||
| Colorectum (GSE201348) | 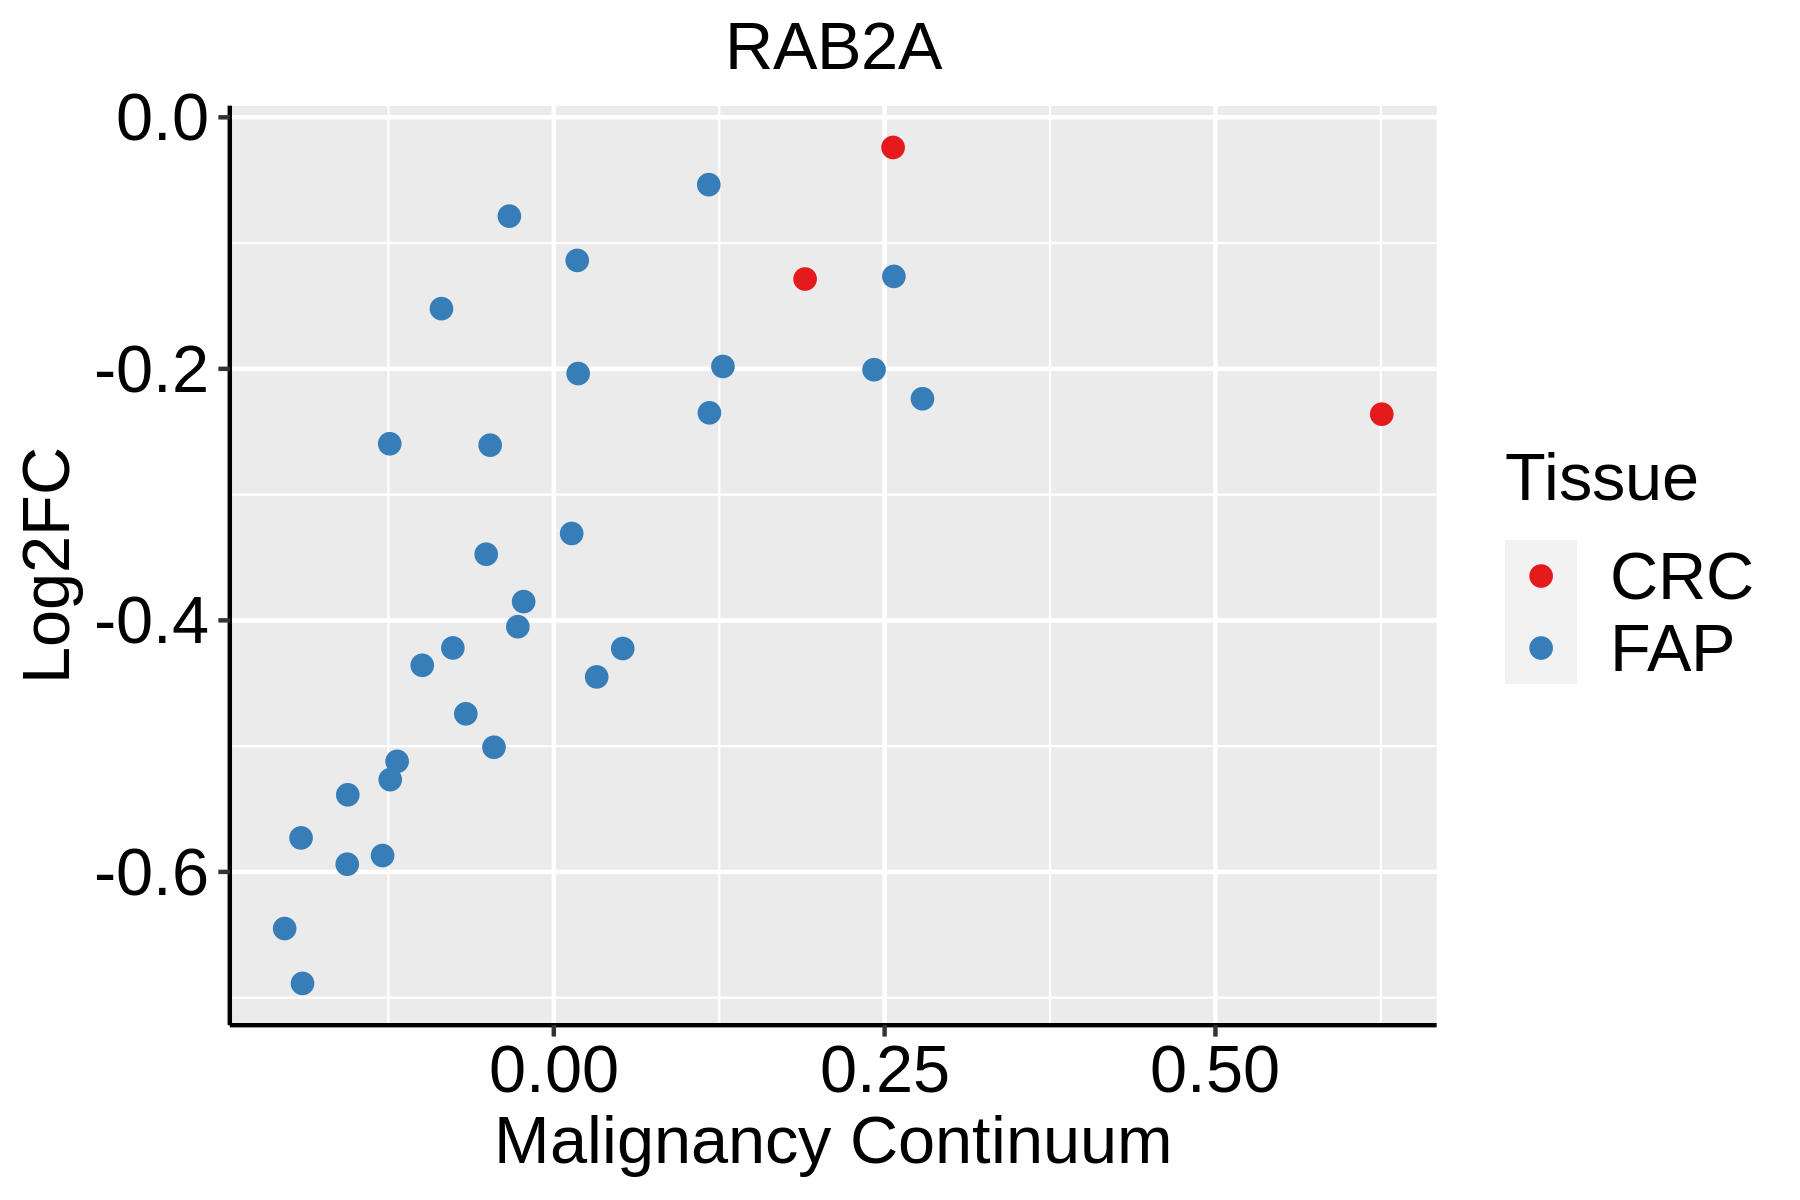 | FAP: Familial adenomatous polyposis |
| CRC: Colorectal cancer | ||
| Colorectum (HTA11) |  | AD: Adenomas |
| SER: Sessile serrated lesions | ||
| MSI-H: Microsatellite-high colorectal cancer | ||
| MSS: Microsatellite stable colorectal cancer | ||
| Esophagus | 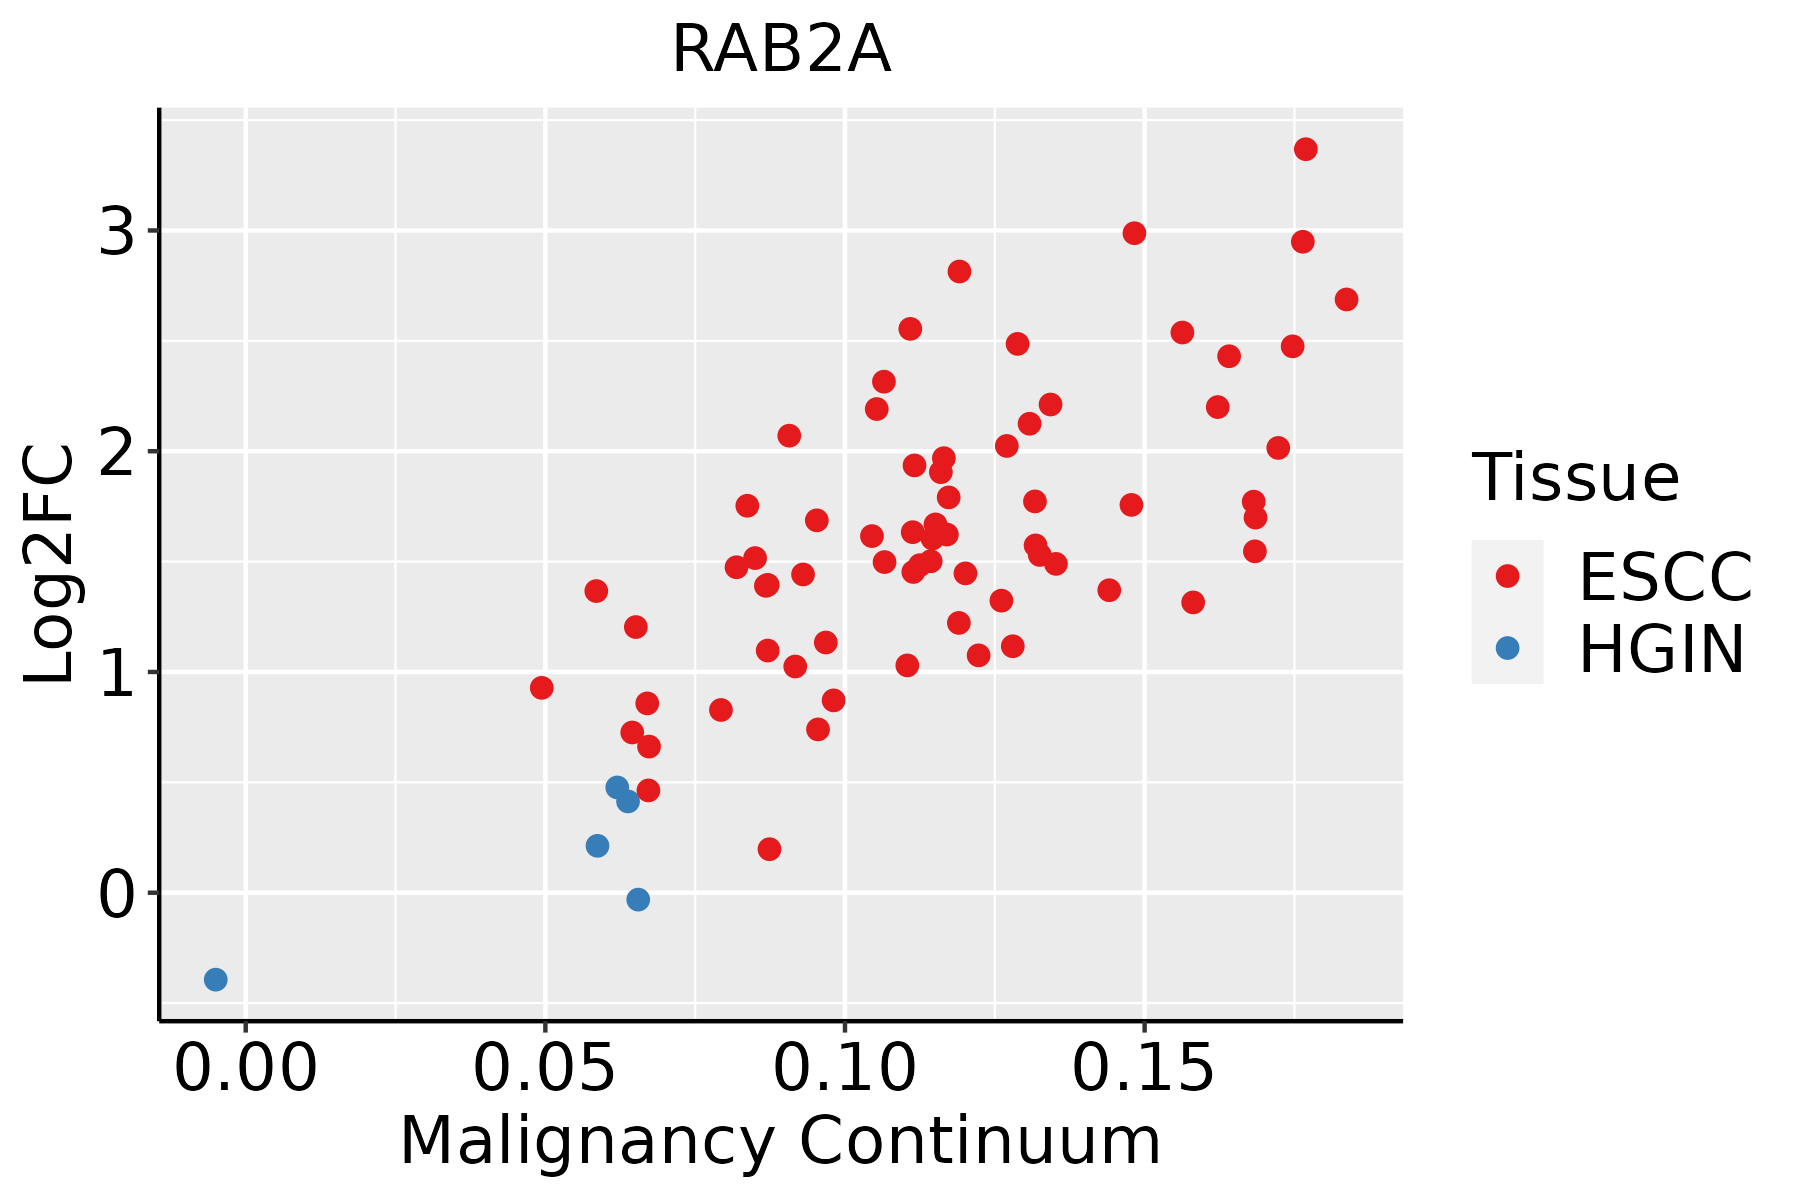 | ESCC: Esophageal squamous cell carcinoma |
| HGIN: High-grade intraepithelial neoplasias | ||
| LGIN: Low-grade intraepithelial neoplasias | ||
| GC |  | CAG: Chronic atrophic gastritis |
| CAG with IM: Chronic atrophic gastritis with intestinal metaplasia | ||
| CSG: Chronic superficial gastritis | ||
| GC: Gastric cancer | ||
| SIM: Severe intestinal metaplasia | ||
| WIM: Wild intestinal metaplasia | ||
| Liver |  | HCC: Hepatocellular carcinoma |
| NAFLD: Non-alcoholic fatty liver disease | ||
| Lung | 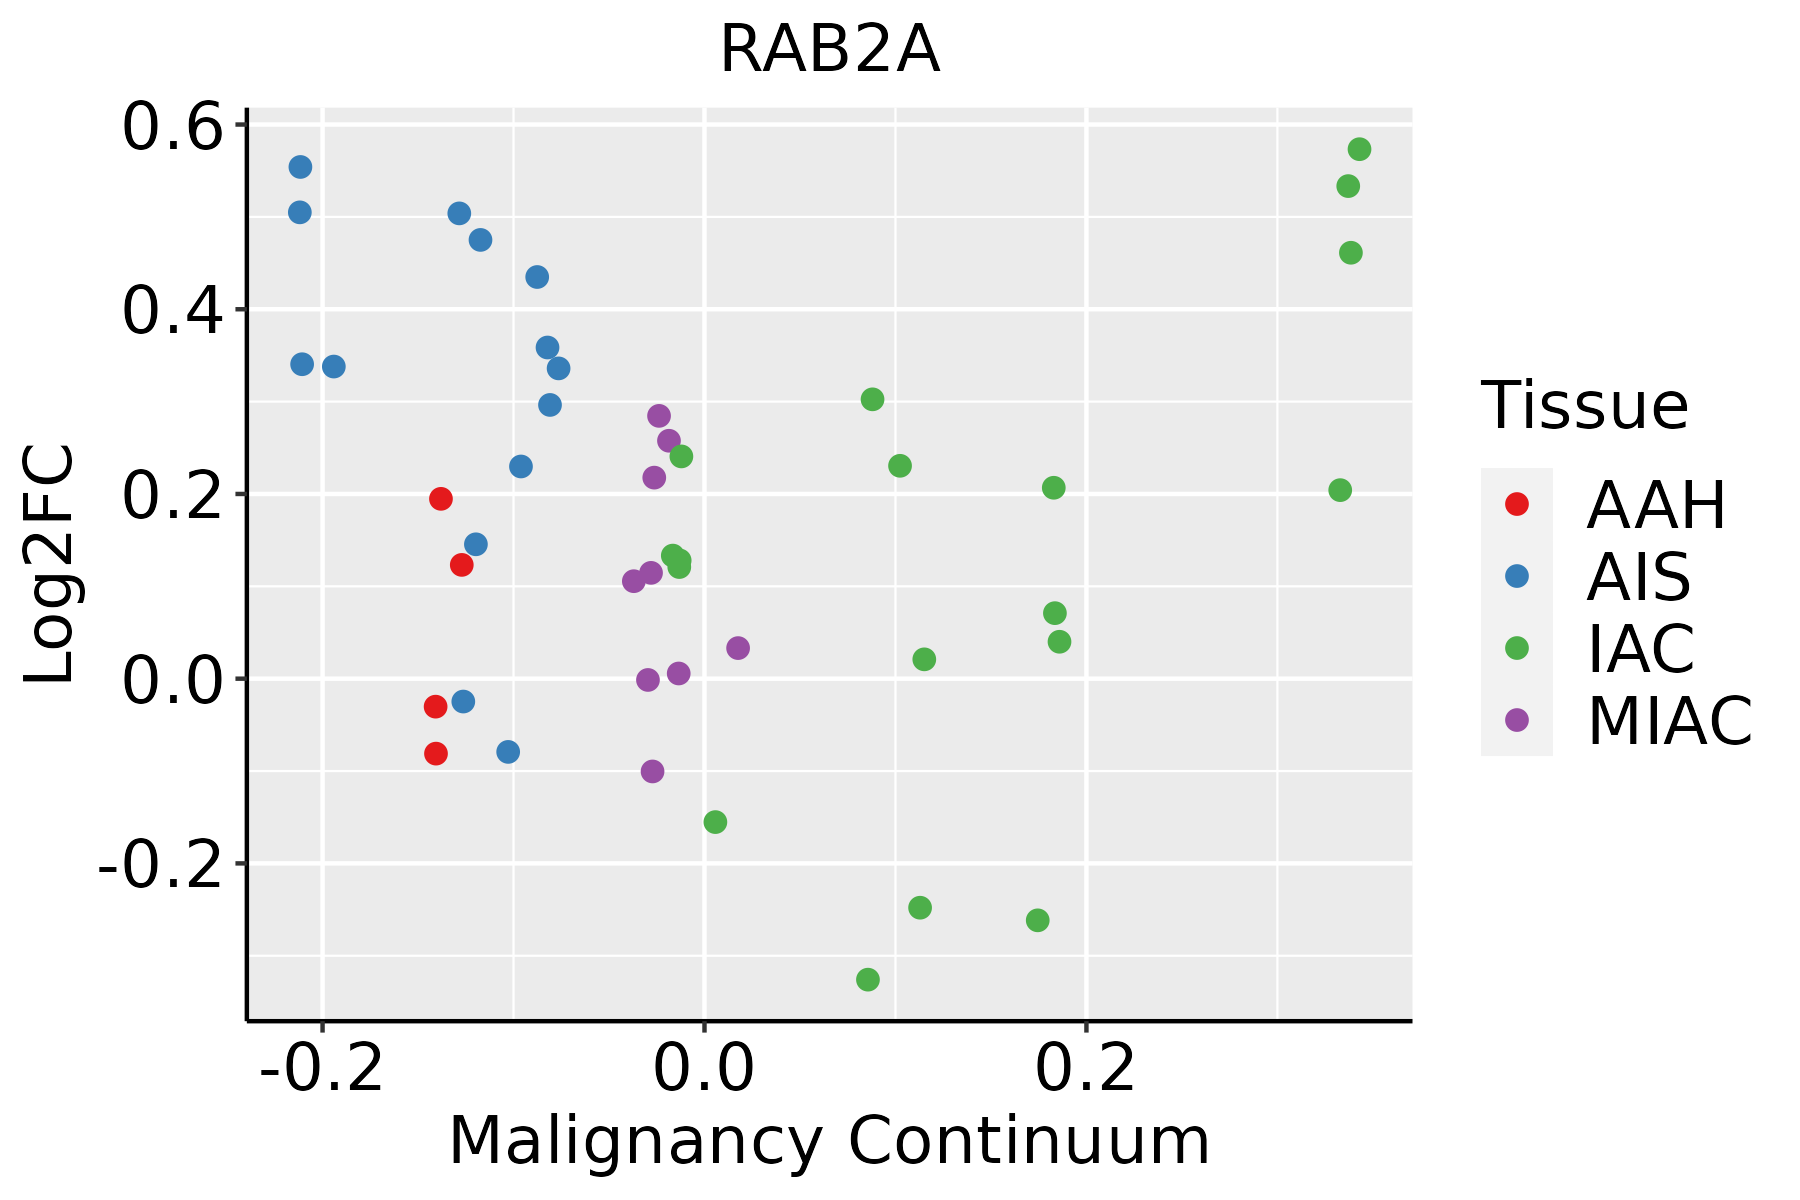 | AAH: Atypical adenomatous hyperplasia |
| AIS: Adenocarcinoma in situ | ||
| IAC: Invasive lung adenocarcinoma | ||
| MIA: Minimally invasive adenocarcinoma | ||
| Oral Cavity | 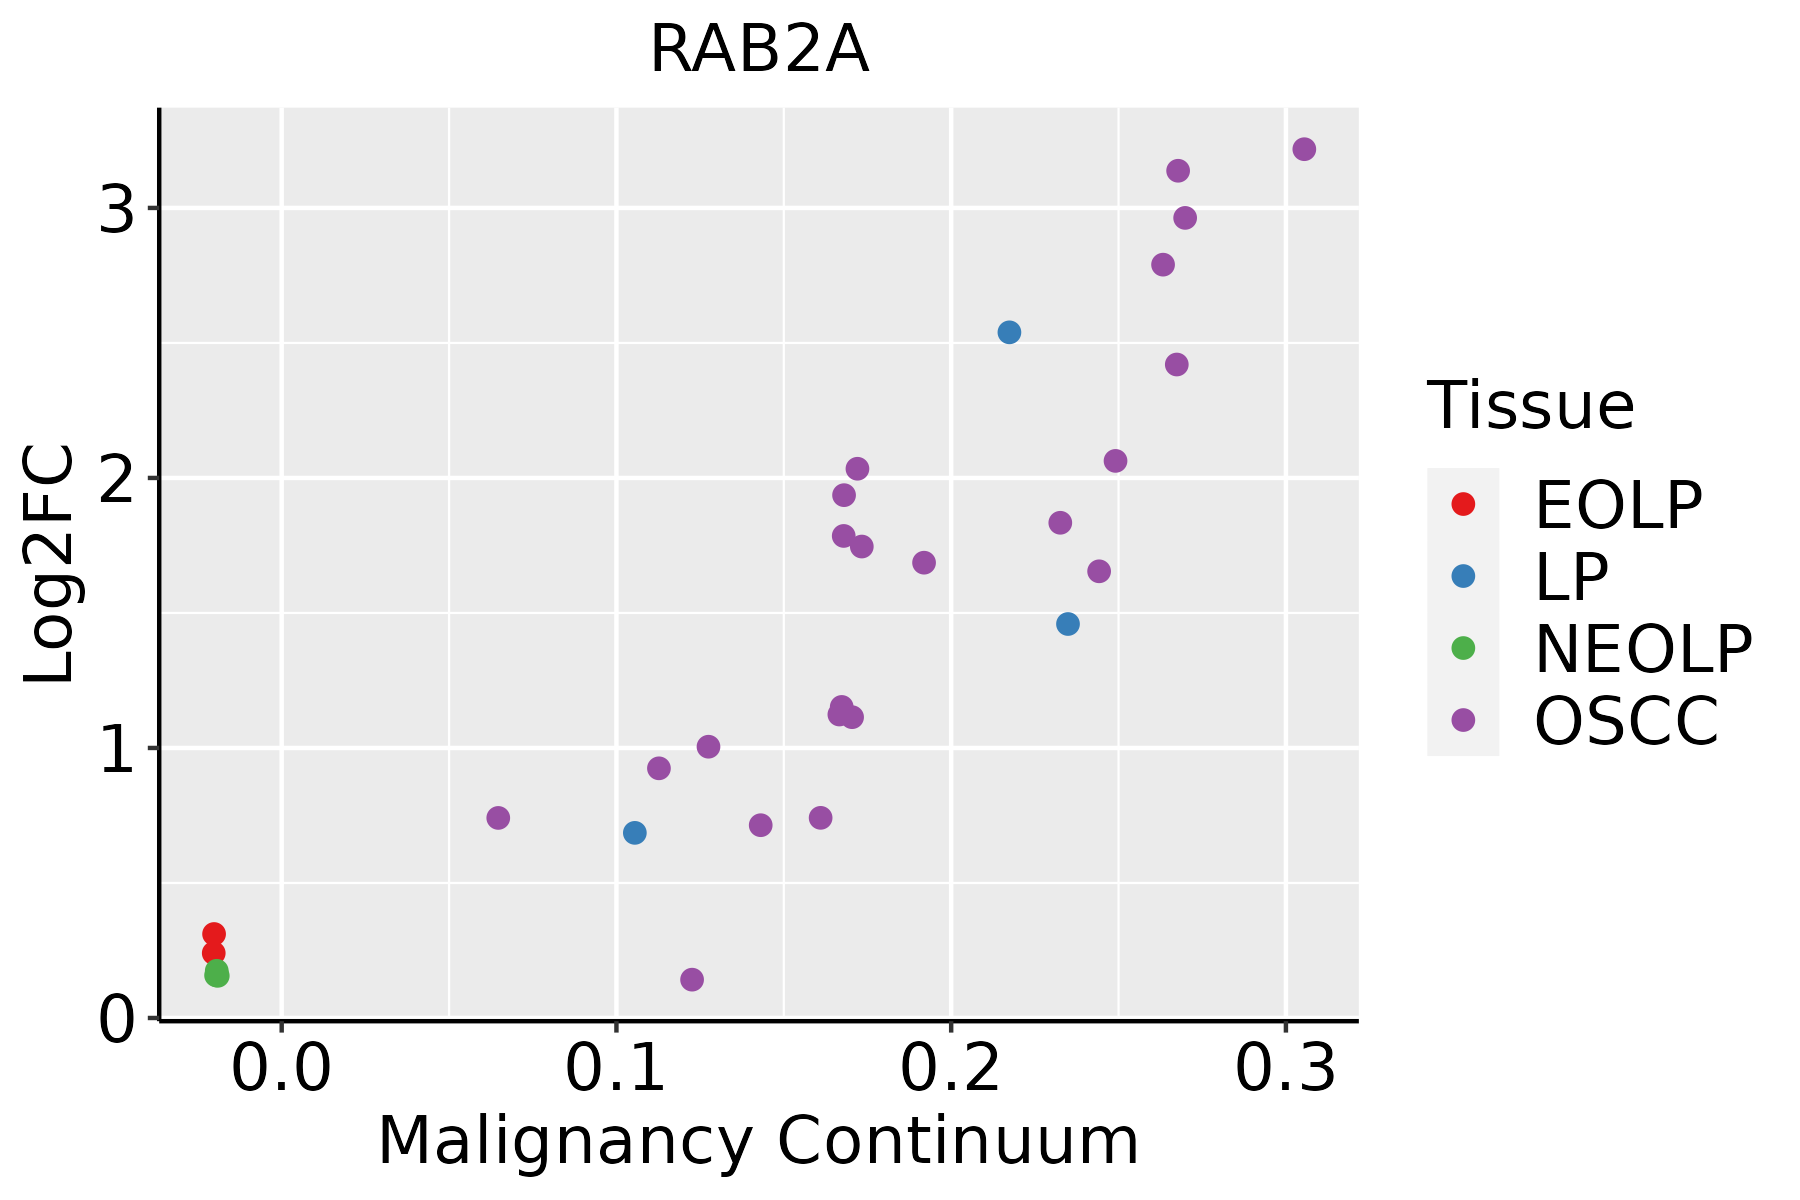 | EOLP: Erosive Oral lichen planus |
| LP: leukoplakia | ||
| NEOLP: Non-erosive oral lichen planus | ||
| OSCC: Oral squamous cell carcinoma | ||
| Prostate |  | BPH: Benign Prostatic Hyperplasia |
| Skin |  | AK: Actinic keratosis |
| cSCC: Cutaneous squamous cell carcinoma | ||
| SCCIS:squamous cell carcinoma in situ | ||
| Thyroid | 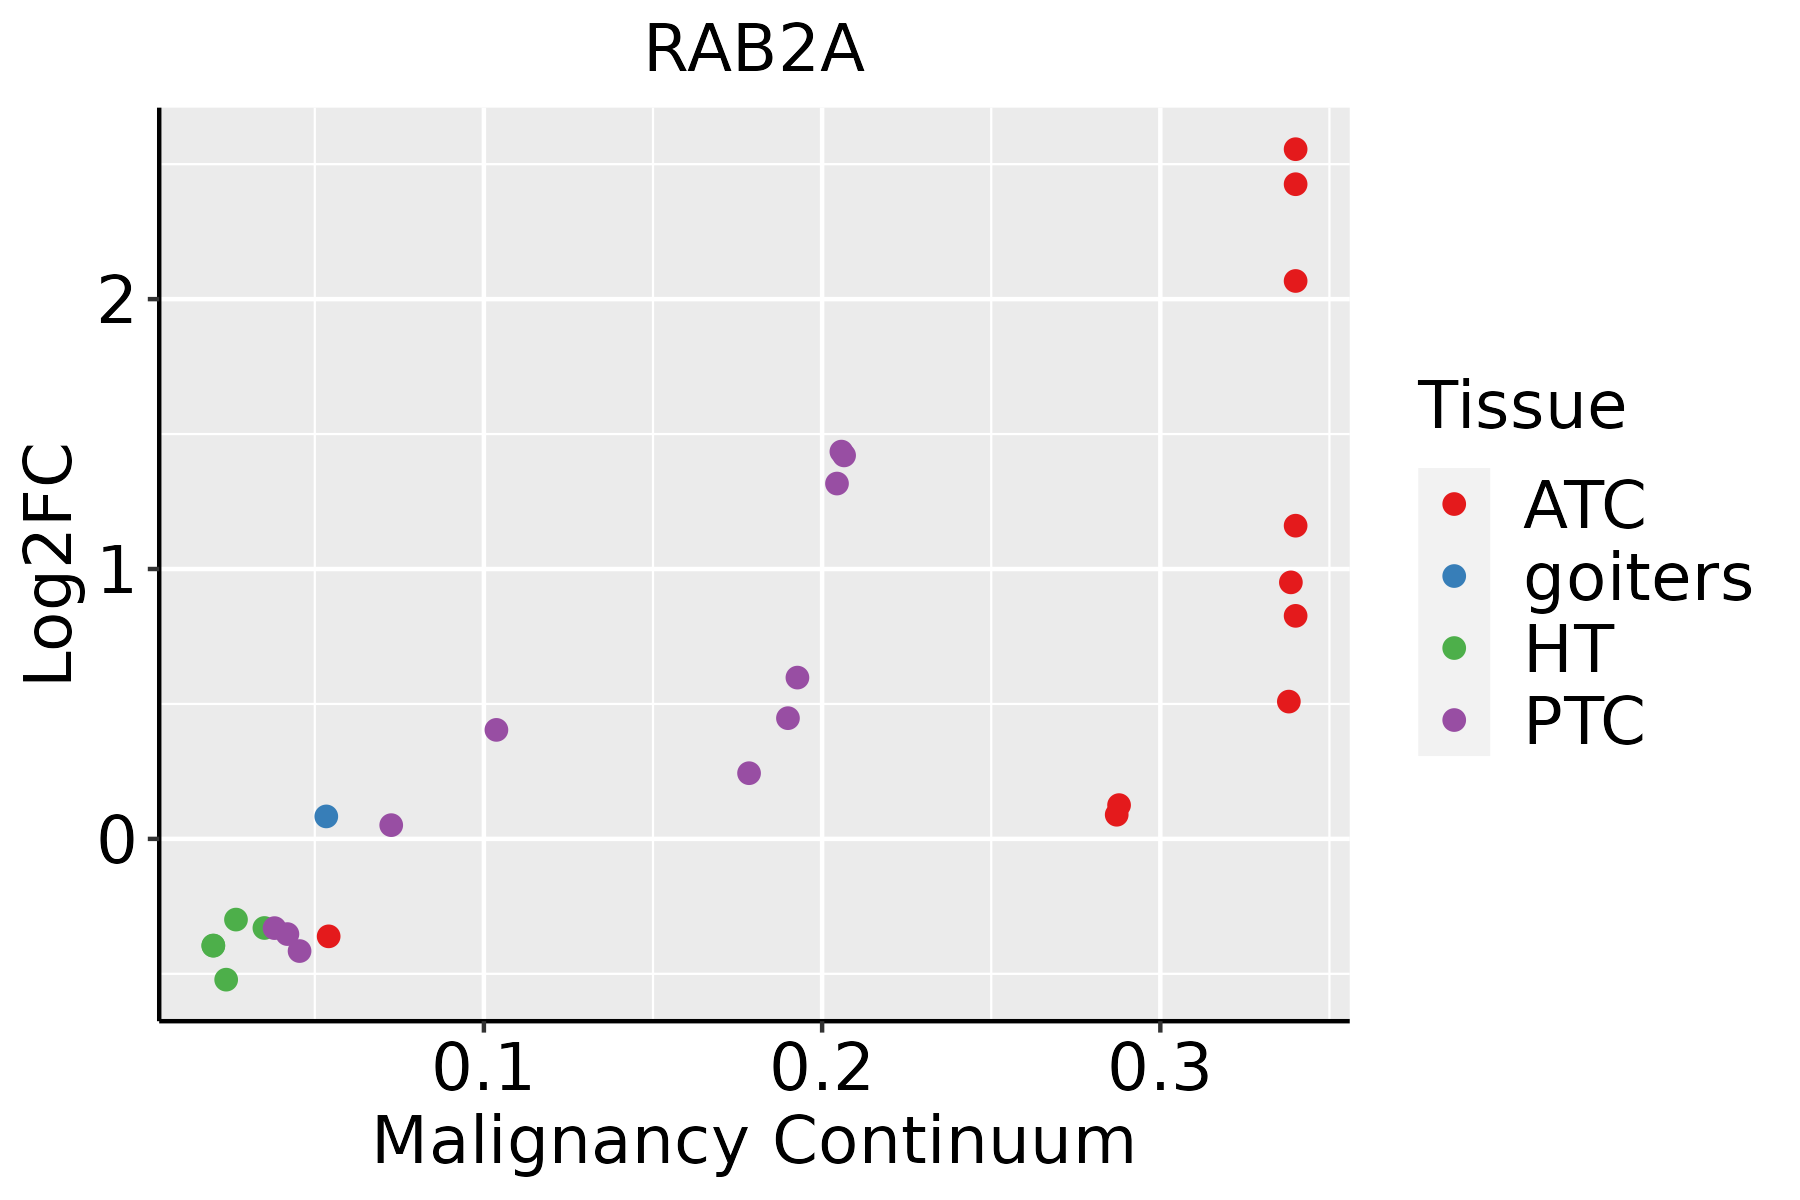 | ATC: Anaplastic thyroid cancer |
| HT: Hashimoto's thyroiditis | ||
| PTC: Papillary thyroid cancer |
| ∗log2FC in expression of this searched gene in stem-like cells from each diseased tissue sample relative to stem-like cells in normal samples in each tissue plotted against the malignancy continuum. Samples are colored based on if they are from different disease stage. |
Top |
Malignant transformation related pathway analysis |
| Find out the enriched GO biological processes and KEGG pathways involved in transition from healthy to precancer to cancer |
| Tissue | Disease Stage | Enriched GO biological Processes |
| Colorectum | AD |  |
| Colorectum | SER |  |
| Colorectum | MSS |  |
| Colorectum | MSI-H |  |
| Colorectum | FAP |  |
| ∗Top 15 enriched GO BP terms are showed in the bar plot of each disease state in each tissue. Each row represents a significant GO biological process which is colored according to the -log10(p.adjust). |
| Page: 1 2 3 4 5 6 7 8 9 |
| GO ID | Tissue | Disease Stage | Description | Gene Ratio | Bg Ratio | pvalue | p.adjust | Count |
| GO:00070308 | Esophagus | ESCC | Golgi organization | 101/8552 | 157/18723 | 1.78e-06 | 2.10e-05 | 101 |
| GO:00070301 | Liver | Cirrhotic | Golgi organization | 68/4634 | 157/18723 | 2.57e-07 | 6.41e-06 | 68 |
| GO:00070302 | Liver | HCC | Golgi organization | 99/7958 | 157/18723 | 1.54e-07 | 2.85e-06 | 99 |
| GO:00070303 | Lung | IAC | Golgi organization | 32/2061 | 157/18723 | 4.13e-04 | 6.22e-03 | 32 |
| GO:000703011 | Lung | AIS | Golgi organization | 30/1849 | 157/18723 | 3.09e-04 | 5.63e-03 | 30 |
| GO:000703021 | Lung | MIAC | Golgi organization | 18/967 | 157/18723 | 1.27e-03 | 2.37e-02 | 18 |
| GO:00070307 | Oral cavity | OSCC | Golgi organization | 92/7305 | 157/18723 | 4.96e-07 | 7.27e-06 | 92 |
| GO:000703014 | Oral cavity | EOLP | Golgi organization | 37/2218 | 157/18723 | 2.83e-05 | 4.12e-04 | 37 |
| GO:000703022 | Oral cavity | NEOLP | Golgi organization | 29/2005 | 157/18723 | 2.40e-03 | 1.53e-02 | 29 |
| GO:00070306 | Prostate | BPH | Golgi organization | 39/3107 | 157/18723 | 5.20e-03 | 2.43e-02 | 39 |
| GO:000703013 | Prostate | Tumor | Golgi organization | 40/3246 | 157/18723 | 6.33e-03 | 2.90e-02 | 40 |
| GO:00070309 | Skin | cSCC | Golgi organization | 64/4864 | 157/18723 | 3.53e-05 | 3.83e-04 | 64 |
| GO:000703010 | Thyroid | PTC | Golgi organization | 79/5968 | 157/18723 | 1.11e-06 | 1.64e-05 | 79 |
| GO:000703015 | Thyroid | ATC | Golgi organization | 79/6293 | 157/18723 | 1.07e-05 | 1.05e-04 | 79 |
| Page: 1 |
| Pathway ID | Tissue | Disease Stage | Description | Gene Ratio | Bg Ratio | pvalue | p.adjust | qvalue | Count |
| hsa04152 | Colorectum | AD | AMPK signaling pathway | 47/2092 | 121/8465 | 3.74e-04 | 2.82e-03 | 1.80e-03 | 47 |
| hsa041521 | Colorectum | AD | AMPK signaling pathway | 47/2092 | 121/8465 | 3.74e-04 | 2.82e-03 | 1.80e-03 | 47 |
| hsa041522 | Colorectum | MSS | AMPK signaling pathway | 41/1875 | 121/8465 | 1.91e-03 | 9.83e-03 | 6.03e-03 | 41 |
| hsa041523 | Colorectum | MSS | AMPK signaling pathway | 41/1875 | 121/8465 | 1.91e-03 | 9.83e-03 | 6.03e-03 | 41 |
| hsa041524 | Colorectum | FAP | AMPK signaling pathway | 37/1404 | 121/8465 | 8.97e-05 | 8.56e-04 | 5.21e-04 | 37 |
| hsa041525 | Colorectum | FAP | AMPK signaling pathway | 37/1404 | 121/8465 | 8.97e-05 | 8.56e-04 | 5.21e-04 | 37 |
| hsa041526 | Colorectum | CRC | AMPK signaling pathway | 31/1091 | 121/8465 | 1.04e-04 | 1.57e-03 | 1.07e-03 | 31 |
| hsa041527 | Colorectum | CRC | AMPK signaling pathway | 31/1091 | 121/8465 | 1.04e-04 | 1.57e-03 | 1.07e-03 | 31 |
| hsa0415210 | Esophagus | ESCC | AMPK signaling pathway | 80/4205 | 121/8465 | 1.73e-04 | 6.67e-04 | 3.42e-04 | 80 |
| hsa0415213 | Esophagus | ESCC | AMPK signaling pathway | 80/4205 | 121/8465 | 1.73e-04 | 6.67e-04 | 3.42e-04 | 80 |
| hsa0415221 | Liver | Cirrhotic | AMPK signaling pathway | 49/2530 | 121/8465 | 7.90e-03 | 2.74e-02 | 1.69e-02 | 49 |
| hsa0415231 | Liver | Cirrhotic | AMPK signaling pathway | 49/2530 | 121/8465 | 7.90e-03 | 2.74e-02 | 1.69e-02 | 49 |
| hsa0415241 | Liver | HCC | AMPK signaling pathway | 77/4020 | 121/8465 | 2.32e-04 | 1.11e-03 | 6.18e-04 | 77 |
| hsa0415251 | Liver | HCC | AMPK signaling pathway | 77/4020 | 121/8465 | 2.32e-04 | 1.11e-03 | 6.18e-04 | 77 |
| hsa041529 | Oral cavity | OSCC | AMPK signaling pathway | 71/3704 | 121/8465 | 6.29e-04 | 1.86e-03 | 9.49e-04 | 71 |
| hsa0415212 | Oral cavity | OSCC | AMPK signaling pathway | 71/3704 | 121/8465 | 6.29e-04 | 1.86e-03 | 9.49e-04 | 71 |
| Page: 1 |
Top |
Cell-cell communication analysis |
| Identification of potential cell-cell interactions between two cell types and their ligand-receptor pairs for different disease states |
| Ligand | Receptor | LRpair | Pathway | Tissue | Disease Stage |
| Page: 1 |
Top |
Single-cell gene regulatory network inference analysis |
| Find out the significant the regulons (TFs) and the target genes of each regulon across cell types for different disease states |
| TF | Cell Type | Tissue | Disease Stage | Target Gene | RSS | Regulon Activity |
| RAB2A | FIB | Stomach | SIM | HEYL,THEM6,AGTRAP, etc. | 4.00e-02 |  |
| ∗The dot plots of a searched regulon are shown for all cell subpopulations in each disease state of each tissue based on the regulon specific score inferred using pySCENIC and by calculating the average expression. |
| Page: 1 |
Top |
Somatic mutation of malignant transformation related genes |
| Annotation of somatic variants for genes involved in malignant transformation |
| Hugo Symbol | Variant Class | Variant Classification | dbSNP RS | HGVSc | HGVSp | HGVSp Short | SWISSPROT | BIOTYPE | SIFT | PolyPhen | Tumor Sample Barcode | Tissue | Histology | Sex | Age | Stage | Therapy Types | Drugs | Outcome |
| RAB2A | SNV | Missense_Mutation | novel | c.127N>C | p.Phe43Leu | p.F43L | P61019 | protein_coding | deleterious(0.01) | probably_damaging(0.982) | TCGA-A7-A0CD-01 | Breast | breast invasive carcinoma | Female | >=65 | I/II | Hormone Therapy | arimidex | SD |
| RAB2A | SNV | Missense_Mutation | novel | c.545C>T | p.Ala182Val | p.A182V | P61019 | protein_coding | tolerated(0.24) | benign(0) | TCGA-AC-A3QP-01 | Breast | breast invasive carcinoma | Female | >=65 | I/II | Hormone Therapy | femara | SD |
| RAB2A | SNV | Missense_Mutation | c.380N>A | p.Arg127Lys | p.R127K | P61019 | protein_coding | deleterious(0) | probably_damaging(0.945) | TCGA-EA-A439-01 | Cervix | cervical & endocervical cancer | Female | <65 | I/II | Unknown | Unknown | PD | |
| RAB2A | SNV | Missense_Mutation | novel | c.461N>T | p.Ser154Phe | p.S154F | P61019 | protein_coding | tolerated(0.13) | benign(0.005) | TCGA-CA-6717-01 | Colorectum | colon adenocarcinoma | Male | <65 | I/II | Chemotherapy | oxaliplatin | CR |
| RAB2A | SNV | Missense_Mutation | c.535N>G | p.Asn179Asp | p.N179D | P61019 | protein_coding | tolerated(0.35) | benign(0) | TCGA-G4-6302-01 | Colorectum | colon adenocarcinoma | Female | >=65 | I/II | Unknown | Unknown | SD | |
| RAB2A | SNV | Missense_Mutation | novel | c.501N>G | p.Ile167Met | p.I167M | P61019 | protein_coding | deleterious(0) | probably_damaging(0.991) | TCGA-AP-A1E0-01 | Endometrium | uterine corpus endometrioid carcinoma | Female | <65 | III/IV | Chemotherapy | paclitaxel | SD |
| RAB2A | SNV | Missense_Mutation | novel | c.218G>T | p.Arg73Met | p.R73M | P61019 | protein_coding | deleterious(0) | probably_damaging(0.997) | TCGA-AX-A2HD-01 | Endometrium | uterine corpus endometrioid carcinoma | Female | >=65 | III/IV | Unknown | Unknown | SD |
| RAB2A | SNV | Missense_Mutation | c.539N>C | p.Asn180Thr | p.N180T | P61019 | protein_coding | tolerated(0.08) | benign(0.133) | TCGA-B5-A11E-01 | Endometrium | uterine corpus endometrioid carcinoma | Female | <65 | I/II | Unknown | Unknown | SD | |
| RAB2A | SNV | Missense_Mutation | novel | c.479T>G | p.Phe160Cys | p.F160C | P61019 | protein_coding | deleterious(0) | probably_damaging(0.999) | TCGA-B5-A1MR-01 | Endometrium | uterine corpus endometrioid carcinoma | Female | >=65 | III/IV | Unknown | Unknown | SD |
| RAB2A | SNV | Missense_Mutation | c.455N>G | p.Thr152Ser | p.T152S | P61019 | protein_coding | tolerated(0.17) | benign(0.124) | TCGA-D1-A17H-01 | Endometrium | uterine corpus endometrioid carcinoma | Female | <65 | I/II | Unknown | Unknown | SD |
| Page: 1 2 |
Top |
Related drugs of malignant transformation related genes |
| Identification of chemicals and drugs interact with genes involved in malignant transfromation |
| (DGIdb 4.0) |
| Entrez ID | Symbol | Category | Interaction Types | Drug Claim Name | Drug Name | PMIDs |
| Page: 1 |

Copyright 2023-Present -The University of Texas Health Science Center at Houston |