
|
|||||
|
 | |
| |
| |
| |
| |
| |
|
Gene: PSME1 |
Gene summary for PSME1 |
| Gene information | Species | Human | Gene symbol | PSME1 | Gene ID | 5720 |
| Gene name | proteasome activator subunit 1 | |
| Gene Alias | HEL-S-129m | |
| Cytomap | 14q12 | |
| Gene Type | protein-coding | GO ID | GO:0000082 | UniProtAcc | Q06323 |
Top |
Malignant transformation analysis |
| Identification of the aberrant gene expression in precancerous and cancerous lesions by comparing the gene expression of stem-like cells in diseased tissues with normal stem cells |
| Entrez ID | Symbol | Replicates | Species | Organ | Tissue | Adj P-value | Log2FC | Malignancy |
| 5720 | PSME1 | 052097_1595-all-cells | Human | Prostate | BPH | 2.51e-10 | -4.59e-01 | 0.0972 |
| 5720 | PSME1 | 052099_1652-all-cells | Human | Prostate | BPH | 2.44e-09 | -4.55e-01 | 0.1038 |
| 5720 | PSME1 | Dong_P1 | Human | Prostate | Tumor | 4.46e-18 | 3.03e-01 | 0.035 |
| 5720 | PSME1 | Dong_P3 | Human | Prostate | Tumor | 4.14e-11 | 2.76e-01 | 0.0278 |
| 5720 | PSME1 | Dong_P4 | Human | Prostate | Tumor | 1.37e-02 | 3.51e-01 | 0.0292 |
| 5720 | PSME1 | Dong_P5 | Human | Prostate | Tumor | 2.26e-18 | 1.48e-01 | 0.053 |
| 5720 | PSME1 | GSM5353215_PA_AUG_PB_1B_S2 | Human | Prostate | Tumor | 1.38e-02 | 1.01e-01 | 0.1557 |
| 5720 | PSME1 | GSM5353216_PA_PB1A_Pool_1_3_S50_L002 | Human | Prostate | Tumor | 3.62e-07 | 4.72e-01 | 0.159 |
| 5720 | PSME1 | GSM5353227_PA_PR5199-193K_Pool_1_2_3_S55_L002 | Human | Prostate | Tumor | 6.30e-06 | 1.59e-01 | 0.1602 |
| 5720 | PSME1 | GSM5353236_PA_PR5251_T1_S7_L001 | Human | Prostate | Tumor | 1.14e-02 | 2.45e-01 | 0.1608 |
| 5720 | PSME1 | GSM5353240_PA_PR5254_T1_S15_L001 | Human | Prostate | Tumor | 3.53e-05 | -2.47e-03 | 0.1575 |
| 5720 | PSME1 | GSM5353243_PA_PR5261_T1_S23_L002 | Human | Prostate | Tumor | 2.05e-17 | -2.15e-01 | 0.1545 |
| 5720 | PSME1 | GSM5353244_PA_PR5261_T2_S24_L002 | Human | Prostate | Tumor | 1.40e-09 | -2.02e-01 | 0.1569 |
| 5720 | PSME1 | GSM5353247_PA_PR5269_3_S27_L002 | Human | Prostate | Tumor | 1.67e-02 | -2.47e-02 | 0.1532 |
| 5720 | PSME1 | P4_S8_cSCC | Human | Skin | cSCC | 6.91e-12 | -7.53e-02 | -0.3095 |
| 5720 | PSME1 | P5_S10_cSCC | Human | Skin | cSCC | 2.83e-26 | 5.23e-01 | -0.299 |
| 5720 | PSME1 | P1_cSCC | Human | Skin | cSCC | 4.08e-67 | 2.69e+00 | 0.0292 |
| 5720 | PSME1 | P2_cSCC | Human | Skin | cSCC | 2.51e-41 | 1.60e+00 | -0.024 |
| 5720 | PSME1 | P4_cSCC | Human | Skin | cSCC | 5.67e-82 | 2.18e+00 | -0.00290000000000005 |
| 5720 | PSME1 | P10_cSCC | Human | Skin | cSCC | 4.61e-51 | 1.81e+00 | 0.1017 |
| Page: 1 2 3 4 5 6 7 8 9 10 11 12 13 |
| Tissue | Expression Dynamics | Abbreviation |
| Cervix | 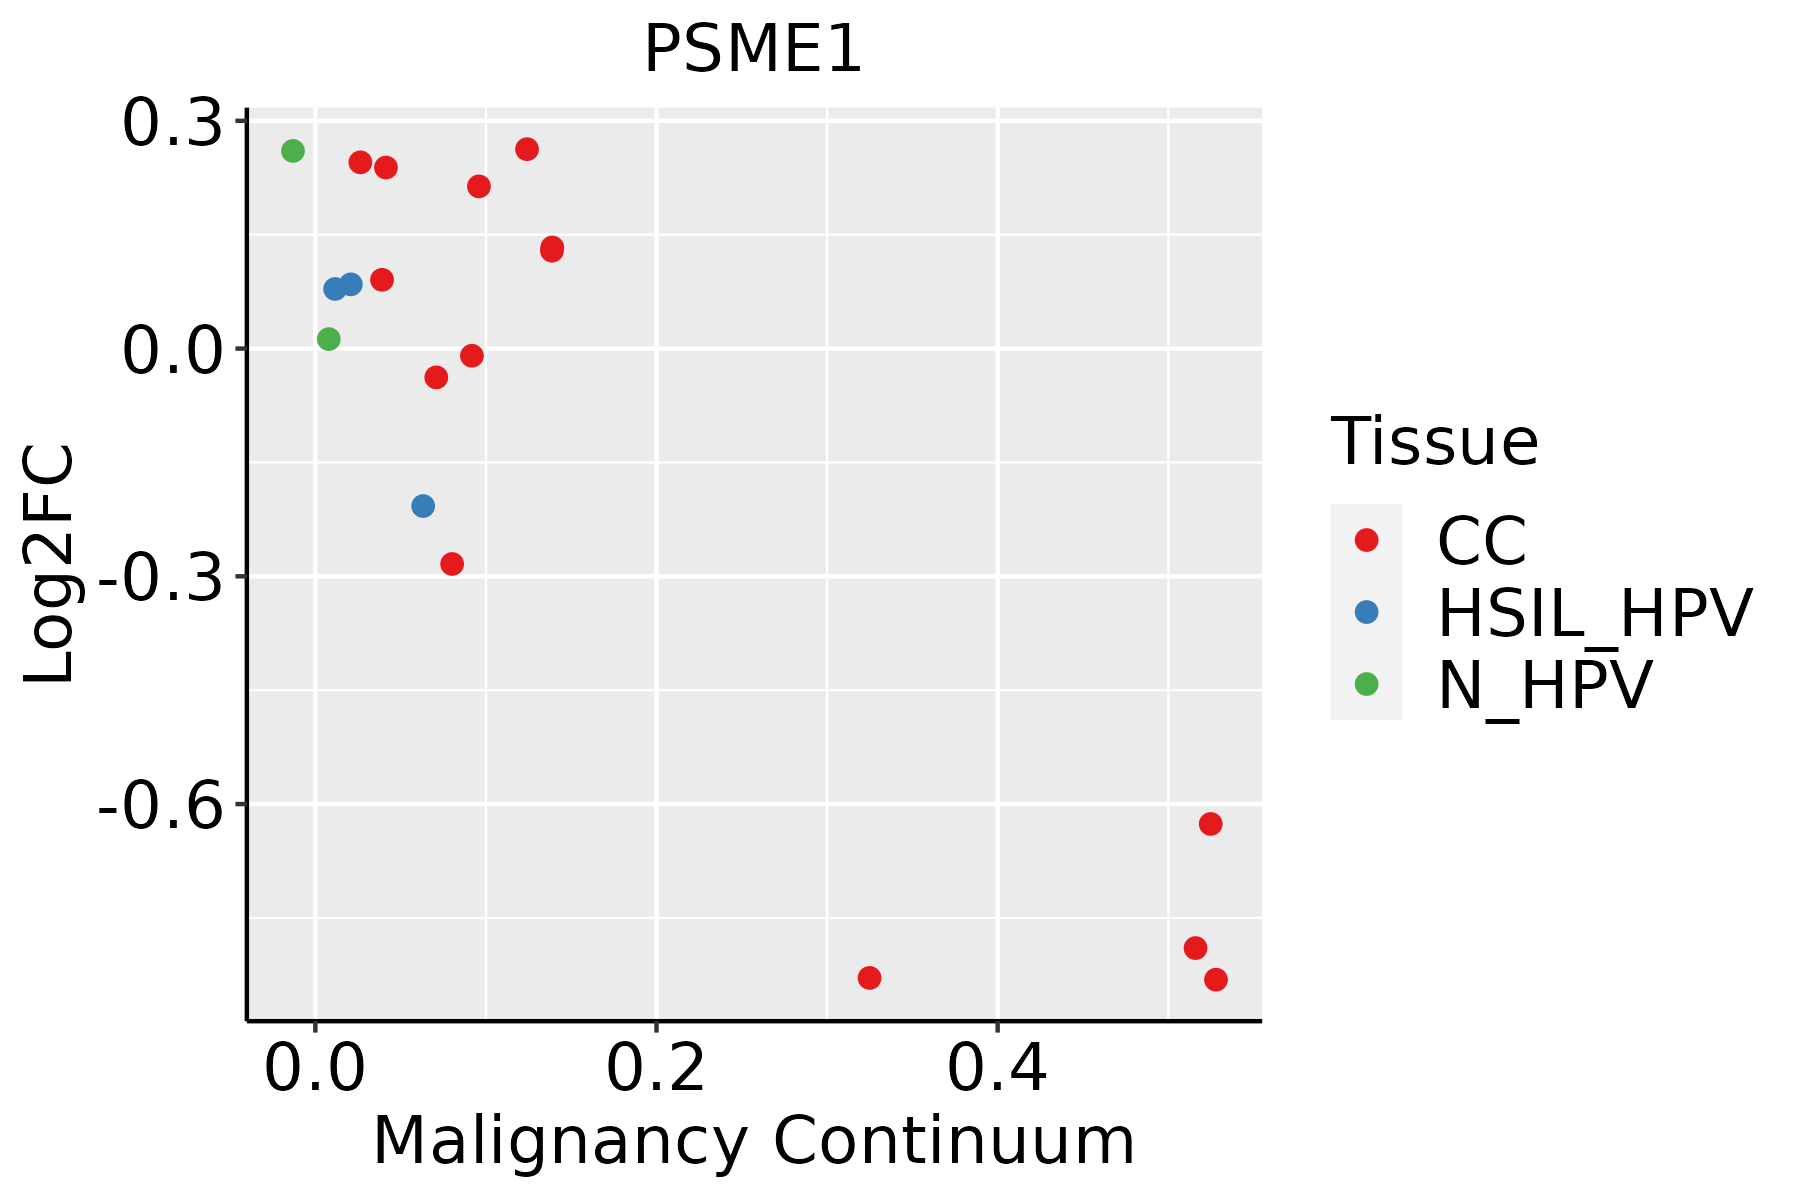 | CC: Cervix cancer |
| HSIL_HPV: HPV-infected high-grade squamous intraepithelial lesions | ||
| N_HPV: HPV-infected normal cervix | ||
| Colorectum (GSE201348) |  | FAP: Familial adenomatous polyposis |
| CRC: Colorectal cancer | ||
| Colorectum (HTA11) |  | AD: Adenomas |
| SER: Sessile serrated lesions | ||
| MSI-H: Microsatellite-high colorectal cancer | ||
| MSS: Microsatellite stable colorectal cancer | ||
| Endometrium | 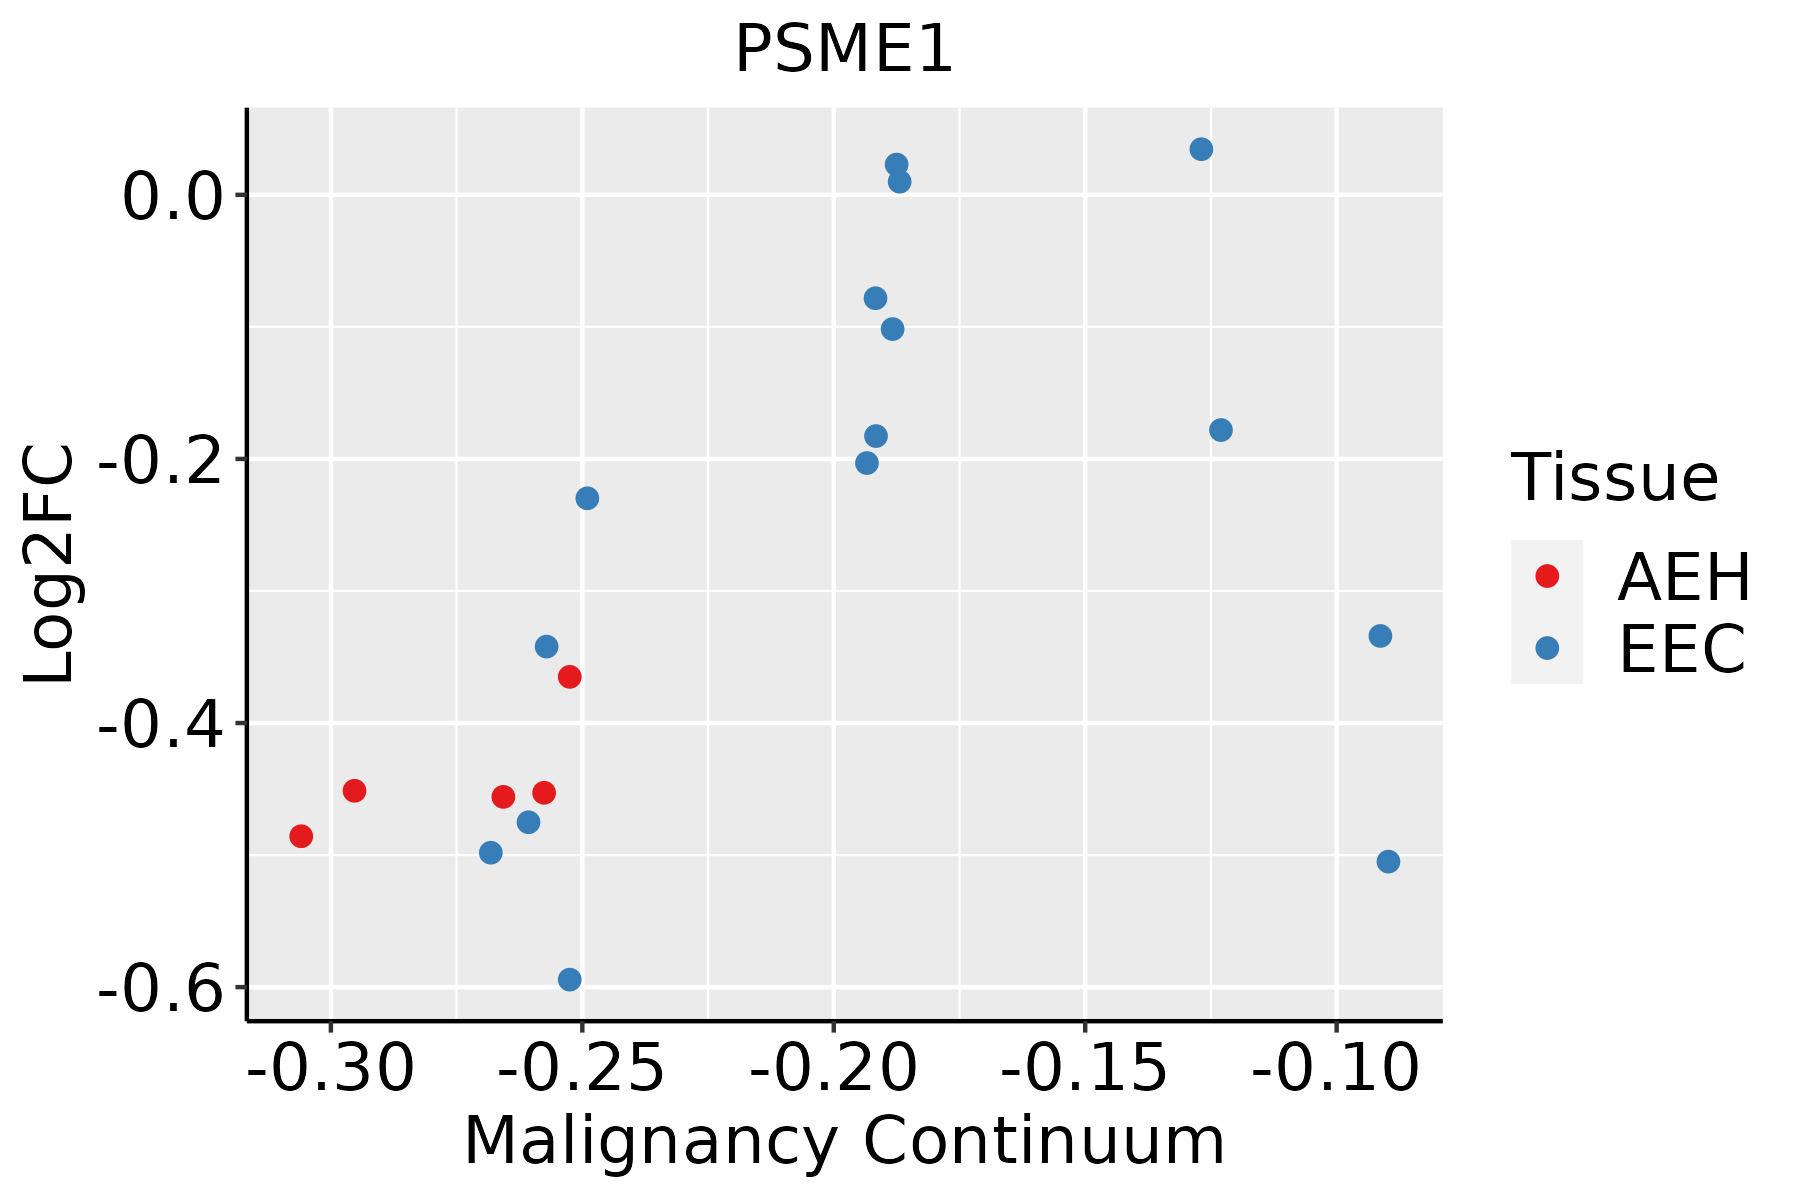 | AEH: Atypical endometrial hyperplasia |
| EEC: Endometrioid Cancer | ||
| Esophagus | 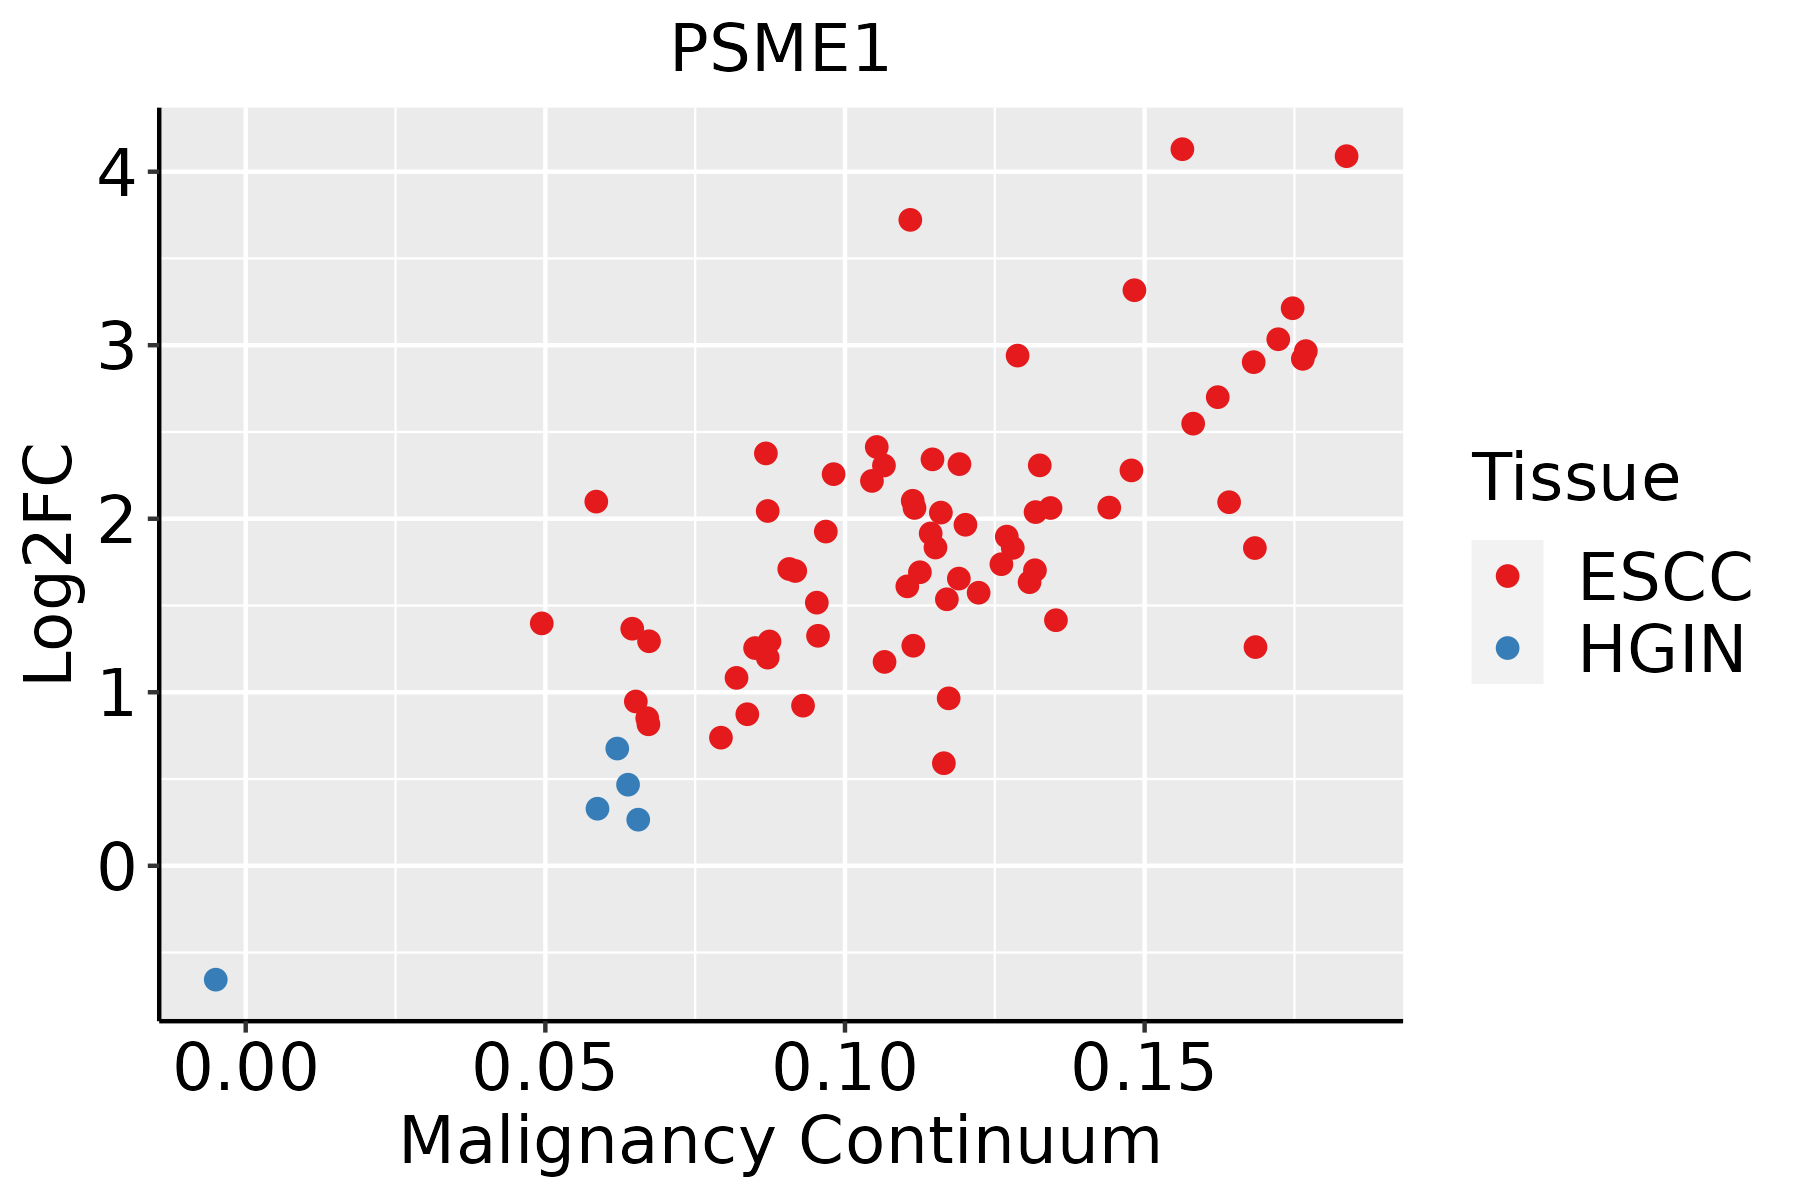 | ESCC: Esophageal squamous cell carcinoma |
| HGIN: High-grade intraepithelial neoplasias | ||
| LGIN: Low-grade intraepithelial neoplasias | ||
| GC | 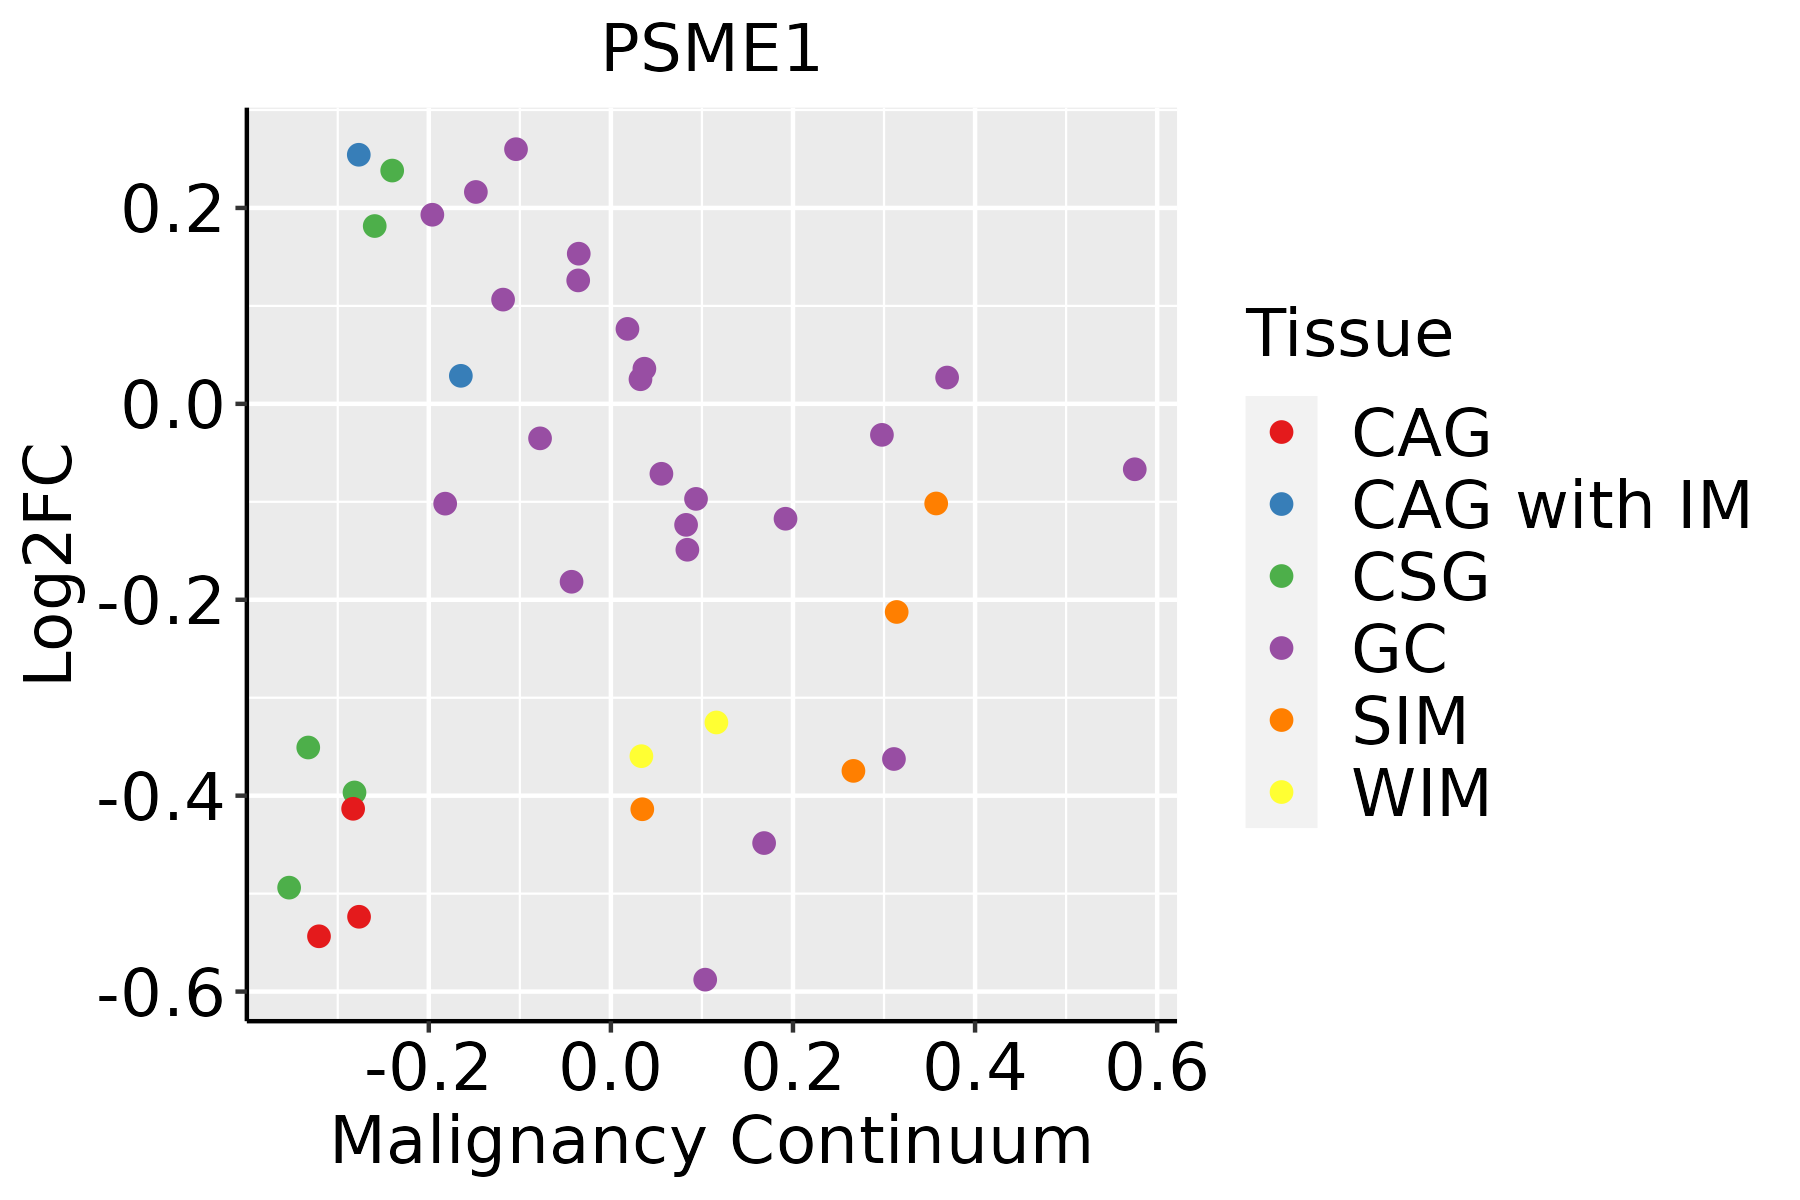 | CAG: Chronic atrophic gastritis |
| CAG with IM: Chronic atrophic gastritis with intestinal metaplasia | ||
| CSG: Chronic superficial gastritis | ||
| GC: Gastric cancer | ||
| SIM: Severe intestinal metaplasia | ||
| WIM: Wild intestinal metaplasia | ||
| Liver |  | HCC: Hepatocellular carcinoma |
| NAFLD: Non-alcoholic fatty liver disease | ||
| Oral Cavity |  | EOLP: Erosive Oral lichen planus |
| LP: leukoplakia | ||
| NEOLP: Non-erosive oral lichen planus | ||
| OSCC: Oral squamous cell carcinoma | ||
| Prostate |  | BPH: Benign Prostatic Hyperplasia |
| Skin | 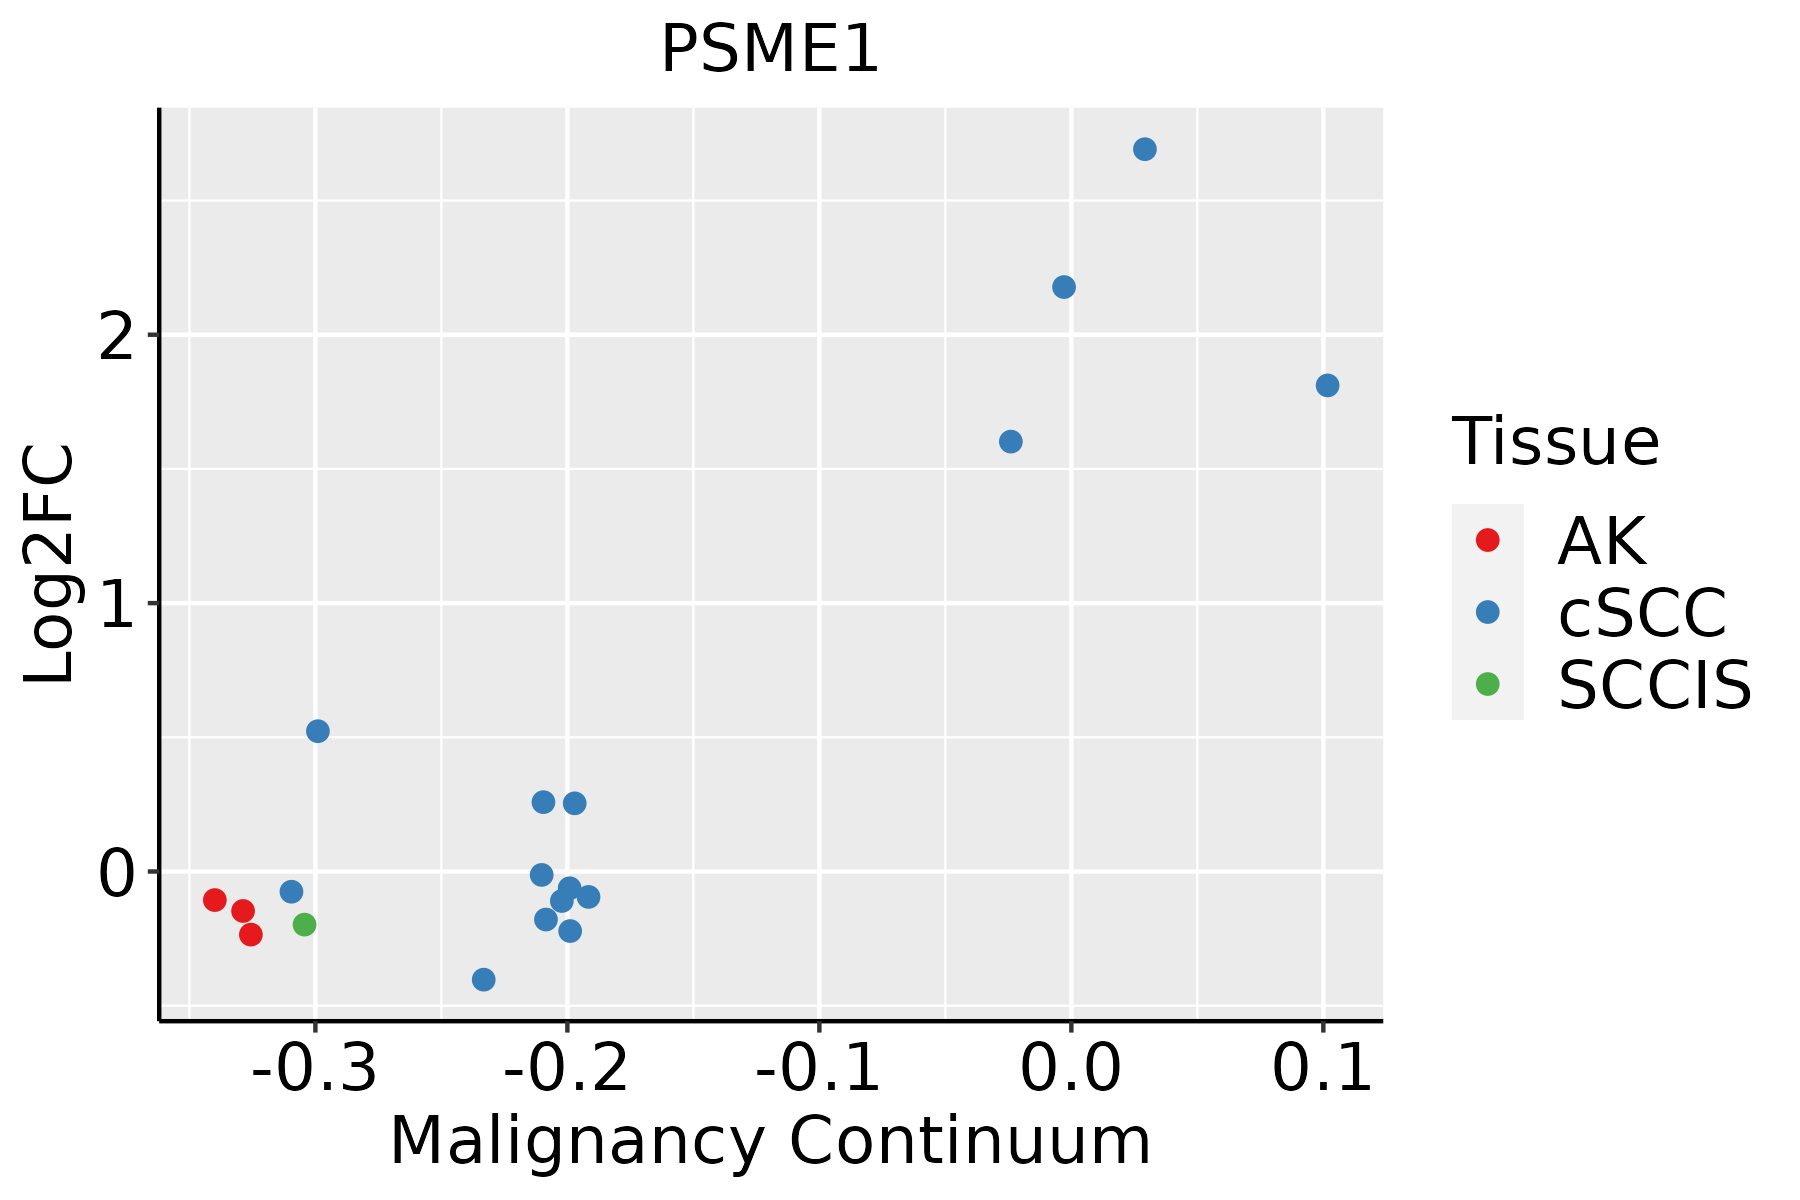 | AK: Actinic keratosis |
| cSCC: Cutaneous squamous cell carcinoma | ||
| SCCIS:squamous cell carcinoma in situ | ||
| Thyroid | 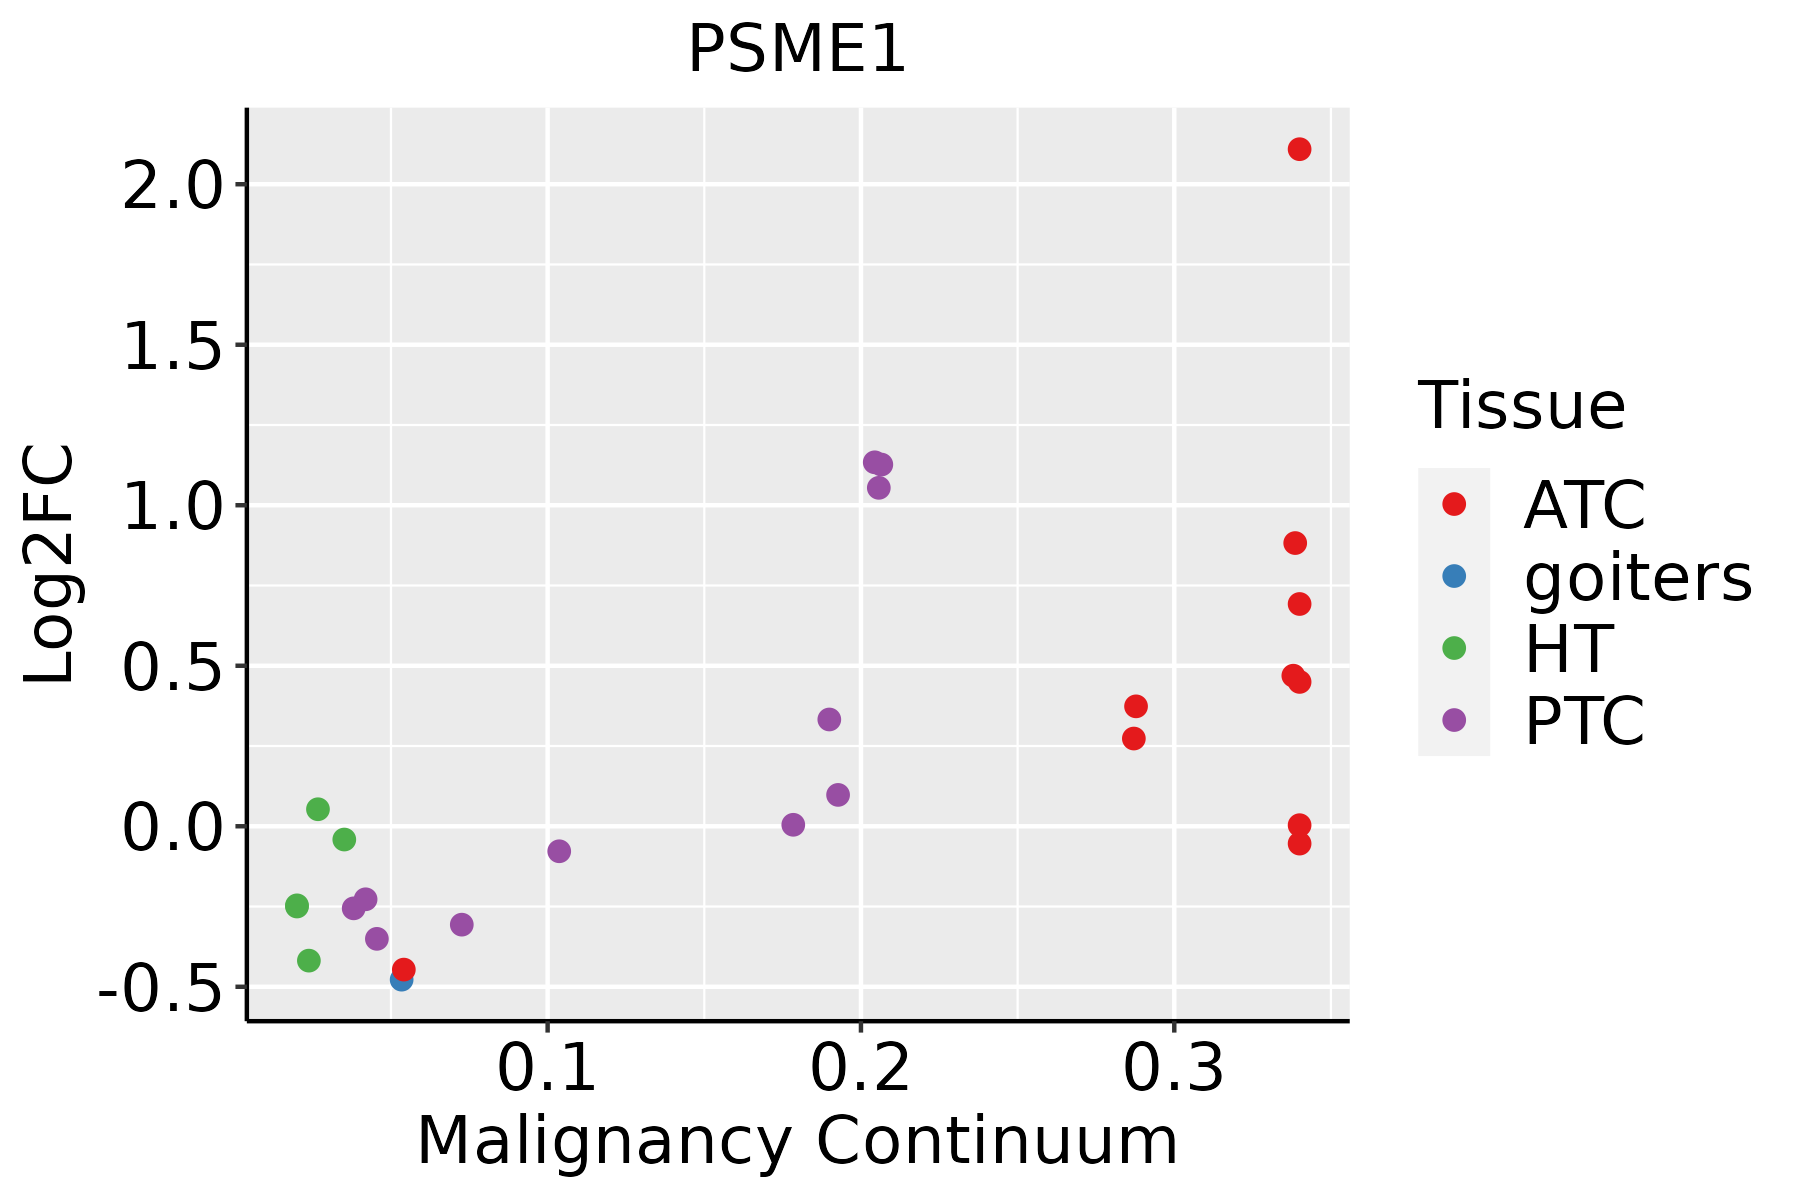 | ATC: Anaplastic thyroid cancer |
| HT: Hashimoto's thyroiditis | ||
| PTC: Papillary thyroid cancer |
| ∗log2FC in expression of this searched gene in stem-like cells from each diseased tissue sample relative to stem-like cells in normal samples in each tissue plotted against the malignancy continuum. Samples are colored based on if they are from different disease stage. |
Top |
Malignant transformation related pathway analysis |
| Find out the enriched GO biological processes and KEGG pathways involved in transition from healthy to precancer to cancer |
| Tissue | Disease Stage | Enriched GO biological Processes |
| Colorectum | AD |  |
| Colorectum | SER |  |
| Colorectum | MSS |  |
| Colorectum | MSI-H |  |
| Colorectum | FAP |  |
| ∗Top 15 enriched GO BP terms are showed in the bar plot of each disease state in each tissue. Each row represents a significant GO biological process which is colored according to the -log10(p.adjust). |
| Page: 1 2 3 4 5 6 7 8 9 |
| GO ID | Tissue | Disease Stage | Description | Gene Ratio | Bg Ratio | pvalue | p.adjust | Count |
| GO:004217610 | Cervix | CC | regulation of protein catabolic process | 104/2311 | 391/18723 | 9.39e-15 | 9.36e-12 | 104 |
| GO:005254710 | Cervix | CC | regulation of peptidase activity | 112/2311 | 461/18723 | 6.70e-13 | 3.08e-10 | 112 |
| GO:004586210 | Cervix | CC | positive regulation of proteolysis | 95/2311 | 372/18723 | 1.84e-12 | 6.86e-10 | 95 |
| GO:190336210 | Cervix | CC | regulation of cellular protein catabolic process | 72/2311 | 255/18723 | 5.98e-12 | 2.10e-09 | 72 |
| GO:005254810 | Cervix | CC | regulation of endopeptidase activity | 103/2311 | 432/18723 | 1.89e-11 | 5.14e-09 | 103 |
| GO:001049810 | Cervix | CC | proteasomal protein catabolic process | 111/2311 | 490/18723 | 8.98e-11 | 1.58e-08 | 111 |
| GO:190305010 | Cervix | CC | regulation of proteolysis involved in cellular protein catabolic process | 60/2311 | 221/18723 | 1.82e-09 | 1.98e-07 | 60 |
| GO:001095210 | Cervix | CC | positive regulation of peptidase activity | 54/2311 | 197/18723 | 8.06e-09 | 6.99e-07 | 54 |
| GO:001095010 | Cervix | CC | positive regulation of endopeptidase activity | 48/2311 | 179/18723 | 1.12e-07 | 5.71e-06 | 48 |
| GO:001988410 | Cervix | CC | antigen processing and presentation of exogenous antigen | 20/2311 | 47/18723 | 2.18e-07 | 9.57e-06 | 20 |
| GO:00447725 | Cervix | CC | mitotic cell cycle phase transition | 89/2311 | 424/18723 | 2.70e-07 | 1.12e-05 | 89 |
| GO:006113610 | Cervix | CC | regulation of proteasomal protein catabolic process | 48/2311 | 187/18723 | 4.63e-07 | 1.77e-05 | 48 |
| GO:001988210 | Cervix | CC | antigen processing and presentation | 32/2311 | 106/18723 | 8.61e-07 | 3.08e-05 | 32 |
| GO:20000453 | Cervix | CC | regulation of G1/S transition of mitotic cell cycle | 37/2311 | 142/18723 | 6.33e-06 | 1.53e-04 | 37 |
| GO:00000824 | Cervix | CC | G1/S transition of mitotic cell cycle | 49/2311 | 214/18723 | 1.16e-05 | 2.48e-04 | 49 |
| GO:19028062 | Cervix | CC | regulation of cell cycle G1/S phase transition | 41/2311 | 168/18723 | 1.18e-05 | 2.51e-04 | 41 |
| GO:00073466 | Cervix | CC | regulation of mitotic cell cycle | 88/2311 | 457/18723 | 1.26e-05 | 2.60e-04 | 88 |
| GO:19019903 | Cervix | CC | regulation of mitotic cell cycle phase transition | 63/2311 | 299/18723 | 1.27e-05 | 2.60e-04 | 63 |
| GO:00448434 | Cervix | CC | cell cycle G1/S phase transition | 53/2311 | 241/18723 | 1.76e-05 | 3.32e-04 | 53 |
| GO:19019873 | Cervix | CC | regulation of cell cycle phase transition | 74/2311 | 390/18723 | 9.80e-05 | 1.27e-03 | 74 |
| Page: 1 2 3 4 5 6 7 8 9 10 11 12 13 14 15 16 17 18 19 20 21 22 23 |
| Pathway ID | Tissue | Disease Stage | Description | Gene Ratio | Bg Ratio | pvalue | p.adjust | qvalue | Count |
| hsa0461220 | Cervix | CC | Antigen processing and presentation | 34/1267 | 78/8465 | 1.06e-09 | 2.14e-08 | 1.26e-08 | 34 |
| hsa0305014 | Cervix | CC | Proteasome | 16/1267 | 46/8465 | 6.69e-04 | 3.09e-03 | 1.83e-03 | 16 |
| hsa04612110 | Cervix | CC | Antigen processing and presentation | 34/1267 | 78/8465 | 1.06e-09 | 2.14e-08 | 1.26e-08 | 34 |
| hsa0305015 | Cervix | CC | Proteasome | 16/1267 | 46/8465 | 6.69e-04 | 3.09e-03 | 1.83e-03 | 16 |
| hsa0461243 | Cervix | N_HPV | Antigen processing and presentation | 20/349 | 78/8465 | 2.61e-11 | 1.42e-09 | 1.11e-09 | 20 |
| hsa0461253 | Cervix | N_HPV | Antigen processing and presentation | 20/349 | 78/8465 | 2.61e-11 | 1.42e-09 | 1.11e-09 | 20 |
| hsa03050 | Colorectum | AD | Proteasome | 29/2092 | 46/8465 | 3.87e-08 | 6.18e-07 | 3.94e-07 | 29 |
| hsa030501 | Colorectum | AD | Proteasome | 29/2092 | 46/8465 | 3.87e-08 | 6.18e-07 | 3.94e-07 | 29 |
| hsa030502 | Colorectum | SER | Proteasome | 24/1580 | 46/8465 | 3.05e-07 | 5.96e-06 | 4.33e-06 | 24 |
| hsa04612 | Colorectum | SER | Antigen processing and presentation | 25/1580 | 78/8465 | 3.11e-03 | 2.11e-02 | 1.53e-02 | 25 |
| hsa030503 | Colorectum | SER | Proteasome | 24/1580 | 46/8465 | 3.05e-07 | 5.96e-06 | 4.33e-06 | 24 |
| hsa046121 | Colorectum | SER | Antigen processing and presentation | 25/1580 | 78/8465 | 3.11e-03 | 2.11e-02 | 1.53e-02 | 25 |
| hsa030504 | Colorectum | MSS | Proteasome | 29/1875 | 46/8465 | 2.72e-09 | 5.69e-08 | 3.48e-08 | 29 |
| hsa046122 | Colorectum | MSS | Antigen processing and presentation | 27/1875 | 78/8465 | 7.72e-03 | 2.91e-02 | 1.78e-02 | 27 |
| hsa030505 | Colorectum | MSS | Proteasome | 29/1875 | 46/8465 | 2.72e-09 | 5.69e-08 | 3.48e-08 | 29 |
| hsa046123 | Colorectum | MSS | Antigen processing and presentation | 27/1875 | 78/8465 | 7.72e-03 | 2.91e-02 | 1.78e-02 | 27 |
| hsa030506 | Colorectum | MSI-H | Proteasome | 23/797 | 46/8465 | 1.86e-12 | 4.64e-11 | 3.89e-11 | 23 |
| hsa046124 | Colorectum | MSI-H | Antigen processing and presentation | 23/797 | 78/8465 | 4.15e-07 | 7.91e-06 | 6.63e-06 | 23 |
| hsa030507 | Colorectum | MSI-H | Proteasome | 23/797 | 46/8465 | 1.86e-12 | 4.64e-11 | 3.89e-11 | 23 |
| hsa046125 | Colorectum | MSI-H | Antigen processing and presentation | 23/797 | 78/8465 | 4.15e-07 | 7.91e-06 | 6.63e-06 | 23 |
| Page: 1 2 3 4 |
Top |
Cell-cell communication analysis |
| Identification of potential cell-cell interactions between two cell types and their ligand-receptor pairs for different disease states |
| Ligand | Receptor | LRpair | Pathway | Tissue | Disease Stage |
| Page: 1 |
Top |
Single-cell gene regulatory network inference analysis |
| Find out the significant the regulons (TFs) and the target genes of each regulon across cell types for different disease states |
| TF | Cell Type | Tissue | Disease Stage | Target Gene | RSS | Regulon Activity |
| ∗The dot plots of a searched regulon are shown for all cell subpopulations in each disease state of each tissue based on the regulon specific score inferred using pySCENIC and by calculating the average expression. |
| Page: 1 |
Top |
Somatic mutation of malignant transformation related genes |
| Annotation of somatic variants for genes involved in malignant transformation |
| Hugo Symbol | Variant Class | Variant Classification | dbSNP RS | HGVSc | HGVSp | HGVSp Short | SWISSPROT | BIOTYPE | SIFT | PolyPhen | Tumor Sample Barcode | Tissue | Histology | Sex | Age | Stage | Therapy Types | Drugs | Outcome |
| PSME1 | insertion | Frame_Shift_Ins | novel | c.524_525insT | p.Lys176Ter | p.K176* | Q06323 | protein_coding | TCGA-AR-A2LE-01 | Breast | breast invasive carcinoma | Female | >=65 | I/II | Hormone Therapy | tamoxiphen | PD | ||
| PSME1 | SNV | Missense_Mutation | novel | c.541N>T | p.Arg181Cys | p.R181C | Q06323 | protein_coding | deleterious(0) | probably_damaging(0.937) | TCGA-2W-A8YY-01 | Cervix | cervical & endocervical cancer | Female | <65 | I/II | Chemotherapy | cisplatin | CR |
| PSME1 | SNV | Missense_Mutation | novel | c.61N>T | p.Leu21Phe | p.L21F | Q06323 | protein_coding | deleterious(0.05) | benign(0.031) | TCGA-AP-A059-01 | Endometrium | uterine corpus endometrioid carcinoma | Female | >=65 | I/II | Unknown | Unknown | SD |
| PSME1 | SNV | Missense_Mutation | novel | c.366N>T | p.Lys122Asn | p.K122N | Q06323 | protein_coding | tolerated(0.14) | possibly_damaging(0.819) | TCGA-AP-A1DV-01 | Endometrium | uterine corpus endometrioid carcinoma | Female | <65 | I/II | Unknown | Unknown | SD |
| PSME1 | SNV | Missense_Mutation | novel | c.521N>C | p.Ile174Thr | p.I174T | Q06323 | protein_coding | deleterious(0.02) | possibly_damaging(0.902) | TCGA-B5-A1MR-01 | Endometrium | uterine corpus endometrioid carcinoma | Female | >=65 | III/IV | Unknown | Unknown | SD |
| PSME1 | SNV | Missense_Mutation | novel | c.534C>A | p.Phe178Leu | p.F178L | Q06323 | protein_coding | tolerated(0.08) | benign(0.028) | TCGA-E6-A1LX-01 | Endometrium | uterine corpus endometrioid carcinoma | Female | <65 | I/II | Unknown | Unknown | SD |
| PSME1 | SNV | Missense_Mutation | c.320N>G | p.Asn107Ser | p.N107S | Q06323 | protein_coding | deleterious(0.02) | probably_damaging(0.996) | TCGA-FI-A2EX-01 | Endometrium | uterine corpus endometrioid carcinoma | Female | <65 | III/IV | Chemotherapy | carboplatinum | PD | |
| PSME1 | SNV | Missense_Mutation | novel | c.169N>G | p.Leu57Val | p.L57V | Q06323 | protein_coding | tolerated(0.06) | possibly_damaging(0.762) | TCGA-83-5908-01 | Lung | lung adenocarcinoma | Female | <65 | I/II | Unknown | Unknown | SD |
| PSME1 | SNV | Missense_Mutation | novel | c.270N>C | p.Lys90Asn | p.K90N | Q06323 | protein_coding | tolerated(0.14) | benign(0.015) | TCGA-BA-5152-01 | Oral cavity | head & neck squamous cell carcinoma | Male | <65 | I/II | Unknown | Unknown | SD |
| PSME1 | SNV | Missense_Mutation | c.163A>G | p.Ser55Gly | p.S55G | Q06323 | protein_coding | deleterious(0.04) | possibly_damaging(0.519) | TCGA-HC-A6AS-01 | Prostate | prostate adenocarcinoma | Male | >=65 | 7 | Unknown | Unknown | SD |
| Page: 1 2 |
Top |
Related drugs of malignant transformation related genes |
| Identification of chemicals and drugs interact with genes involved in malignant transfromation |
| (DGIdb 4.0) |
| Entrez ID | Symbol | Category | Interaction Types | Drug Claim Name | Drug Name | PMIDs |
| 5720 | PSME1 | NA | inhibitor | BORTEZOMIB | BORTEZOMIB | |
| 5720 | PSME1 | NA | inhibitor | CARFILZOMIB | CARFILZOMIB |
| Page: 1 |

Copyright 2023-Present -The University of Texas Health Science Center at Houston |