| Entrez ID | Symbol | Replicates | Species | Organ | Tissue | Adj P-value | Log2FC | Malignancy |
| 55660 | PRPF40A | GSM5353221_PA_PB2A_Pool_1_3_S25_L001 | Human | Prostate | Tumor | 1.27e-03 | 4.54e-01 | 0.1633 |
| 55660 | PRPF40A | GSM5353222_PA_PB2B_Pool_1_3_S52_L002 | Human | Prostate | Tumor | 4.08e-06 | 4.14e-01 | 0.1608 |
| 55660 | PRPF40A | GSM5353223_PA_PB2B_Pool_2_S26_L001 | Human | Prostate | Tumor | 5.78e-05 | 4.83e-01 | 0.1604 |
| 55660 | PRPF40A | GSM5353227_PA_PR5199-193K_Pool_1_2_3_S55_L002 | Human | Prostate | Tumor | 2.23e-06 | 3.77e-01 | 0.1602 |
| 55660 | PRPF40A | GSM5353232_PA_PR5249_T1_S3_L001 | Human | Prostate | Tumor | 2.83e-03 | 2.52e-01 | 0.1439 |
| 55660 | PRPF40A | GSM5353236_PA_PR5251_T1_S7_L001 | Human | Prostate | Tumor | 1.06e-02 | 3.62e-01 | 0.1608 |
| 55660 | PRPF40A | GSM5353240_PA_PR5254_T1_S15_L001 | Human | Prostate | Tumor | 1.58e-07 | 2.93e-01 | 0.1575 |
| 55660 | PRPF40A | GSM5353243_PA_PR5261_T1_S23_L002 | Human | Prostate | Tumor | 1.36e-18 | 2.84e-01 | 0.1545 |
| 55660 | PRPF40A | GSM5353244_PA_PR5261_T2_S24_L002 | Human | Prostate | Tumor | 1.95e-12 | 2.39e-01 | 0.1569 |
| 55660 | PRPF40A | P1_S1_AK | Human | Skin | AK | 2.53e-09 | 4.43e-01 | -0.3399 |
| 55660 | PRPF40A | P2_S3_AK | Human | Skin | AK | 1.13e-06 | 3.11e-01 | -0.3287 |
| 55660 | PRPF40A | P3_S6_AK | Human | Skin | AK | 2.28e-03 | 2.99e-01 | -0.3256 |
| 55660 | PRPF40A | P4_S8_cSCC | Human | Skin | cSCC | 1.42e-19 | 4.01e-01 | -0.3095 |
| 55660 | PRPF40A | P5_S10_cSCC | Human | Skin | cSCC | 3.96e-13 | 2.71e-01 | -0.299 |
| 55660 | PRPF40A | P1_cSCC | Human | Skin | cSCC | 1.29e-48 | 1.53e+00 | 0.0292 |
| 55660 | PRPF40A | P2_cSCC | Human | Skin | cSCC | 2.27e-34 | 9.71e-01 | -0.024 |
| 55660 | PRPF40A | P4_cSCC | Human | Skin | cSCC | 1.42e-51 | 1.25e+00 | -0.00290000000000005 |
| 55660 | PRPF40A | P10_cSCC | Human | Skin | cSCC | 1.54e-43 | 1.30e+00 | 0.1017 |
| 55660 | PRPF40A | cSCC_p7 | Human | Skin | cSCC | 1.86e-05 | -1.09e-01 | -0.2332 |
| 55660 | PRPF40A | cSCC_p8 | Human | Skin | cSCC | 1.13e-06 | 1.66e-01 | -0.1971 |
| Tissue | Expression Dynamics | Abbreviation |
| Breast | 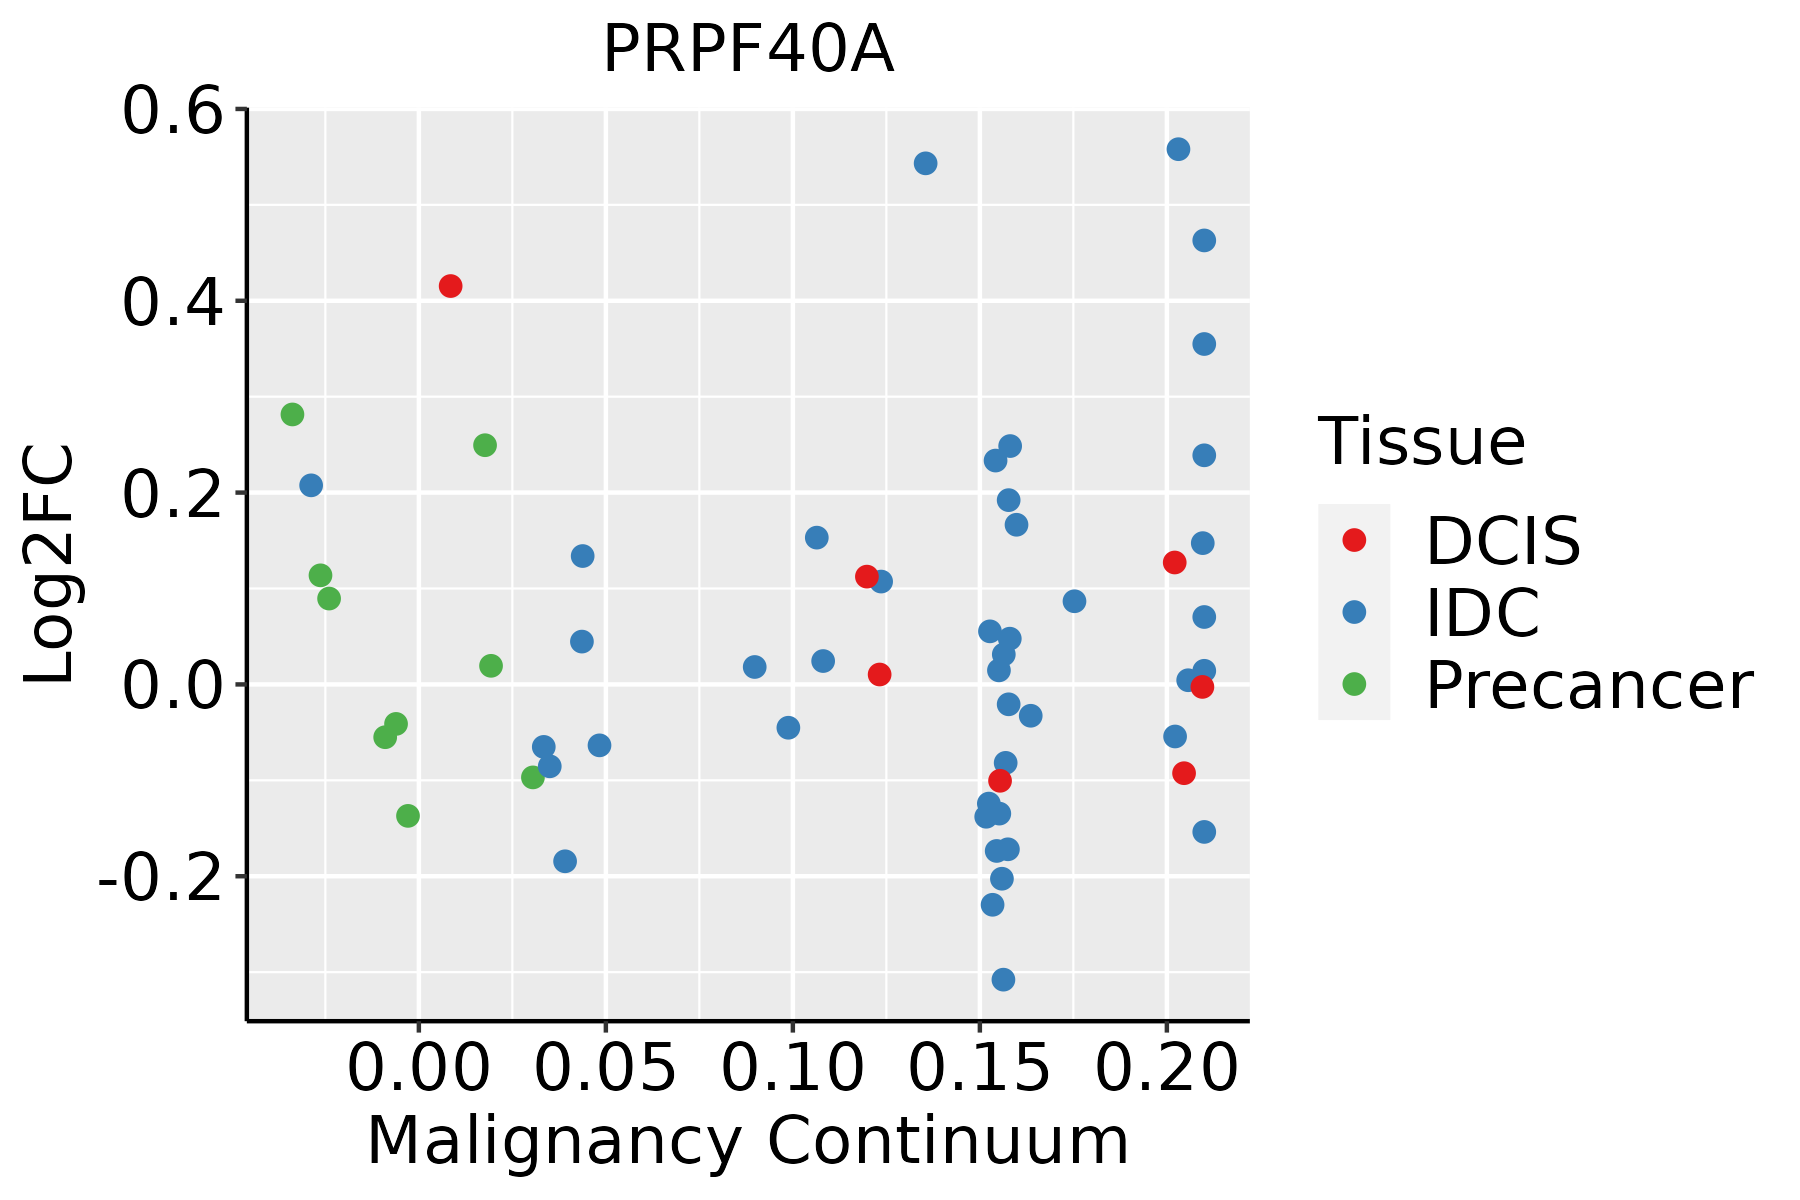 | IDC: Invasive ductal carcinoma |
| DCIS: Ductal carcinoma in situ |
| Precancer(BRCA1-mut): Precancerous lesion from BRCA1 mutation carriers |
| Colorectum (GSE201348) | 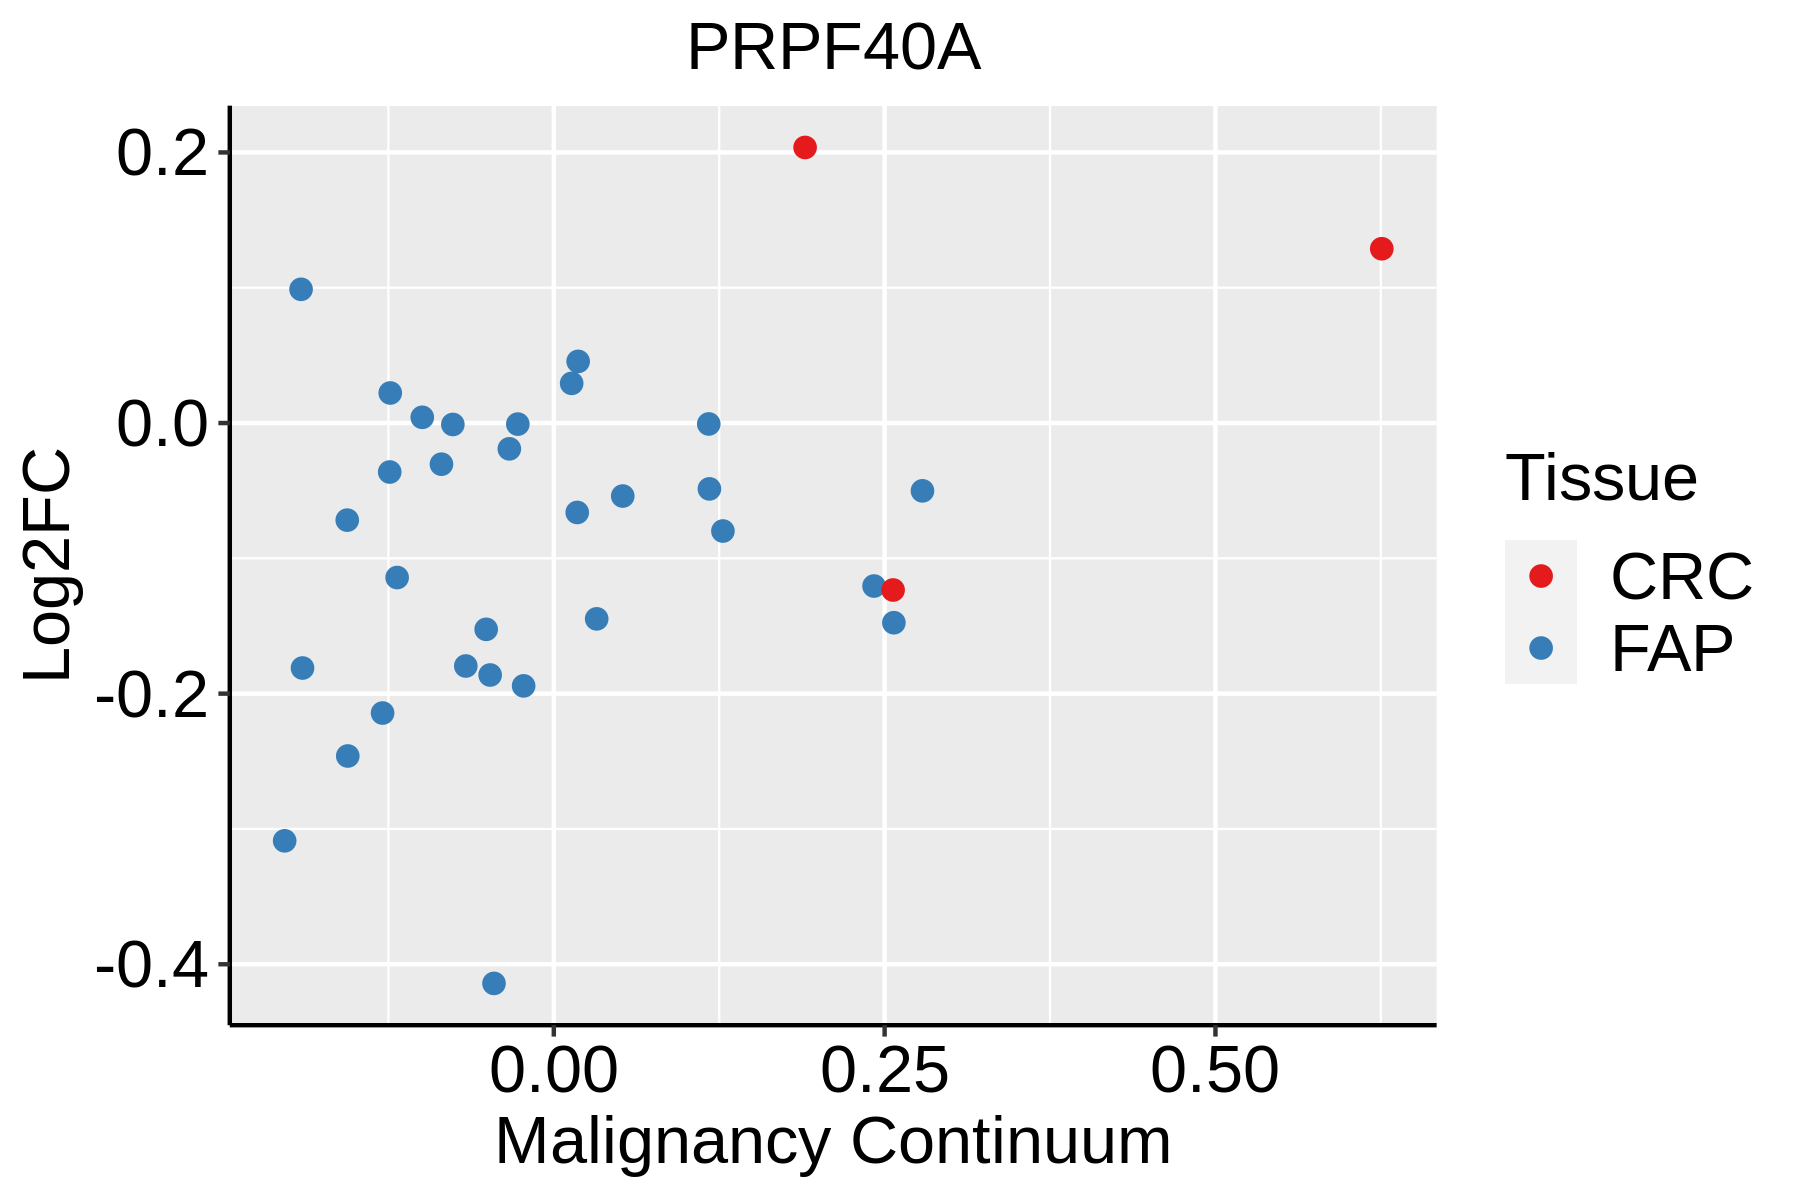 | FAP: Familial adenomatous polyposis |
| CRC: Colorectal cancer |
| Colorectum (HTA11) |  | AD: Adenomas |
| SER: Sessile serrated lesions |
| MSI-H: Microsatellite-high colorectal cancer |
| MSS: Microsatellite stable colorectal cancer |
| Endometrium | 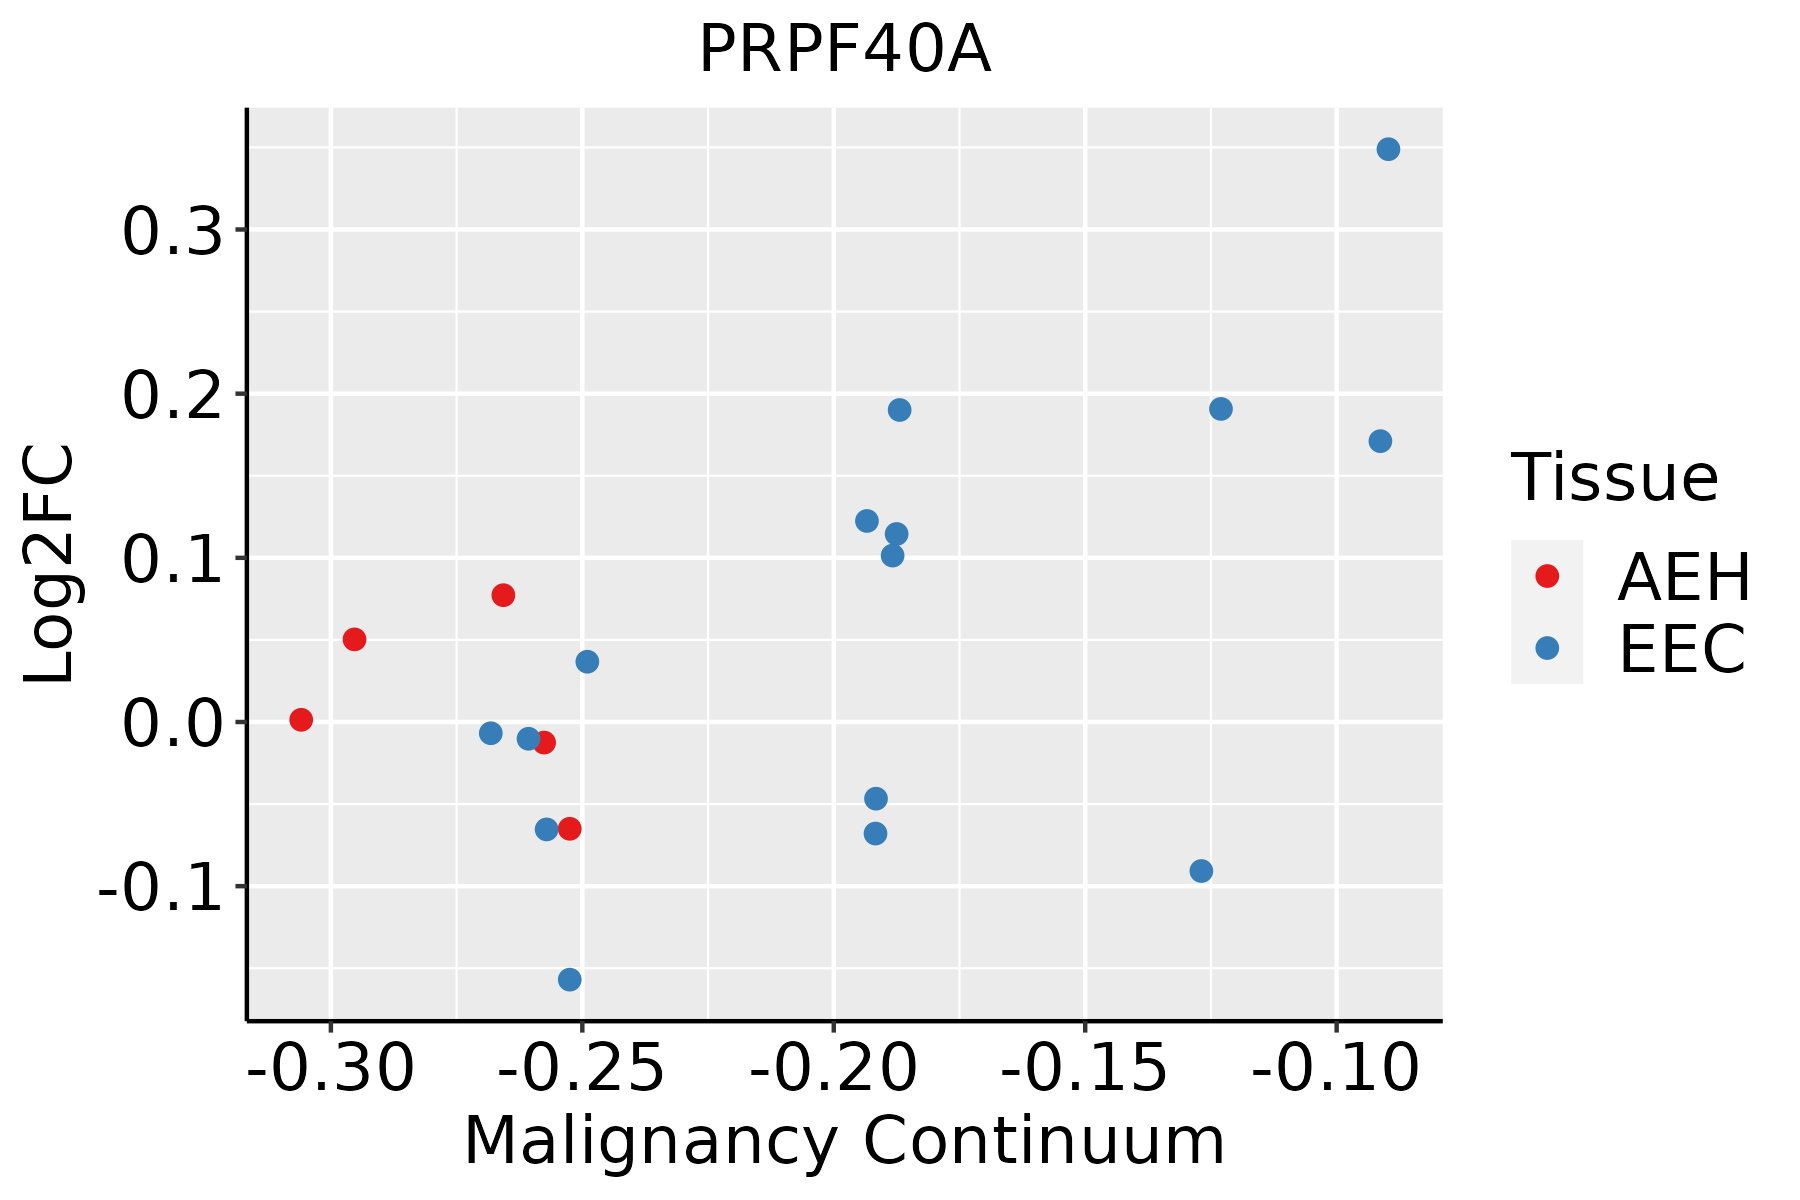 | AEH: Atypical endometrial hyperplasia |
| EEC: Endometrioid Cancer |
| Esophagus |  | ESCC: Esophageal squamous cell carcinoma |
| HGIN: High-grade intraepithelial neoplasias |
| LGIN: Low-grade intraepithelial neoplasias |
| Liver |  | HCC: Hepatocellular carcinoma |
| NAFLD: Non-alcoholic fatty liver disease |
| Oral Cavity | 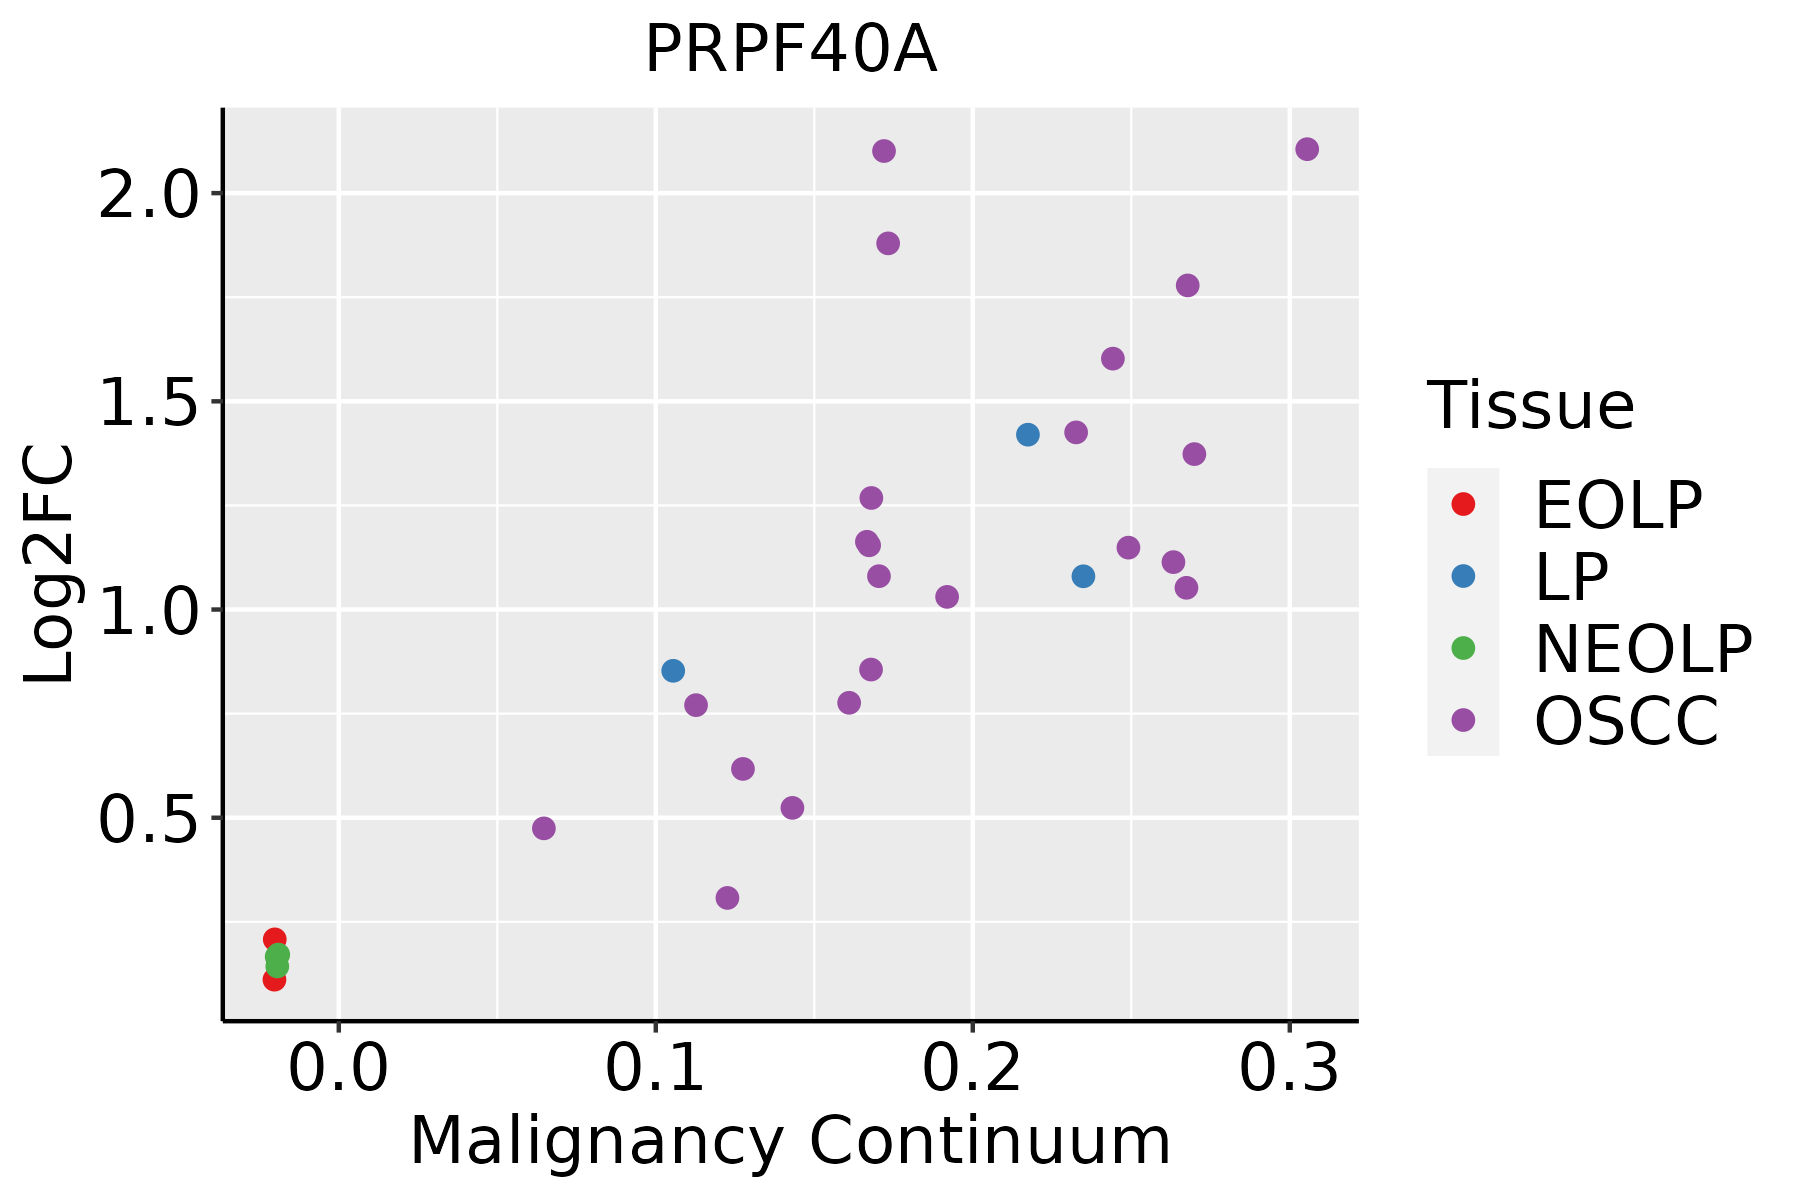 | EOLP: Erosive Oral lichen planus |
| LP: leukoplakia |
| NEOLP: Non-erosive oral lichen planus |
| OSCC: Oral squamous cell carcinoma |
| Prostate | 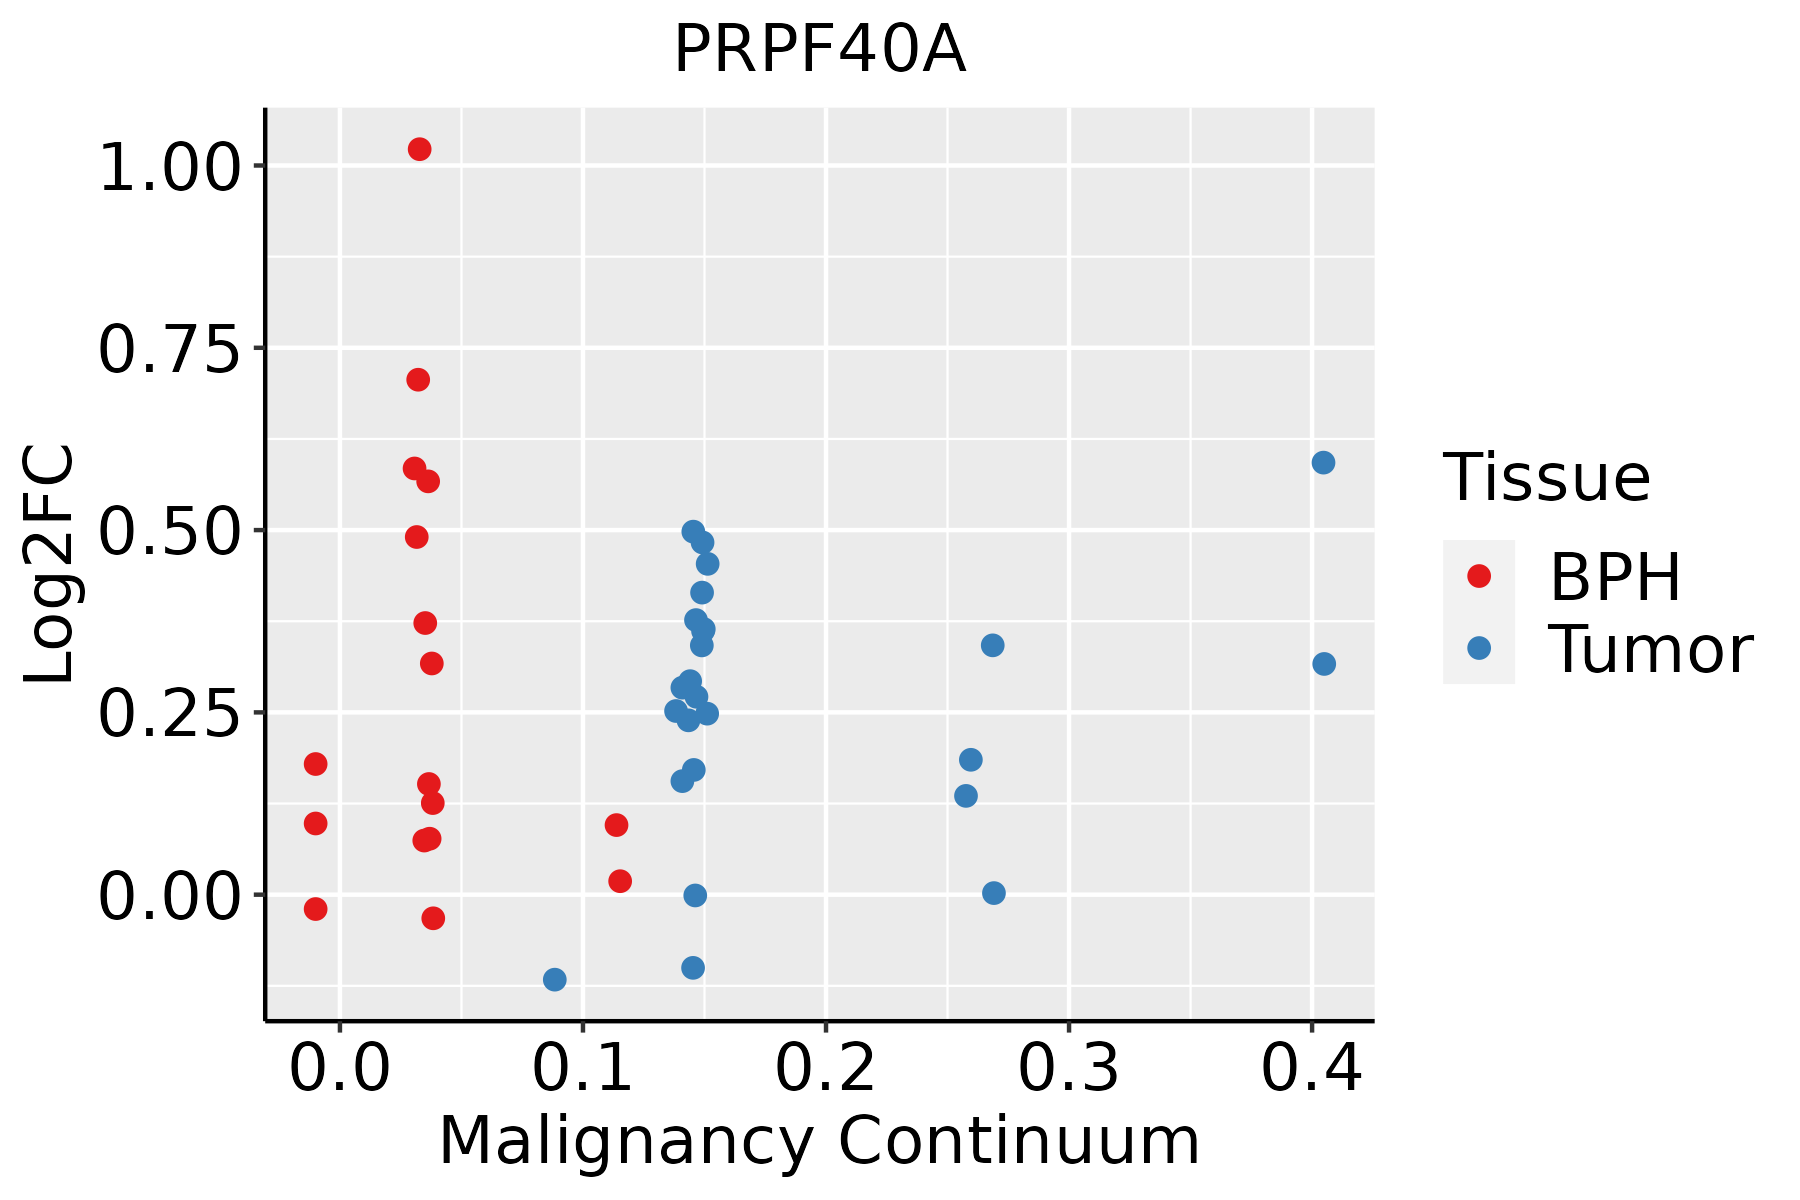 | BPH: Benign Prostatic Hyperplasia |
| Skin | 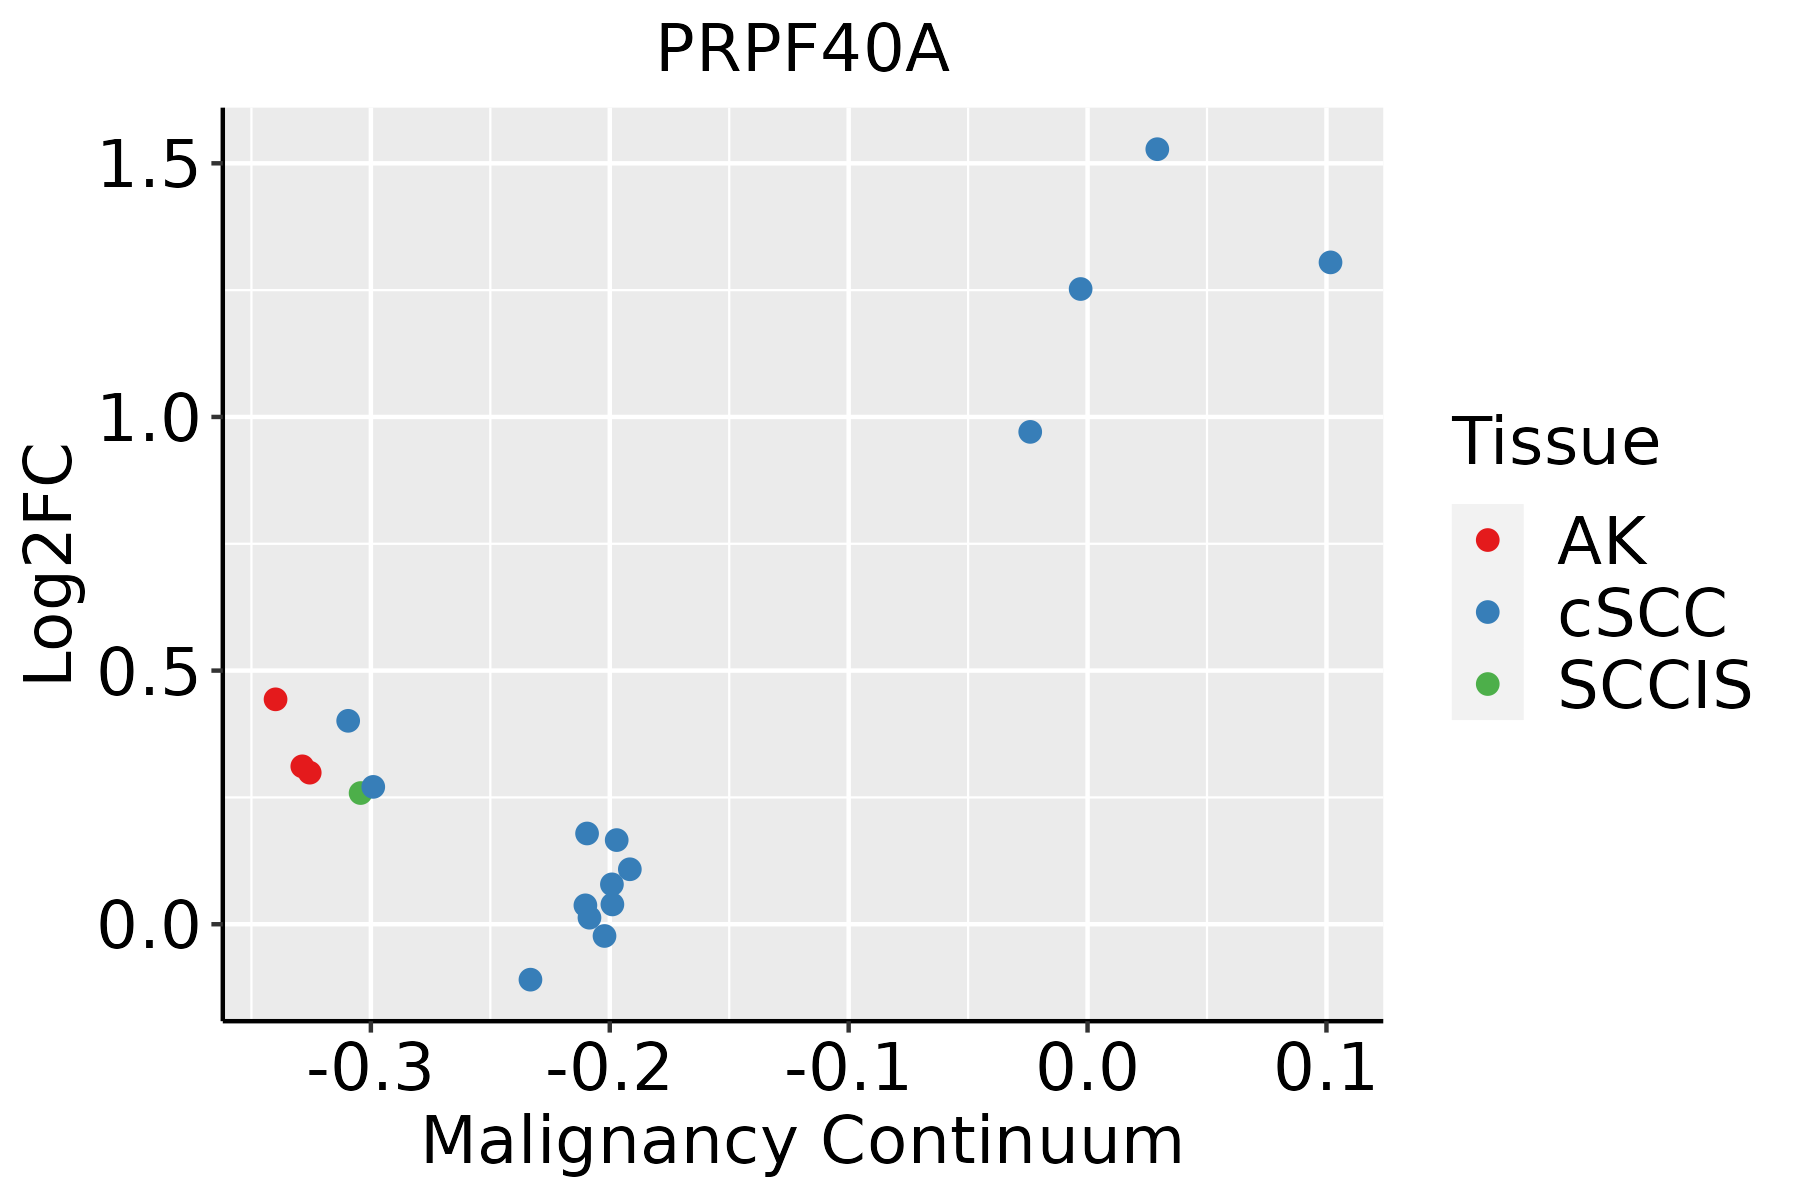 | AK: Actinic keratosis |
| cSCC: Cutaneous squamous cell carcinoma |
| SCCIS:squamous cell carcinoma in situ |
| Thyroid | 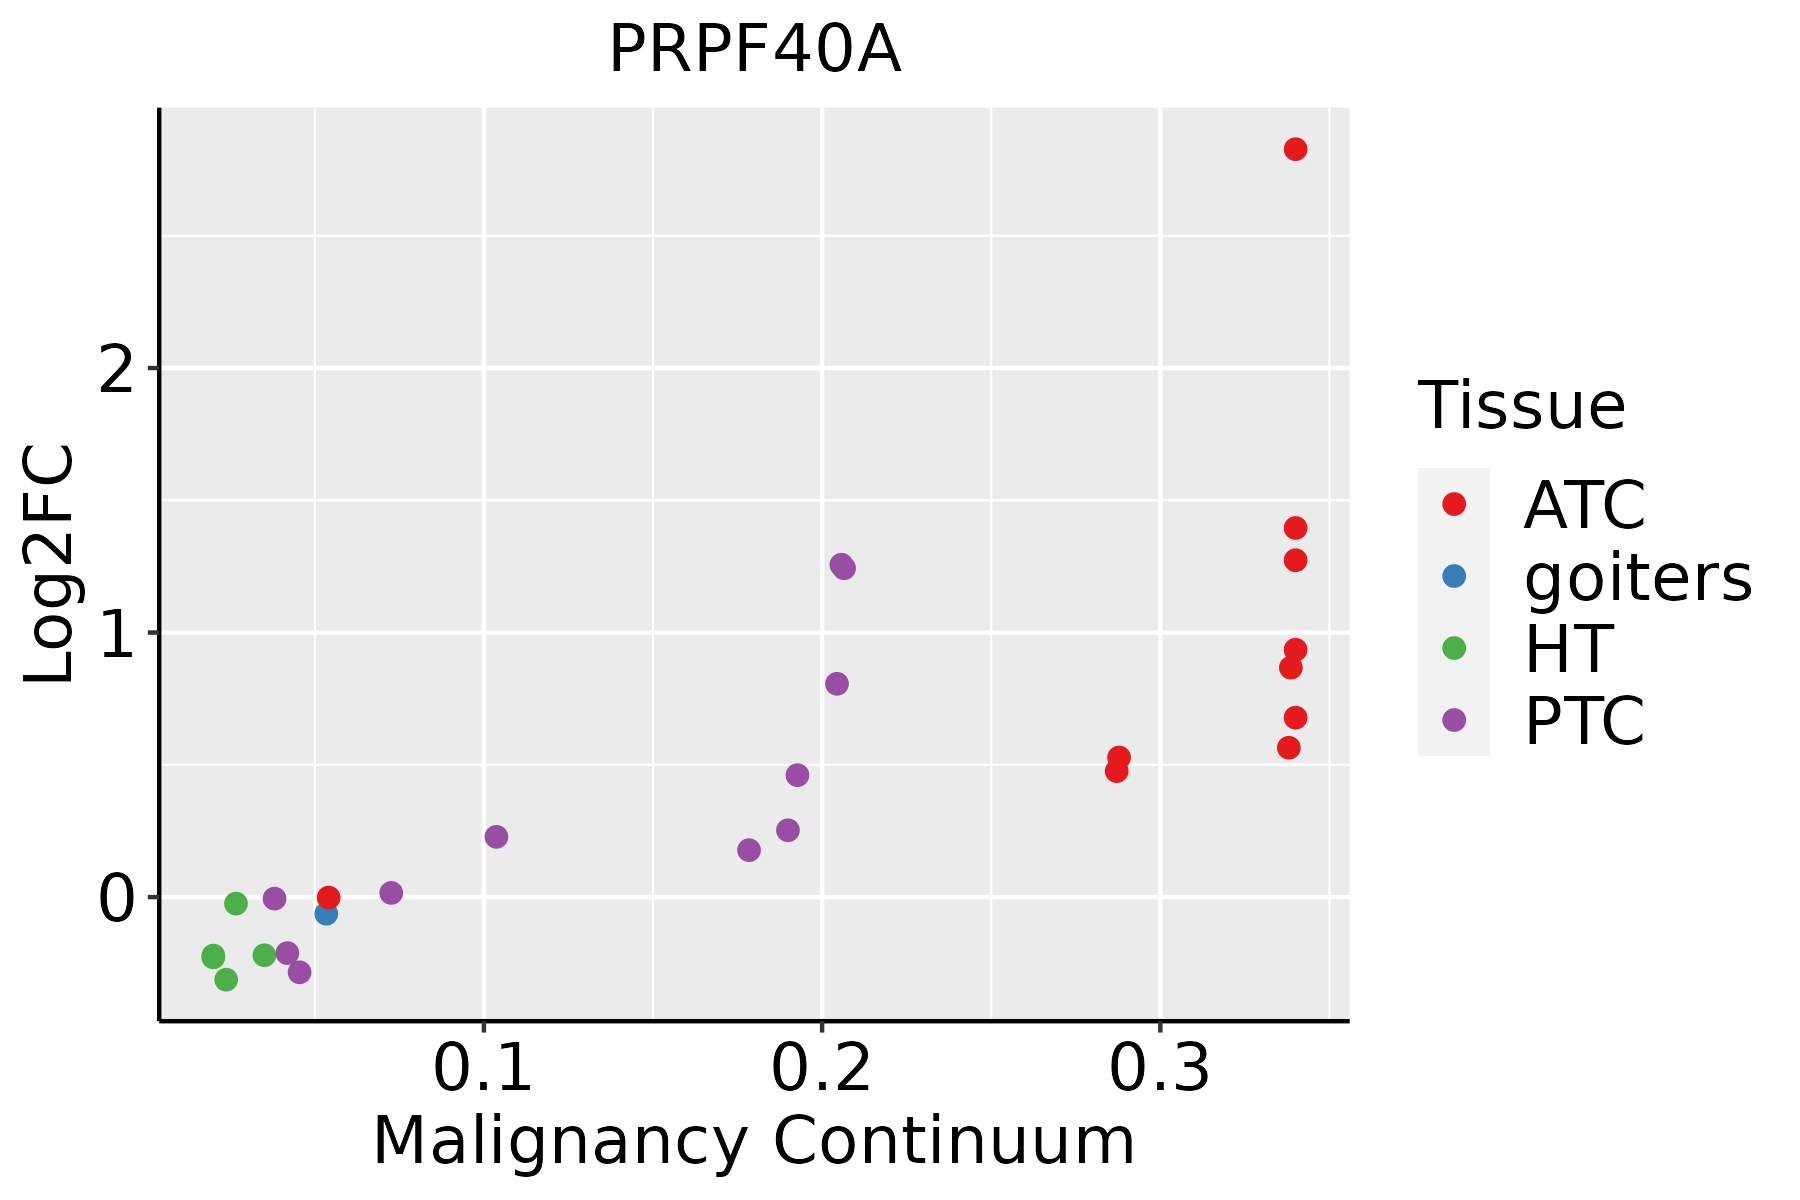 | ATC: Anaplastic thyroid cancer |
| HT: Hashimoto's thyroiditis |
| PTC: Papillary thyroid cancer |
| GO ID | Tissue | Disease Stage | Description | Gene Ratio | Bg Ratio | pvalue | p.adjust | Count |
| GO:00083809 | Breast | Precancer | RNA splicing | 65/1080 | 434/18723 | 1.27e-12 | 2.53e-10 | 65 |
| GO:00003759 | Breast | Precancer | RNA splicing, via transesterification reactions | 52/1080 | 324/18723 | 1.74e-11 | 2.22e-09 | 52 |
| GO:00003779 | Breast | Precancer | RNA splicing, via transesterification reactions with bulged adenosine as nucleophile | 51/1080 | 320/18723 | 3.55e-11 | 4.04e-09 | 51 |
| GO:00003989 | Breast | Precancer | mRNA splicing, via spliceosome | 51/1080 | 320/18723 | 3.55e-11 | 4.04e-09 | 51 |
| GO:00226049 | Breast | Precancer | regulation of cell morphogenesis | 29/1080 | 309/18723 | 6.88e-03 | 4.67e-02 | 29 |
| GO:000838014 | Breast | IDC | RNA splicing | 73/1434 | 434/18723 | 1.27e-10 | 1.57e-08 | 73 |
| GO:000037514 | Breast | IDC | RNA splicing, via transesterification reactions | 58/1434 | 324/18723 | 9.44e-10 | 9.58e-08 | 58 |
| GO:000037714 | Breast | IDC | RNA splicing, via transesterification reactions with bulged adenosine as nucleophile | 57/1434 | 320/18723 | 1.60e-09 | 1.49e-07 | 57 |
| GO:000039814 | Breast | IDC | mRNA splicing, via spliceosome | 57/1434 | 320/18723 | 1.60e-09 | 1.49e-07 | 57 |
| GO:000838024 | Breast | DCIS | RNA splicing | 73/1390 | 434/18723 | 3.05e-11 | 5.08e-09 | 73 |
| GO:000037524 | Breast | DCIS | RNA splicing, via transesterification reactions | 58/1390 | 324/18723 | 2.89e-10 | 3.34e-08 | 58 |
| GO:000037724 | Breast | DCIS | RNA splicing, via transesterification reactions with bulged adenosine as nucleophile | 57/1390 | 320/18723 | 5.01e-10 | 5.35e-08 | 57 |
| GO:000039824 | Breast | DCIS | mRNA splicing, via spliceosome | 57/1390 | 320/18723 | 5.01e-10 | 5.35e-08 | 57 |
| GO:0008380 | Colorectum | AD | RNA splicing | 169/3918 | 434/18723 | 3.59e-18 | 2.04e-15 | 169 |
| GO:0000377 | Colorectum | AD | RNA splicing, via transesterification reactions with bulged adenosine as nucleophile | 130/3918 | 320/18723 | 5.88e-16 | 2.16e-13 | 130 |
| GO:0000398 | Colorectum | AD | mRNA splicing, via spliceosome | 130/3918 | 320/18723 | 5.88e-16 | 2.16e-13 | 130 |
| GO:0000375 | Colorectum | AD | RNA splicing, via transesterification reactions | 131/3918 | 324/18723 | 7.11e-16 | 2.22e-13 | 131 |
| GO:0022604 | Colorectum | AD | regulation of cell morphogenesis | 109/3918 | 309/18723 | 3.08e-09 | 2.07e-07 | 109 |
| GO:0008360 | Colorectum | AD | regulation of cell shape | 56/3918 | 154/18723 | 7.01e-06 | 1.73e-04 | 56 |
| GO:0000910 | Colorectum | AD | cytokinesis | 59/3918 | 173/18723 | 3.74e-05 | 6.75e-04 | 59 |
| Hugo Symbol | Variant Class | Variant Classification | dbSNP RS | HGVSc | HGVSp | HGVSp Short | SWISSPROT | BIOTYPE | SIFT | PolyPhen | Tumor Sample Barcode | Tissue | Histology | Sex | Age | Stage | Therapy Types | Drugs | Outcome |
| PRPF40A | SNV | Missense_Mutation | novel | c.722N>G | p.Met241Arg | p.M241R | O75400 | protein_coding | tolerated(0.65) | benign(0.184) | TCGA-A7-A26H-01 | Breast | breast invasive carcinoma | Female | >=65 | I/II | Hormone Therapy | anastrozole | PD |
| PRPF40A | SNV | Missense_Mutation | | c.2510G>T | p.Arg837Ile | p.R837I | O75400 | protein_coding | deleterious(0.02) | possibly_damaging(0.503) | TCGA-D8-A1JG-01 | Breast | breast invasive carcinoma | Female | <65 | I/II | Chemotherapy | doxorubicin | SD |
| PRPF40A | SNV | Missense_Mutation | rs765112518 | c.742G>A | p.Glu248Lys | p.E248K | O75400 | protein_coding | tolerated(0.78) | benign(0) | TCGA-D8-A27G-01 | Breast | breast invasive carcinoma | Female | >=65 | I/II | Unknown | Unknown | SD |
| PRPF40A | SNV | Missense_Mutation | | c.1098G>C | p.Lys366Asn | p.K366N | O75400 | protein_coding | deleterious(0) | possibly_damaging(0.835) | TCGA-E9-A1N9-01 | Breast | breast invasive carcinoma | Female | <65 | I/II | Chemotherapy | doxorubicin | SD |
| PRPF40A | SNV | Missense_Mutation | | c.2414N>T | p.Ser805Leu | p.S805L | O75400 | protein_coding | deleterious(0) | probably_damaging(0.916) | TCGA-EW-A1OZ-01 | Breast | breast invasive carcinoma | Female | <65 | I/II | Targeted Molecular therapy | trastuzumab | SD |
| PRPF40A | SNV | Missense_Mutation | novel | c.1499G>A | p.Arg500Gln | p.R500Q | O75400 | protein_coding | deleterious(0.03) | probably_damaging(0.992) | TCGA-2W-A8YY-01 | Cervix | cervical & endocervical cancer | Female | <65 | I/II | Chemotherapy | cisplatin | CR |
| PRPF40A | SNV | Missense_Mutation | | c.2422N>A | p.Asp808Asn | p.D808N | O75400 | protein_coding | tolerated(0.07) | benign(0.202) | TCGA-C5-A1BJ-01 | Cervix | cervical & endocervical cancer | Female | <65 | I/II | Unknown | Unknown | SD |
| PRPF40A | SNV | Missense_Mutation | | c.1618N>A | p.Glu540Lys | p.E540K | O75400 | protein_coding | tolerated(0.46) | possibly_damaging(0.81) | TCGA-EK-A2RN-01 | Cervix | cervical & endocervical cancer | Female | <65 | I/II | Unknown | Unknown | SD |
| PRPF40A | SNV | Missense_Mutation | novel | c.2203N>A | p.Glu735Lys | p.E735K | O75400 | protein_coding | deleterious(0.01) | probably_damaging(0.981) | TCGA-LP-A4AU-01 | Cervix | cervical & endocervical cancer | Female | <65 | III/IV | Chemotherapy | cisplatin | CR |
| PRPF40A | SNV | Missense_Mutation | | c.1205G>C | p.Ser402Thr | p.S402T | O75400 | protein_coding | tolerated(0.12) | probably_damaging(0.964) | TCGA-A6-A567-01 | Colorectum | colon adenocarcinoma | Male | <65 | III/IV | Unknown | Unknown | PD |


