
|
|||||
|
 | |
| |
| |
| |
| |
| |
|
Gene: NUCB2 |
Gene summary for NUCB2 |
| Gene information | Species | Human | Gene symbol | NUCB2 | Gene ID | 4925 |
| Gene name | nucleobindin 2 | |
| Gene Alias | HEL-S-109 | |
| Cytomap | 11p15.1 | |
| Gene Type | protein-coding | GO ID | GO:0007154 | UniProtAcc | Q2L696 |
Top |
Malignant transformation analysis |
| Identification of the aberrant gene expression in precancerous and cancerous lesions by comparing the gene expression of stem-like cells in diseased tissues with normal stem cells |
| Entrez ID | Symbol | Replicates | Species | Organ | Tissue | Adj P-value | Log2FC | Malignancy |
| 4925 | NUCB2 | GSM5353243_PA_PR5261_T1_S23_L002 | Human | Prostate | Tumor | 2.93e-05 | -9.89e-03 | 0.1545 |
| 4925 | NUCB2 | GSM5353244_PA_PR5261_T2_S24_L002 | Human | Prostate | Tumor | 1.53e-02 | -1.13e-01 | 0.1569 |
| 4925 | NUCB2 | male-WTA | Human | Thyroid | PTC | 3.73e-24 | -8.73e-02 | 0.1037 |
| 4925 | NUCB2 | PTC01 | Human | Thyroid | PTC | 1.42e-09 | 9.31e-02 | 0.1899 |
| 4925 | NUCB2 | PTC03 | Human | Thyroid | PTC | 2.44e-03 | 5.33e-02 | 0.1784 |
| 4925 | NUCB2 | PTC05 | Human | Thyroid | PTC | 6.56e-06 | 4.62e-01 | 0.2065 |
| 4925 | NUCB2 | PTC06 | Human | Thyroid | PTC | 4.25e-17 | 7.19e-01 | 0.2057 |
| 4925 | NUCB2 | PTC07 | Human | Thyroid | PTC | 6.68e-31 | 7.12e-01 | 0.2044 |
| 4925 | NUCB2 | ATC09 | Human | Thyroid | ATC | 3.89e-19 | 1.46e+00 | 0.2871 |
| 4925 | NUCB2 | ATC12 | Human | Thyroid | ATC | 3.10e-30 | 8.71e-01 | 0.34 |
| 4925 | NUCB2 | ATC13 | Human | Thyroid | ATC | 4.68e-42 | 1.45e+00 | 0.34 |
| 4925 | NUCB2 | ATC1 | Human | Thyroid | ATC | 1.93e-19 | 1.57e+00 | 0.2878 |
| 4925 | NUCB2 | ATC2 | Human | Thyroid | ATC | 1.71e-16 | 2.06e+00 | 0.34 |
| 4925 | NUCB2 | ATC4 | Human | Thyroid | ATC | 9.31e-37 | 1.15e+00 | 0.34 |
| 4925 | NUCB2 | ATC5 | Human | Thyroid | ATC | 3.97e-46 | 1.63e+00 | 0.34 |
| Page: 1 2 3 4 5 6 7 8 9 10 |
| Tissue | Expression Dynamics | Abbreviation |
| Breast | 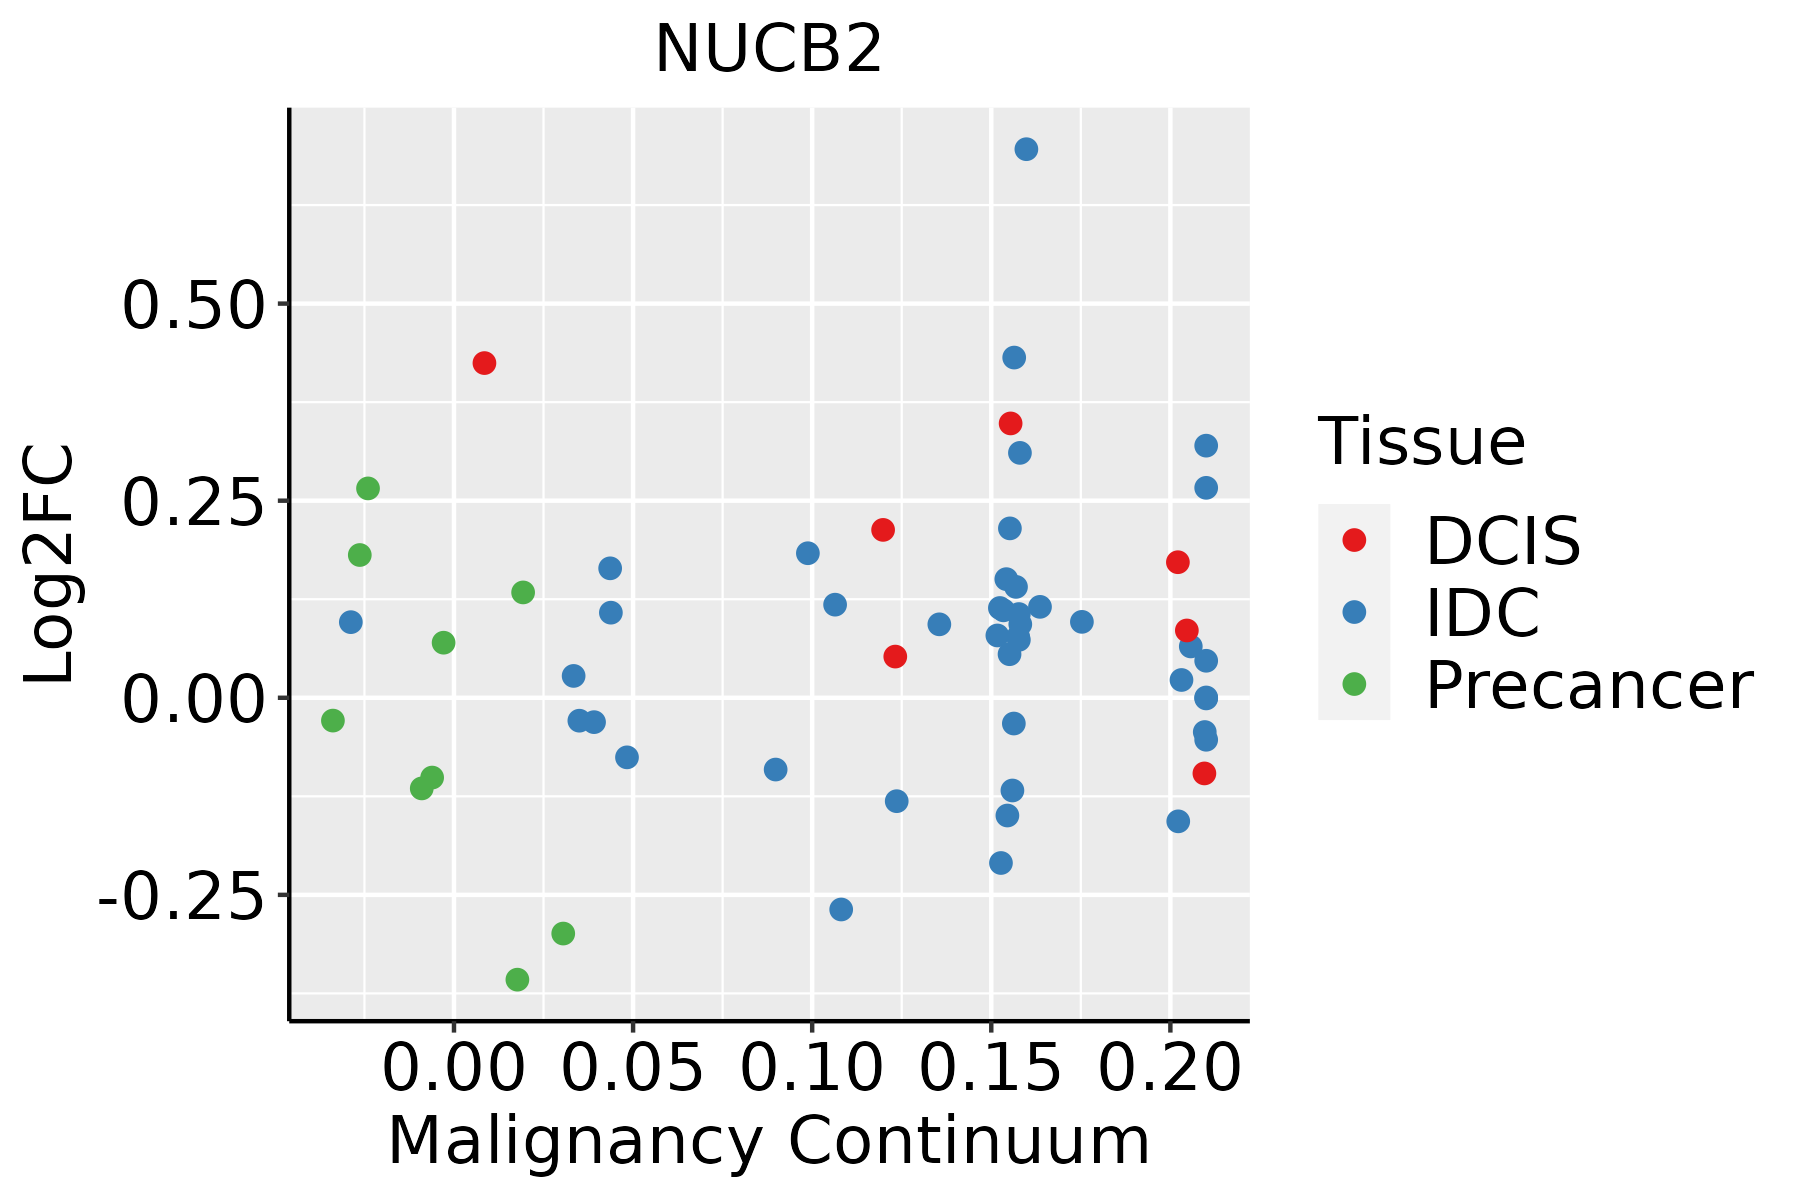 | IDC: Invasive ductal carcinoma |
| DCIS: Ductal carcinoma in situ | ||
| Precancer(BRCA1-mut): Precancerous lesion from BRCA1 mutation carriers | ||
| Colorectum (GSE201348) | 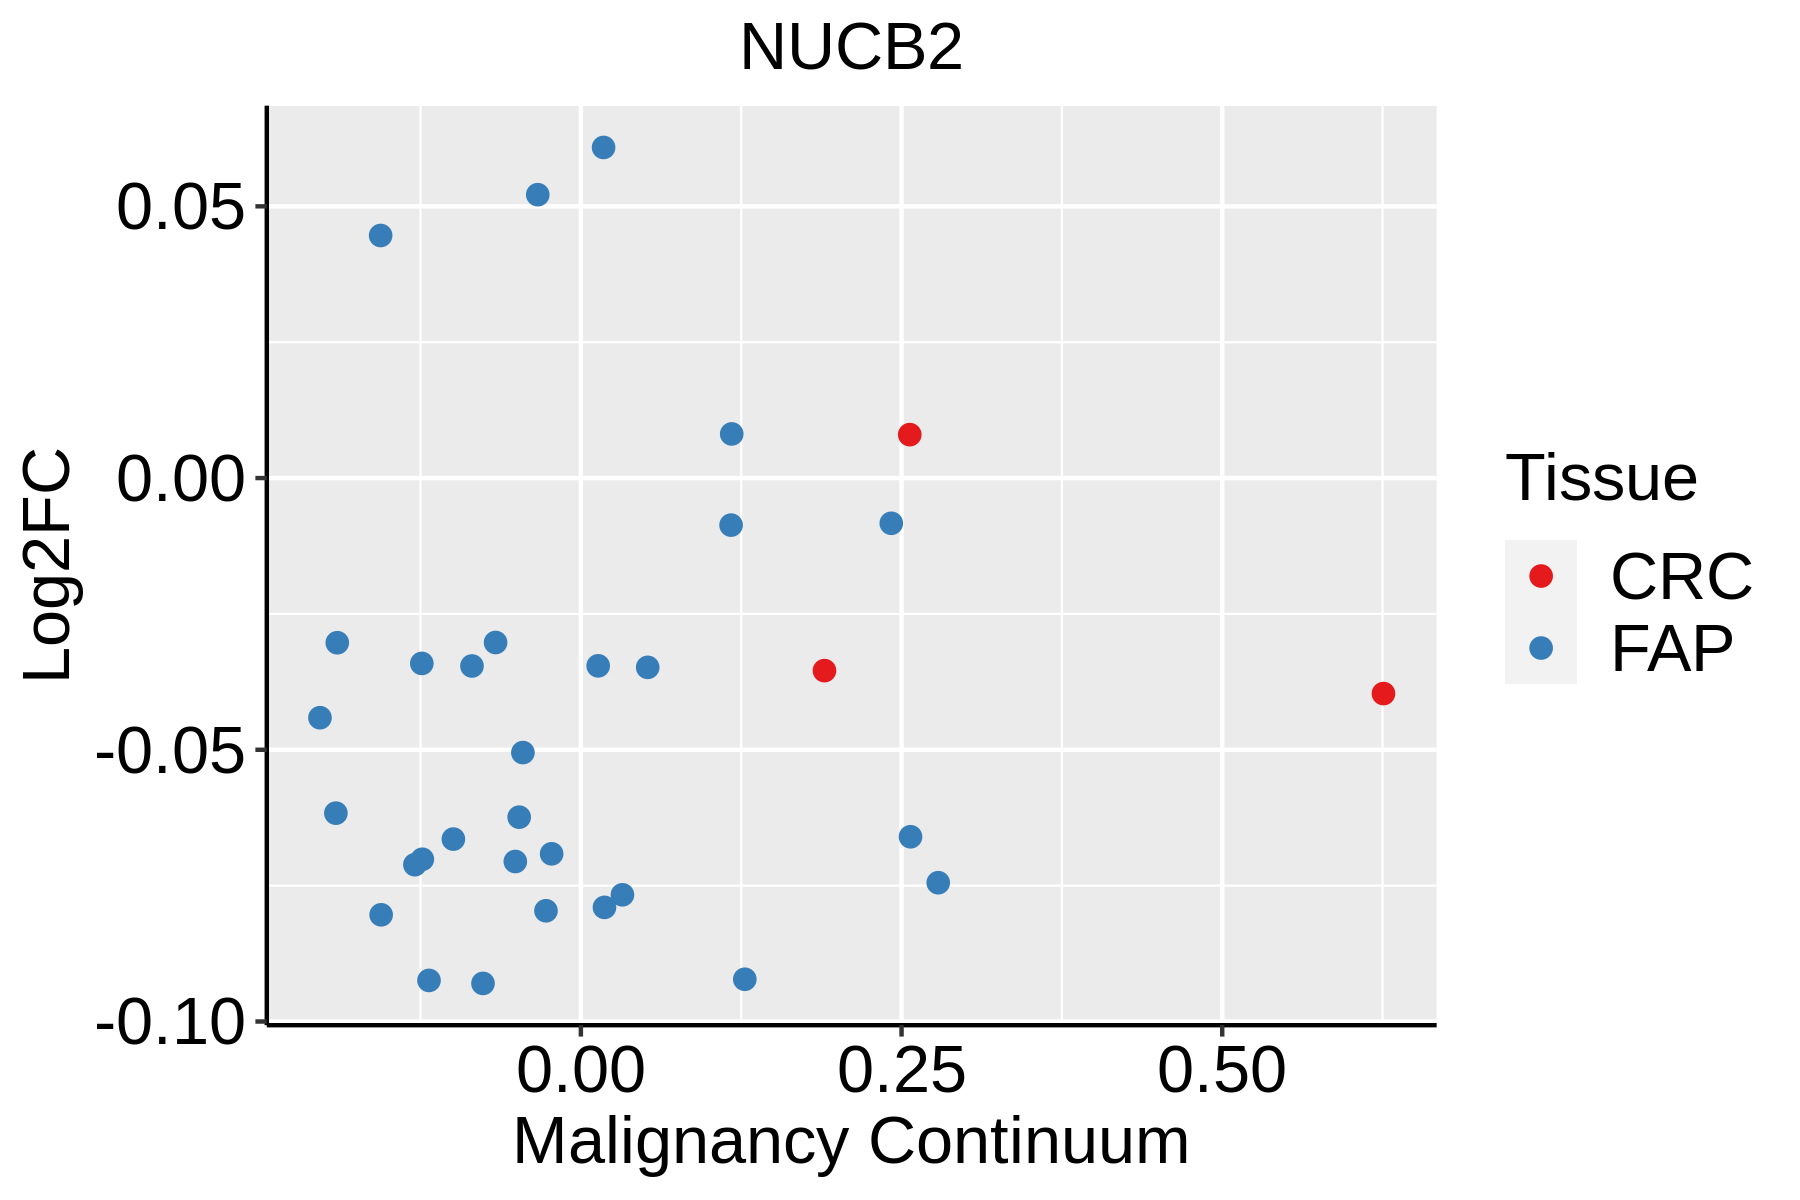 | FAP: Familial adenomatous polyposis |
| CRC: Colorectal cancer | ||
| Colorectum (HTA11) |  | AD: Adenomas |
| SER: Sessile serrated lesions | ||
| MSI-H: Microsatellite-high colorectal cancer | ||
| MSS: Microsatellite stable colorectal cancer | ||
| Endometrium | 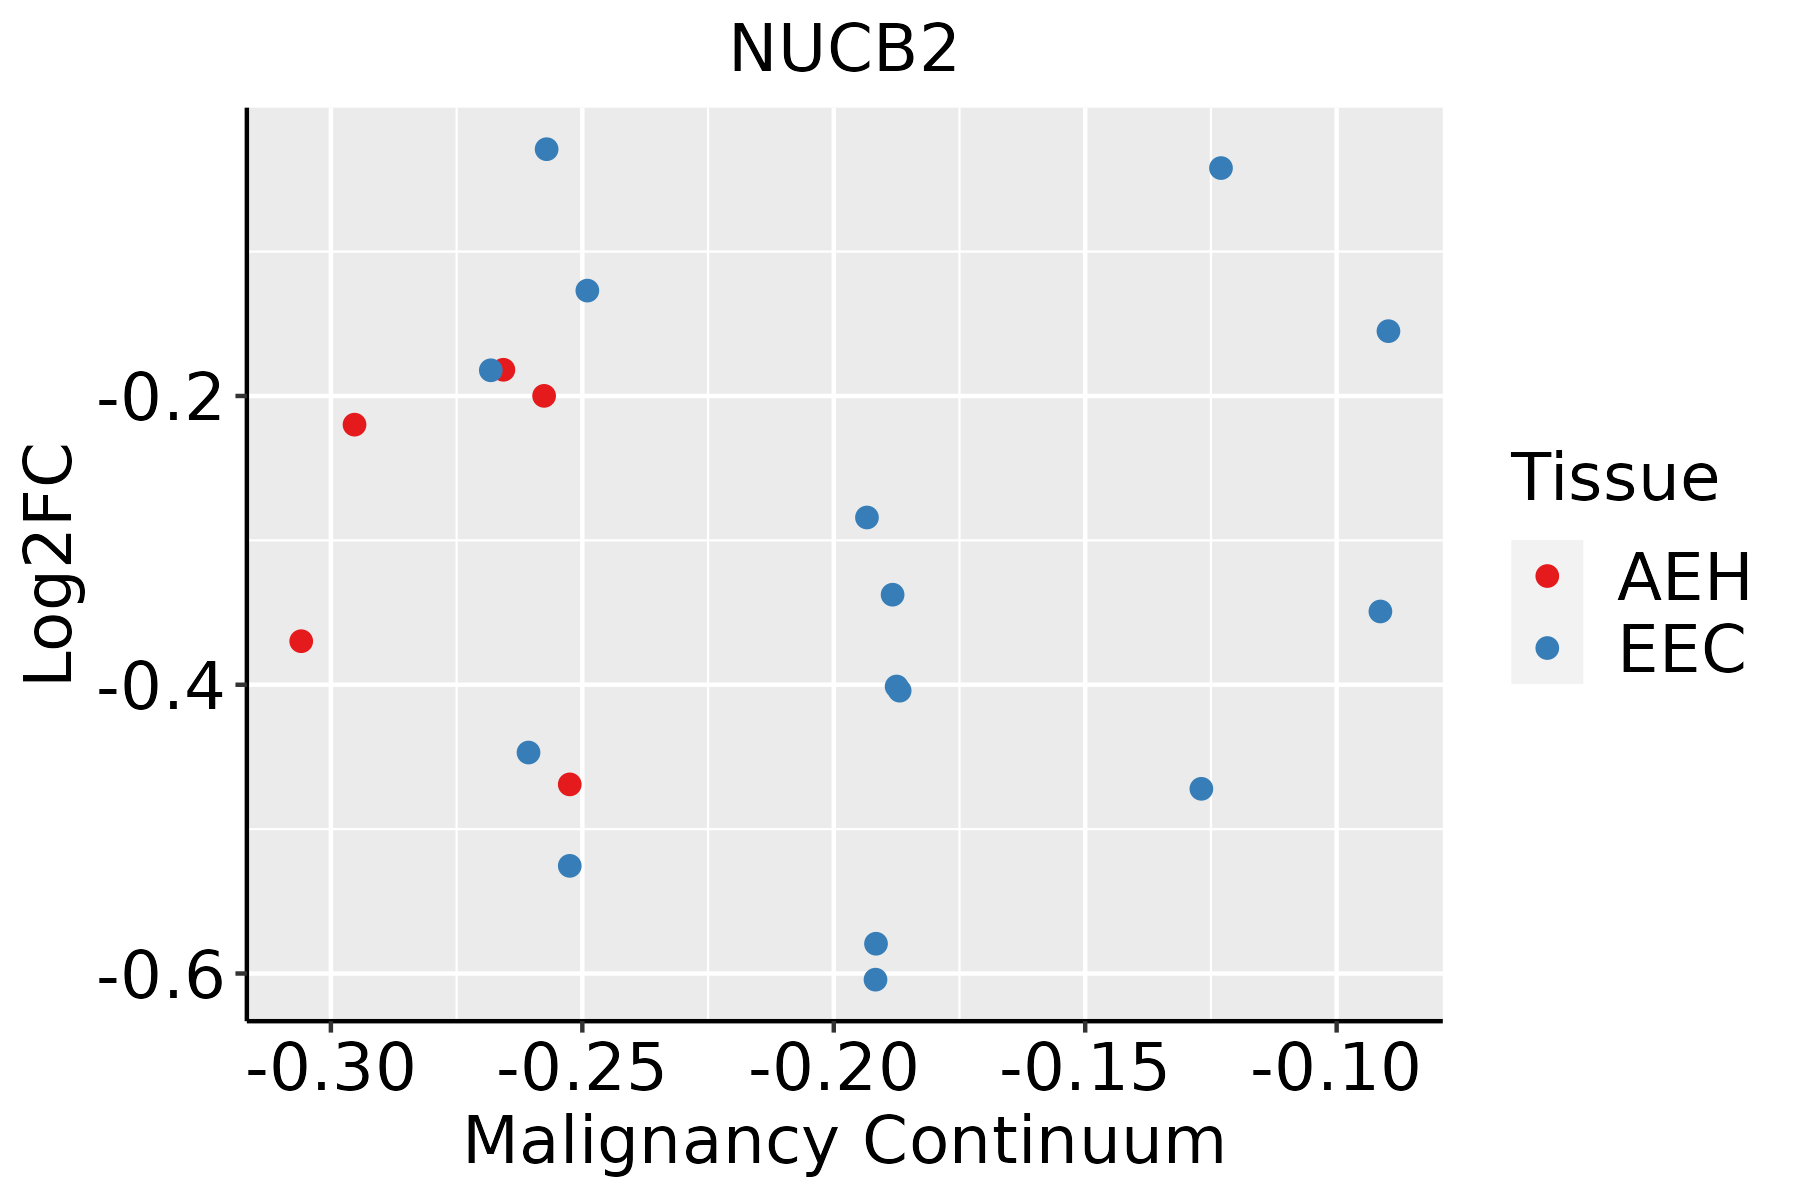 | AEH: Atypical endometrial hyperplasia |
| EEC: Endometrioid Cancer | ||
| Esophagus | 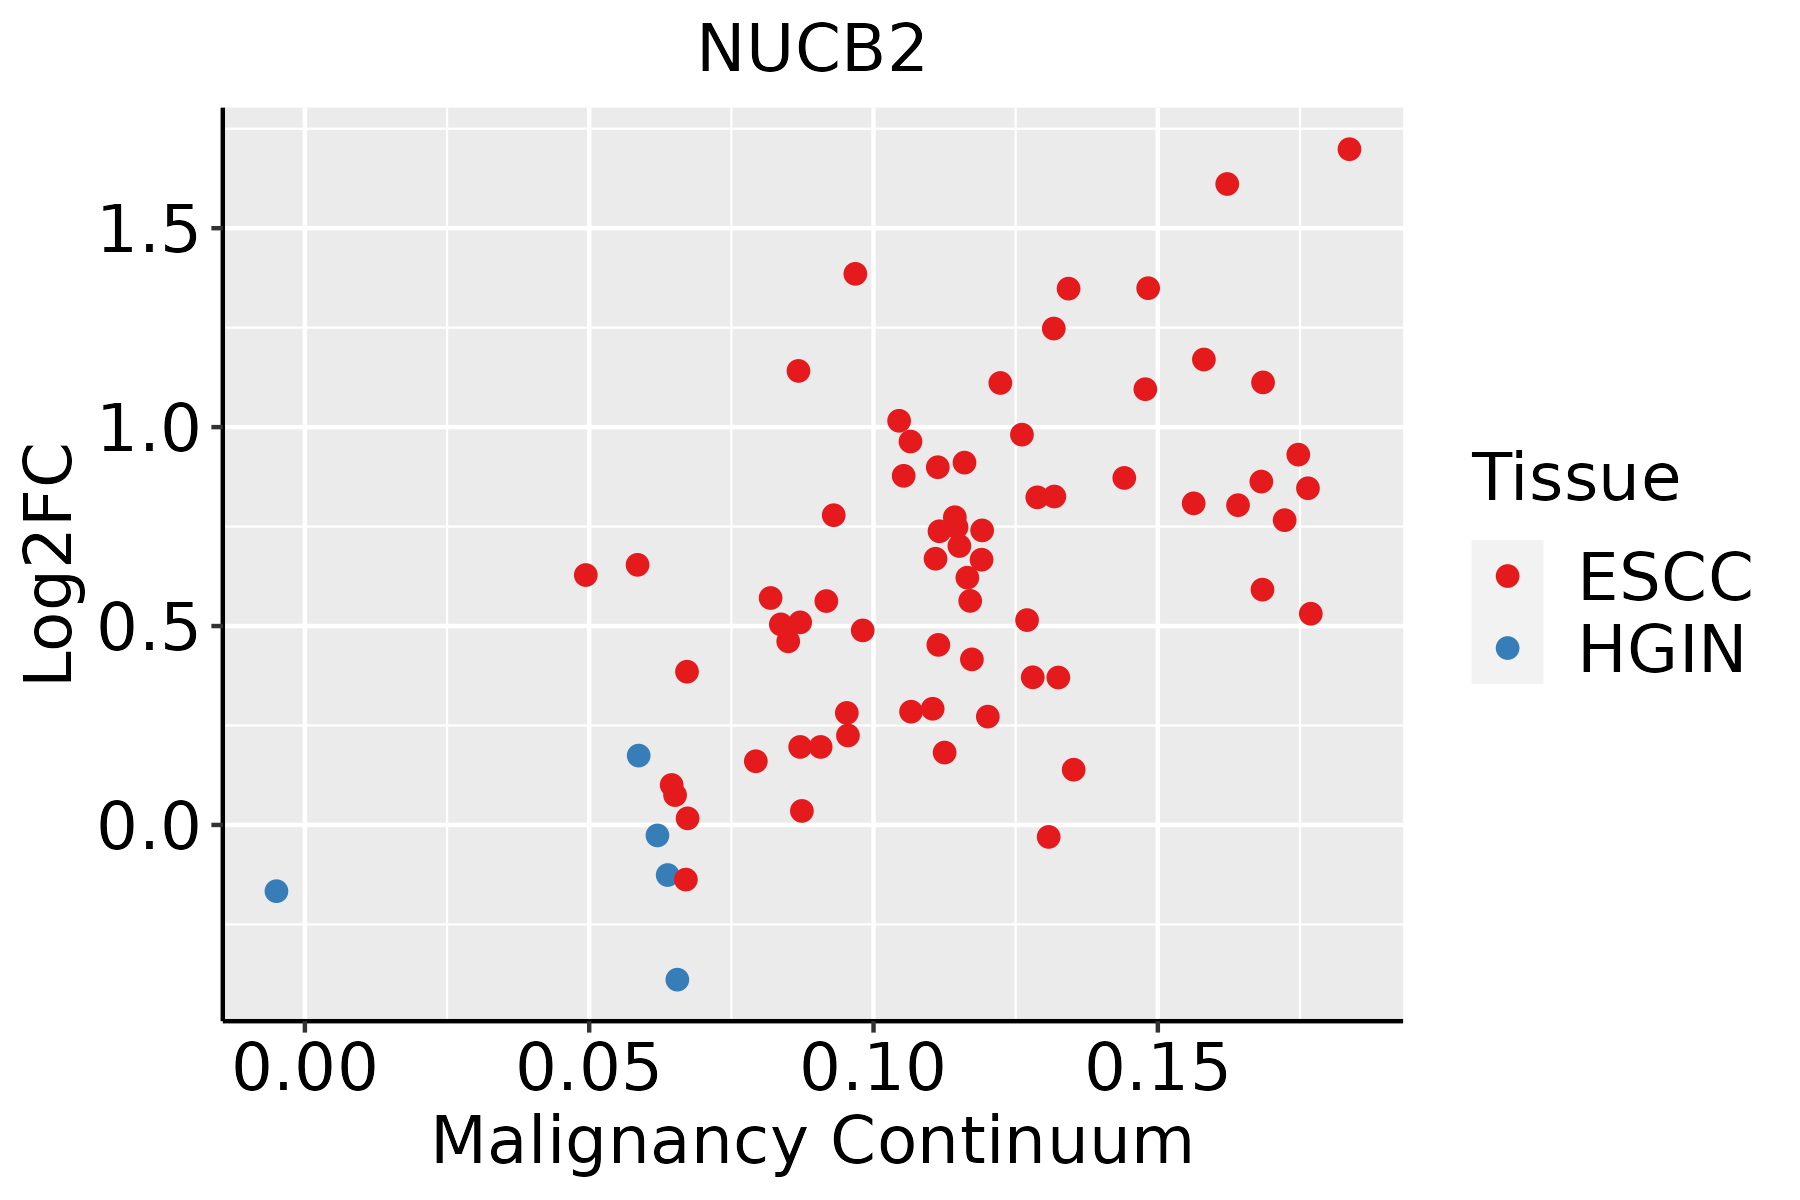 | ESCC: Esophageal squamous cell carcinoma |
| HGIN: High-grade intraepithelial neoplasias | ||
| LGIN: Low-grade intraepithelial neoplasias | ||
| Liver | 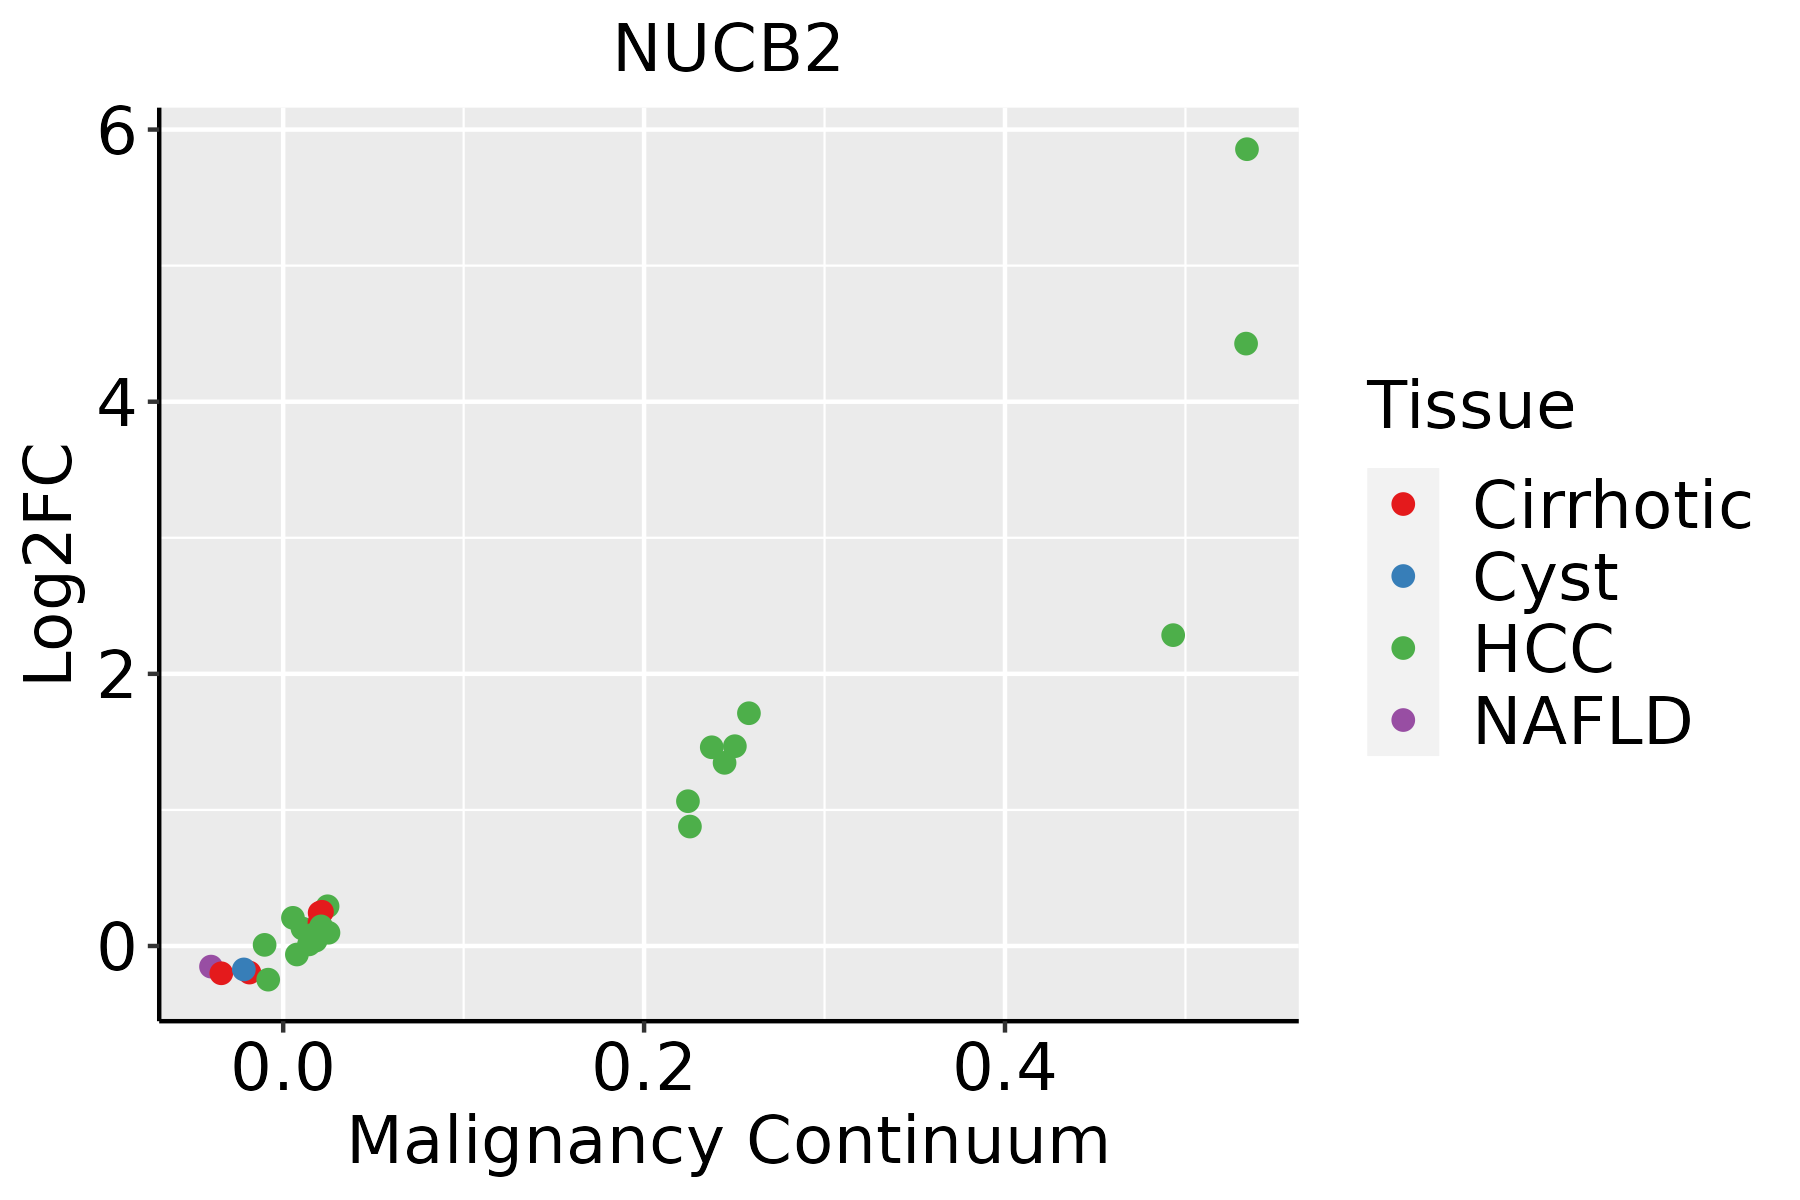 | HCC: Hepatocellular carcinoma |
| NAFLD: Non-alcoholic fatty liver disease | ||
| Oral Cavity |  | EOLP: Erosive Oral lichen planus |
| LP: leukoplakia | ||
| NEOLP: Non-erosive oral lichen planus | ||
| OSCC: Oral squamous cell carcinoma | ||
| Prostate |  | BPH: Benign Prostatic Hyperplasia |
| Thyroid | 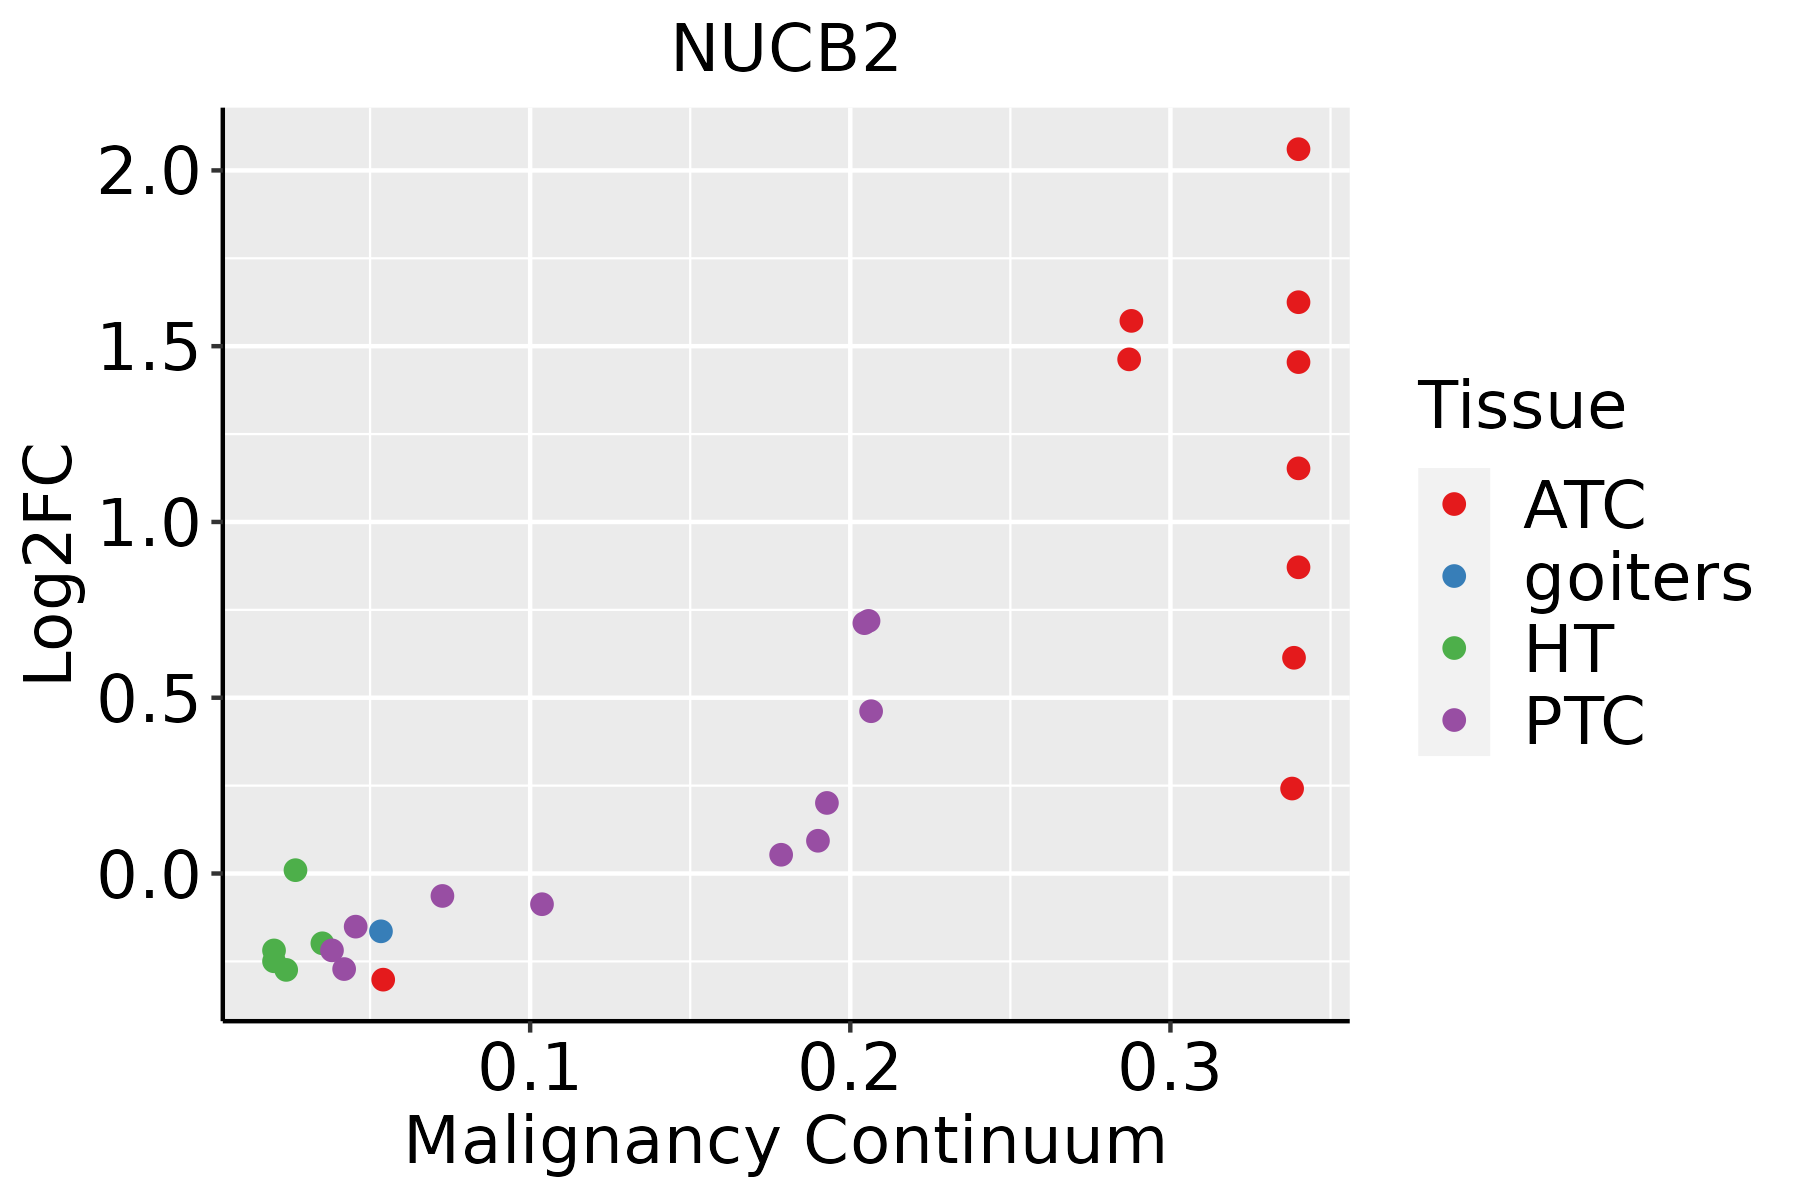 | ATC: Anaplastic thyroid cancer |
| HT: Hashimoto's thyroiditis | ||
| PTC: Papillary thyroid cancer |
| ∗log2FC in expression of this searched gene in stem-like cells from each diseased tissue sample relative to stem-like cells in normal samples in each tissue plotted against the malignancy continuum. Samples are colored based on if they are from different disease stage. |
Top |
Malignant transformation related pathway analysis |
| Find out the enriched GO biological processes and KEGG pathways involved in transition from healthy to precancer to cancer |
| Tissue | Disease Stage | Enriched GO biological Processes |
| Colorectum | AD |  |
| Colorectum | SER |  |
| Colorectum | MSS |  |
| Colorectum | MSI-H |  |
| Colorectum | FAP |  |
| ∗Top 15 enriched GO BP terms are showed in the bar plot of each disease state in each tissue. Each row represents a significant GO biological process which is colored according to the -log10(p.adjust). |
| Page: 1 2 3 4 5 6 7 8 9 |
| GO ID | Tissue | Disease Stage | Description | Gene Ratio | Bg Ratio | pvalue | p.adjust | Count |
| GO:003166714 | Breast | IDC | response to nutrient levels | 62/1434 | 474/18723 | 2.33e-05 | 5.57e-04 | 62 |
| GO:003166723 | Breast | DCIS | response to nutrient levels | 58/1390 | 474/18723 | 1.16e-04 | 2.03e-03 | 58 |
| GO:00321021 | Breast | DCIS | negative regulation of response to external stimulus | 46/1390 | 420/18723 | 5.19e-03 | 3.81e-02 | 46 |
| GO:0031667 | Colorectum | AD | response to nutrient levels | 138/3918 | 474/18723 | 1.22e-05 | 2.68e-04 | 138 |
| GO:00316671 | Colorectum | SER | response to nutrient levels | 106/2897 | 474/18723 | 3.94e-05 | 1.00e-03 | 106 |
| GO:00316672 | Colorectum | MSS | response to nutrient levels | 125/3467 | 474/18723 | 1.24e-05 | 2.88e-04 | 125 |
| GO:003166716 | Endometrium | AEH | response to nutrient levels | 78/2100 | 474/18723 | 3.26e-04 | 3.64e-03 | 78 |
| GO:003166717 | Endometrium | EEC | response to nutrient levels | 82/2168 | 474/18723 | 1.23e-04 | 1.64e-03 | 82 |
| GO:0031667111 | Esophagus | ESCC | response to nutrient levels | 289/8552 | 474/18723 | 9.25e-12 | 3.47e-10 | 289 |
| GO:003166712 | Liver | Cirrhotic | response to nutrient levels | 174/4634 | 474/18723 | 3.08e-09 | 1.27e-07 | 174 |
| GO:003166722 | Liver | HCC | response to nutrient levels | 276/7958 | 474/18723 | 2.30e-12 | 1.08e-10 | 276 |
| GO:003166720 | Oral cavity | OSCC | response to nutrient levels | 245/7305 | 474/18723 | 1.02e-08 | 2.10e-07 | 245 |
| GO:0031667110 | Oral cavity | LP | response to nutrient levels | 165/4623 | 474/18723 | 3.87e-07 | 1.12e-05 | 165 |
| GO:00321023 | Oral cavity | EOLP | negative regulation of response to external stimulus | 75/2218 | 420/18723 | 1.74e-04 | 1.80e-03 | 75 |
| GO:003166725 | Oral cavity | EOLP | response to nutrient levels | 82/2218 | 474/18723 | 2.59e-04 | 2.52e-03 | 82 |
| GO:003166732 | Oral cavity | NEOLP | response to nutrient levels | 77/2005 | 474/18723 | 1.27e-04 | 1.49e-03 | 77 |
| GO:003210212 | Oral cavity | NEOLP | negative regulation of response to external stimulus | 63/2005 | 420/18723 | 3.67e-03 | 2.14e-02 | 63 |
| GO:003166718 | Prostate | BPH | response to nutrient levels | 121/3107 | 474/18723 | 3.68e-07 | 7.70e-06 | 121 |
| GO:003166719 | Prostate | Tumor | response to nutrient levels | 127/3246 | 474/18723 | 1.27e-07 | 3.28e-06 | 127 |
| GO:0031667113 | Thyroid | PTC | response to nutrient levels | 201/5968 | 474/18723 | 7.00e-07 | 1.10e-05 | 201 |
| Page: 1 2 |
| Pathway ID | Tissue | Disease Stage | Description | Gene Ratio | Bg Ratio | pvalue | p.adjust | qvalue | Count |
| Page: 1 |
Top |
Cell-cell communication analysis |
| Identification of potential cell-cell interactions between two cell types and their ligand-receptor pairs for different disease states |
| Ligand | Receptor | LRpair | Pathway | Tissue | Disease Stage |
| Page: 1 |
Top |
Single-cell gene regulatory network inference analysis |
| Find out the significant the regulons (TFs) and the target genes of each regulon across cell types for different disease states |
| TF | Cell Type | Tissue | Disease Stage | Target Gene | RSS | Regulon Activity |
| ∗The dot plots of a searched regulon are shown for all cell subpopulations in each disease state of each tissue based on the regulon specific score inferred using pySCENIC and by calculating the average expression. |
| Page: 1 |
Top |
Somatic mutation of malignant transformation related genes |
| Annotation of somatic variants for genes involved in malignant transformation |
| Hugo Symbol | Variant Class | Variant Classification | dbSNP RS | HGVSc | HGVSp | HGVSp Short | SWISSPROT | BIOTYPE | SIFT | PolyPhen | Tumor Sample Barcode | Tissue | Histology | Sex | Age | Stage | Therapy Types | Drugs | Outcome |
| NUCB2 | SNV | Missense_Mutation | novel | c.455C>G | p.Ser152Cys | p.S152C | protein_coding | deleterious(0.03) | possibly_damaging(0.8) | TCGA-D8-A73U-01 | Breast | breast invasive carcinoma | Female | >=65 | I/II | Hormone Therapy | tamoxiphen | SD | |
| NUCB2 | SNV | Missense_Mutation | novel | c.835N>A | p.Asp279Asn | p.D279N | protein_coding | tolerated(0.11) | benign(0.024) | TCGA-LQ-A4E4-01 | Breast | breast invasive carcinoma | Female | >=65 | III/IV | Hormone Therapy | anastrozole | PD | |
| NUCB2 | SNV | Missense_Mutation | novel | c.1000N>A | p.Glu334Lys | p.E334K | protein_coding | tolerated(0.15) | benign(0.177) | TCGA-HM-A4S6-01 | Cervix | cervical & endocervical cancer | Female | <65 | III/IV | Chemotherapy | cisplatin | CR | |
| NUCB2 | SNV | Missense_Mutation | c.1107N>T | p.Gln369His | p.Q369H | protein_coding | tolerated(0.23) | possibly_damaging(0.51) | TCGA-AA-3821-01 | Colorectum | colon adenocarcinoma | Female | >=65 | I/II | Unknown | Unknown | SD | ||
| NUCB2 | SNV | Missense_Mutation | c.508N>T | p.Asp170Tyr | p.D170Y | protein_coding | deleterious(0) | probably_damaging(0.984) | TCGA-AA-A010-01 | Colorectum | colon adenocarcinoma | Female | <65 | I/II | Chemotherapy | folinic | CR | ||
| NUCB2 | SNV | Missense_Mutation | c.948N>T | p.Glu316Asp | p.E316D | protein_coding | tolerated(0.24) | benign(0.003) | TCGA-AZ-4313-01 | Colorectum | colon adenocarcinoma | Female | <65 | I/II | Unknown | Unknown | SD | ||
| NUCB2 | deletion | Frame_Shift_Del | c.1193delN | p.Lys400AsnfsTer15 | p.K400Nfs*15 | protein_coding | TCGA-AZ-6598-01 | Colorectum | colon adenocarcinoma | Female | >=65 | I/II | Unknown | Unknown | SD | ||||
| NUCB2 | insertion | Frame_Shift_Ins | novel | c.749dupT | p.Lys251GlnfsTer4 | p.K251Qfs*4 | protein_coding | TCGA-G4-6628-01 | Colorectum | colon adenocarcinoma | Male | >=65 | I/II | Unknown | Unknown | SD | |||
| NUCB2 | deletion | Frame_Shift_Del | c.1193delN | p.Lys400AsnfsTer15 | p.K400Nfs*15 | protein_coding | TCGA-WS-AB45-01 | Colorectum | colon adenocarcinoma | Female | <65 | I/II | Unknown | Unknown | SD | ||||
| NUCB2 | SNV | Missense_Mutation | c.679N>T | p.Asp227Tyr | p.D227Y | protein_coding | deleterious(0.02) | probably_damaging(0.982) | TCGA-AP-A051-01 | Endometrium | uterine corpus endometrioid carcinoma | Female | >=65 | I/II | Unknown | Unknown | SD |
| Page: 1 2 3 4 5 |
Top |
Related drugs of malignant transformation related genes |
| Identification of chemicals and drugs interact with genes involved in malignant transfromation |
| (DGIdb 4.0) |
| Entrez ID | Symbol | Category | Interaction Types | Drug Claim Name | Drug Name | PMIDs |
| 4925 | NUCB2 | DRUGGABLE GENOME | hydrochlorothiazide | HYDROCHLOROTHIAZIDE | 31327267 |
| Page: 1 |

Copyright 2023-Present -The University of Texas Health Science Center at Houston |