
|
|||||
|
 | |
| |
| |
| |
| |
| |
|
Gene: NEDD8 |
Gene summary for NEDD8 |
| Gene information | Species | Human | Gene symbol | NEDD8 | Gene ID | 4738 |
| Gene name | NEDD8 ubiquitin like modifier | |
| Gene Alias | NEDD-8 | |
| Cytomap | 14q12 | |
| Gene Type | protein-coding | GO ID | GO:0006139 | UniProtAcc | Q15843 |
Top |
Malignant transformation analysis |
| Identification of the aberrant gene expression in precancerous and cancerous lesions by comparing the gene expression of stem-like cells in diseased tissues with normal stem cells |
| Entrez ID | Symbol | Replicates | Species | Organ | Tissue | Adj P-value | Log2FC | Malignancy |
| 4738 | NEDD8 | GSM5252128_BPH327PrGF_Via | Human | Prostate | BPH | 1.73e-03 | 3.15e-01 | -0.1688 |
| 4738 | NEDD8 | GSM5252130_BPH340PrGF_Via | Human | Prostate | BPH | 6.98e-08 | 4.65e-01 | -0.1972 |
| 4738 | NEDD8 | GSM5252131_BPH340PrSF_Via | Human | Prostate | BPH | 1.61e-10 | 5.18e-01 | -0.2126 |
| 4738 | NEDD8 | GSM5252133_BPH389PrSF | Human | Prostate | BPH | 1.61e-02 | 6.01e-01 | -0.2027 |
| 4738 | NEDD8 | GSM5252135_BPH511PrPUr_Fcol_3GEX | Human | Prostate | BPH | 2.50e-02 | 3.29e-01 | -0.1833 |
| 4738 | NEDD8 | GSM5252136_BPH556PrGA1_Fcol | Human | Prostate | BPH | 5.99e-04 | 4.96e-01 | -0.23 |
| 4738 | NEDD8 | GSM5252137_BPH556PrGA2_Fcol | Human | Prostate | BPH | 2.58e-05 | 7.14e-01 | -0.23 |
| 4738 | NEDD8 | 047563_1562-all-cells | Human | Prostate | BPH | 2.00e-30 | -3.49e-01 | 0.0791 |
| 4738 | NEDD8 | 048752_1579-all-cells | Human | Prostate | BPH | 1.53e-09 | -3.88e-01 | 0.1008 |
| 4738 | NEDD8 | 052095_1628-all-cells | Human | Prostate | BPH | 3.48e-04 | -3.16e-01 | 0.1032 |
| 4738 | NEDD8 | 052097_1595-all-cells | Human | Prostate | BPH | 9.35e-03 | -3.41e-01 | 0.0972 |
| 4738 | NEDD8 | 052099_1652-all-cells | Human | Prostate | BPH | 2.48e-03 | -3.50e-01 | 0.1038 |
| 4738 | NEDD8 | Dong_P1 | Human | Prostate | Tumor | 1.11e-29 | 4.86e-01 | 0.035 |
| 4738 | NEDD8 | Dong_P3 | Human | Prostate | Tumor | 2.44e-21 | 5.07e-01 | 0.0278 |
| 4738 | NEDD8 | Dong_P4 | Human | Prostate | Tumor | 1.70e-04 | 3.76e-01 | 0.0292 |
| 4738 | NEDD8 | Dong_P5 | Human | Prostate | Tumor | 8.79e-31 | 5.51e-01 | 0.053 |
| 4738 | NEDD8 | Dong_P6 | Human | Prostate | Tumor | 2.51e-04 | 3.45e-01 | 0.0371 |
| 4738 | NEDD8 | GSM5353227_PA_PR5199-193K_Pool_1_2_3_S55_L002 | Human | Prostate | Tumor | 2.60e-03 | -1.04e-01 | 0.1602 |
| 4738 | NEDD8 | GSM5353240_PA_PR5254_T1_S15_L001 | Human | Prostate | Tumor | 1.57e-06 | 3.13e-02 | 0.1575 |
| 4738 | NEDD8 | GSM5353243_PA_PR5261_T1_S23_L002 | Human | Prostate | Tumor | 4.80e-17 | -3.64e-01 | 0.1545 |
| Page: 1 2 3 4 5 6 7 8 9 10 11 12 13 |
| Tissue | Expression Dynamics | Abbreviation |
| Cervix |  | CC: Cervix cancer |
| HSIL_HPV: HPV-infected high-grade squamous intraepithelial lesions | ||
| N_HPV: HPV-infected normal cervix | ||
| Colorectum (GSE201348) |  | FAP: Familial adenomatous polyposis |
| CRC: Colorectal cancer | ||
| Colorectum (HTA11) |  | AD: Adenomas |
| SER: Sessile serrated lesions | ||
| MSI-H: Microsatellite-high colorectal cancer | ||
| MSS: Microsatellite stable colorectal cancer | ||
| Endometrium | 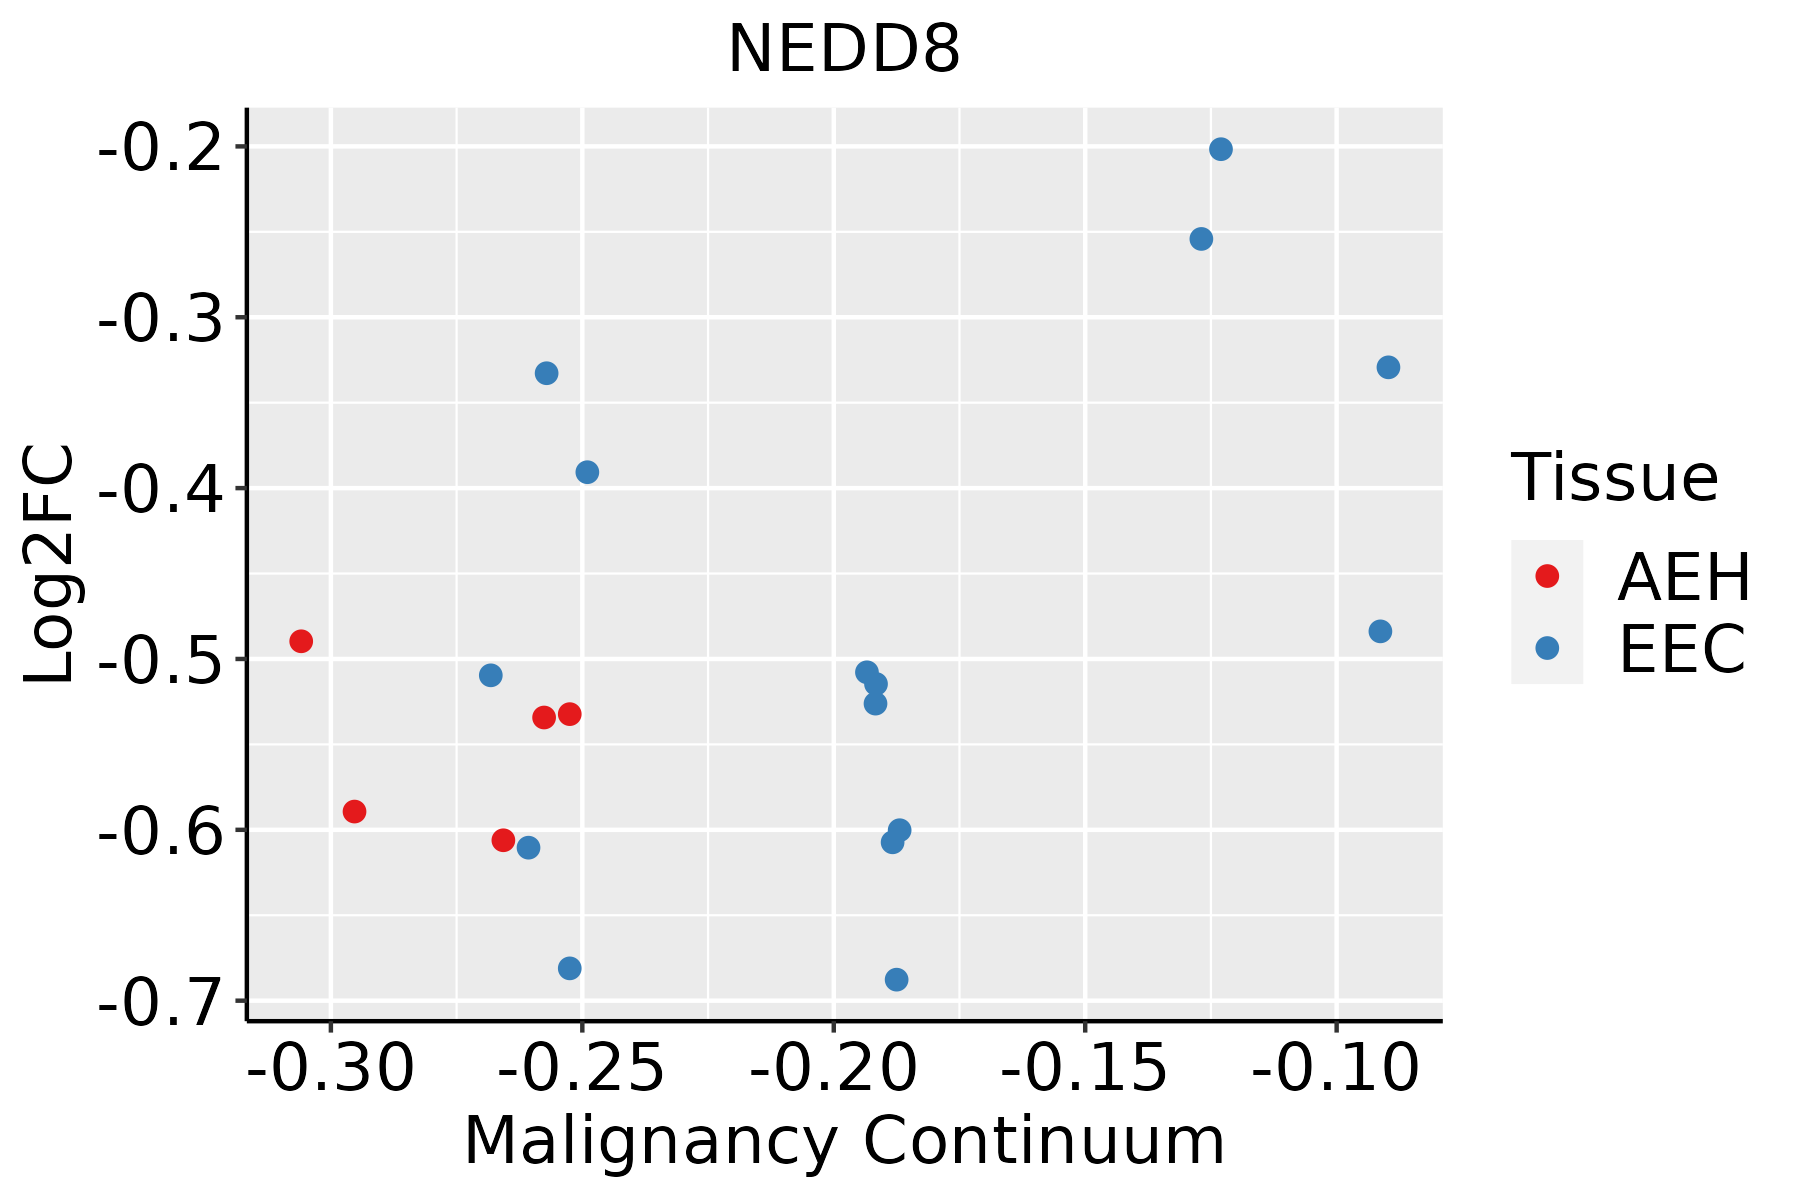 | AEH: Atypical endometrial hyperplasia |
| EEC: Endometrioid Cancer | ||
| Esophagus |  | ESCC: Esophageal squamous cell carcinoma |
| HGIN: High-grade intraepithelial neoplasias | ||
| LGIN: Low-grade intraepithelial neoplasias | ||
| GC | 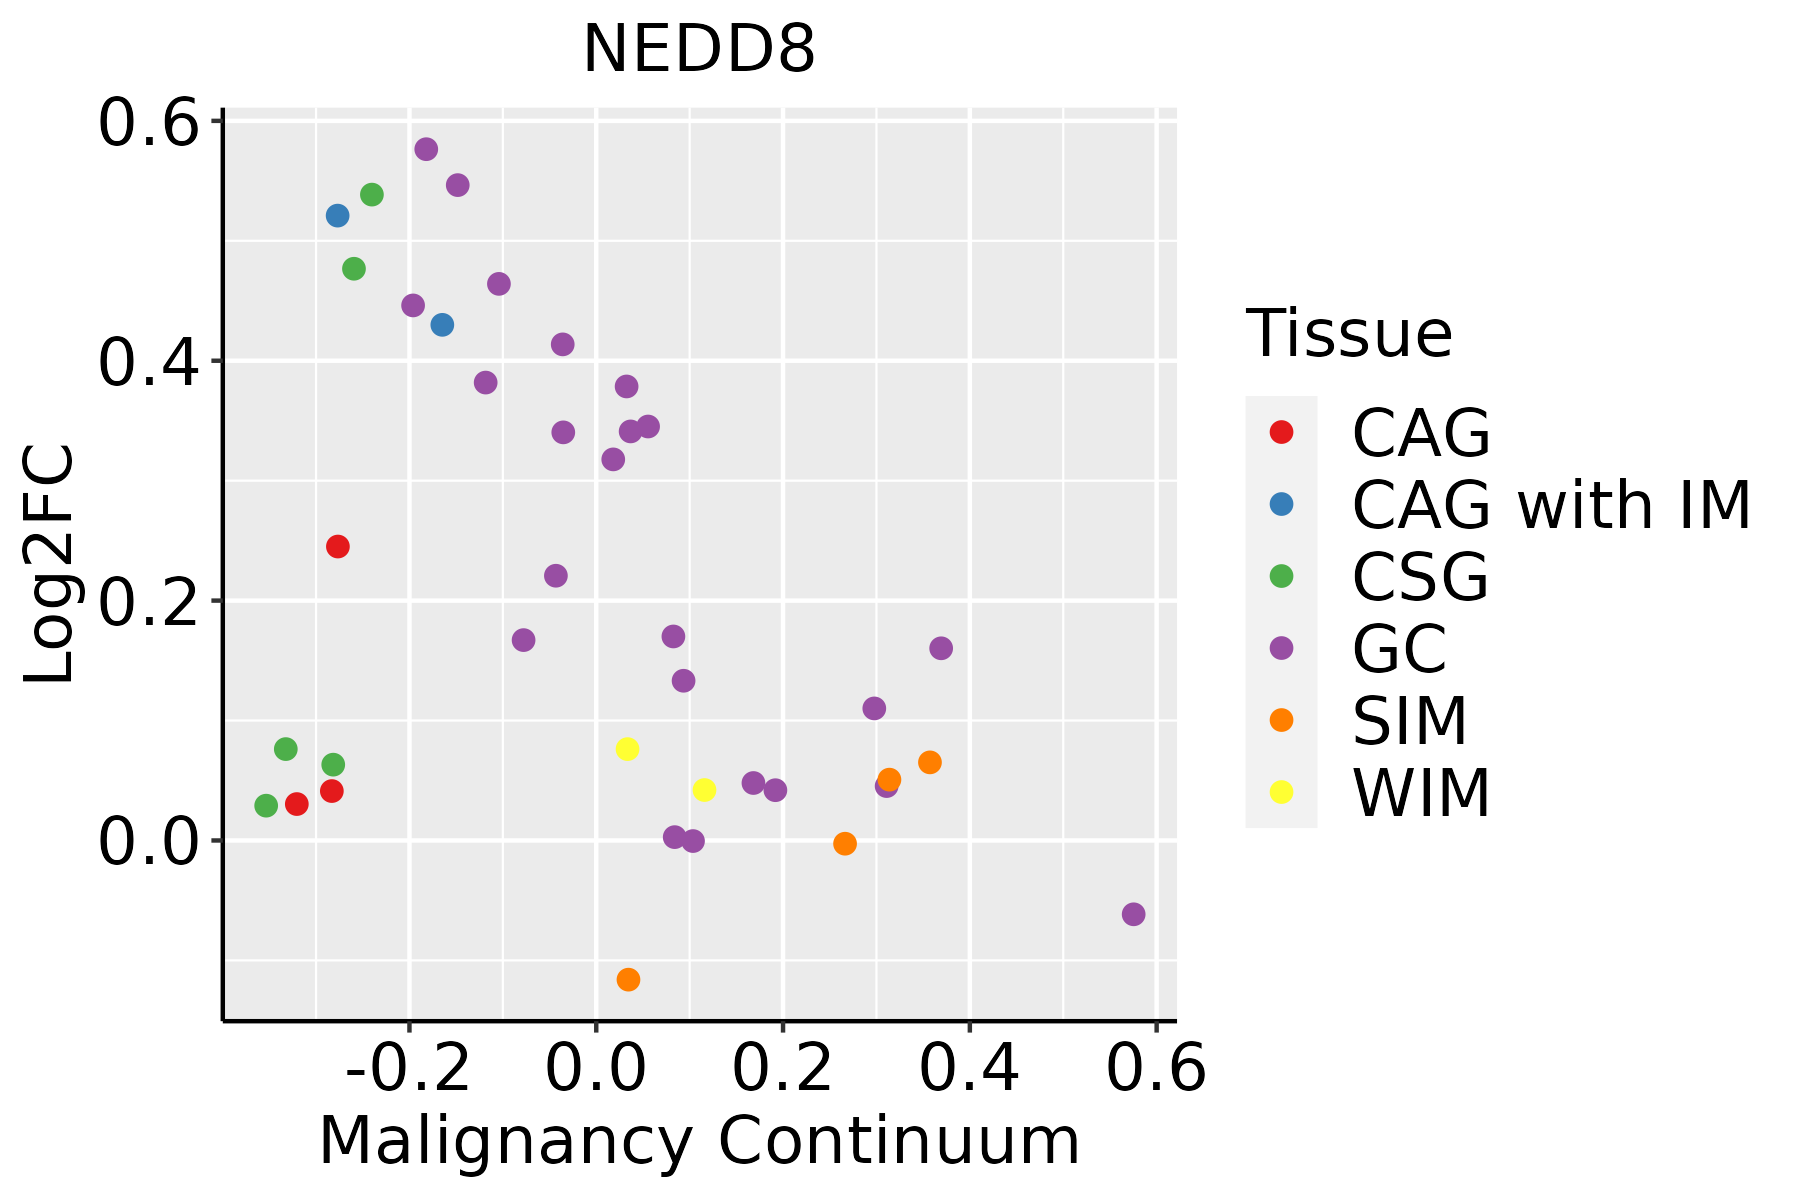 | CAG: Chronic atrophic gastritis |
| CAG with IM: Chronic atrophic gastritis with intestinal metaplasia | ||
| CSG: Chronic superficial gastritis | ||
| GC: Gastric cancer | ||
| SIM: Severe intestinal metaplasia | ||
| WIM: Wild intestinal metaplasia | ||
| Liver |  | HCC: Hepatocellular carcinoma |
| NAFLD: Non-alcoholic fatty liver disease | ||
| Oral Cavity |  | EOLP: Erosive Oral lichen planus |
| LP: leukoplakia | ||
| NEOLP: Non-erosive oral lichen planus | ||
| OSCC: Oral squamous cell carcinoma | ||
| Prostate | 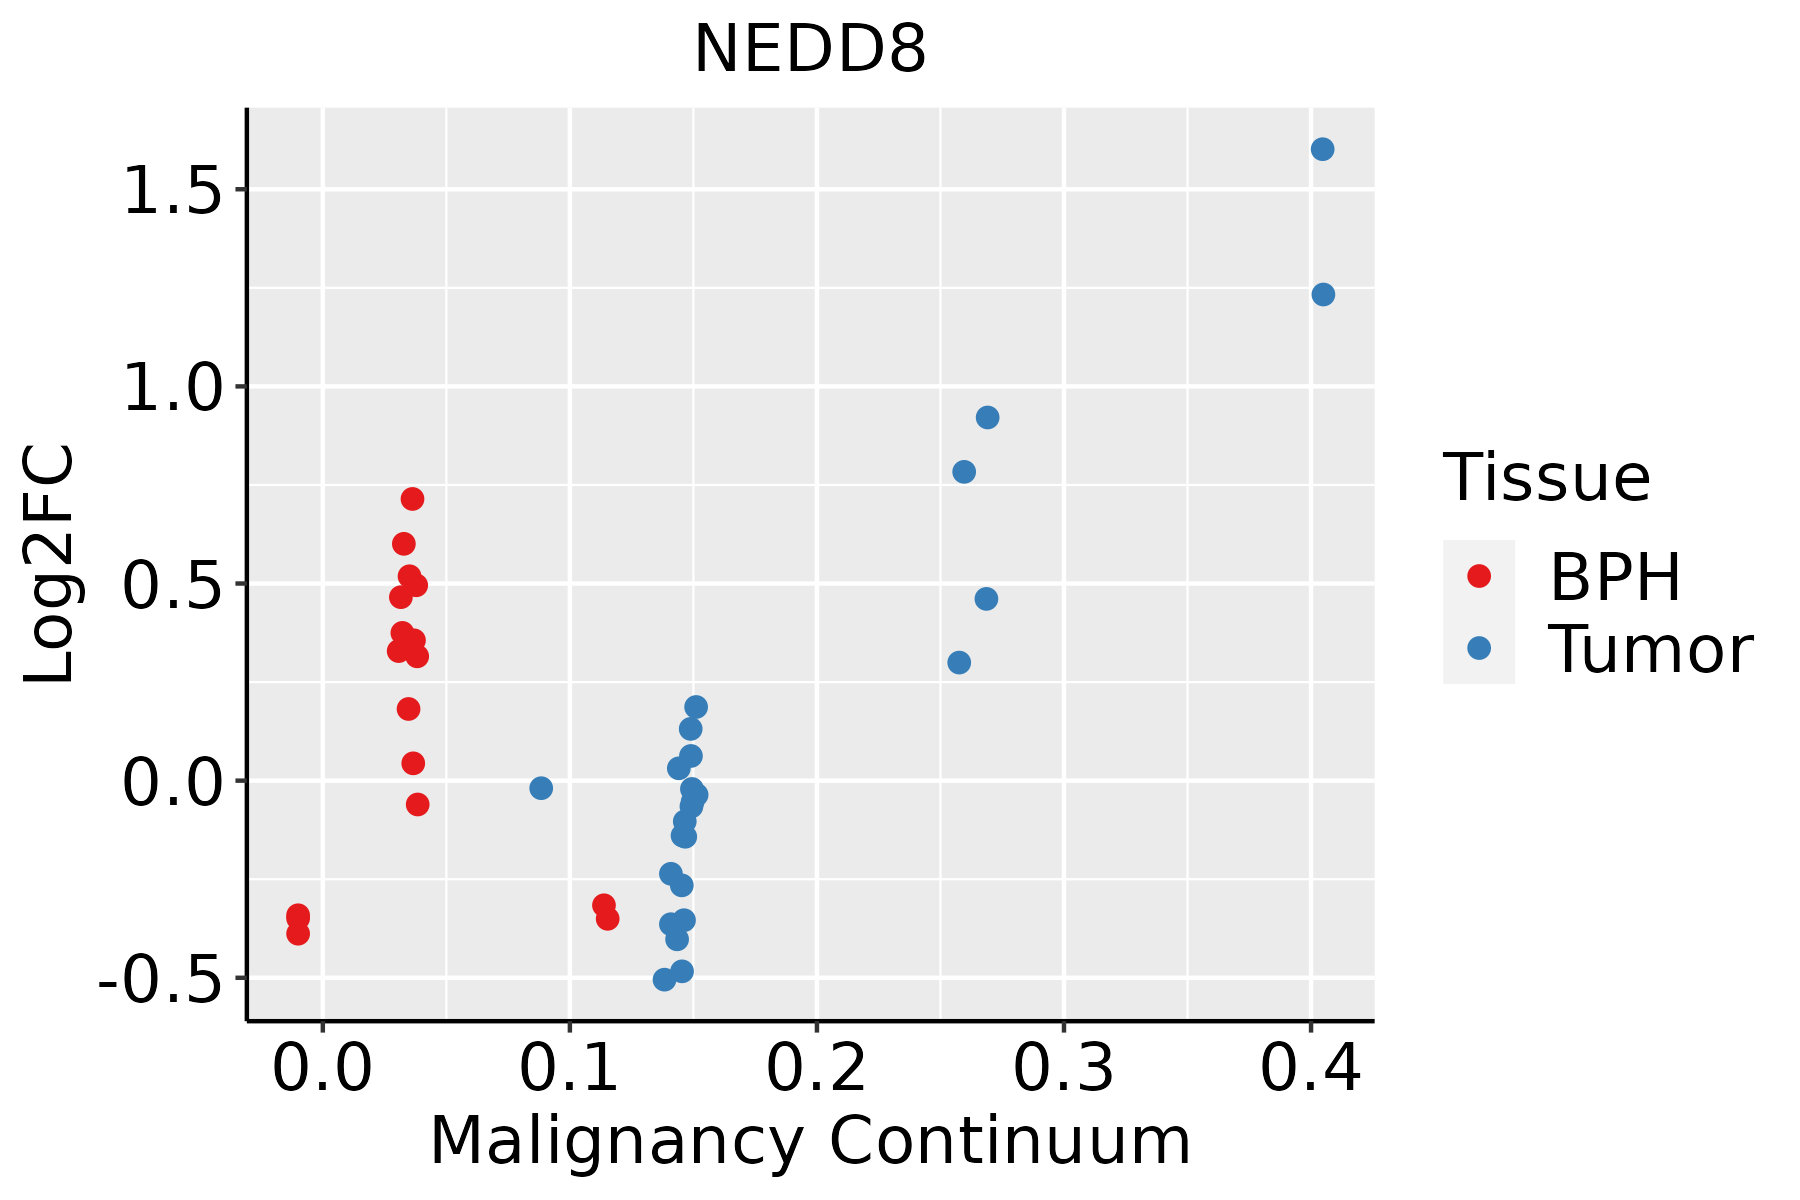 | BPH: Benign Prostatic Hyperplasia |
| Skin |  | AK: Actinic keratosis |
| cSCC: Cutaneous squamous cell carcinoma | ||
| SCCIS:squamous cell carcinoma in situ | ||
| Thyroid |  | ATC: Anaplastic thyroid cancer |
| HT: Hashimoto's thyroiditis | ||
| PTC: Papillary thyroid cancer |
| ∗log2FC in expression of this searched gene in stem-like cells from each diseased tissue sample relative to stem-like cells in normal samples in each tissue plotted against the malignancy continuum. Samples are colored based on if they are from different disease stage. |
Top |
Malignant transformation related pathway analysis |
| Find out the enriched GO biological processes and KEGG pathways involved in transition from healthy to precancer to cancer |
| Tissue | Disease Stage | Enriched GO biological Processes |
| Colorectum | AD |  |
| Colorectum | SER |  |
| Colorectum | MSS |  |
| Colorectum | MSI-H |  |
| Colorectum | FAP |  |
| ∗Top 15 enriched GO BP terms are showed in the bar plot of each disease state in each tissue. Each row represents a significant GO biological process which is colored according to the -log10(p.adjust). |
| Page: 1 2 3 4 5 6 7 8 9 |
| GO ID | Tissue | Disease Stage | Description | Gene Ratio | Bg Ratio | pvalue | p.adjust | Count |
| GO:00451162 | Cervix | CC | protein neddylation | 7/2311 | 18/18723 | 3.99e-03 | 2.48e-02 | 7 |
| GO:00451163 | Endometrium | AEH | protein neddylation | 7/2100 | 18/18723 | 2.29e-03 | 1.74e-02 | 7 |
| GO:004511611 | Endometrium | EEC | protein neddylation | 7/2168 | 18/18723 | 2.76e-03 | 1.97e-02 | 7 |
| GO:00451166 | Esophagus | HGIN | protein neddylation | 8/2587 | 18/18723 | 1.58e-03 | 1.79e-02 | 8 |
| GO:004511614 | Esophagus | ESCC | protein neddylation | 15/8552 | 18/18723 | 1.20e-03 | 5.88e-03 | 15 |
| GO:0045116 | Liver | Cirrhotic | protein neddylation | 11/4634 | 18/18723 | 1.13e-03 | 7.73e-03 | 11 |
| GO:00451161 | Liver | HCC | protein neddylation | 15/7958 | 18/18723 | 4.74e-04 | 3.12e-03 | 15 |
| GO:00451165 | Oral cavity | OSCC | protein neddylation | 13/7305 | 18/18723 | 4.45e-03 | 1.79e-02 | 13 |
| GO:004511613 | Oral cavity | LP | protein neddylation | 11/4623 | 18/18723 | 1.11e-03 | 9.13e-03 | 11 |
| GO:004511621 | Oral cavity | NEOLP | protein neddylation | 7/2005 | 18/18723 | 1.75e-03 | 1.21e-02 | 7 |
| GO:00451164 | Prostate | BPH | protein neddylation | 10/3107 | 18/18723 | 1.87e-04 | 1.55e-03 | 10 |
| GO:004511612 | Prostate | Tumor | protein neddylation | 10/3246 | 18/18723 | 2.72e-04 | 2.24e-03 | 10 |
| GO:004511615 | Skin | cSCC | protein neddylation | 14/4864 | 18/18723 | 6.37e-06 | 8.92e-05 | 14 |
| GO:004511616 | Thyroid | PTC | protein neddylation | 13/5968 | 18/18723 | 5.21e-04 | 3.37e-03 | 13 |
| GO:004511622 | Thyroid | ATC | protein neddylation | 13/6293 | 18/18723 | 9.27e-04 | 4.98e-03 | 13 |
| Page: 1 |
| Pathway ID | Tissue | Disease Stage | Description | Gene Ratio | Bg Ratio | pvalue | p.adjust | qvalue | Count |
| Page: 1 |
Top |
Cell-cell communication analysis |
| Identification of potential cell-cell interactions between two cell types and their ligand-receptor pairs for different disease states |
| Ligand | Receptor | LRpair | Pathway | Tissue | Disease Stage |
| Page: 1 |
Top |
Single-cell gene regulatory network inference analysis |
| Find out the significant the regulons (TFs) and the target genes of each regulon across cell types for different disease states |
| TF | Cell Type | Tissue | Disease Stage | Target Gene | RSS | Regulon Activity |
| ∗The dot plots of a searched regulon are shown for all cell subpopulations in each disease state of each tissue based on the regulon specific score inferred using pySCENIC and by calculating the average expression. |
| Page: 1 |
Top |
Somatic mutation of malignant transformation related genes |
| Annotation of somatic variants for genes involved in malignant transformation |
| Hugo Symbol | Variant Class | Variant Classification | dbSNP RS | HGVSc | HGVSp | HGVSp Short | SWISSPROT | BIOTYPE | SIFT | PolyPhen | Tumor Sample Barcode | Tissue | Histology | Sex | Age | Stage | Therapy Types | Drugs | Outcome |
| NEDD8 | SNV | Missense_Mutation | c.78N>G | p.Ile26Met | p.I26M | Q15843 | protein_coding | deleterious(0) | probably_damaging(1) | TCGA-A2-A0YK-01 | Breast | breast invasive carcinoma | Female | <65 | I/II | Chemotherapy | cytoxan | SD | |
| NEDD8 | SNV | Missense_Mutation | c.74N>A | p.Arg25Gln | p.R25Q | Q15843 | protein_coding | tolerated(0.22) | benign(0.328) | TCGA-AG-3892-01 | Colorectum | rectum adenocarcinoma | Female | <65 | I/II | Unknown | Unknown | SD | |
| NEDD8 | SNV | Missense_Mutation | novel | c.13N>A | p.Val5Met | p.V5M | Q15843 | protein_coding | deleterious(0) | possibly_damaging(0.668) | TCGA-AP-A1DV-01 | Endometrium | uterine corpus endometrioid carcinoma | Female | <65 | I/II | Unknown | Unknown | SD |
| NEDD8 | SNV | Missense_Mutation | novel | c.66N>T | p.Lys22Asn | p.K22N | Q15843 | protein_coding | deleterious(0.03) | probably_damaging(0.957) | TCGA-B5-A1MR-01 | Endometrium | uterine corpus endometrioid carcinoma | Female | >=65 | III/IV | Unknown | Unknown | SD |
| NEDD8 | SNV | Missense_Mutation | novel | c.28N>A | p.Gly10Arg | p.G10R | Q15843 | protein_coding | tolerated(0.08) | possibly_damaging(0.725) | TCGA-B5-A3FA-01 | Endometrium | uterine corpus endometrioid carcinoma | Female | >=65 | I/II | Unknown | Unknown | SD |
| NEDD8 | SNV | Missense_Mutation | c.74N>A | p.Arg25Gln | p.R25Q | Q15843 | protein_coding | tolerated(0.22) | benign(0.328) | TCGA-05-4403-01 | Lung | lung adenocarcinoma | Male | >=65 | I/II | Unknown | Unknown | SD | |
| NEDD8 | SNV | Missense_Mutation | novel | c.67N>A | p.Val23Met | p.V23M | Q15843 | protein_coding | deleterious(0.02) | probably_damaging(0.954) | TCGA-05-4433-01 | Lung | lung adenocarcinoma | Male | >=65 | I/II | Unknown | Unknown | SD |
| NEDD8 | SNV | Missense_Mutation | novel | c.164N>G | p.Thr55Arg | p.T55R | Q15843 | protein_coding | deleterious(0.01) | benign(0.037) | TCGA-DQ-5625-01 | Oral cavity | head & neck squamous cell carcinoma | Female | <65 | I/II | Unknown | Unknown | PD |
| NEDD8 | SNV | Missense_Mutation | novel | c.20N>T | p.Thr7Met | p.T7M | Q15843 | protein_coding | deleterious(0.01) | probably_damaging(1) | TCGA-UF-A719-01 | Oral cavity | head & neck squamous cell carcinoma | Male | <65 | I/II | Unknown | Unknown | SD |
| Page: 1 |
Top |
Related drugs of malignant transformation related genes |
| Identification of chemicals and drugs interact with genes involved in malignant transfromation |
| (DGIdb 4.0) |
| Entrez ID | Symbol | Category | Interaction Types | Drug Claim Name | Drug Name | PMIDs |
| 4738 | NEDD8 | ENZYME | MLN4924 |
| Page: 1 |

Copyright 2023-Present -The University of Texas Health Science Center at Houston |