
|
|||||
|
 | |
| |
| |
| |
| |
| |
|
Gene: MLEC |
Gene summary for MLEC |
| Gene information | Species | Human | Gene symbol | MLEC | Gene ID | 9761 |
| Gene name | malectin | |
| Gene Alias | KIAA0152 | |
| Cytomap | 12q24.31 | |
| Gene Type | protein-coding | GO ID | GO:0005975 | UniProtAcc | F5GX14 |
Top |
Malignant transformation analysis |
| Identification of the aberrant gene expression in precancerous and cancerous lesions by comparing the gene expression of stem-like cells in diseased tissues with normal stem cells |
| Entrez ID | Symbol | Replicates | Species | Organ | Tissue | Adj P-value | Log2FC | Malignancy |
| 9761 | MLEC | SYSMH1 | Human | Oral cavity | OSCC | 1.17e-18 | 6.41e-01 | 0.1127 |
| 9761 | MLEC | SYSMH2 | Human | Oral cavity | OSCC | 9.77e-15 | 1.02e+00 | 0.2326 |
| 9761 | MLEC | SYSMH3 | Human | Oral cavity | OSCC | 4.92e-40 | 1.38e+00 | 0.2442 |
| 9761 | MLEC | SYSMH5 | Human | Oral cavity | OSCC | 3.68e-11 | 5.92e-01 | 0.0647 |
| 9761 | MLEC | SYSMH6 | Human | Oral cavity | OSCC | 1.37e-08 | 5.94e-01 | 0.1275 |
| 9761 | MLEC | GSM5252130_BPH340PrGF_Via | Human | Prostate | BPH | 2.67e-12 | 4.82e-01 | -0.1972 |
| 9761 | MLEC | GSM5252131_BPH340PrSF_Via | Human | Prostate | BPH | 2.65e-03 | 3.31e-01 | -0.2126 |
| 9761 | MLEC | GSM5252132_BPH389PrGF | Human | Prostate | BPH | 7.37e-04 | 6.88e-01 | -0.2247 |
| 9761 | MLEC | GSM5252133_BPH389PrSF | Human | Prostate | BPH | 6.84e-04 | 6.98e-01 | -0.2027 |
| 9761 | MLEC | GSM5252135_BPH511PrPUr_Fcol_3GEX | Human | Prostate | BPH | 1.50e-06 | 4.45e-01 | -0.1833 |
| 9761 | MLEC | GSM5252137_BPH556PrGA2_Fcol | Human | Prostate | BPH | 5.57e-04 | 4.49e-01 | -0.23 |
| 9761 | MLEC | 047563_1562-all-cells | Human | Prostate | BPH | 6.95e-10 | -1.11e-01 | 0.0791 |
| 9761 | MLEC | Dong_P1 | Human | Prostate | Tumor | 1.54e-20 | 2.63e-01 | 0.035 |
| 9761 | MLEC | Dong_P3 | Human | Prostate | Tumor | 5.22e-18 | 2.64e-01 | 0.0278 |
| 9761 | MLEC | Dong_P4 | Human | Prostate | Tumor | 5.16e-11 | 4.06e-01 | 0.0292 |
| 9761 | MLEC | Dong_P5 | Human | Prostate | Tumor | 9.24e-27 | 4.09e-01 | 0.053 |
| 9761 | MLEC | GSM5353225_PA_PR5196-1_Pool_1_2_3_S53_L002 | Human | Prostate | Tumor | 8.11e-04 | 4.66e-01 | 0.1619 |
| 9761 | MLEC | GSM5353226_PA_PR5196-2_Pool_1_2_3_S54_L002 | Human | Prostate | Tumor | 6.56e-03 | 5.99e-01 | 0.159 |
| 9761 | MLEC | GSM5353227_PA_PR5199-193K_Pool_1_2_3_S55_L002 | Human | Prostate | Tumor | 8.01e-05 | 3.03e-01 | 0.1602 |
| 9761 | MLEC | GSM5353243_PA_PR5261_T1_S23_L002 | Human | Prostate | Tumor | 1.68e-06 | 5.45e-02 | 0.1545 |
| Page: 1 2 3 4 5 6 7 8 9 10 11 12 13 |
| Tissue | Expression Dynamics | Abbreviation |
| Cervix | 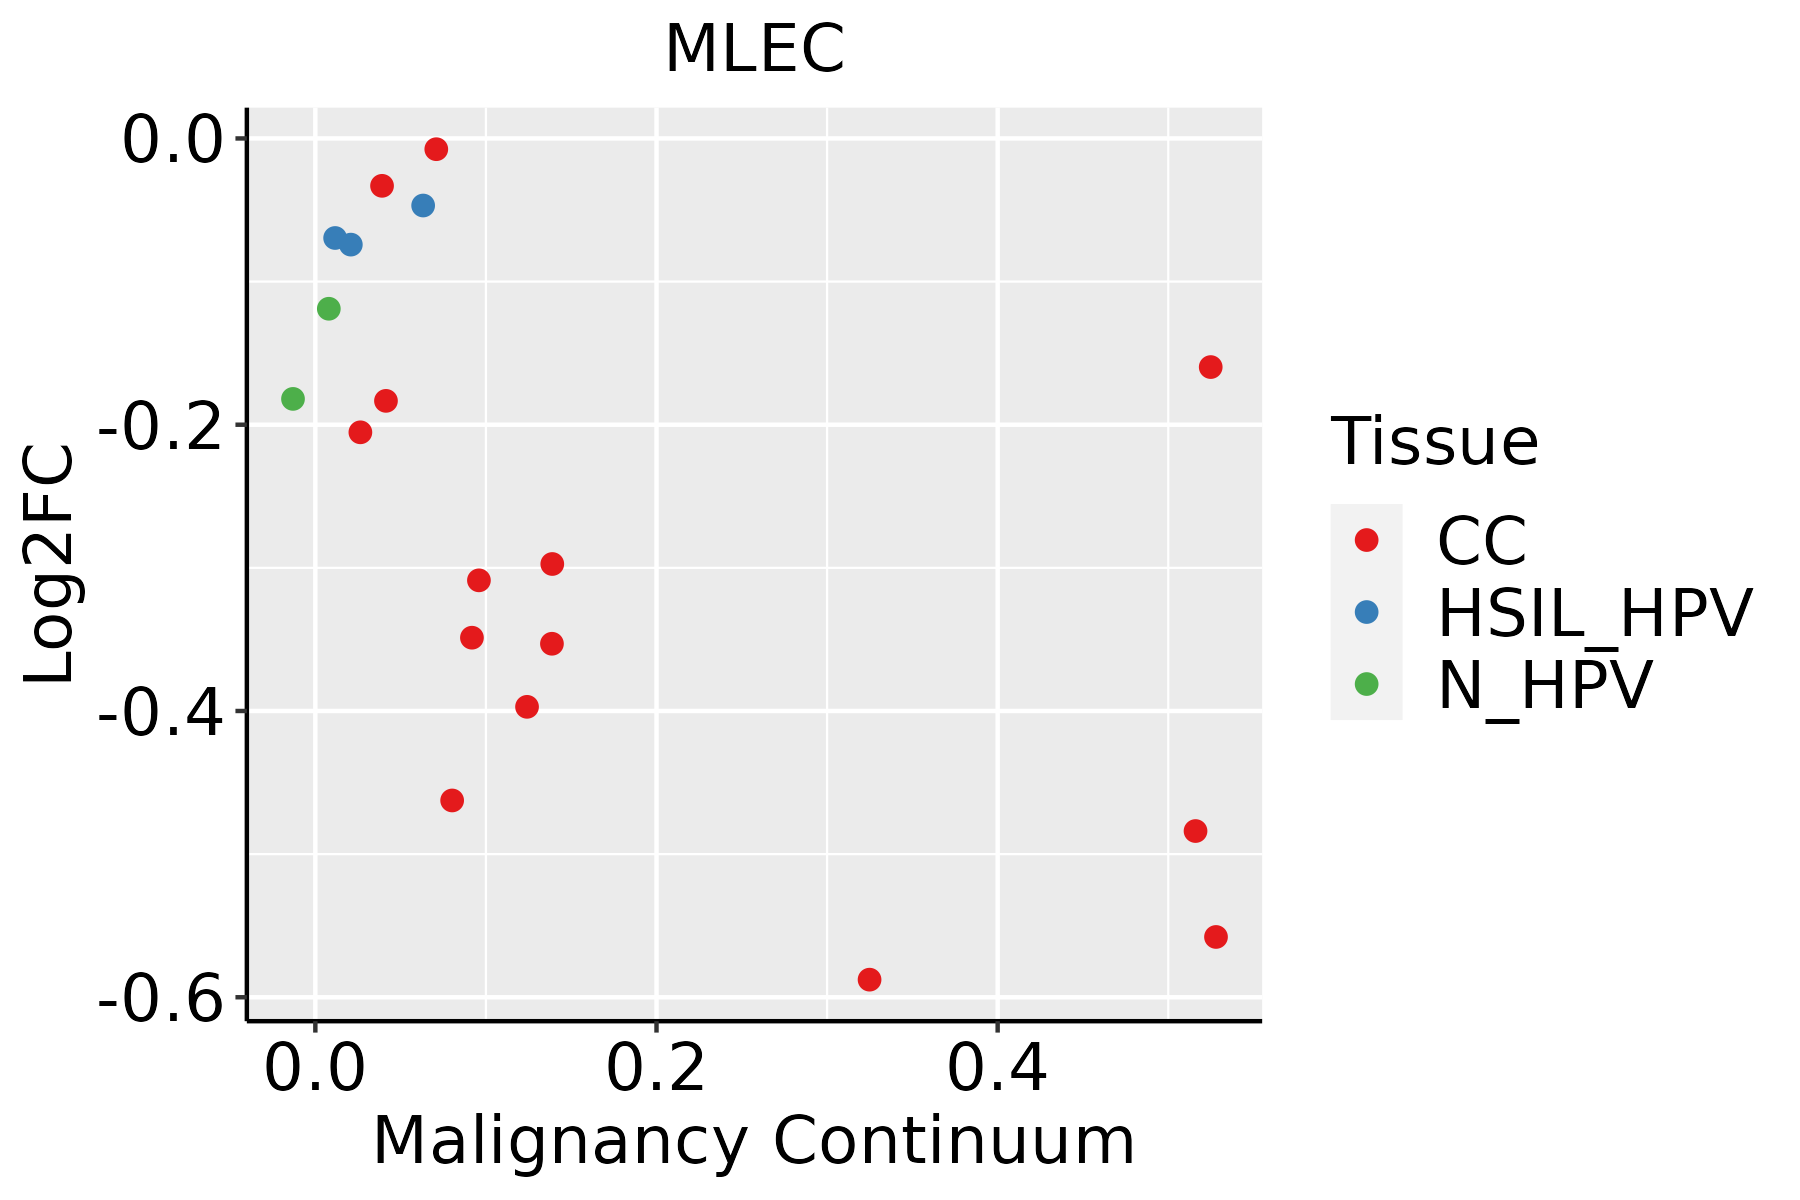 | CC: Cervix cancer |
| HSIL_HPV: HPV-infected high-grade squamous intraepithelial lesions | ||
| N_HPV: HPV-infected normal cervix | ||
| Colorectum (GSE201348) |  | FAP: Familial adenomatous polyposis |
| CRC: Colorectal cancer | ||
| Colorectum (HTA11) | 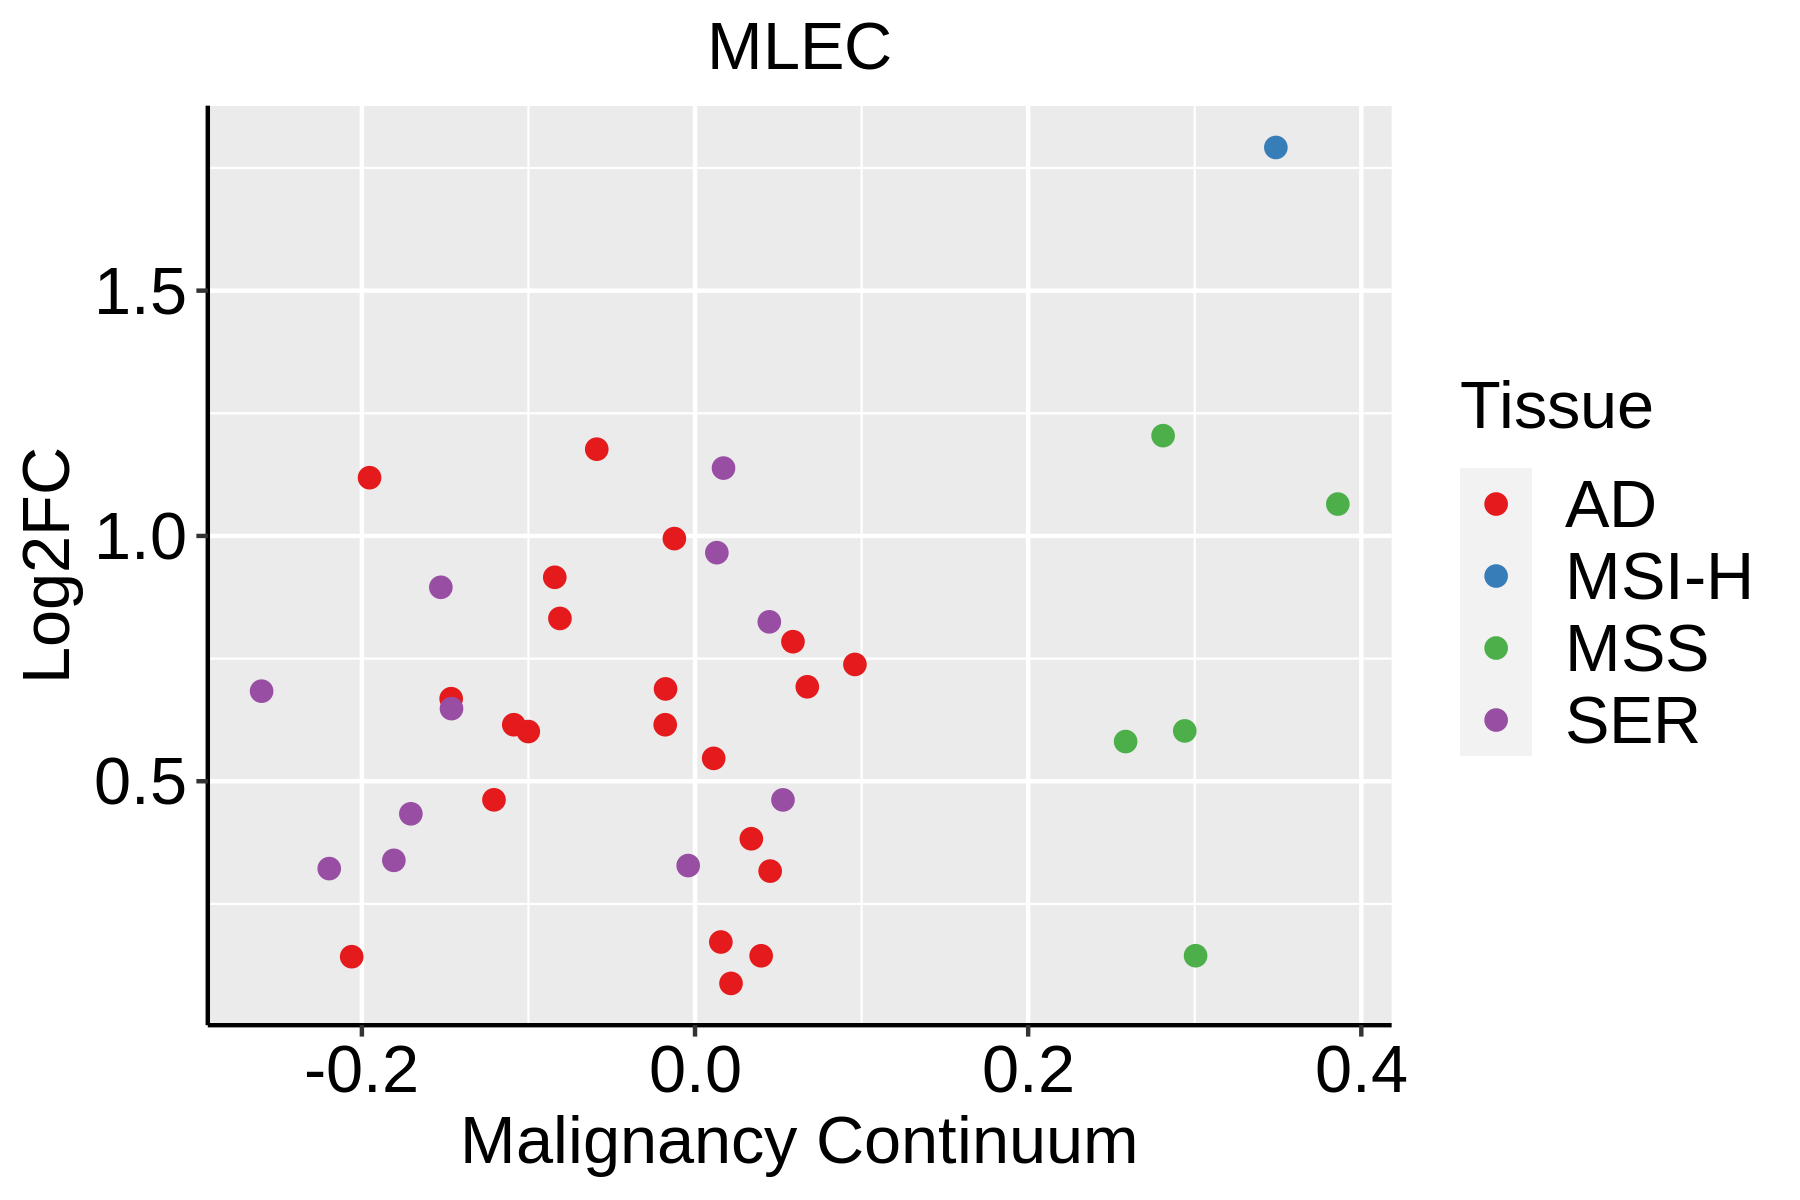 | AD: Adenomas |
| SER: Sessile serrated lesions | ||
| MSI-H: Microsatellite-high colorectal cancer | ||
| MSS: Microsatellite stable colorectal cancer | ||
| Endometrium |  | AEH: Atypical endometrial hyperplasia |
| EEC: Endometrioid Cancer | ||
| Esophagus |  | ESCC: Esophageal squamous cell carcinoma |
| HGIN: High-grade intraepithelial neoplasias | ||
| LGIN: Low-grade intraepithelial neoplasias | ||
| GC |  | CAG: Chronic atrophic gastritis |
| CAG with IM: Chronic atrophic gastritis with intestinal metaplasia | ||
| CSG: Chronic superficial gastritis | ||
| GC: Gastric cancer | ||
| SIM: Severe intestinal metaplasia | ||
| WIM: Wild intestinal metaplasia | ||
| Liver |  | HCC: Hepatocellular carcinoma |
| NAFLD: Non-alcoholic fatty liver disease | ||
| Oral Cavity | 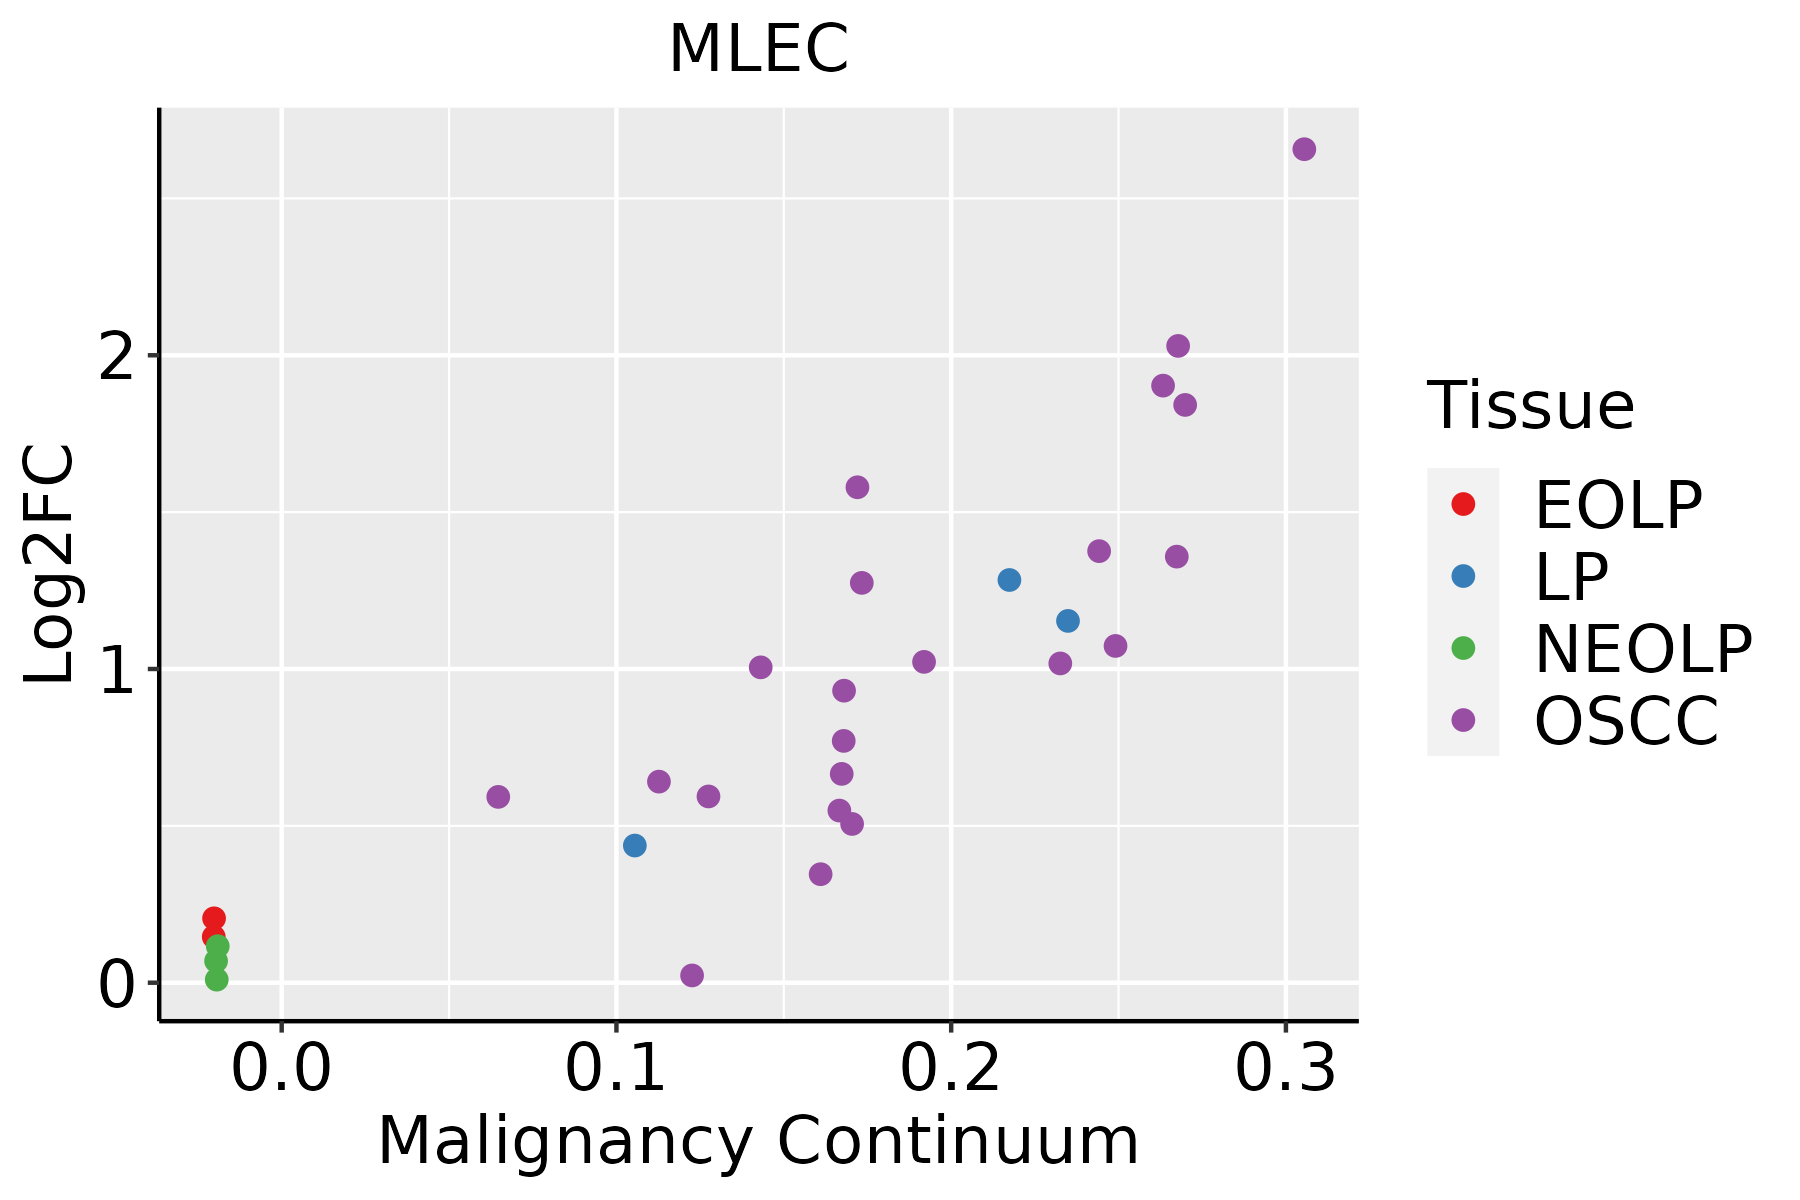 | EOLP: Erosive Oral lichen planus |
| LP: leukoplakia | ||
| NEOLP: Non-erosive oral lichen planus | ||
| OSCC: Oral squamous cell carcinoma | ||
| Prostate | 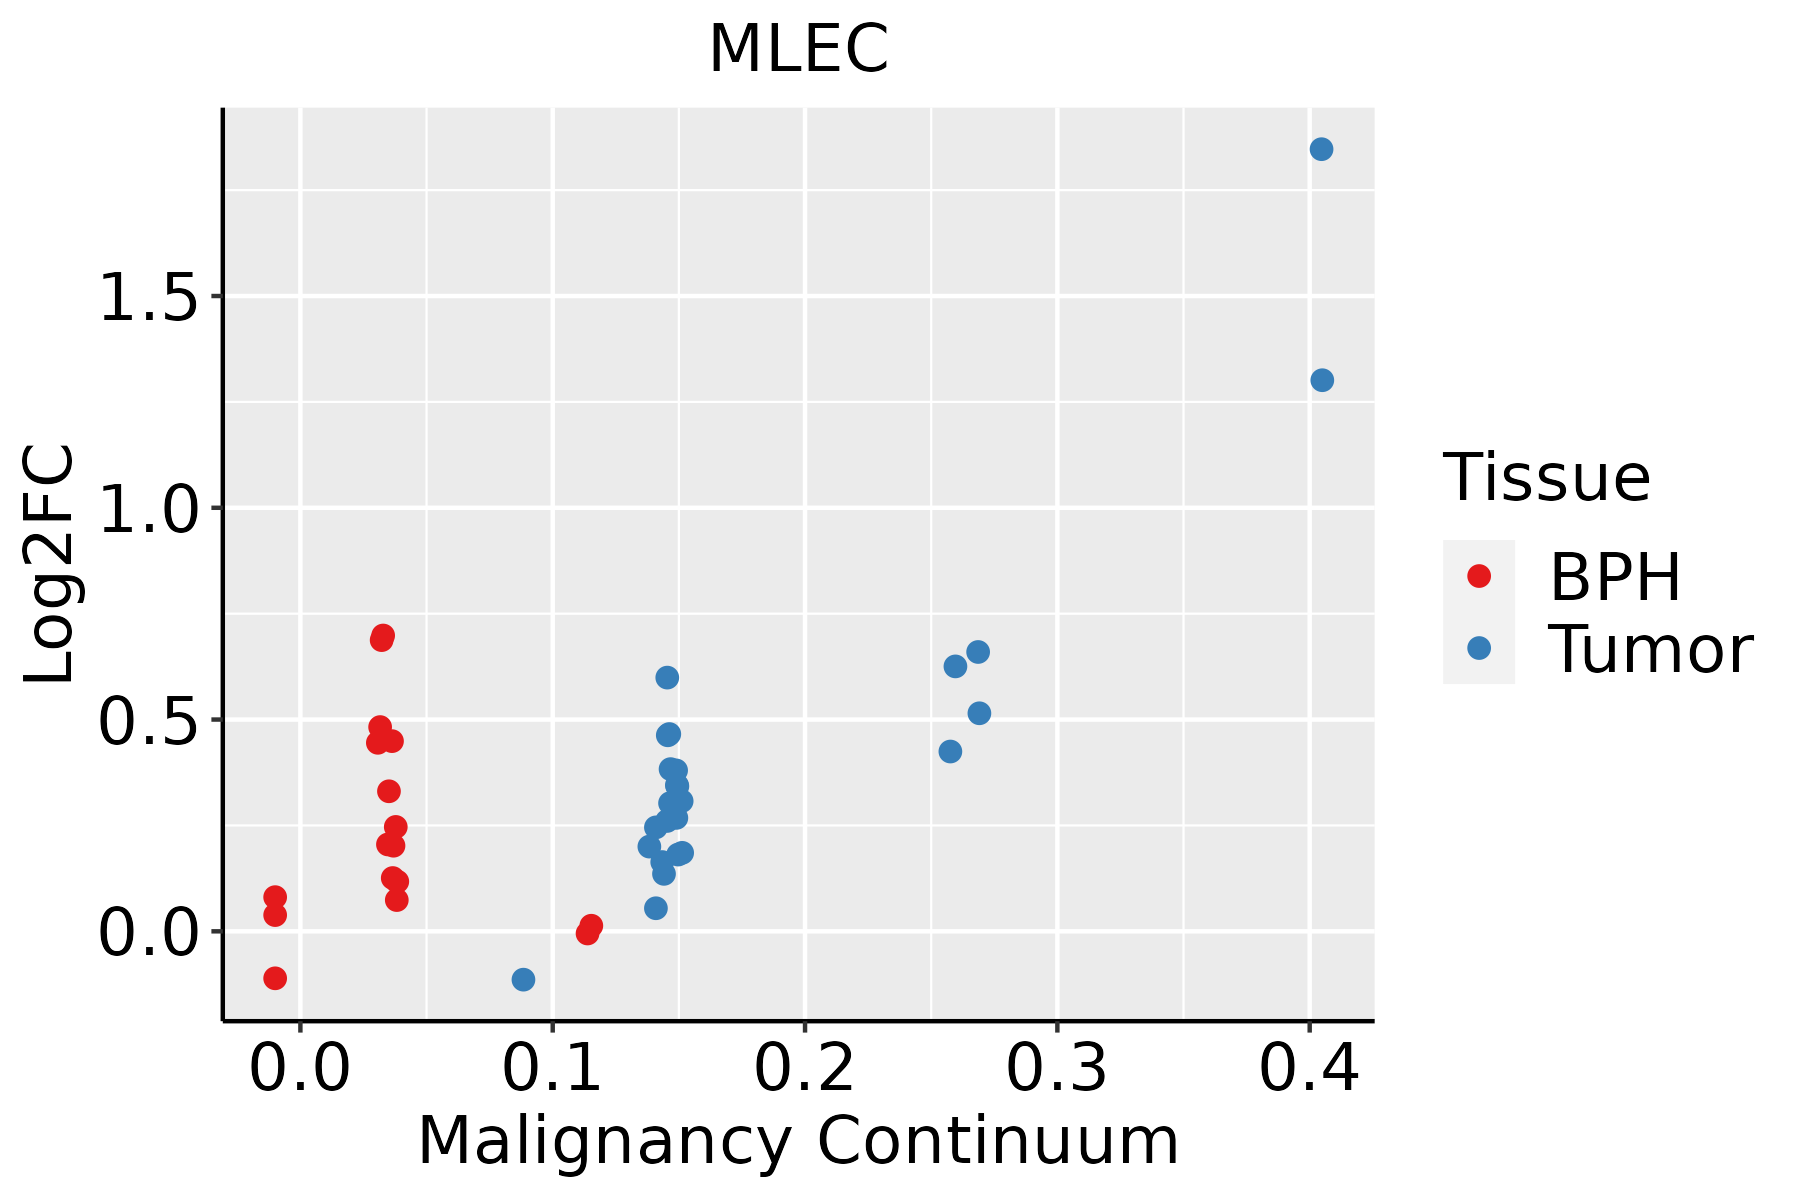 | BPH: Benign Prostatic Hyperplasia |
| Skin | 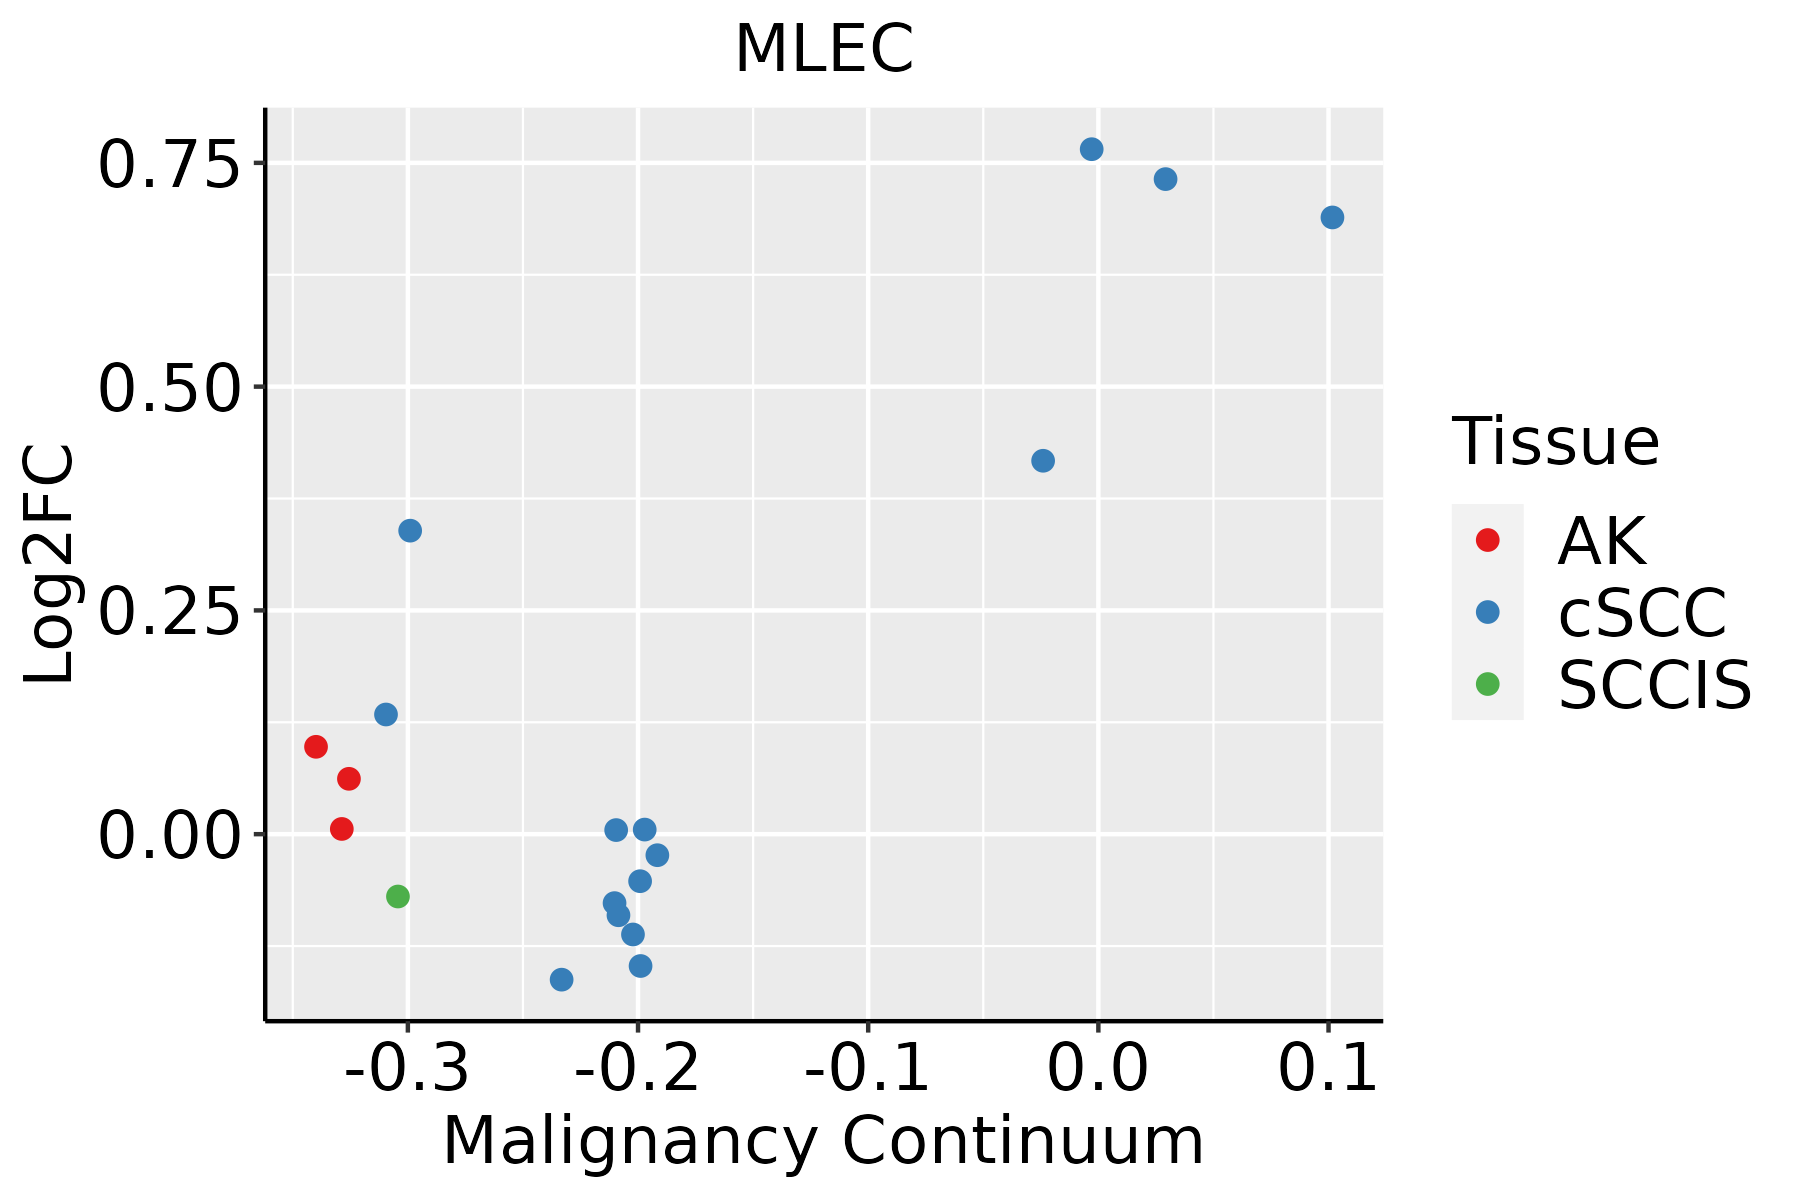 | AK: Actinic keratosis |
| cSCC: Cutaneous squamous cell carcinoma | ||
| SCCIS:squamous cell carcinoma in situ | ||
| Thyroid | 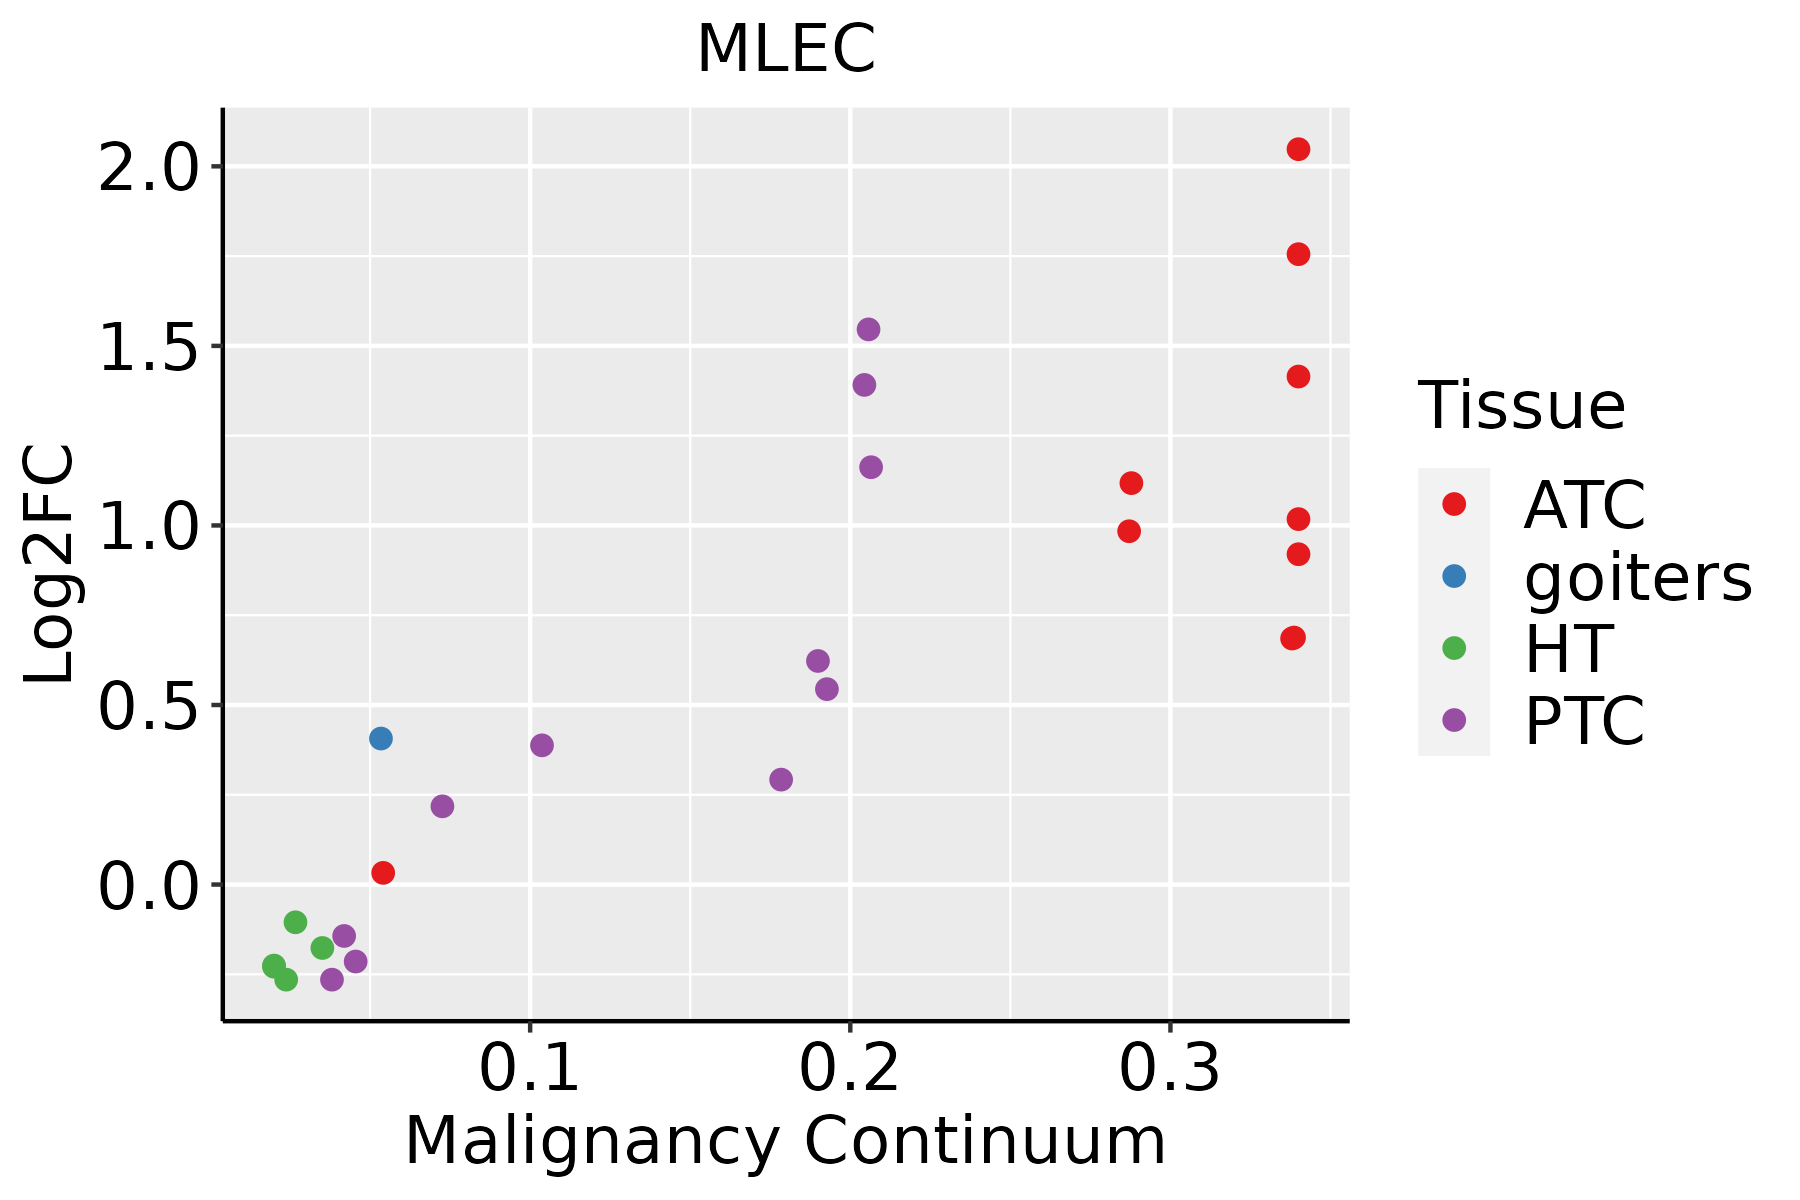 | ATC: Anaplastic thyroid cancer |
| HT: Hashimoto's thyroiditis | ||
| PTC: Papillary thyroid cancer |
| ∗log2FC in expression of this searched gene in stem-like cells from each diseased tissue sample relative to stem-like cells in normal samples in each tissue plotted against the malignancy continuum. Samples are colored based on if they are from different disease stage. |
Top |
Malignant transformation related pathway analysis |
| Find out the enriched GO biological processes and KEGG pathways involved in transition from healthy to precancer to cancer |
| Tissue | Disease Stage | Enriched GO biological Processes |
| Colorectum | AD |  |
| Colorectum | SER |  |
| Colorectum | MSS |  |
| Colorectum | MSI-H |  |
| Colorectum | FAP |  |
| ∗Top 15 enriched GO BP terms are showed in the bar plot of each disease state in each tissue. Each row represents a significant GO biological process which is colored according to the -log10(p.adjust). |
| Page: 1 2 3 4 5 6 7 8 9 |
| GO ID | Tissue | Disease Stage | Description | Gene Ratio | Bg Ratio | pvalue | p.adjust | Count |
| Page: 1 |
| Pathway ID | Tissue | Disease Stage | Description | Gene Ratio | Bg Ratio | pvalue | p.adjust | qvalue | Count |
| Page: 1 |
Top |
Cell-cell communication analysis |
| Identification of potential cell-cell interactions between two cell types and their ligand-receptor pairs for different disease states |
| Ligand | Receptor | LRpair | Pathway | Tissue | Disease Stage |
| Page: 1 |
Top |
Single-cell gene regulatory network inference analysis |
| Find out the significant the regulons (TFs) and the target genes of each regulon across cell types for different disease states |
| TF | Cell Type | Tissue | Disease Stage | Target Gene | RSS | Regulon Activity |
| ∗The dot plots of a searched regulon are shown for all cell subpopulations in each disease state of each tissue based on the regulon specific score inferred using pySCENIC and by calculating the average expression. |
| Page: 1 |
Top |
Somatic mutation of malignant transformation related genes |
| Annotation of somatic variants for genes involved in malignant transformation |
| Hugo Symbol | Variant Class | Variant Classification | dbSNP RS | HGVSc | HGVSp | HGVSp Short | SWISSPROT | BIOTYPE | SIFT | PolyPhen | Tumor Sample Barcode | Tissue | Histology | Sex | Age | Stage | Therapy Types | Drugs | Outcome |
| MLEC | SNV | Missense_Mutation | c.415N>T | p.Val139Leu | p.V139L | Q14165 | protein_coding | deleterious(0) | probably_damaging(0.963) | TCGA-AN-A0XV-01 | Breast | breast invasive carcinoma | Female | >=65 | III/IV | Unknown | Unknown | SD | |
| MLEC | SNV | Missense_Mutation | c.595N>C | p.Tyr199His | p.Y199H | Q14165 | protein_coding | tolerated(0.31) | benign(0.242) | TCGA-D8-A1XK-01 | Breast | breast invasive carcinoma | Female | <65 | I/II | Chemotherapy | doxorubicine+cyclophosphamide | SD | |
| MLEC | SNV | Missense_Mutation | c.316N>A | p.Glu106Lys | p.E106K | Q14165 | protein_coding | tolerated(0.65) | benign(0.094) | TCGA-EK-A2RA-01 | Cervix | cervical & endocervical cancer | Female | >=65 | I/II | Unknown | Unknown | SD | |
| MLEC | SNV | Missense_Mutation | rs768581342 | c.757N>T | p.Arg253Trp | p.R253W | Q14165 | protein_coding | deleterious(0) | probably_damaging(0.979) | TCGA-AA-3977-01 | Colorectum | colon adenocarcinoma | Male | >=65 | I/II | Unknown | Unknown | SD |
| MLEC | SNV | Missense_Mutation | c.259C>T | p.Pro87Ser | p.P87S | Q14165 | protein_coding | tolerated(0.45) | benign(0.017) | TCGA-AD-6964-01 | Colorectum | colon adenocarcinoma | Male | <65 | III/IV | Chemotherapy | folfox | PD | |
| MLEC | SNV | Missense_Mutation | novel | c.530N>C | p.Lys177Thr | p.K177T | Q14165 | protein_coding | deleterious(0.05) | benign(0.267) | TCGA-CA-6717-01 | Colorectum | colon adenocarcinoma | Male | <65 | I/II | Chemotherapy | oxaliplatin | CR |
| MLEC | SNV | Missense_Mutation | c.268C>A | p.Arg90Ser | p.R90S | Q14165 | protein_coding | deleterious(0) | probably_damaging(0.998) | TCGA-G4-6626-01 | Colorectum | colon adenocarcinoma | Male | >=65 | I/II | Unknown | Unknown | SD | |
| MLEC | SNV | Missense_Mutation | rs373698097 | c.334G>A | p.Glu112Lys | p.E112K | Q14165 | protein_coding | deleterious(0.01) | possibly_damaging(0.54) | TCGA-A5-A0G2-01 | Endometrium | uterine corpus endometrioid carcinoma | Female | <65 | III/IV | Unknown | Unknown | SD |
| MLEC | SNV | Missense_Mutation | novel | c.248G>T | p.Gly83Val | p.G83V | Q14165 | protein_coding | deleterious(0) | probably_damaging(1) | TCGA-A5-A1OF-01 | Endometrium | uterine corpus endometrioid carcinoma | Female | <65 | I/II | Unknown | Unknown | SD |
| MLEC | SNV | Missense_Mutation | c.308N>A | p.Arg103Gln | p.R103Q | Q14165 | protein_coding | deleterious(0) | probably_damaging(1) | TCGA-AP-A051-01 | Endometrium | uterine corpus endometrioid carcinoma | Female | >=65 | I/II | Unknown | Unknown | SD |
| Page: 1 2 3 4 |
Top |
Related drugs of malignant transformation related genes |
| Identification of chemicals and drugs interact with genes involved in malignant transfromation |
| (DGIdb 4.0) |
| Entrez ID | Symbol | Category | Interaction Types | Drug Claim Name | Drug Name | PMIDs |
| Page: 1 |

Copyright 2023-Present -The University of Texas Health Science Center at Houston |