| Tissue | Expression Dynamics | Abbreviation |
| Cervix |  | CC: Cervix cancer |
| HSIL_HPV: HPV-infected high-grade squamous intraepithelial lesions |
| N_HPV: HPV-infected normal cervix |
| Colorectum (GSE201348) |  | FAP: Familial adenomatous polyposis |
| CRC: Colorectal cancer |
| Colorectum (HTA11) |  | AD: Adenomas |
| SER: Sessile serrated lesions |
| MSI-H: Microsatellite-high colorectal cancer |
| MSS: Microsatellite stable colorectal cancer |
| Esophagus |  | ESCC: Esophageal squamous cell carcinoma |
| HGIN: High-grade intraepithelial neoplasias |
| LGIN: Low-grade intraepithelial neoplasias |
| GC | 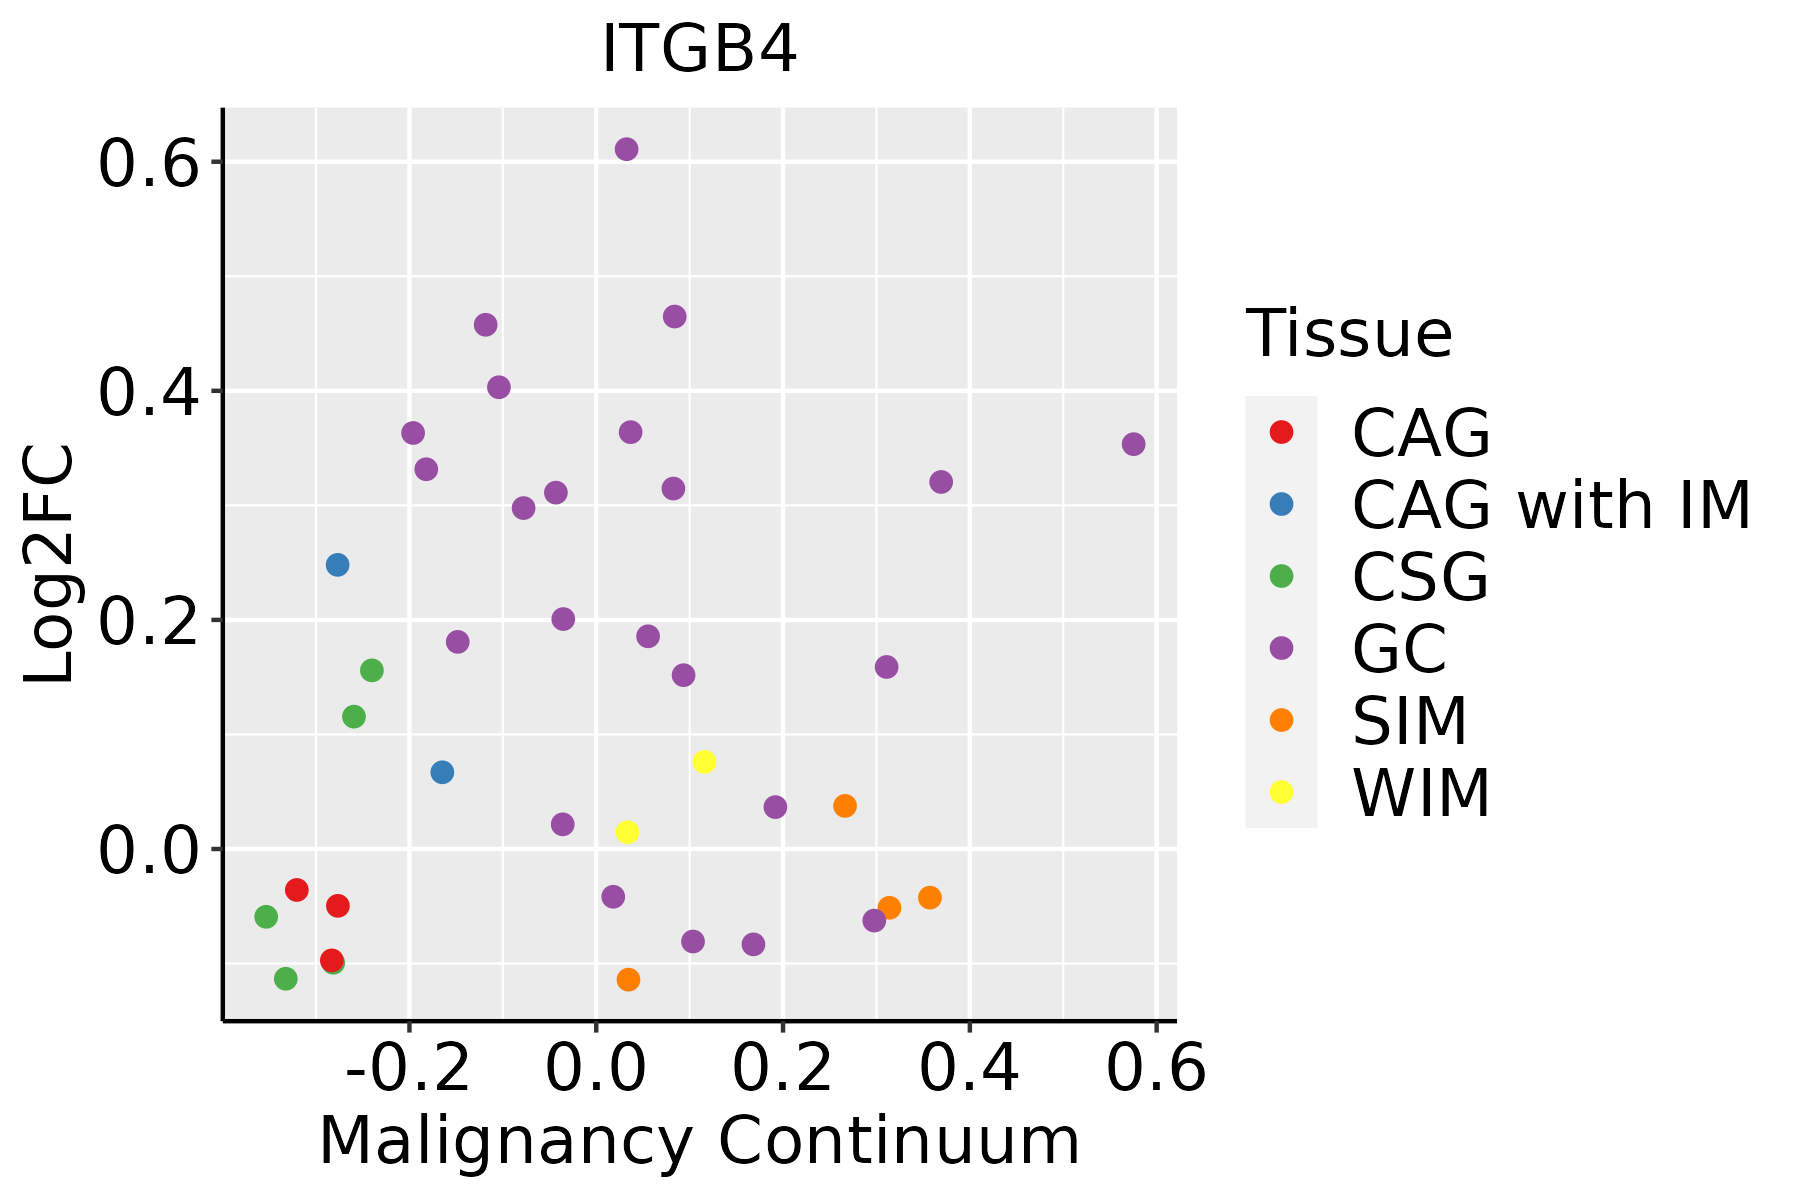 | CAG: Chronic atrophic gastritis |
| CAG with IM: Chronic atrophic gastritis with intestinal metaplasia |
| CSG: Chronic superficial gastritis |
| GC: Gastric cancer |
| SIM: Severe intestinal metaplasia |
| WIM: Wild intestinal metaplasia |
| Liver |  | HCC: Hepatocellular carcinoma |
| NAFLD: Non-alcoholic fatty liver disease |
| Lung |  | AAH: Atypical adenomatous hyperplasia |
| AIS: Adenocarcinoma in situ |
| IAC: Invasive lung adenocarcinoma |
| MIA: Minimally invasive adenocarcinoma |
| Oral Cavity | 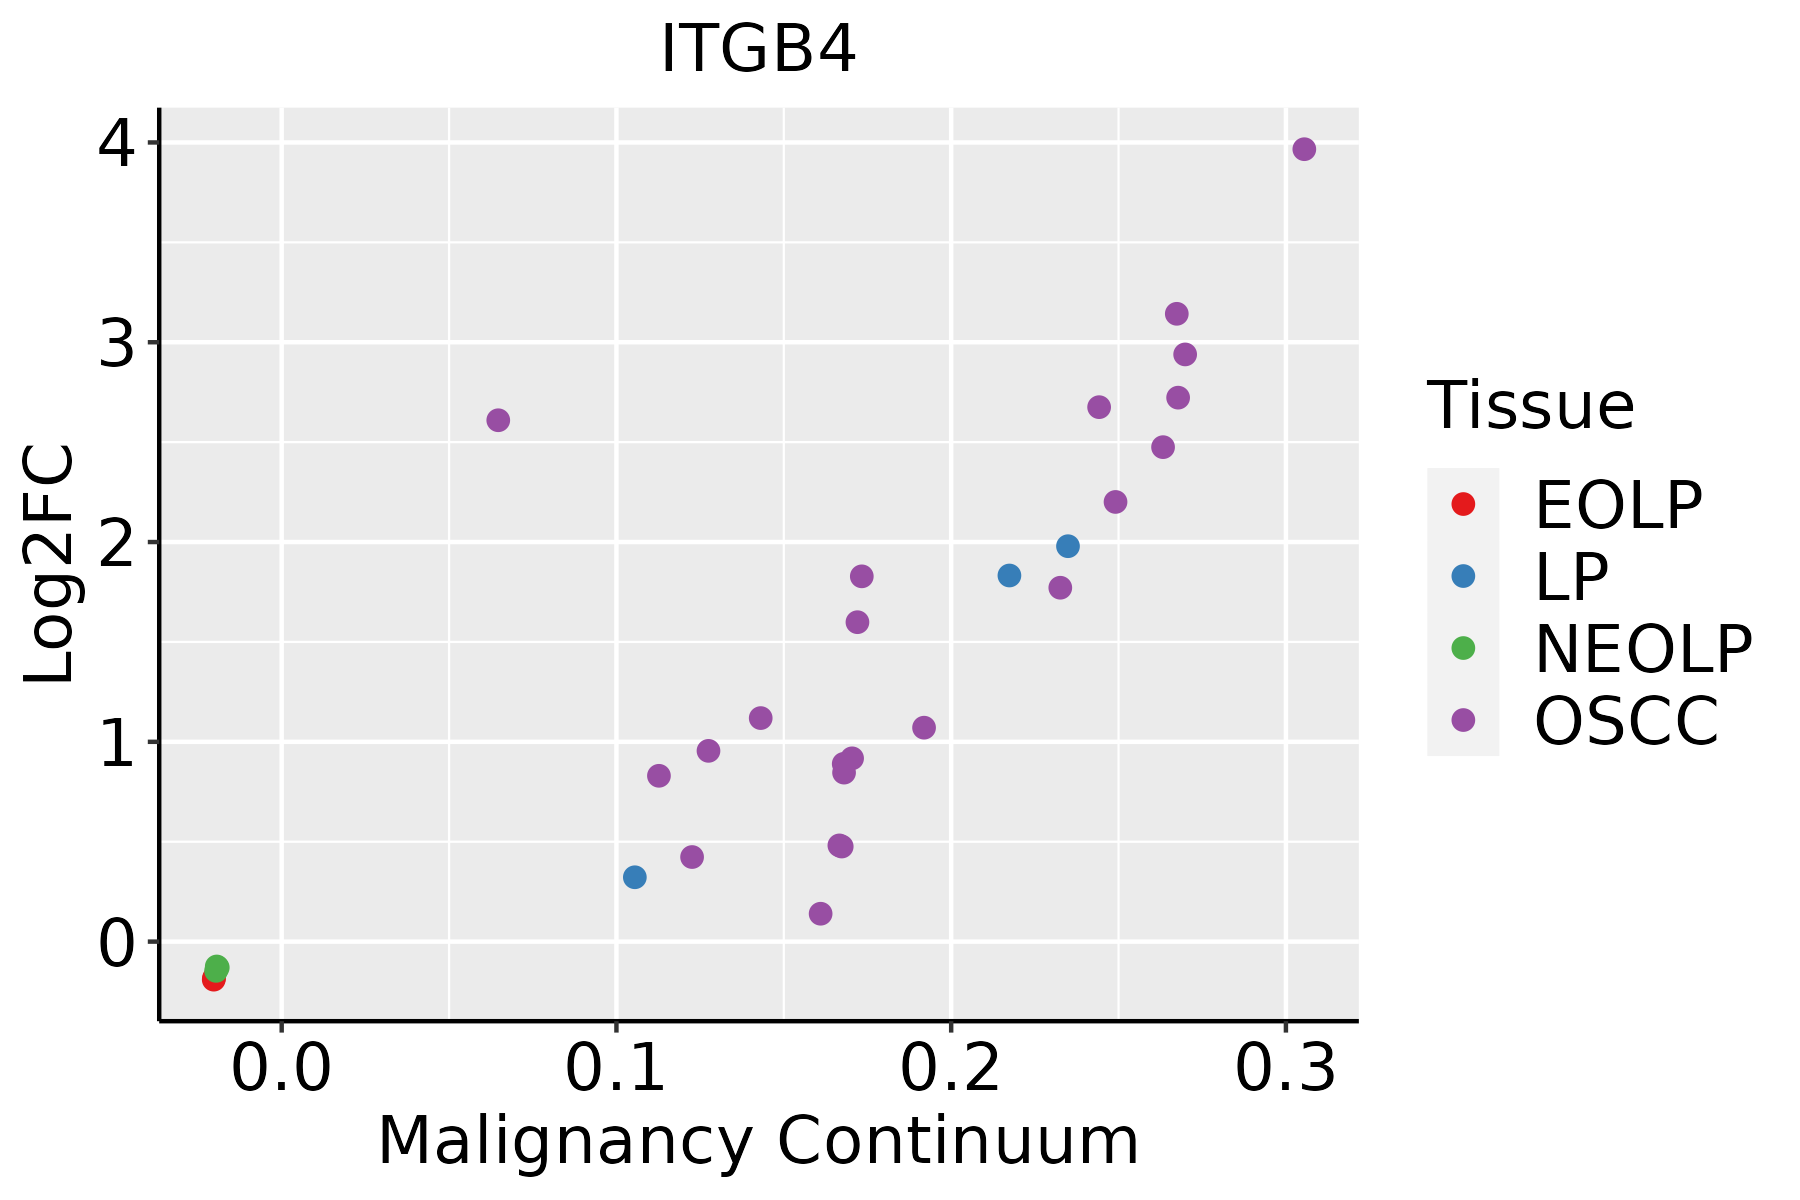 | EOLP: Erosive Oral lichen planus |
| LP: leukoplakia |
| NEOLP: Non-erosive oral lichen planus |
| OSCC: Oral squamous cell carcinoma |
| Prostate | 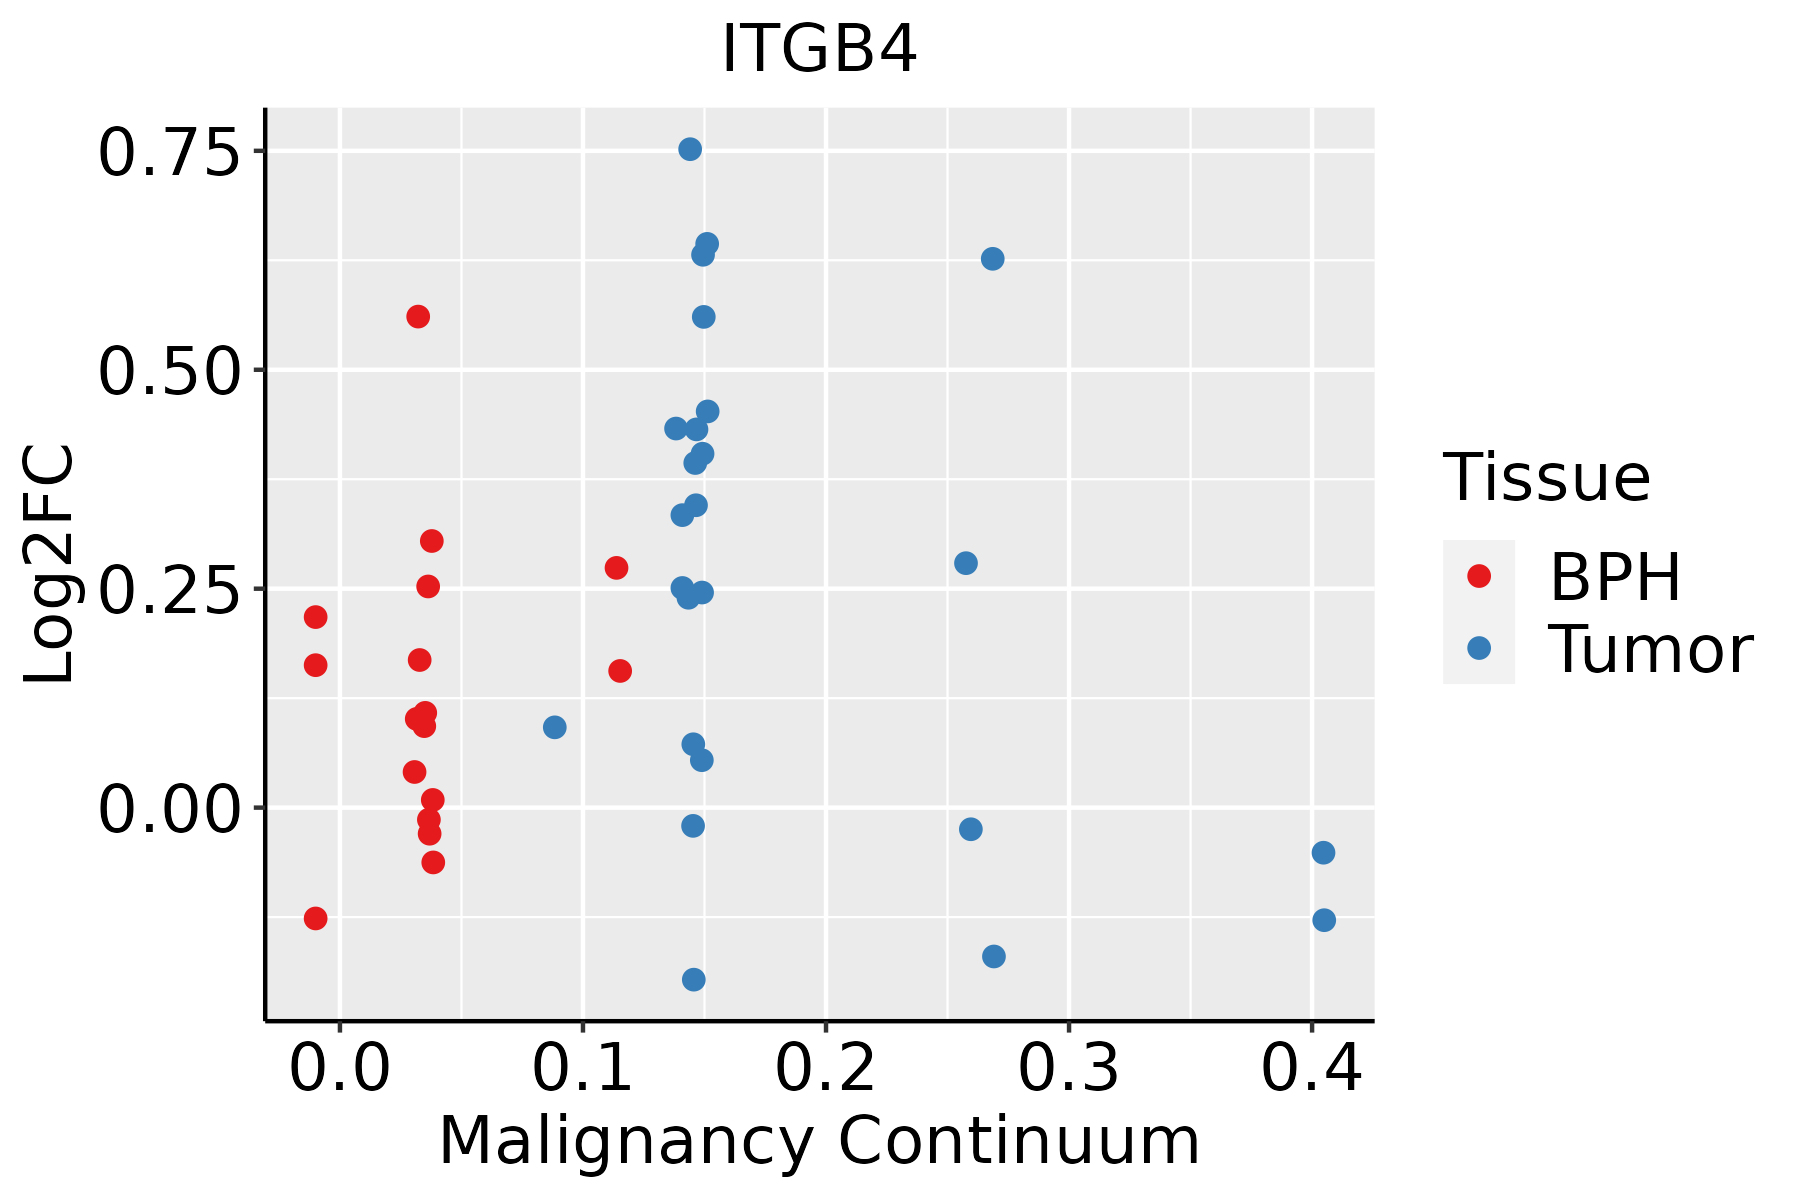 | BPH: Benign Prostatic Hyperplasia |
| Skin | 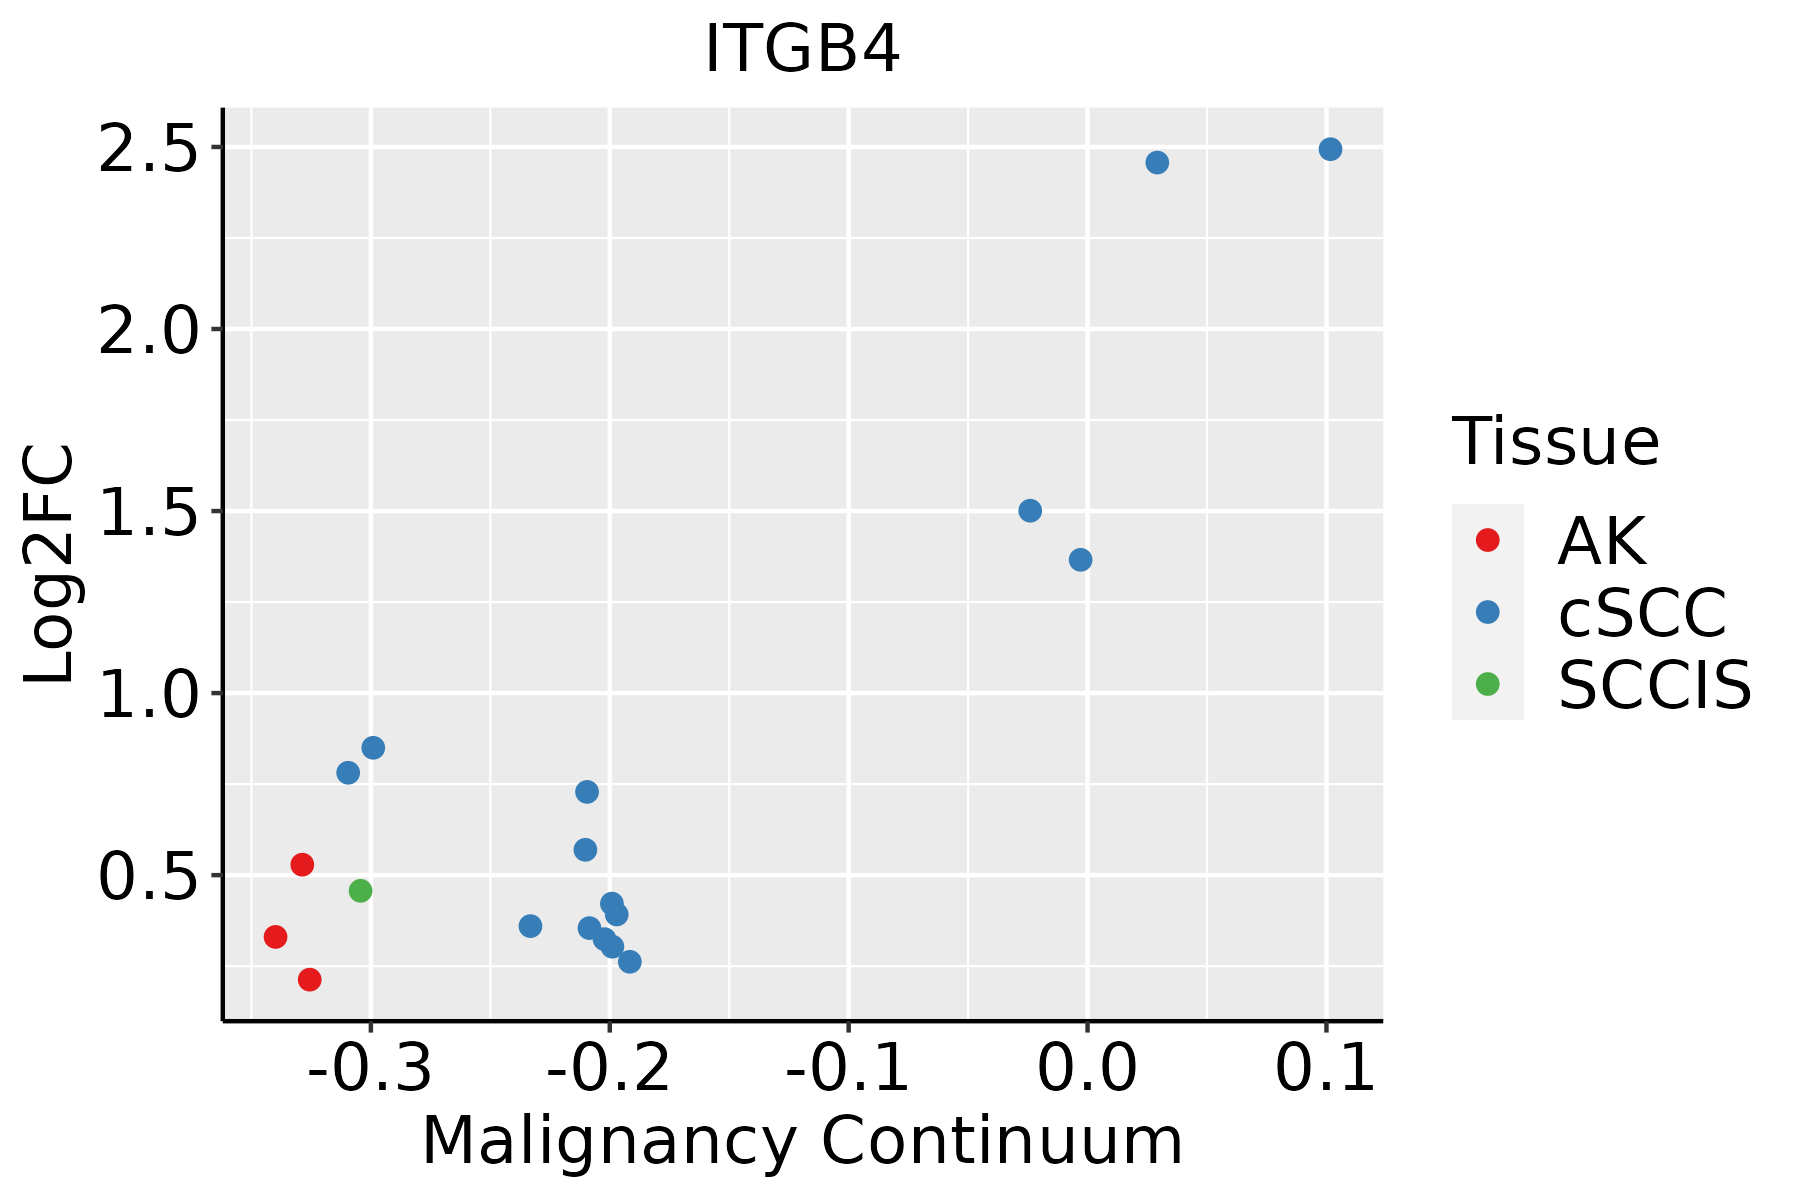 | AK: Actinic keratosis |
| cSCC: Cutaneous squamous cell carcinoma |
| SCCIS:squamous cell carcinoma in situ |
| GO ID | Tissue | Disease Stage | Description | Gene Ratio | Bg Ratio | pvalue | p.adjust | Count |
| GO:00315898 | Cervix | CC | cell-substrate adhesion | 96/2311 | 363/18723 | 1.48e-13 | 8.85e-11 | 96 |
| GO:00016679 | Cervix | CC | ameboidal-type cell migration | 110/2311 | 475/18723 | 2.66e-11 | 6.36e-09 | 110 |
| GO:00435884 | Cervix | CC | skin development | 71/2311 | 263/18723 | 8.04e-11 | 1.46e-08 | 71 |
| GO:01501159 | Cervix | CC | cell-substrate junction organization | 37/2311 | 101/18723 | 3.20e-10 | 4.46e-08 | 37 |
| GO:00070448 | Cervix | CC | cell-substrate junction assembly | 34/2311 | 95/18723 | 3.35e-09 | 3.45e-07 | 34 |
| GO:00071608 | Cervix | CC | cell-matrix adhesion | 60/2311 | 233/18723 | 1.58e-08 | 1.23e-06 | 60 |
| GO:00072295 | Cervix | CC | integrin-mediated signaling pathway | 34/2311 | 107/18723 | 1.01e-07 | 5.25e-06 | 34 |
| GO:00343298 | Cervix | CC | cell junction assembly | 88/2311 | 420/18723 | 3.42e-07 | 1.38e-05 | 88 |
| GO:00435893 | Cervix | CC | skin morphogenesis | 8/2311 | 11/18723 | 6.22e-06 | 1.51e-04 | 8 |
| GO:00073695 | Cervix | CC | gastrulation | 42/2311 | 185/18723 | 5.83e-05 | 8.46e-04 | 42 |
| GO:00075654 | Cervix | CC | female pregnancy | 43/2311 | 193/18723 | 7.62e-05 | 1.04e-03 | 43 |
| GO:00447064 | Cervix | CC | multi-multicellular organism process | 45/2311 | 220/18723 | 4.14e-04 | 4.21e-03 | 45 |
| GO:00336272 | Cervix | CC | cell adhesion mediated by integrin | 19/2311 | 72/18723 | 9.11e-04 | 7.81e-03 | 19 |
| GO:00075664 | Cervix | CC | embryo implantation | 15/2311 | 53/18723 | 1.43e-03 | 1.12e-02 | 15 |
| GO:0001704 | Cervix | CC | formation of primary germ layer | 27/2311 | 121/18723 | 1.49e-03 | 1.16e-02 | 27 |
| GO:00487365 | Cervix | CC | appendage development | 35/2311 | 172/18723 | 1.88e-03 | 1.39e-02 | 35 |
| GO:00601735 | Cervix | CC | limb development | 35/2311 | 172/18723 | 1.88e-03 | 1.39e-02 | 35 |
| GO:00614502 | Cervix | CC | trophoblast cell migration | 7/2311 | 17/18723 | 2.72e-03 | 1.85e-02 | 7 |
| GO:000722913 | Cervix | HSIL_HPV | integrin-mediated signaling pathway | 19/737 | 107/18723 | 3.37e-08 | 2.76e-06 | 19 |
| GO:000756512 | Cervix | HSIL_HPV | female pregnancy | 26/737 | 193/18723 | 4.32e-08 | 3.41e-06 | 26 |
| Pathway ID | Tissue | Disease Stage | Description | Gene Ratio | Bg Ratio | pvalue | p.adjust | qvalue | Count |
| hsa0451010 | Cervix | CC | Focal adhesion | 59/1267 | 203/8465 | 1.53e-07 | 1.84e-06 | 1.09e-06 | 59 |
| hsa0481016 | Cervix | CC | Regulation of actin cytoskeleton | 64/1267 | 229/8465 | 2.24e-07 | 2.59e-06 | 1.53e-06 | 64 |
| hsa051657 | Cervix | CC | Human papillomavirus infection | 74/1267 | 331/8465 | 1.70e-04 | 1.02e-03 | 6.03e-04 | 74 |
| hsa0451014 | Cervix | CC | Focal adhesion | 59/1267 | 203/8465 | 1.53e-07 | 1.84e-06 | 1.09e-06 | 59 |
| hsa0481017 | Cervix | CC | Regulation of actin cytoskeleton | 64/1267 | 229/8465 | 2.24e-07 | 2.59e-06 | 1.53e-06 | 64 |
| hsa0516512 | Cervix | CC | Human papillomavirus infection | 74/1267 | 331/8465 | 1.70e-04 | 1.02e-03 | 6.03e-04 | 74 |
| hsa045124 | Cervix | HSIL_HPV | ECM-receptor interaction | 12/459 | 89/8465 | 2.95e-03 | 1.88e-02 | 1.52e-02 | 12 |
| hsa0451023 | Cervix | HSIL_HPV | Focal adhesion | 21/459 | 203/8465 | 3.24e-03 | 2.02e-02 | 1.63e-02 | 21 |
| hsa054127 | Cervix | HSIL_HPV | Arrhythmogenic right ventricular cardiomyopathy | 10/459 | 77/8465 | 8.34e-03 | 4.70e-02 | 3.80e-02 | 10 |
| hsa0451211 | Cervix | HSIL_HPV | ECM-receptor interaction | 12/459 | 89/8465 | 2.95e-03 | 1.88e-02 | 1.52e-02 | 12 |
| hsa0451033 | Cervix | HSIL_HPV | Focal adhesion | 21/459 | 203/8465 | 3.24e-03 | 2.02e-02 | 1.63e-02 | 21 |
| hsa0541212 | Cervix | HSIL_HPV | Arrhythmogenic right ventricular cardiomyopathy | 10/459 | 77/8465 | 8.34e-03 | 4.70e-02 | 3.80e-02 | 10 |
| hsa04810 | Colorectum | AD | Regulation of actin cytoskeleton | 75/2092 | 229/8465 | 3.36e-03 | 1.76e-02 | 1.12e-02 | 75 |
| hsa04510 | Colorectum | AD | Focal adhesion | 67/2092 | 203/8465 | 4.40e-03 | 2.17e-02 | 1.38e-02 | 67 |
| hsa048101 | Colorectum | AD | Regulation of actin cytoskeleton | 75/2092 | 229/8465 | 3.36e-03 | 1.76e-02 | 1.12e-02 | 75 |
| hsa045101 | Colorectum | AD | Focal adhesion | 67/2092 | 203/8465 | 4.40e-03 | 2.17e-02 | 1.38e-02 | 67 |
| hsa048102 | Colorectum | SER | Regulation of actin cytoskeleton | 60/1580 | 229/8465 | 2.74e-03 | 2.02e-02 | 1.47e-02 | 60 |
| hsa048103 | Colorectum | SER | Regulation of actin cytoskeleton | 60/1580 | 229/8465 | 2.74e-03 | 2.02e-02 | 1.47e-02 | 60 |
| hsa048104 | Colorectum | MSS | Regulation of actin cytoskeleton | 68/1875 | 229/8465 | 4.27e-03 | 1.86e-02 | 1.14e-02 | 68 |
| hsa048105 | Colorectum | MSS | Regulation of actin cytoskeleton | 68/1875 | 229/8465 | 4.27e-03 | 1.86e-02 | 1.14e-02 | 68 |
| Hugo Symbol | Variant Class | Variant Classification | dbSNP RS | HGVSc | HGVSp | HGVSp Short | SWISSPROT | BIOTYPE | SIFT | PolyPhen | Tumor Sample Barcode | Tissue | Histology | Sex | Age | Stage | Therapy Types | Drugs | Outcome |
| ITGB4 | SNV | Missense_Mutation | rs756270166 | c.5071C>T | p.Arg1691Trp | p.R1691W | P16144 | protein_coding | tolerated(0.17) | possibly_damaging(0.697) | TCGA-A2-A3XY-01 | Breast | breast invasive carcinoma | Female | <65 | I/II | Chemotherapy | adriamycin | PD |
| ITGB4 | SNV | Missense_Mutation | novel | c.1447N>C | p.Glu483Gln | p.E483Q | P16144 | protein_coding | tolerated(0.15) | possibly_damaging(0.706) | TCGA-A8-A09M-01 | Breast | breast invasive carcinoma | Female | >=65 | III/IV | Chemotherapy | paclitaxel | CR |
| ITGB4 | SNV | Missense_Mutation | | c.2795T>A | p.Met932Lys | p.M932K | P16144 | protein_coding | deleterious(0) | possibly_damaging(0.48) | TCGA-AN-A04D-01 | Breast | breast invasive carcinoma | Female | <65 | I/II | Unknown | Unknown | SD |
| ITGB4 | SNV | Missense_Mutation | | c.2795N>G | p.Met932Arg | p.M932R | P16144 | protein_coding | deleterious(0) | possibly_damaging(0.68) | TCGA-AN-A0FN-01 | Breast | breast invasive carcinoma | Female | <65 | I/II | Unknown | Unknown | SD |
| ITGB4 | SNV | Missense_Mutation | novel | c.2522N>A | p.Ala841Asp | p.A841D | P16144 | protein_coding | tolerated(0.66) | benign(0) | TCGA-AN-A0XN-01 | Breast | breast invasive carcinoma | Female | >=65 | III/IV | Unknown | Unknown | SD |
| ITGB4 | SNV | Missense_Mutation | | c.2590N>G | p.Leu864Val | p.L864V | P16144 | protein_coding | tolerated(0.66) | benign(0.003) | TCGA-AO-A0JD-01 | Breast | breast invasive carcinoma | Female | <65 | III/IV | Chemotherapy | cyclophosphamide | SD |
| ITGB4 | SNV | Missense_Mutation | rs201487753 | c.3230G>A | p.Arg1077His | p.R1077H | P16144 | protein_coding | deleterious(0.01) | probably_damaging(0.952) | TCGA-BH-A0AU-01 | Breast | breast invasive carcinoma | Female | <65 | I/II | Unknown | Unknown | SD |
| ITGB4 | SNV | Missense_Mutation | novel | c.1148N>T | p.Thr383Ile | p.T383I | P16144 | protein_coding | tolerated(0.14) | possibly_damaging(0.797) | TCGA-BH-A0HF-01 | Breast | breast invasive carcinoma | Female | >=65 | I/II | Hormone Therapy | arimidex | SD |
| ITGB4 | SNV | Missense_Mutation | novel | c.168N>A | p.Phe56Leu | p.F56L | P16144 | protein_coding | deleterious(0.01) | probably_damaging(0.978) | TCGA-D8-A1JA-01 | Breast | breast invasive carcinoma | Female | <65 | III/IV | Chemotherapy | adriamycin | PD |
| ITGB4 | SNV | Missense_Mutation | | c.4019G>A | p.Gly1340Glu | p.G1340E | P16144 | protein_coding | deleterious_low_confidence(0) | probably_damaging(1) | TCGA-E2-A1AZ-01 | Breast | breast invasive carcinoma | Female | <65 | I/II | Chemotherapy | adriamycin | SD |


