
|
|||||
|
 | |
| |
| |
| |
| |
| |
|
Gene: EPC1 |
Gene summary for EPC1 |
| Gene information | Species | Human | Gene symbol | EPC1 | Gene ID | 80314 |
| Gene name | enhancer of polycomb homolog 1 | |
| Gene Alias | Epl1 | |
| Cytomap | 10p11.22 | |
| Gene Type | protein-coding | GO ID | GO:0000122 | UniProtAcc | Q9H2F5 |
Top |
Malignant transformation analysis |
| Identification of the aberrant gene expression in precancerous and cancerous lesions by comparing the gene expression of stem-like cells in diseased tissues with normal stem cells |
| Entrez ID | Symbol | Replicates | Species | Organ | Tissue | Adj P-value | Log2FC | Malignancy |
| 80314 | EPC1 | ATC09 | Human | Thyroid | ATC | 1.13e-07 | 3.94e-02 | 0.2871 |
| 80314 | EPC1 | ATC11 | Human | Thyroid | ATC | 5.33e-10 | 4.19e-01 | 0.3386 |
| 80314 | EPC1 | ATC12 | Human | Thyroid | ATC | 6.26e-17 | 3.28e-01 | 0.34 |
| 80314 | EPC1 | ATC13 | Human | Thyroid | ATC | 3.91e-51 | 9.25e-01 | 0.34 |
| 80314 | EPC1 | ATC1 | Human | Thyroid | ATC | 1.42e-07 | 6.93e-02 | 0.2878 |
| 80314 | EPC1 | ATC2 | Human | Thyroid | ATC | 4.00e-07 | 1.01e+00 | 0.34 |
| 80314 | EPC1 | ATC3 | Human | Thyroid | ATC | 2.08e-17 | 5.47e-01 | 0.338 |
| 80314 | EPC1 | ATC4 | Human | Thyroid | ATC | 4.83e-21 | 4.63e-01 | 0.34 |
| 80314 | EPC1 | ATC5 | Human | Thyroid | ATC | 1.42e-46 | 1.01e+00 | 0.34 |
| Page: 1 2 3 4 5 6 7 8 9 10 |
| Tissue | Expression Dynamics | Abbreviation |
| Colorectum (GSE201348) | 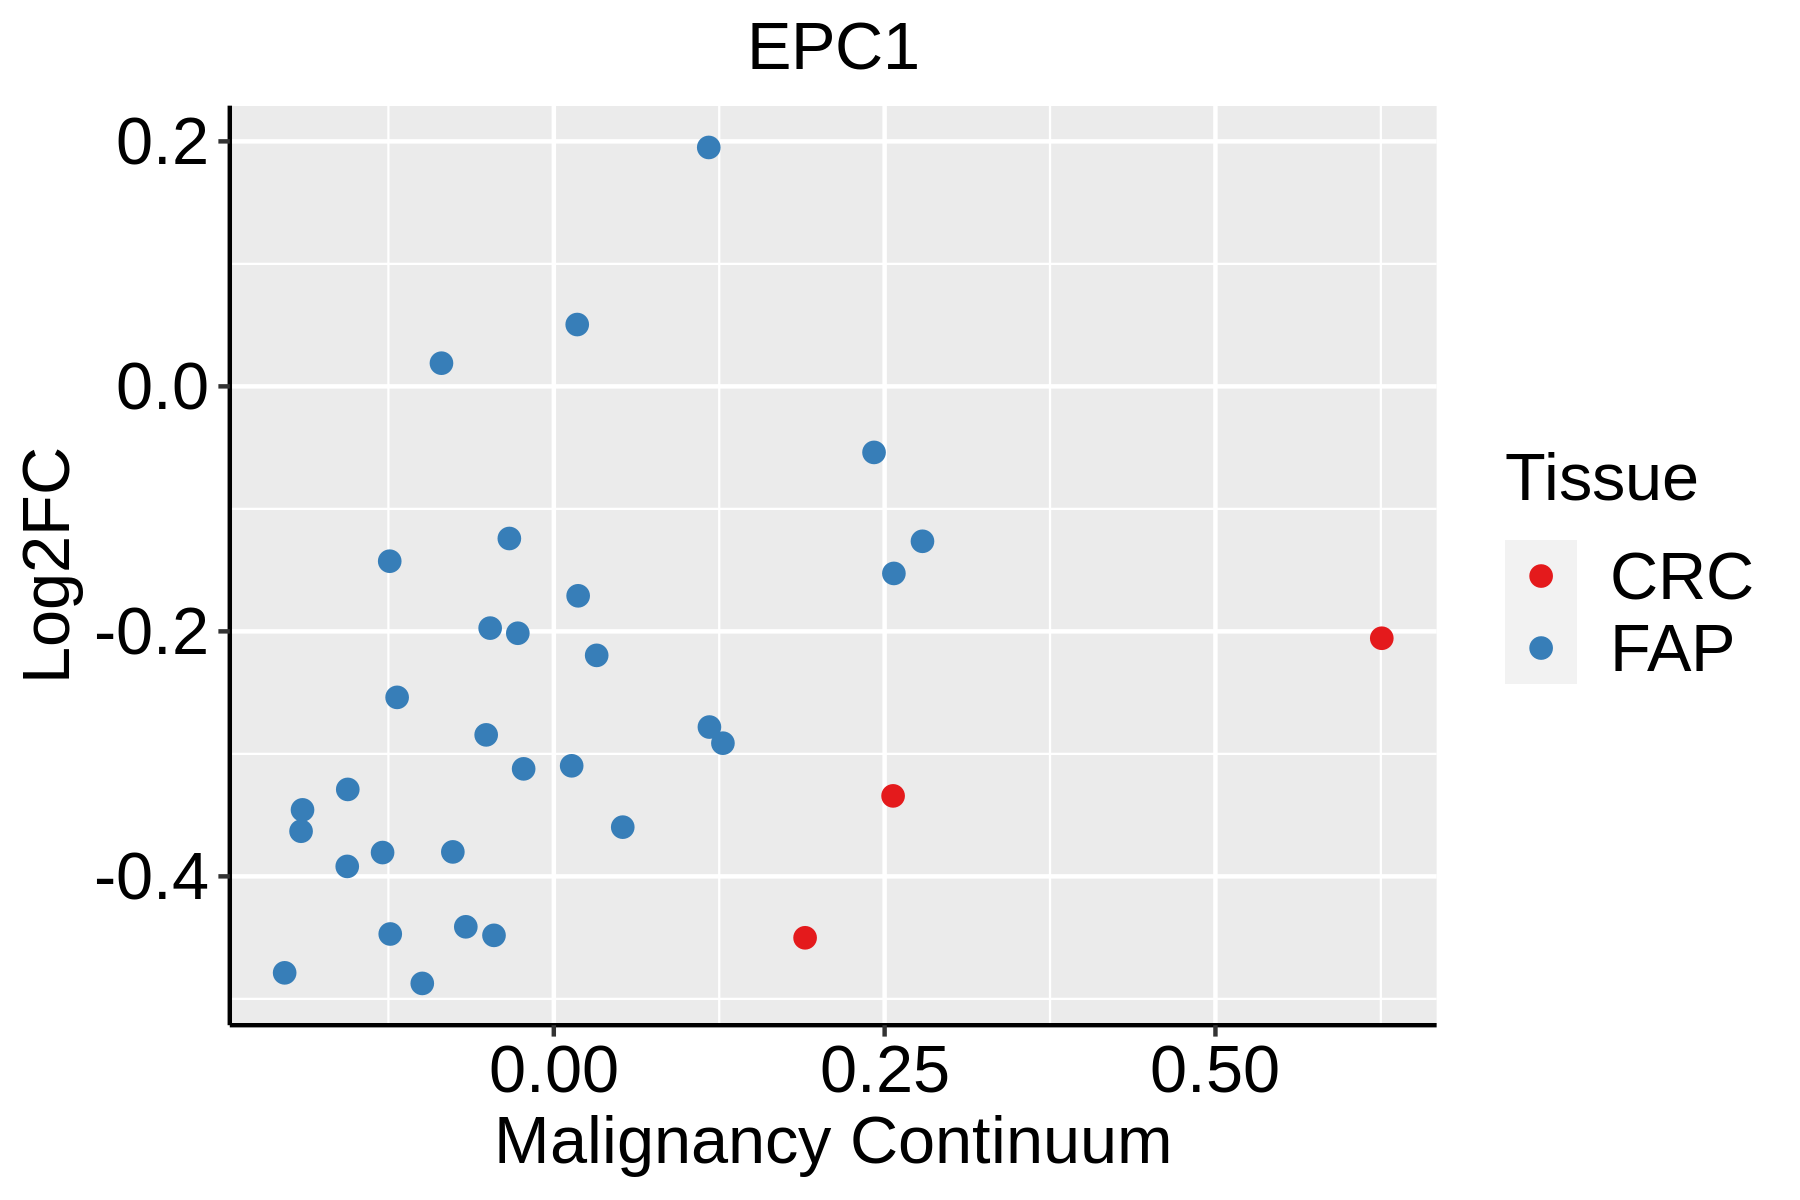 | FAP: Familial adenomatous polyposis |
| CRC: Colorectal cancer | ||
| Colorectum (HTA11) |  | AD: Adenomas |
| SER: Sessile serrated lesions | ||
| MSI-H: Microsatellite-high colorectal cancer | ||
| MSS: Microsatellite stable colorectal cancer | ||
| Esophagus | 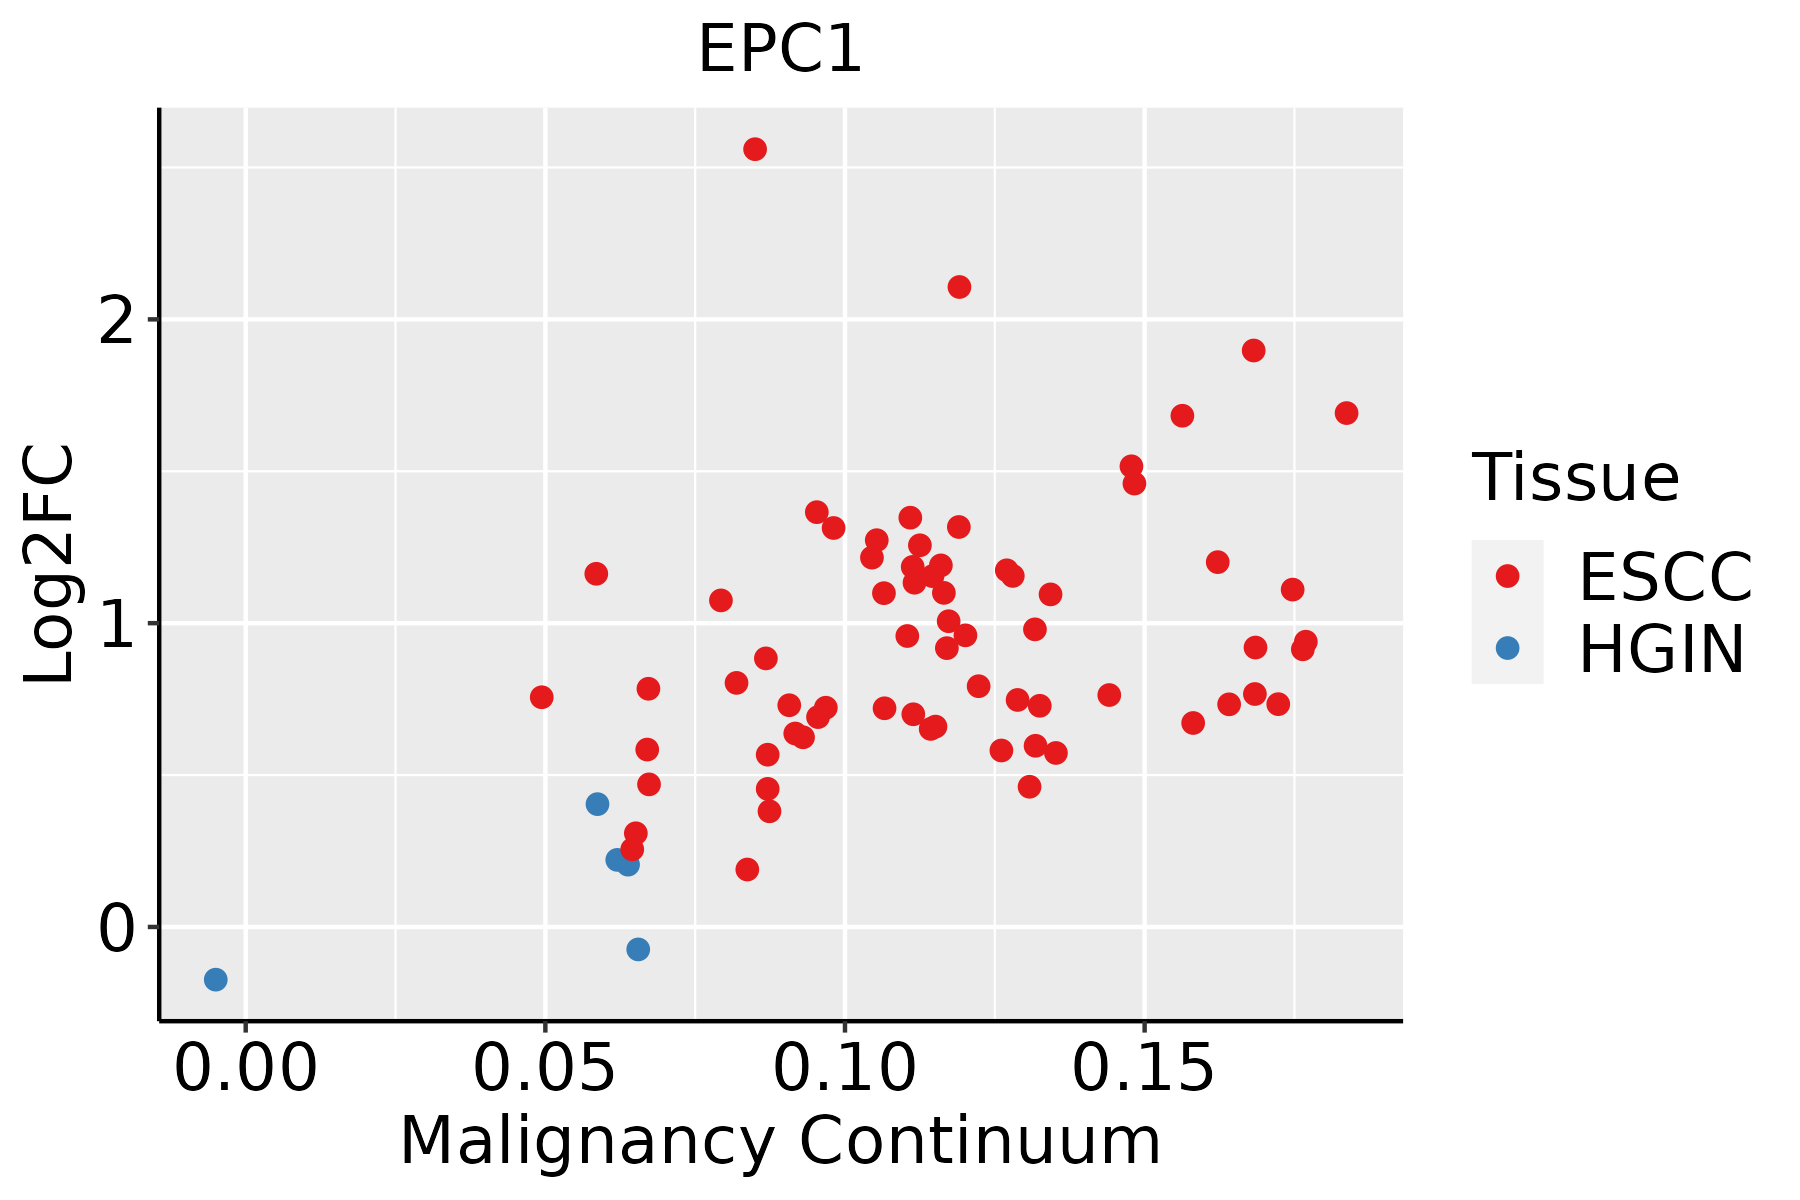 | ESCC: Esophageal squamous cell carcinoma |
| HGIN: High-grade intraepithelial neoplasias | ||
| LGIN: Low-grade intraepithelial neoplasias | ||
| Liver | 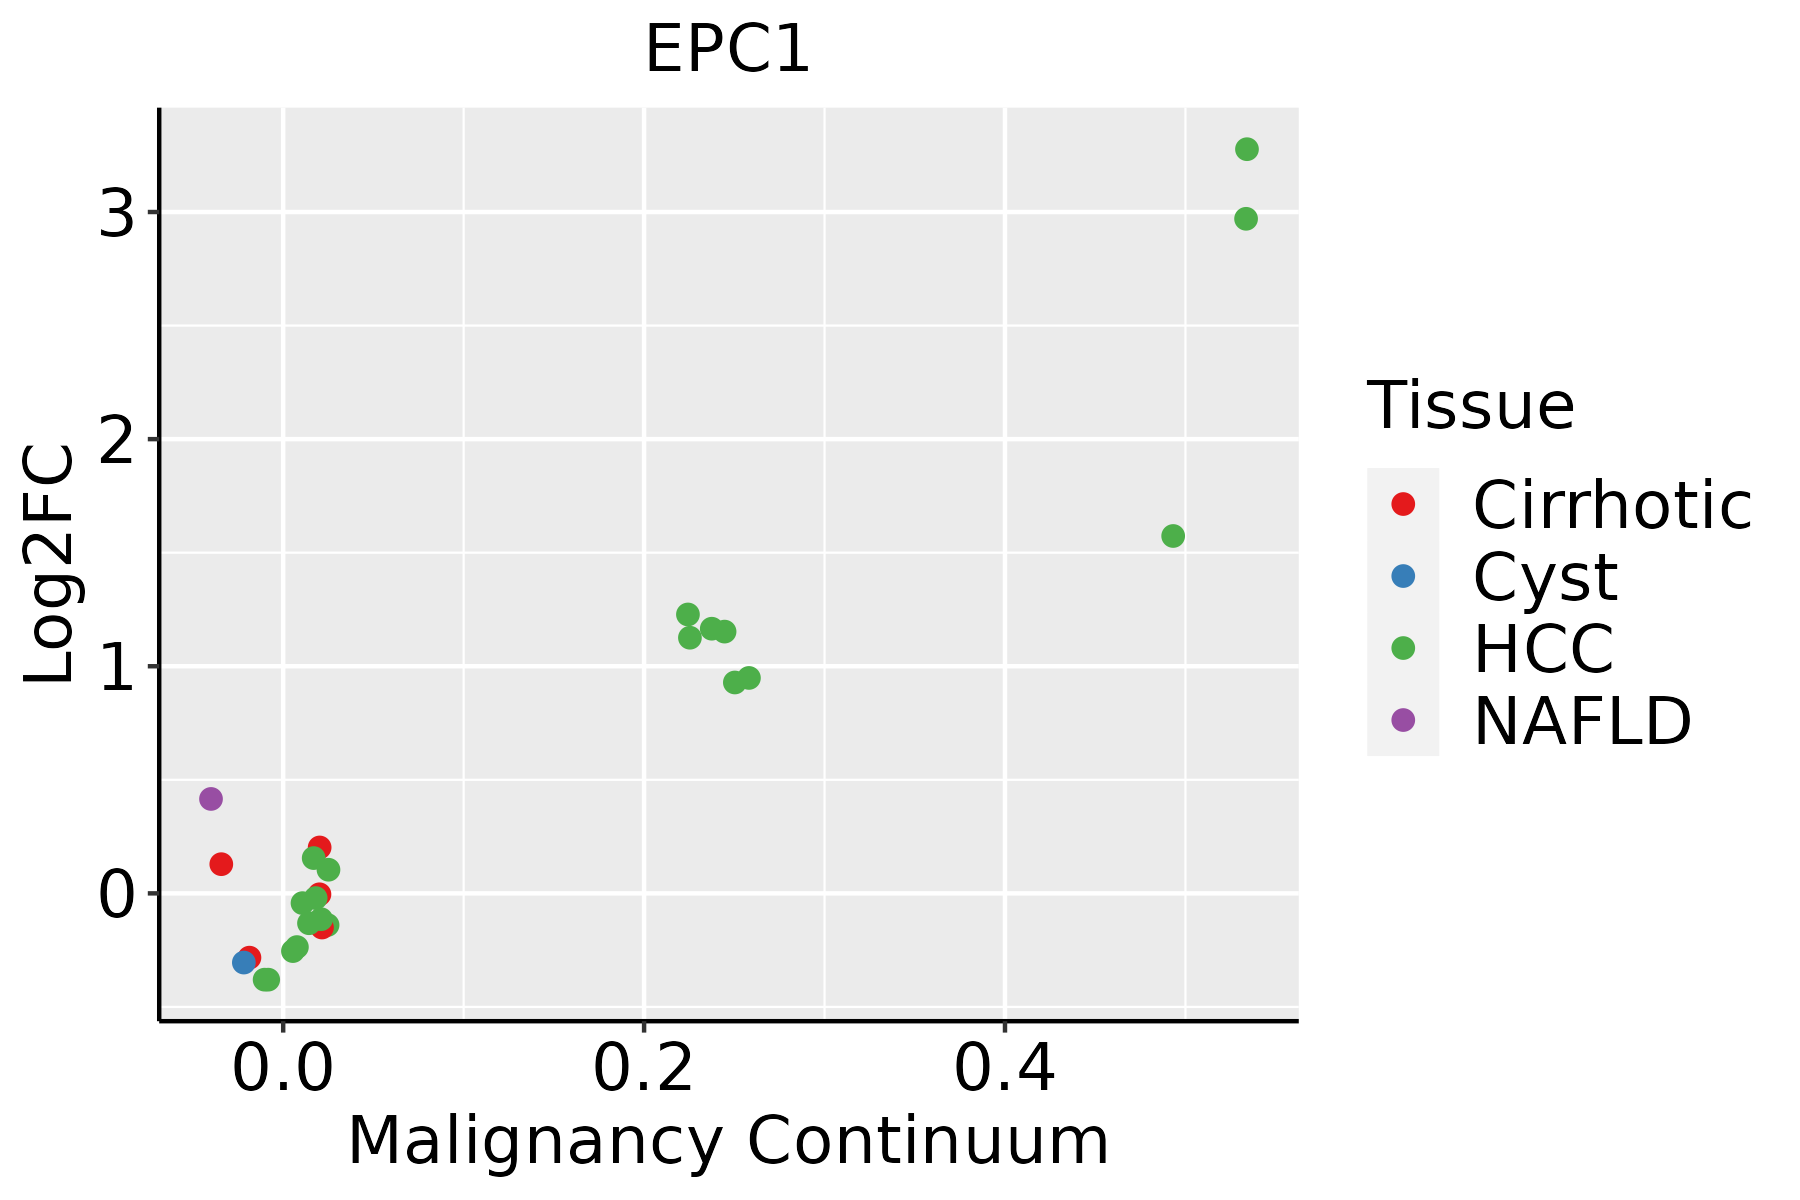 | HCC: Hepatocellular carcinoma |
| NAFLD: Non-alcoholic fatty liver disease | ||
| Lung | 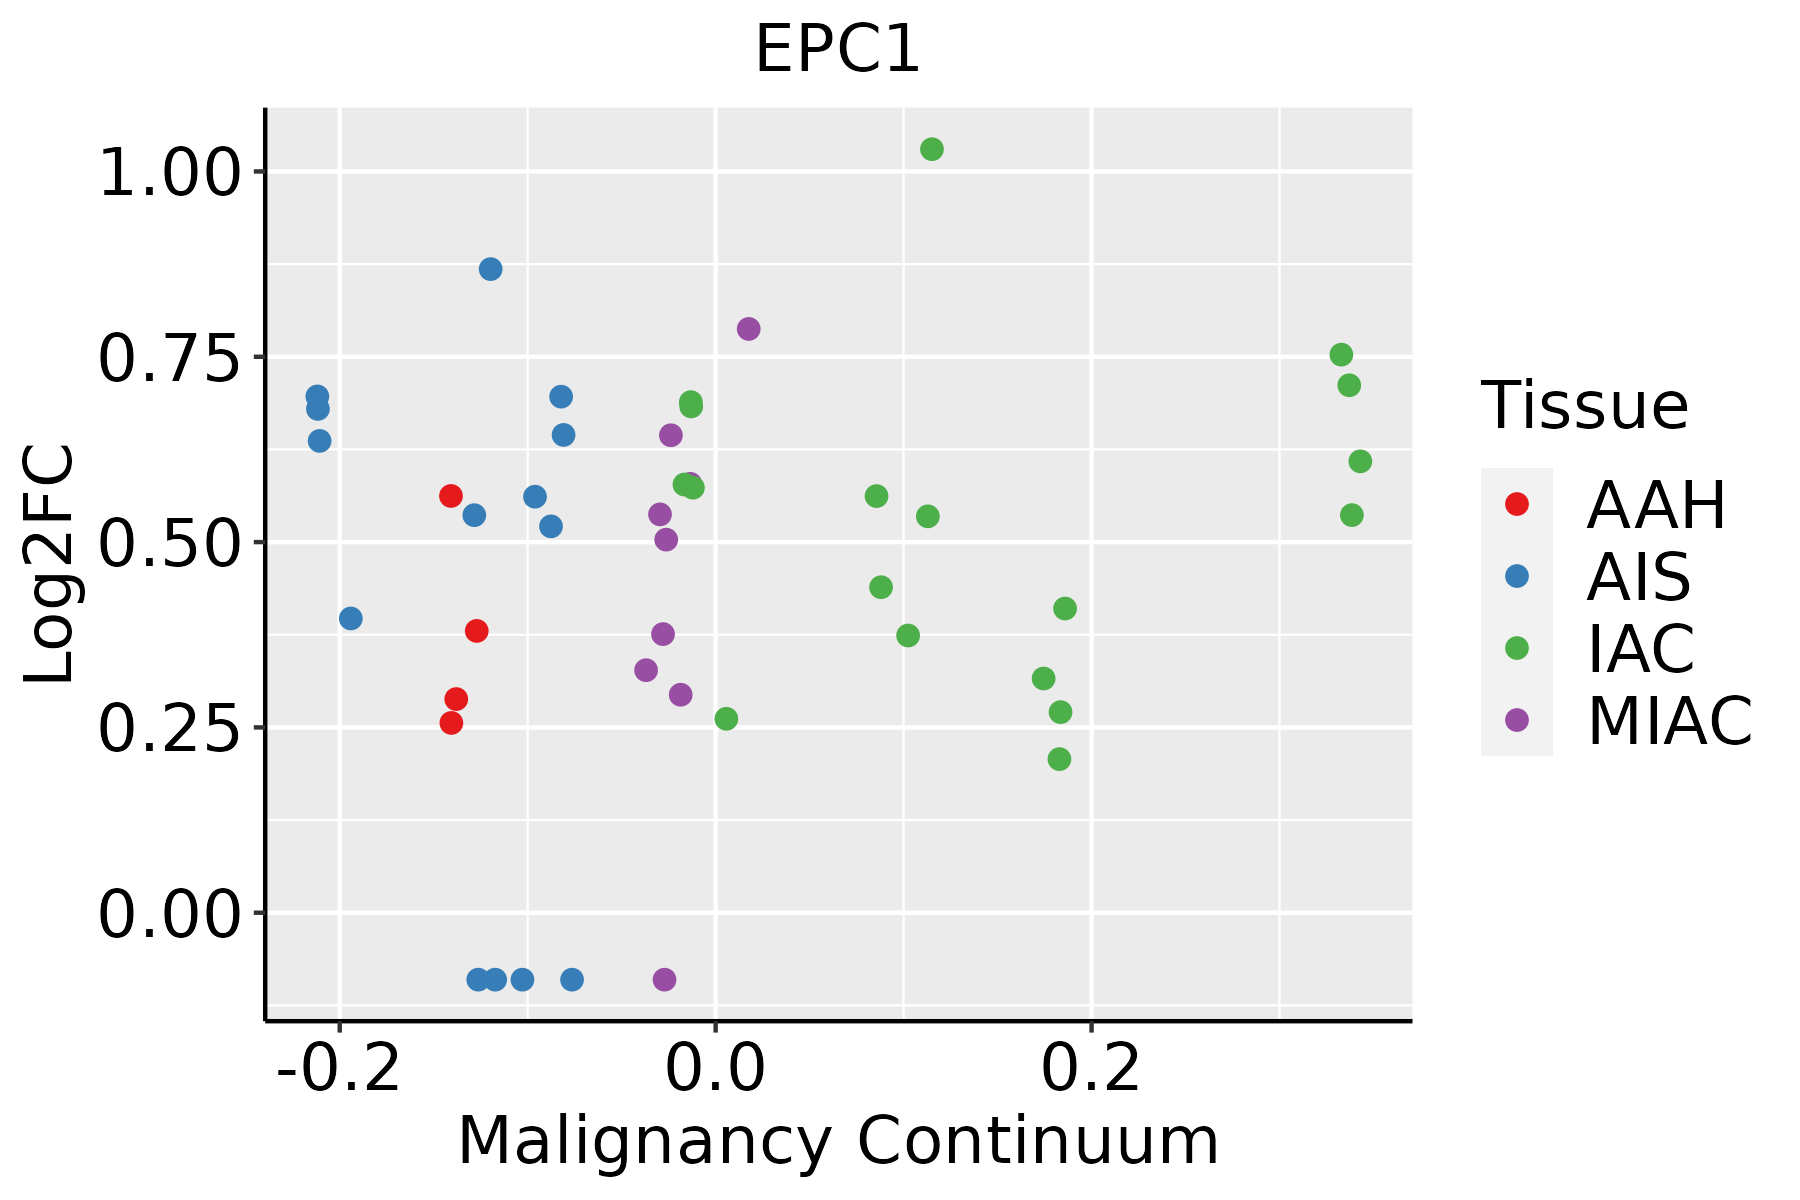 | AAH: Atypical adenomatous hyperplasia |
| AIS: Adenocarcinoma in situ | ||
| IAC: Invasive lung adenocarcinoma | ||
| MIA: Minimally invasive adenocarcinoma | ||
| Oral Cavity |  | EOLP: Erosive Oral lichen planus |
| LP: leukoplakia | ||
| NEOLP: Non-erosive oral lichen planus | ||
| OSCC: Oral squamous cell carcinoma | ||
| Prostate | 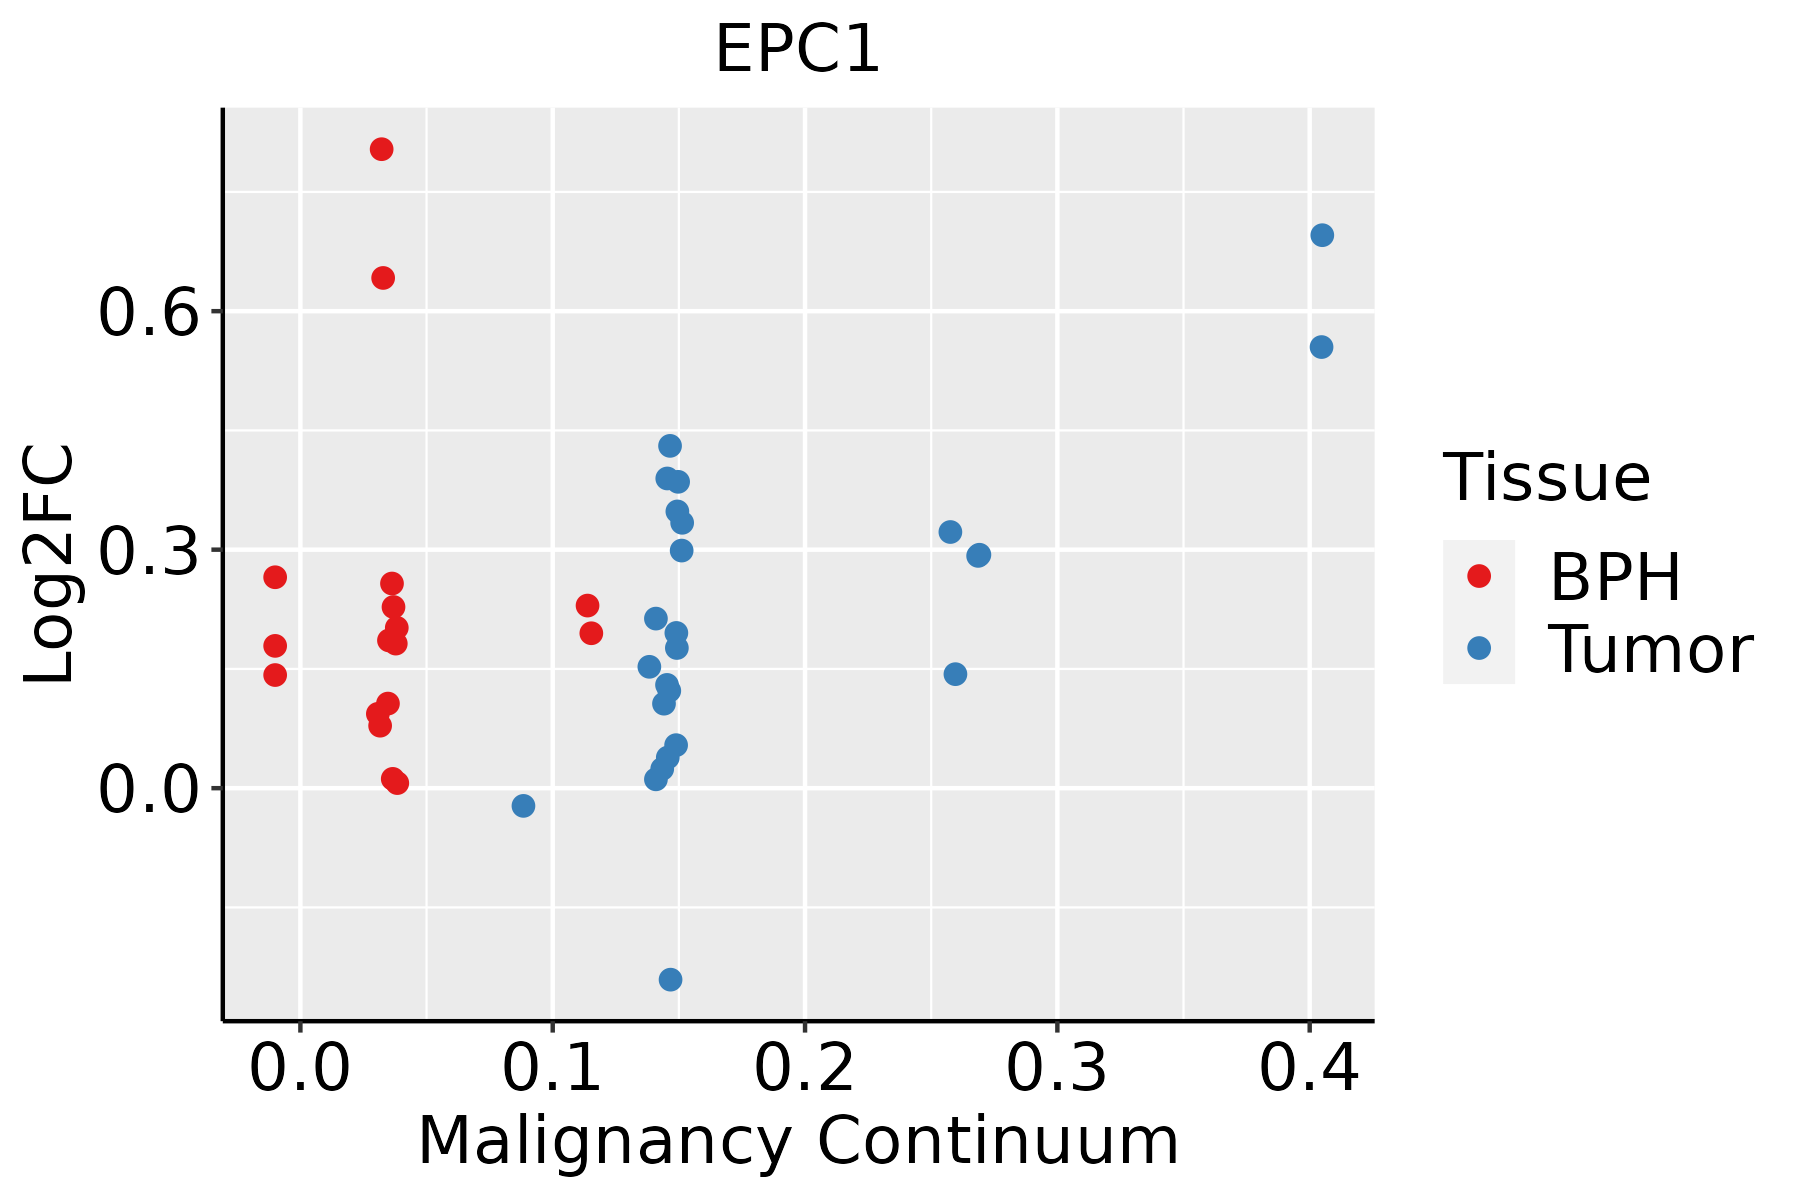 | BPH: Benign Prostatic Hyperplasia |
| Skin | 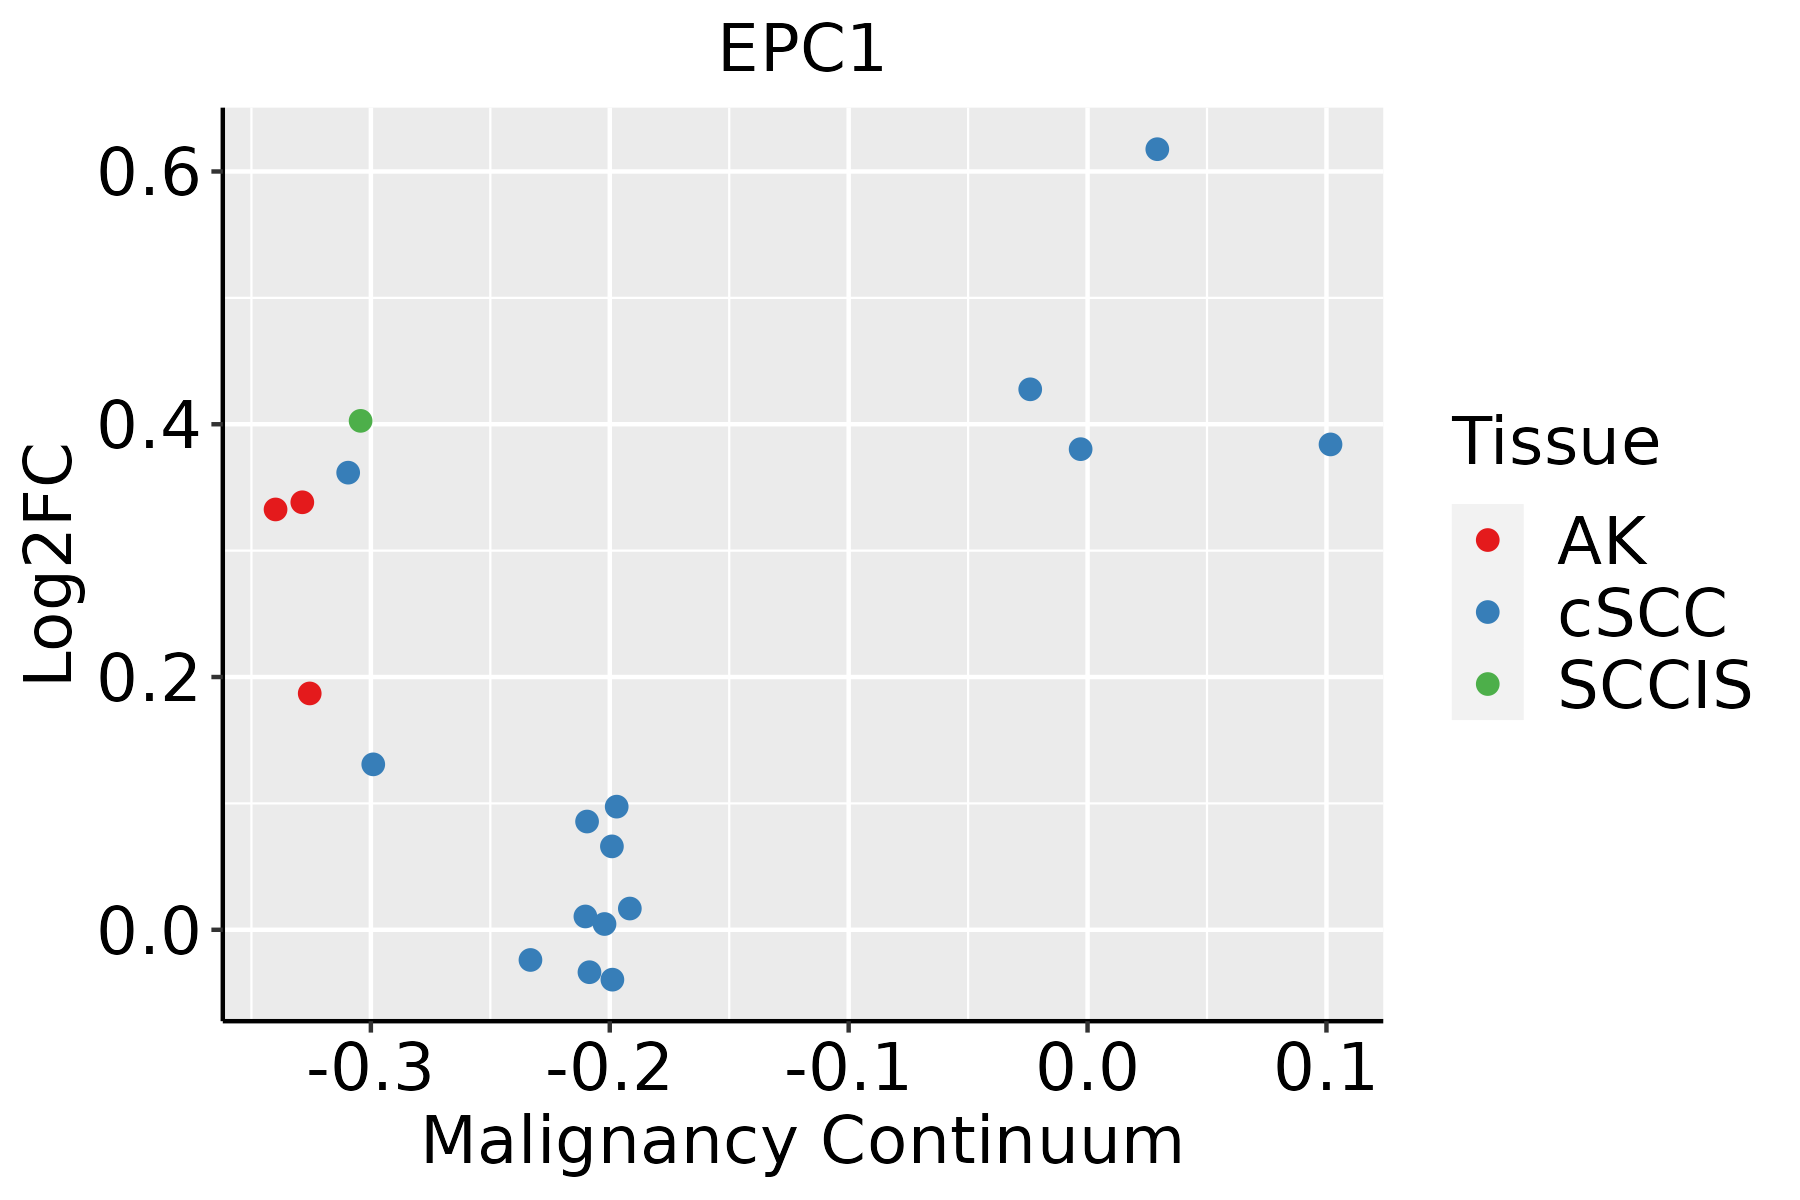 | AK: Actinic keratosis |
| cSCC: Cutaneous squamous cell carcinoma | ||
| SCCIS:squamous cell carcinoma in situ | ||
| Thyroid |  | ATC: Anaplastic thyroid cancer |
| HT: Hashimoto's thyroiditis | ||
| PTC: Papillary thyroid cancer |
| ∗log2FC in expression of this searched gene in stem-like cells from each diseased tissue sample relative to stem-like cells in normal samples in each tissue plotted against the malignancy continuum. Samples are colored based on if they are from different disease stage. |
Top |
Malignant transformation related pathway analysis |
| Find out the enriched GO biological processes and KEGG pathways involved in transition from healthy to precancer to cancer |
| Tissue | Disease Stage | Enriched GO biological Processes |
| Colorectum | AD |  |
| Colorectum | SER |  |
| Colorectum | MSS |  |
| Colorectum | MSI-H |  |
| Colorectum | FAP |  |
| ∗Top 15 enriched GO BP terms are showed in the bar plot of each disease state in each tissue. Each row represents a significant GO biological process which is colored according to the -log10(p.adjust). |
| Page: 1 2 3 4 5 6 7 8 9 |
| GO ID | Tissue | Disease Stage | Description | Gene Ratio | Bg Ratio | pvalue | p.adjust | Count |
| GO:0016570 | Colorectum | MSS | histone modification | 113/3467 | 463/18723 | 8.37e-04 | 8.68e-03 | 113 |
| GO:00165701 | Colorectum | FAP | histone modification | 94/2622 | 463/18723 | 1.06e-04 | 1.76e-03 | 94 |
| GO:00165702 | Colorectum | CRC | histone modification | 75/2078 | 463/18723 | 4.95e-04 | 7.06e-03 | 75 |
| GO:00182057 | Esophagus | HGIN | peptidyl-lysine modification | 88/2587 | 376/18723 | 2.99e-07 | 1.39e-05 | 88 |
| GO:00165708 | Esophagus | HGIN | histone modification | 92/2587 | 463/18723 | 1.70e-04 | 3.30e-03 | 92 |
| GO:00064735 | Esophagus | HGIN | protein acetylation | 45/2587 | 201/18723 | 6.17e-04 | 8.58e-03 | 45 |
| GO:00183945 | Esophagus | HGIN | peptidyl-lysine acetylation | 39/2587 | 169/18723 | 7.46e-04 | 9.90e-03 | 39 |
| GO:00435435 | Esophagus | HGIN | protein acylation | 51/2587 | 243/18723 | 1.33e-03 | 1.57e-02 | 51 |
| GO:00439675 | Esophagus | HGIN | histone H4 acetylation | 19/2587 | 67/18723 | 1.39e-03 | 1.63e-02 | 19 |
| GO:00064755 | Esophagus | HGIN | internal protein amino acid acetylation | 36/2587 | 160/18723 | 1.87e-03 | 2.01e-02 | 36 |
| GO:00183935 | Esophagus | HGIN | internal peptidyl-lysine acetylation | 35/2587 | 158/18723 | 2.82e-03 | 2.75e-02 | 35 |
| GO:001657015 | Esophagus | ESCC | histone modification | 323/8552 | 463/18723 | 2.61e-26 | 7.88e-24 | 323 |
| GO:001820514 | Esophagus | ESCC | peptidyl-lysine modification | 259/8552 | 376/18723 | 3.90e-20 | 5.26e-18 | 259 |
| GO:001839413 | Esophagus | ESCC | peptidyl-lysine acetylation | 123/8552 | 169/18723 | 6.58e-13 | 2.94e-11 | 123 |
| GO:004354313 | Esophagus | ESCC | protein acylation | 165/8552 | 243/18723 | 1.69e-12 | 7.14e-11 | 165 |
| GO:000647313 | Esophagus | ESCC | protein acetylation | 140/8552 | 201/18723 | 4.37e-12 | 1.69e-10 | 140 |
| GO:001839313 | Esophagus | ESCC | internal peptidyl-lysine acetylation | 114/8552 | 158/18723 | 1.16e-11 | 4.24e-10 | 114 |
| GO:000647513 | Esophagus | ESCC | internal protein amino acid acetylation | 115/8552 | 160/18723 | 1.43e-11 | 5.08e-10 | 115 |
| GO:00165735 | Esophagus | ESCC | histone acetylation | 110/8552 | 152/18723 | 1.95e-11 | 6.81e-10 | 110 |
| GO:004396712 | Esophagus | ESCC | histone H4 acetylation | 53/8552 | 67/18723 | 2.11e-08 | 4.03e-07 | 53 |
| Page: 1 2 3 4 5 6 7 8 |
| Pathway ID | Tissue | Disease Stage | Description | Gene Ratio | Bg Ratio | pvalue | p.adjust | qvalue | Count |
| Page: 1 |
Top |
Cell-cell communication analysis |
| Identification of potential cell-cell interactions between two cell types and their ligand-receptor pairs for different disease states |
| Ligand | Receptor | LRpair | Pathway | Tissue | Disease Stage |
| Page: 1 |
Top |
Single-cell gene regulatory network inference analysis |
| Find out the significant the regulons (TFs) and the target genes of each regulon across cell types for different disease states |
| TF | Cell Type | Tissue | Disease Stage | Target Gene | RSS | Regulon Activity |
| ∗The dot plots of a searched regulon are shown for all cell subpopulations in each disease state of each tissue based on the regulon specific score inferred using pySCENIC and by calculating the average expression. |
| Page: 1 |
Top |
Somatic mutation of malignant transformation related genes |
| Annotation of somatic variants for genes involved in malignant transformation |
| Hugo Symbol | Variant Class | Variant Classification | dbSNP RS | HGVSc | HGVSp | HGVSp Short | SWISSPROT | BIOTYPE | SIFT | PolyPhen | Tumor Sample Barcode | Tissue | Histology | Sex | Age | Stage | Therapy Types | Drugs | Outcome |
| EPC1 | SNV | Missense_Mutation | novel | c.1913N>T | p.Gly638Val | p.G638V | Q9H2F5 | protein_coding | tolerated(0.37) | benign(0.031) | TCGA-A2-A0CR-01 | Breast | breast invasive carcinoma | Female | <65 | I/II | Chemotherapy | adriamycin | CR |
| EPC1 | SNV | Missense_Mutation | novel | c.1049N>T | p.Ala350Val | p.A350V | Q9H2F5 | protein_coding | tolerated(0.34) | benign(0.011) | TCGA-A2-A3XY-01 | Breast | breast invasive carcinoma | Female | <65 | I/II | Chemotherapy | adriamycin | PD |
| EPC1 | SNV | Missense_Mutation | c.245A>G | p.Asn82Ser | p.N82S | Q9H2F5 | protein_coding | tolerated(0.06) | possibly_damaging(0.536) | TCGA-B6-A0IK-01 | Breast | breast invasive carcinoma | Female | <65 | III/IV | Unknown | Unknown | PD | |
| EPC1 | SNV | Missense_Mutation | novel | c.1762N>A | p.Tyr588Asn | p.Y588N | Q9H2F5 | protein_coding | deleterious(0) | probably_damaging(0.998) | TCGA-BH-A0HF-01 | Breast | breast invasive carcinoma | Female | >=65 | I/II | Hormone Therapy | arimidex | SD |
| EPC1 | SNV | Missense_Mutation | c.927A>T | p.Gln309His | p.Q309H | Q9H2F5 | protein_coding | tolerated(0.17) | benign(0) | TCGA-BH-A18G-01 | Breast | breast invasive carcinoma | Female | >=65 | I/II | Unknown | Unknown | SD | |
| EPC1 | SNV | Missense_Mutation | novel | c.1958N>T | p.Ser653Phe | p.S653F | Q9H2F5 | protein_coding | deleterious(0) | probably_damaging(0.925) | TCGA-D8-A27G-01 | Breast | breast invasive carcinoma | Female | >=65 | I/II | Unknown | Unknown | SD |
| EPC1 | SNV | Missense_Mutation | c.1058C>A | p.Pro353His | p.P353H | Q9H2F5 | protein_coding | tolerated(0.24) | possibly_damaging(0.832) | TCGA-E9-A1NC-01 | Breast | breast invasive carcinoma | Female | <65 | I/II | Chemotherapy | doxorubicin | CR | |
| EPC1 | SNV | Missense_Mutation | c.2495C>T | p.Ala832Val | p.A832V | Q9H2F5 | protein_coding | tolerated(0.07) | probably_damaging(0.992) | TCGA-E9-A248-01 | Breast | breast invasive carcinoma | Female | <65 | I/II | Chemotherapy | cyclophosphamide | SD | |
| EPC1 | insertion | Nonsense_Mutation | novel | c.1037_1038insTTGTAGAATTCCTTCCTTCATACTCTAA | p.Ser347CysfsTer9 | p.S347Cfs*9 | Q9H2F5 | protein_coding | TCGA-A8-A097-01 | Breast | breast invasive carcinoma | Female | >=65 | I/II | Hormone Therapy | tamoxiphen | SD | ||
| EPC1 | insertion | In_Frame_Ins | novel | c.1759_1760insTCTGGCCAGGGCAACAAGAGCTAAACTCTGTCTCAAAAA | p.Gln587delinsLeuTrpProGlyGlnGlnGluLeuAsnSerValSerLysLys | p.Q587delinsLWPGQQELNSVSKK | Q9H2F5 | protein_coding | TCGA-BH-A0HF-01 | Breast | breast invasive carcinoma | Female | >=65 | I/II | Hormone Therapy | arimidex | SD |
| Page: 1 2 3 4 5 6 7 |
Top |
Related drugs of malignant transformation related genes |
| Identification of chemicals and drugs interact with genes involved in malignant transfromation |
| (DGIdb 4.0) |
| Entrez ID | Symbol | Category | Interaction Types | Drug Claim Name | Drug Name | PMIDs |
| Page: 1 |

Copyright 2023-Present -The University of Texas Health Science Center at Houston |