
|
|||||
|
 | |
| |
| |
| |
| |
| |
|
Gene: CERS6 |
Gene summary for CERS6 |
| Gene information | Species | Human | Gene symbol | CERS6 | Gene ID | 253782 |
| Gene name | ceramide synthase 6 | |
| Gene Alias | CERS5 | |
| Cytomap | 2q24.3 | |
| Gene Type | protein-coding | GO ID | GO:0006629 | UniProtAcc | Q6ZMG9 |
Top |
Malignant transformation analysis |
| Identification of the aberrant gene expression in precancerous and cancerous lesions by comparing the gene expression of stem-like cells in diseased tissues with normal stem cells |
| Entrez ID | Symbol | Replicates | Species | Organ | Tissue | Adj P-value | Log2FC | Malignancy |
| 253782 | CERS6 | GSM5353244_PA_PR5261_T2_S24_L002 | Human | Prostate | Tumor | 1.47e-11 | 5.49e-01 | 0.1569 |
| 253782 | CERS6 | P1_S1_AK | Human | Skin | AK | 1.95e-15 | 5.33e-01 | -0.3399 |
| 253782 | CERS6 | P2_S3_AK | Human | Skin | AK | 5.15e-17 | 5.36e-01 | -0.3287 |
| 253782 | CERS6 | P2_S4_SCCIS | Human | Skin | SCCIS | 7.90e-06 | 3.82e-01 | -0.3043 |
| 253782 | CERS6 | P4_S8_cSCC | Human | Skin | cSCC | 4.92e-13 | 4.69e-01 | -0.3095 |
| 253782 | CERS6 | P5_S10_cSCC | Human | Skin | cSCC | 2.29e-17 | 3.78e-01 | -0.299 |
| 253782 | CERS6 | P1_cSCC | Human | Skin | cSCC | 8.46e-10 | 5.02e-01 | 0.0292 |
| 253782 | CERS6 | P2_cSCC | Human | Skin | cSCC | 1.15e-05 | 2.71e-01 | -0.024 |
| 253782 | CERS6 | P4_cSCC | Human | Skin | cSCC | 1.95e-09 | 3.82e-01 | -0.00290000000000005 |
| 253782 | CERS6 | P10_cSCC | Human | Skin | cSCC | 1.25e-10 | 4.39e-01 | 0.1017 |
| 253782 | CERS6 | cSCC_p11 | Human | Skin | cSCC | 2.11e-02 | 2.19e-01 | -0.2102 |
| 253782 | CERS6 | cSCC_p8 | Human | Skin | cSCC | 3.96e-03 | 1.56e-01 | -0.1971 |
| 253782 | CERS6 | cSCC_p9 | Human | Skin | cSCC | 1.26e-04 | 1.94e-01 | -0.1991 |
| 253782 | CERS6 | Pat01-B | Human | Stomach | GC | 1.49e-11 | 1.25e-01 | 0.5754 |
| 253782 | CERS6 | Pat02-B | Human | Stomach | GC | 2.52e-35 | 2.08e-01 | 0.0368 |
| 253782 | CERS6 | Pat03-B | Human | Stomach | GC | 8.43e-17 | 2.09e-01 | 0.3693 |
| 253782 | CERS6 | Pat04-B | Human | Stomach | GC | 1.23e-25 | 3.14e-01 | -0.1483 |
| 253782 | CERS6 | Pat05-B | Human | Stomach | GC | 2.29e-13 | 2.68e-01 | -0.0353 |
| 253782 | CERS6 | Pat06-B | Human | Stomach | GC | 2.11e-58 | 5.12e-01 | -0.1961 |
| 253782 | CERS6 | Pat10-B | Human | Stomach | GC | 3.42e-05 | 3.33e-01 | 0.084 |
| Page: 1 2 3 4 5 6 7 8 9 10 11 12 |
| Tissue | Expression Dynamics | Abbreviation |
| Cervix | 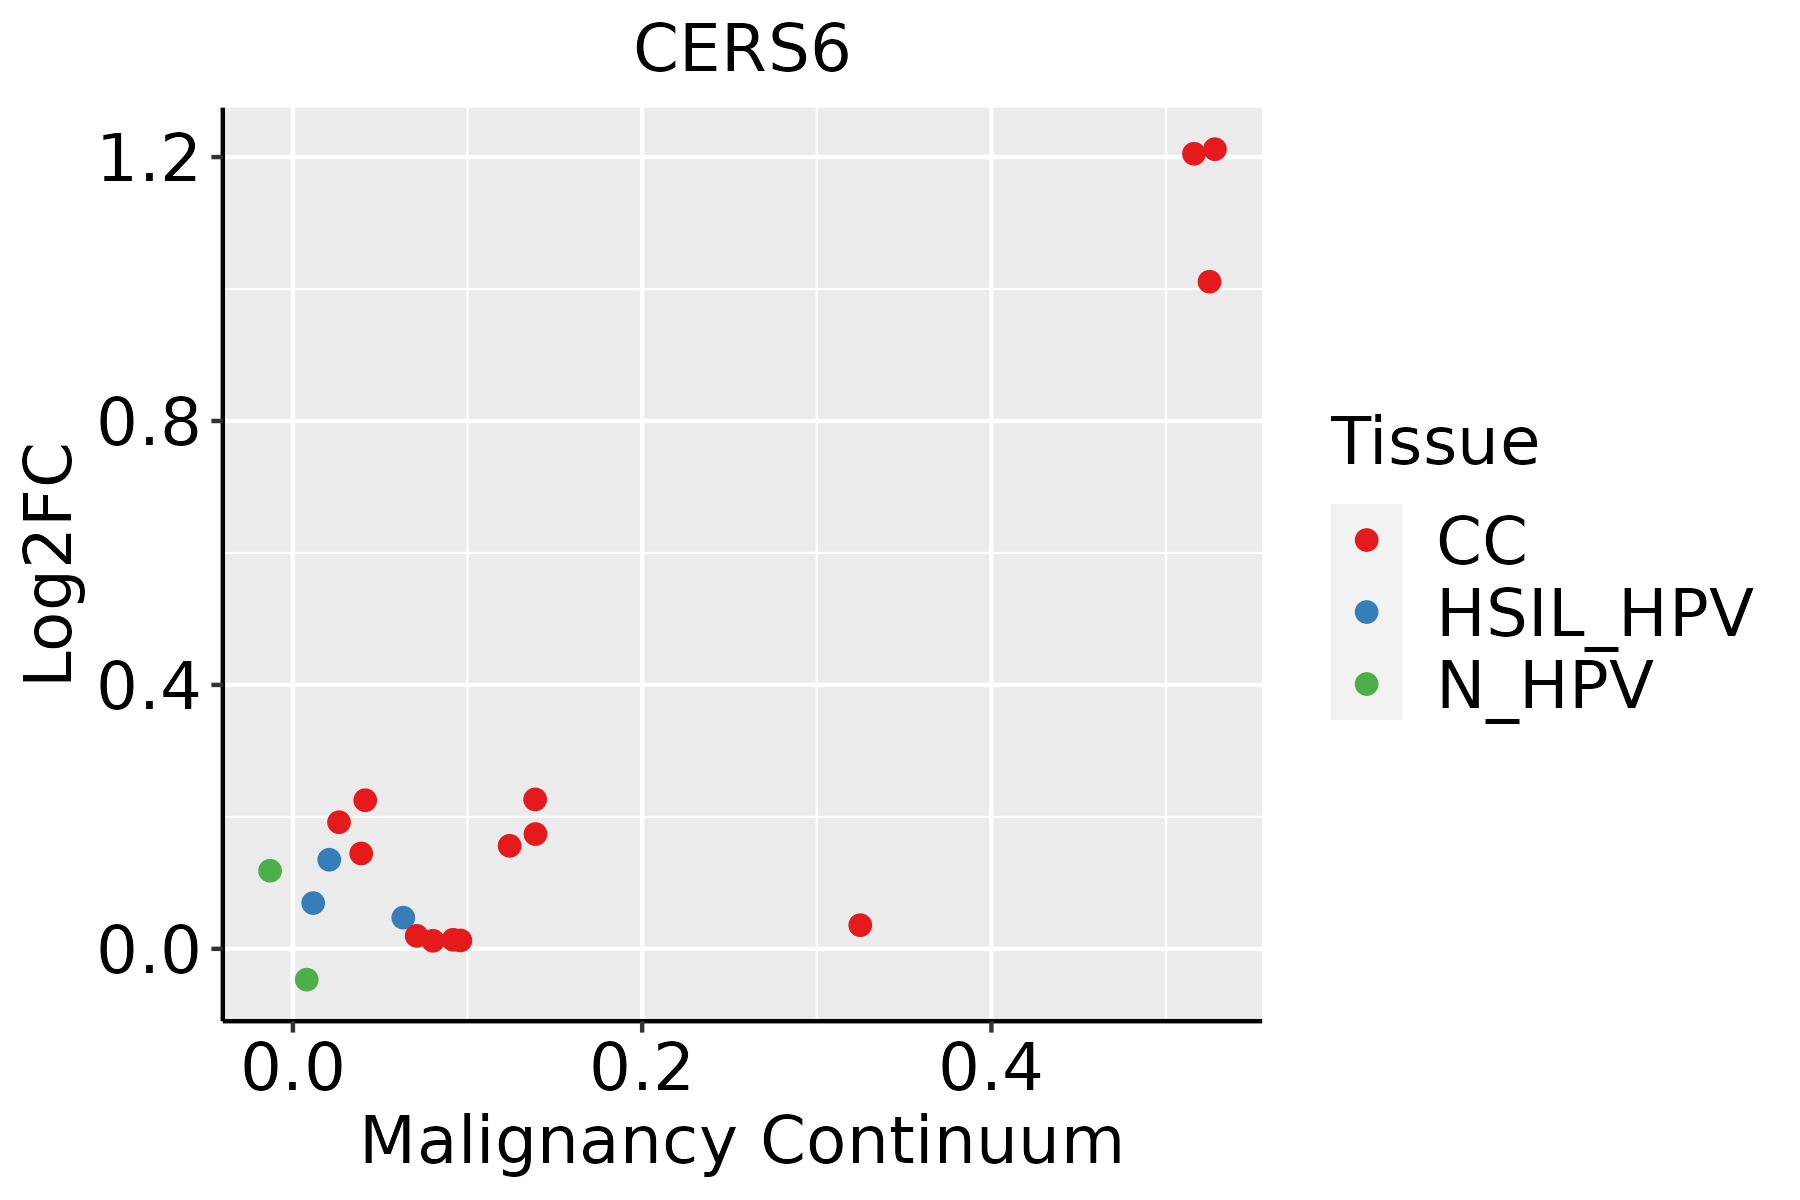 | CC: Cervix cancer |
| HSIL_HPV: HPV-infected high-grade squamous intraepithelial lesions | ||
| N_HPV: HPV-infected normal cervix | ||
| Colorectum (GSE201348) |  | FAP: Familial adenomatous polyposis |
| CRC: Colorectal cancer | ||
| Colorectum (HTA11) |  | AD: Adenomas |
| SER: Sessile serrated lesions | ||
| MSI-H: Microsatellite-high colorectal cancer | ||
| MSS: Microsatellite stable colorectal cancer | ||
| Endometrium | 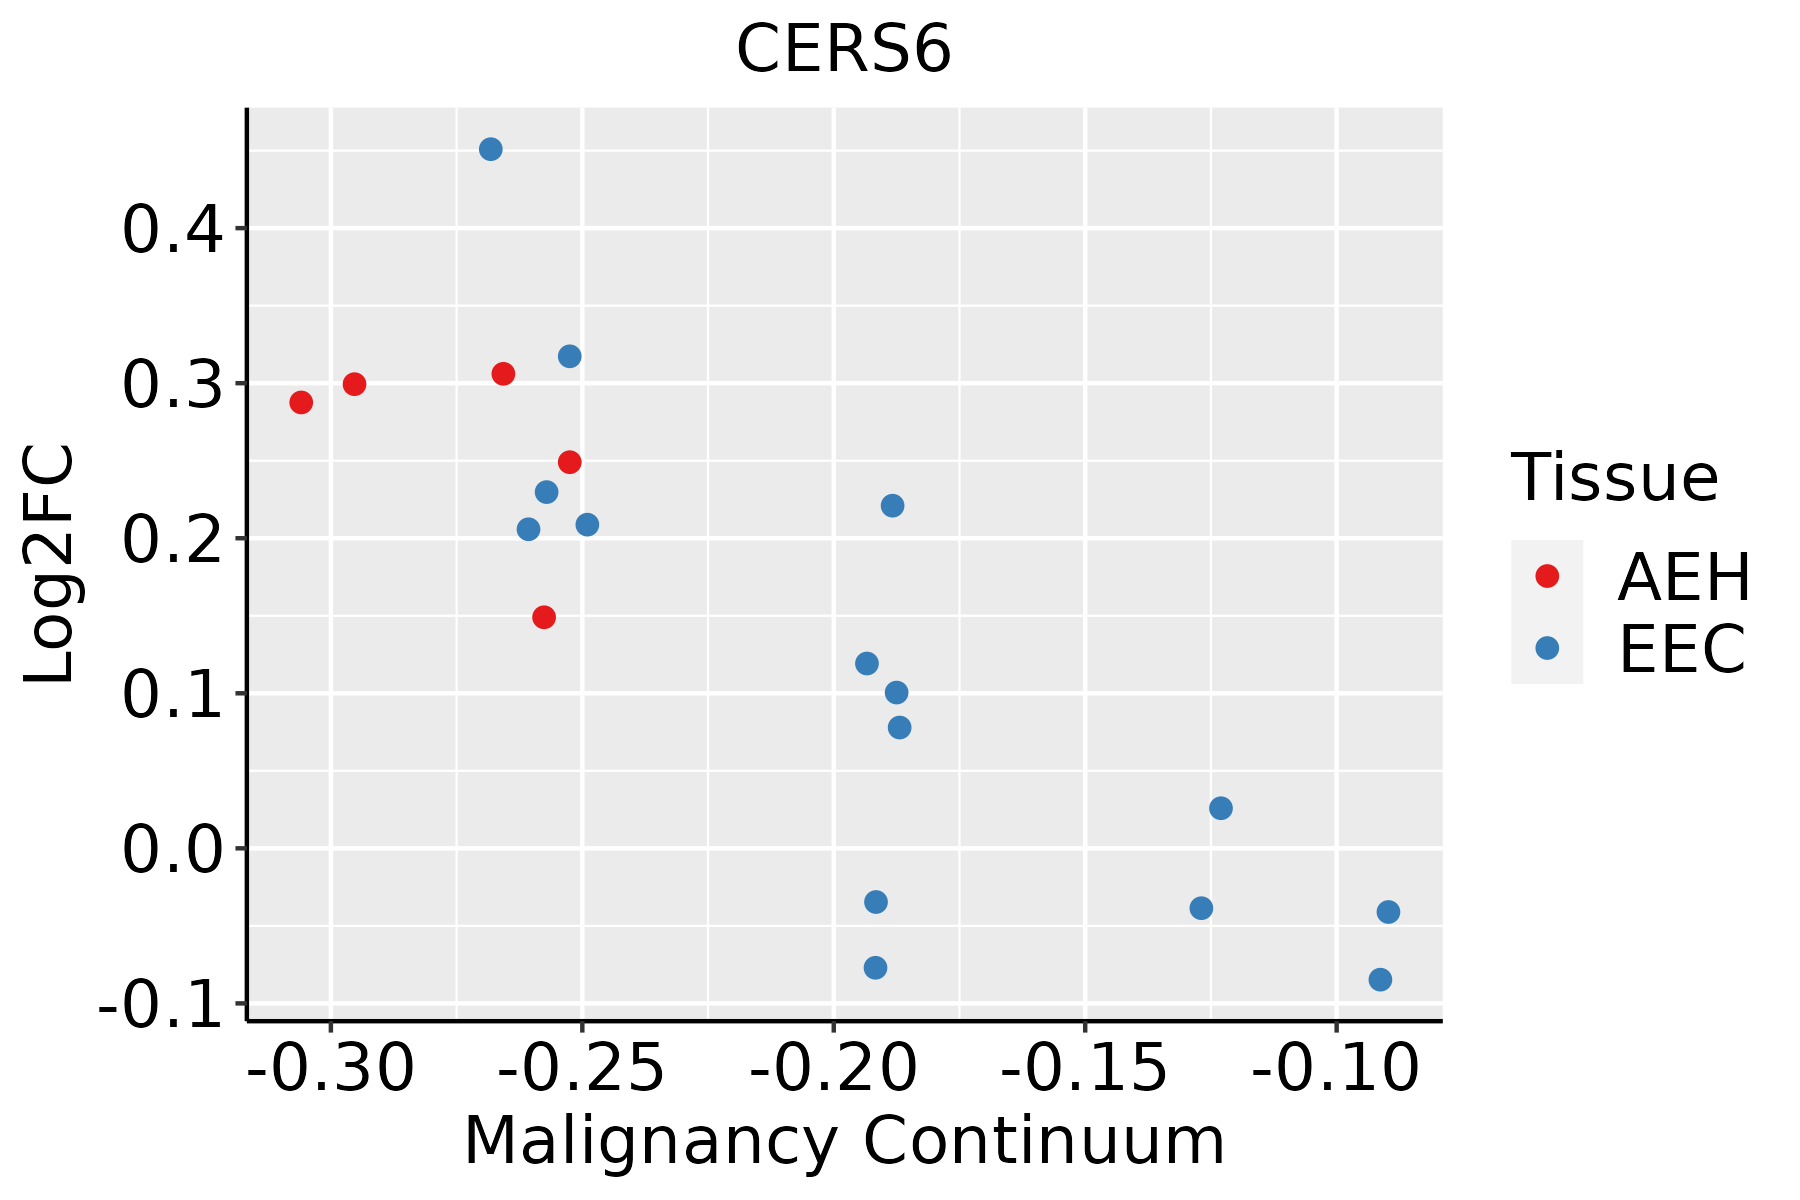 | AEH: Atypical endometrial hyperplasia |
| EEC: Endometrioid Cancer | ||
| Esophagus |  | ESCC: Esophageal squamous cell carcinoma |
| HGIN: High-grade intraepithelial neoplasias | ||
| LGIN: Low-grade intraepithelial neoplasias | ||
| GC | 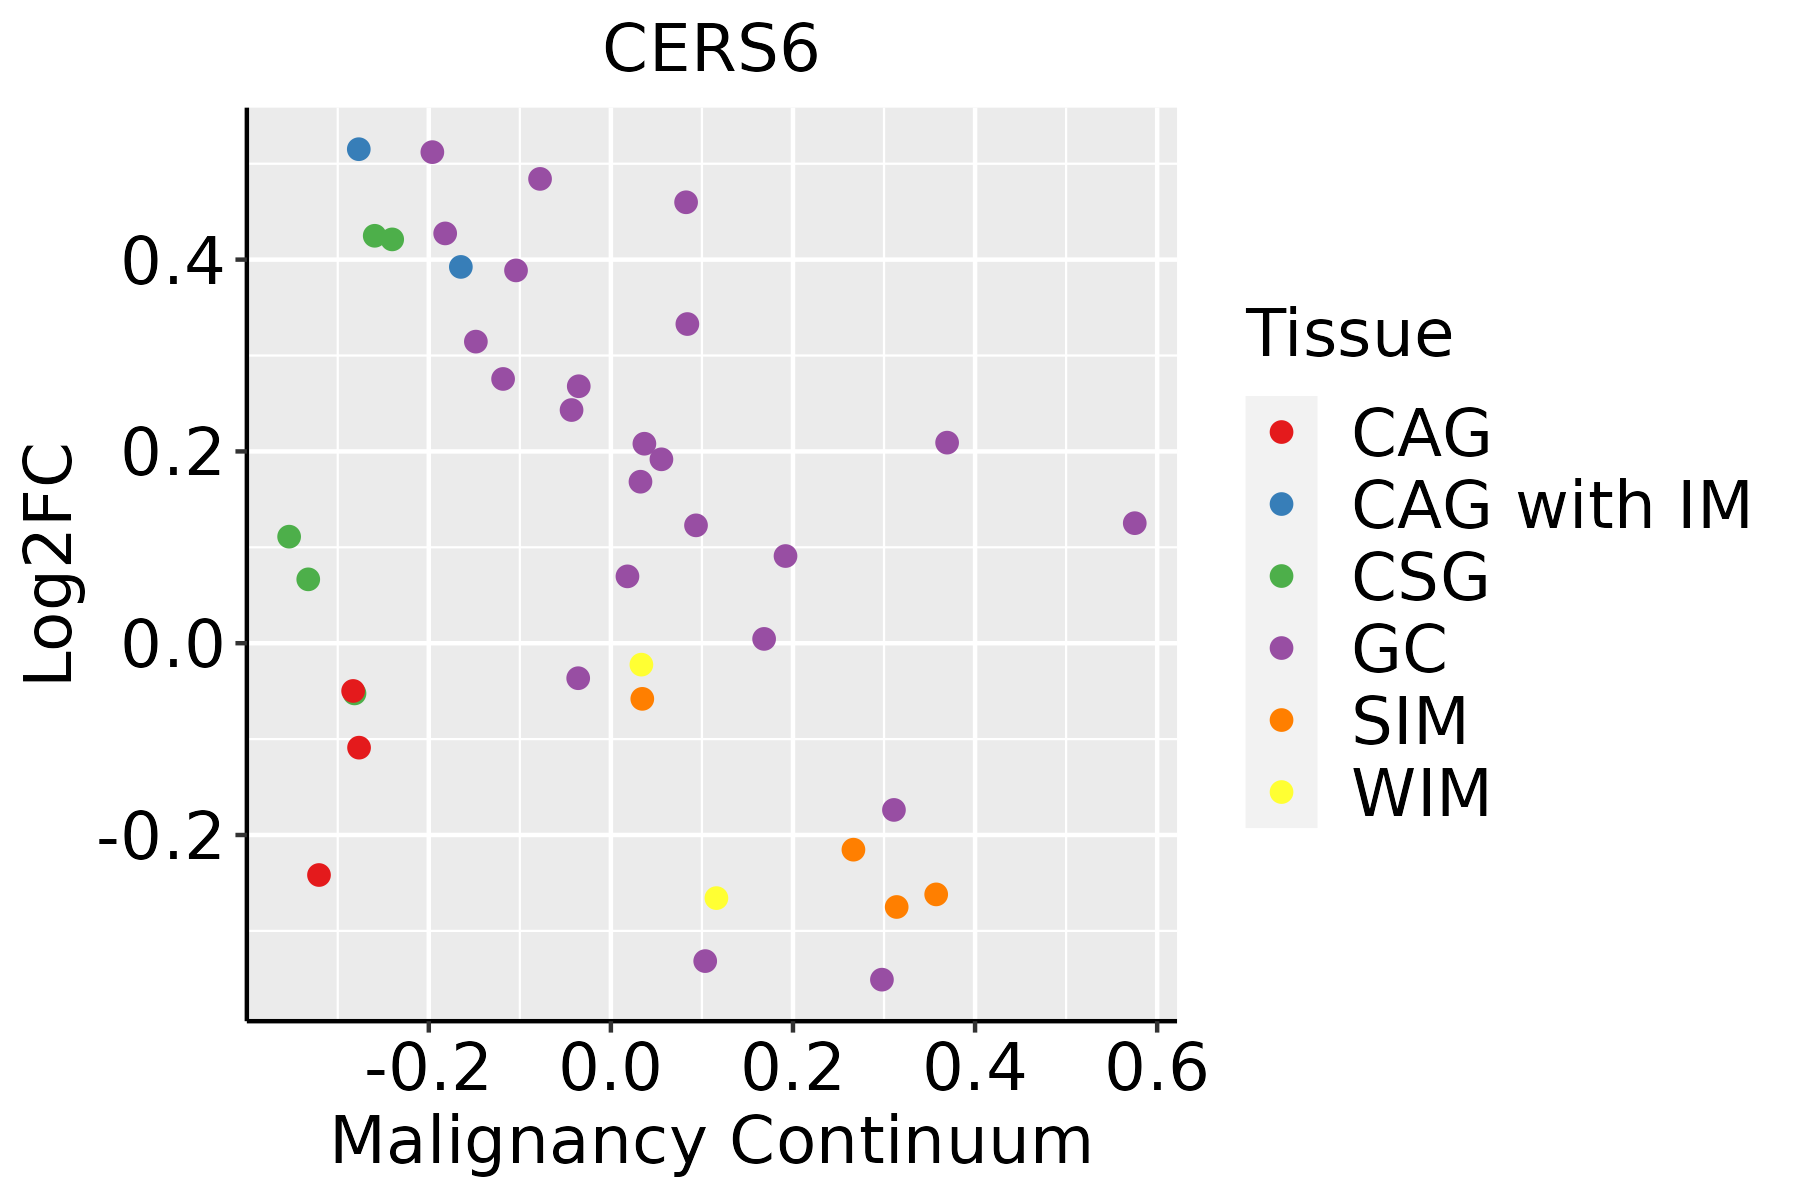 | CAG: Chronic atrophic gastritis |
| CAG with IM: Chronic atrophic gastritis with intestinal metaplasia | ||
| CSG: Chronic superficial gastritis | ||
| GC: Gastric cancer | ||
| SIM: Severe intestinal metaplasia | ||
| WIM: Wild intestinal metaplasia | ||
| Liver | 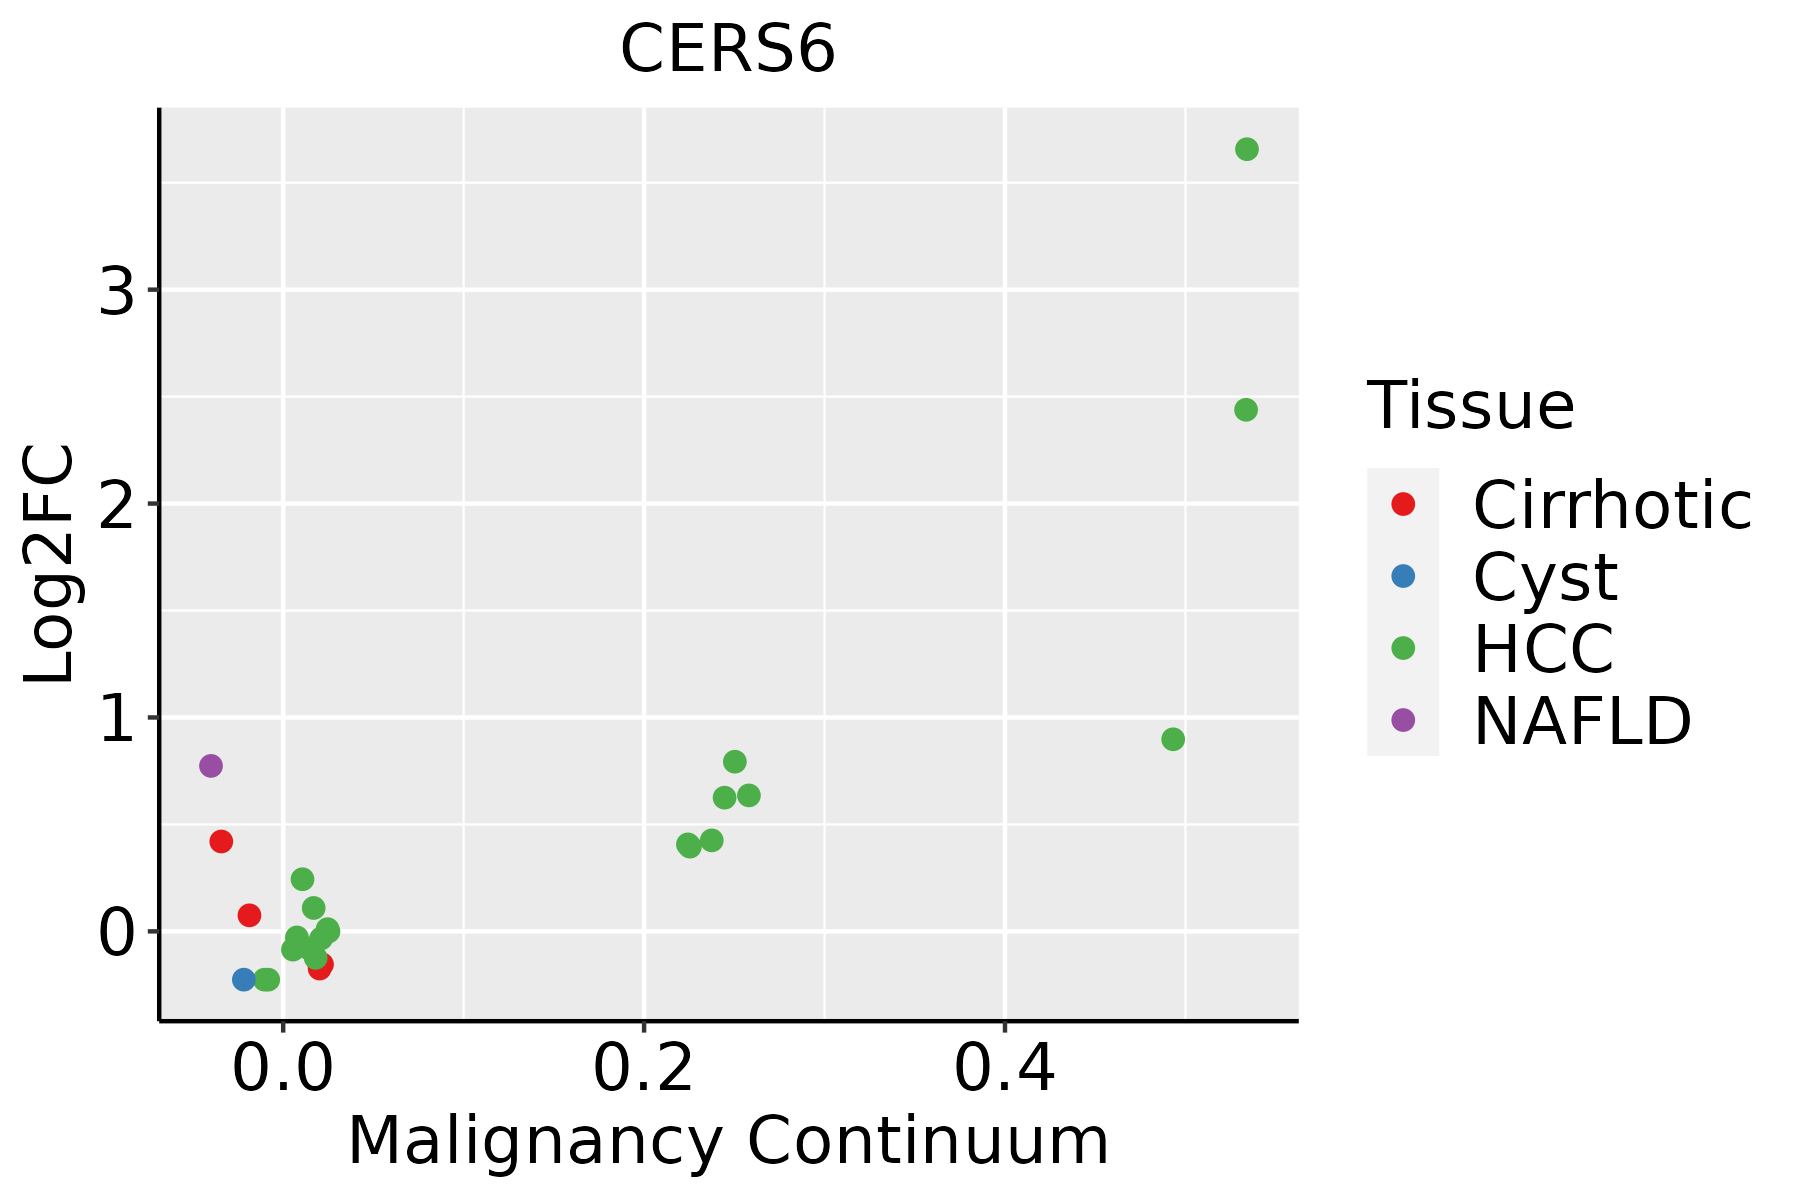 | HCC: Hepatocellular carcinoma |
| NAFLD: Non-alcoholic fatty liver disease | ||
| Lung |  | AAH: Atypical adenomatous hyperplasia |
| AIS: Adenocarcinoma in situ | ||
| IAC: Invasive lung adenocarcinoma | ||
| MIA: Minimally invasive adenocarcinoma | ||
| Oral Cavity | 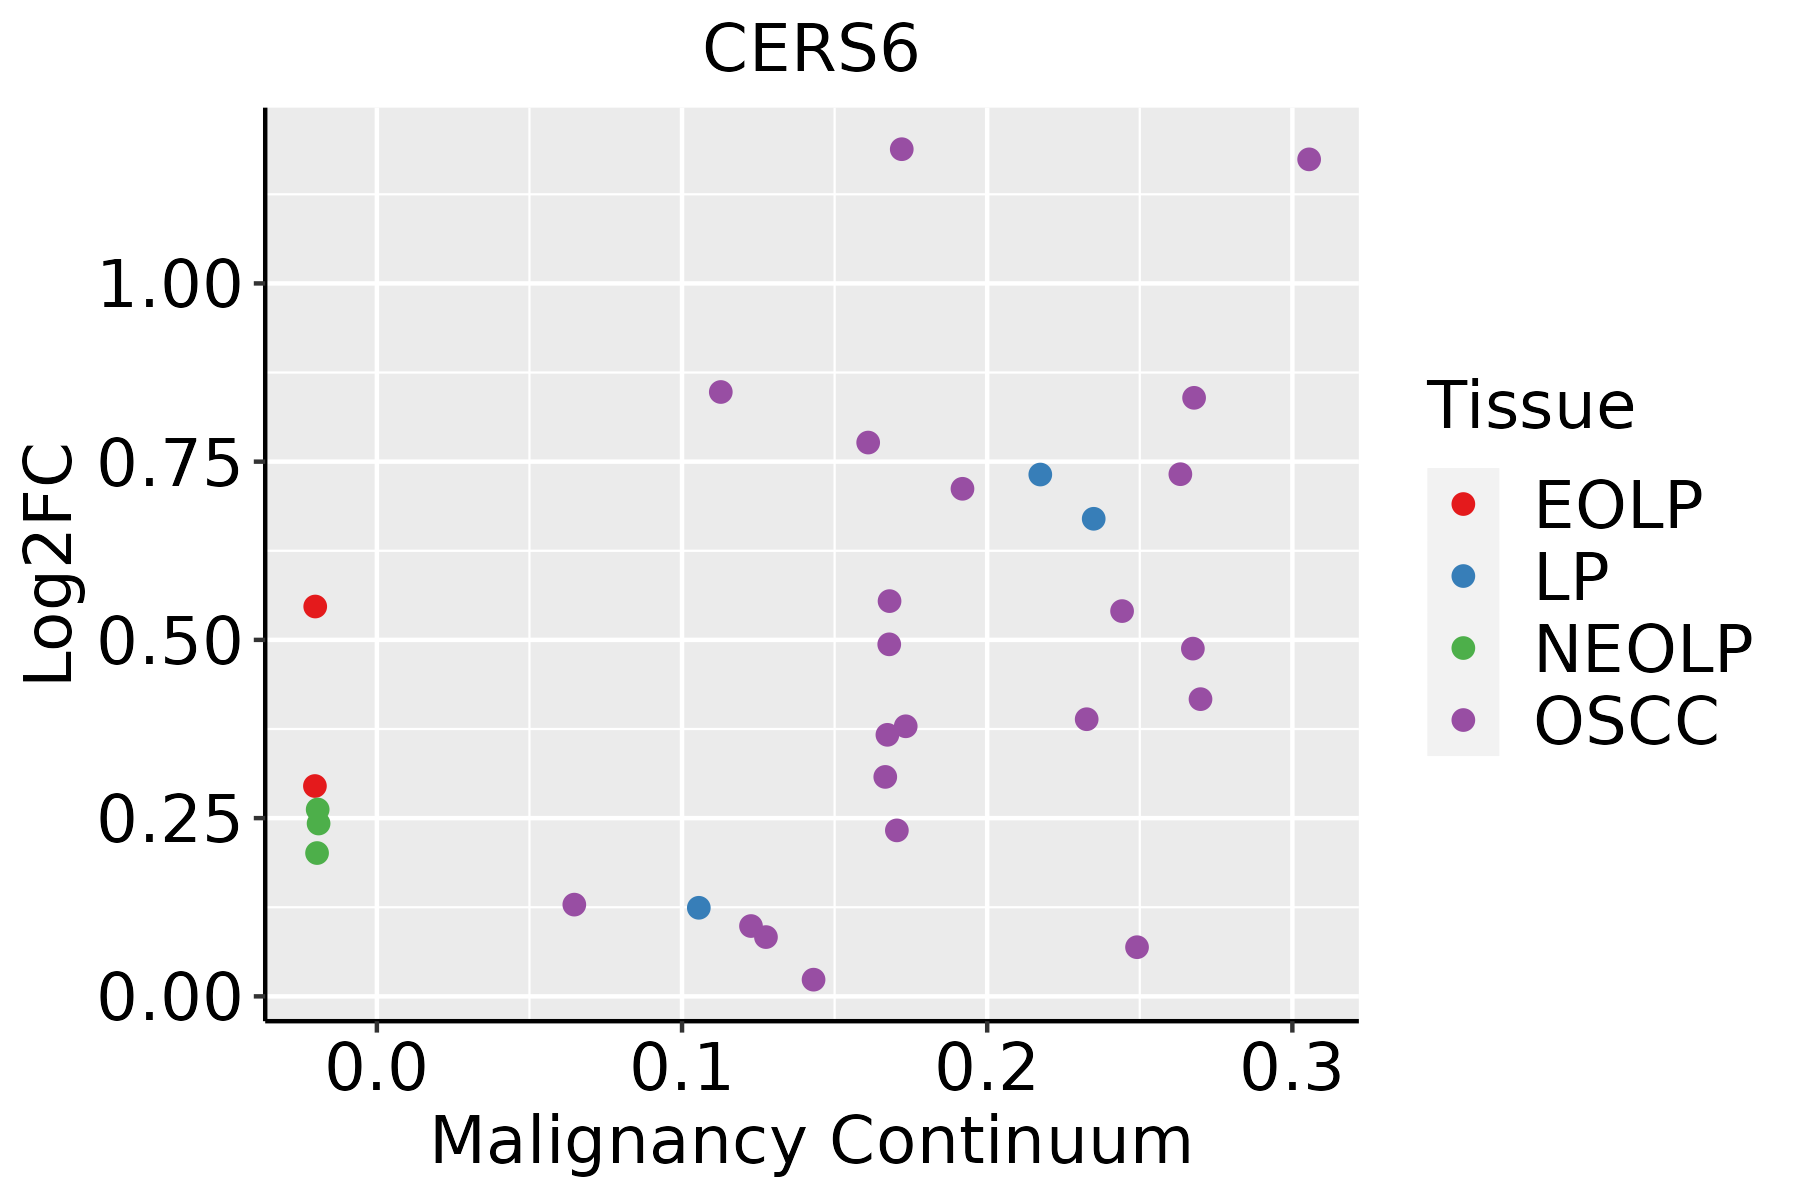 | EOLP: Erosive Oral lichen planus |
| LP: leukoplakia | ||
| NEOLP: Non-erosive oral lichen planus | ||
| OSCC: Oral squamous cell carcinoma | ||
| Prostate | 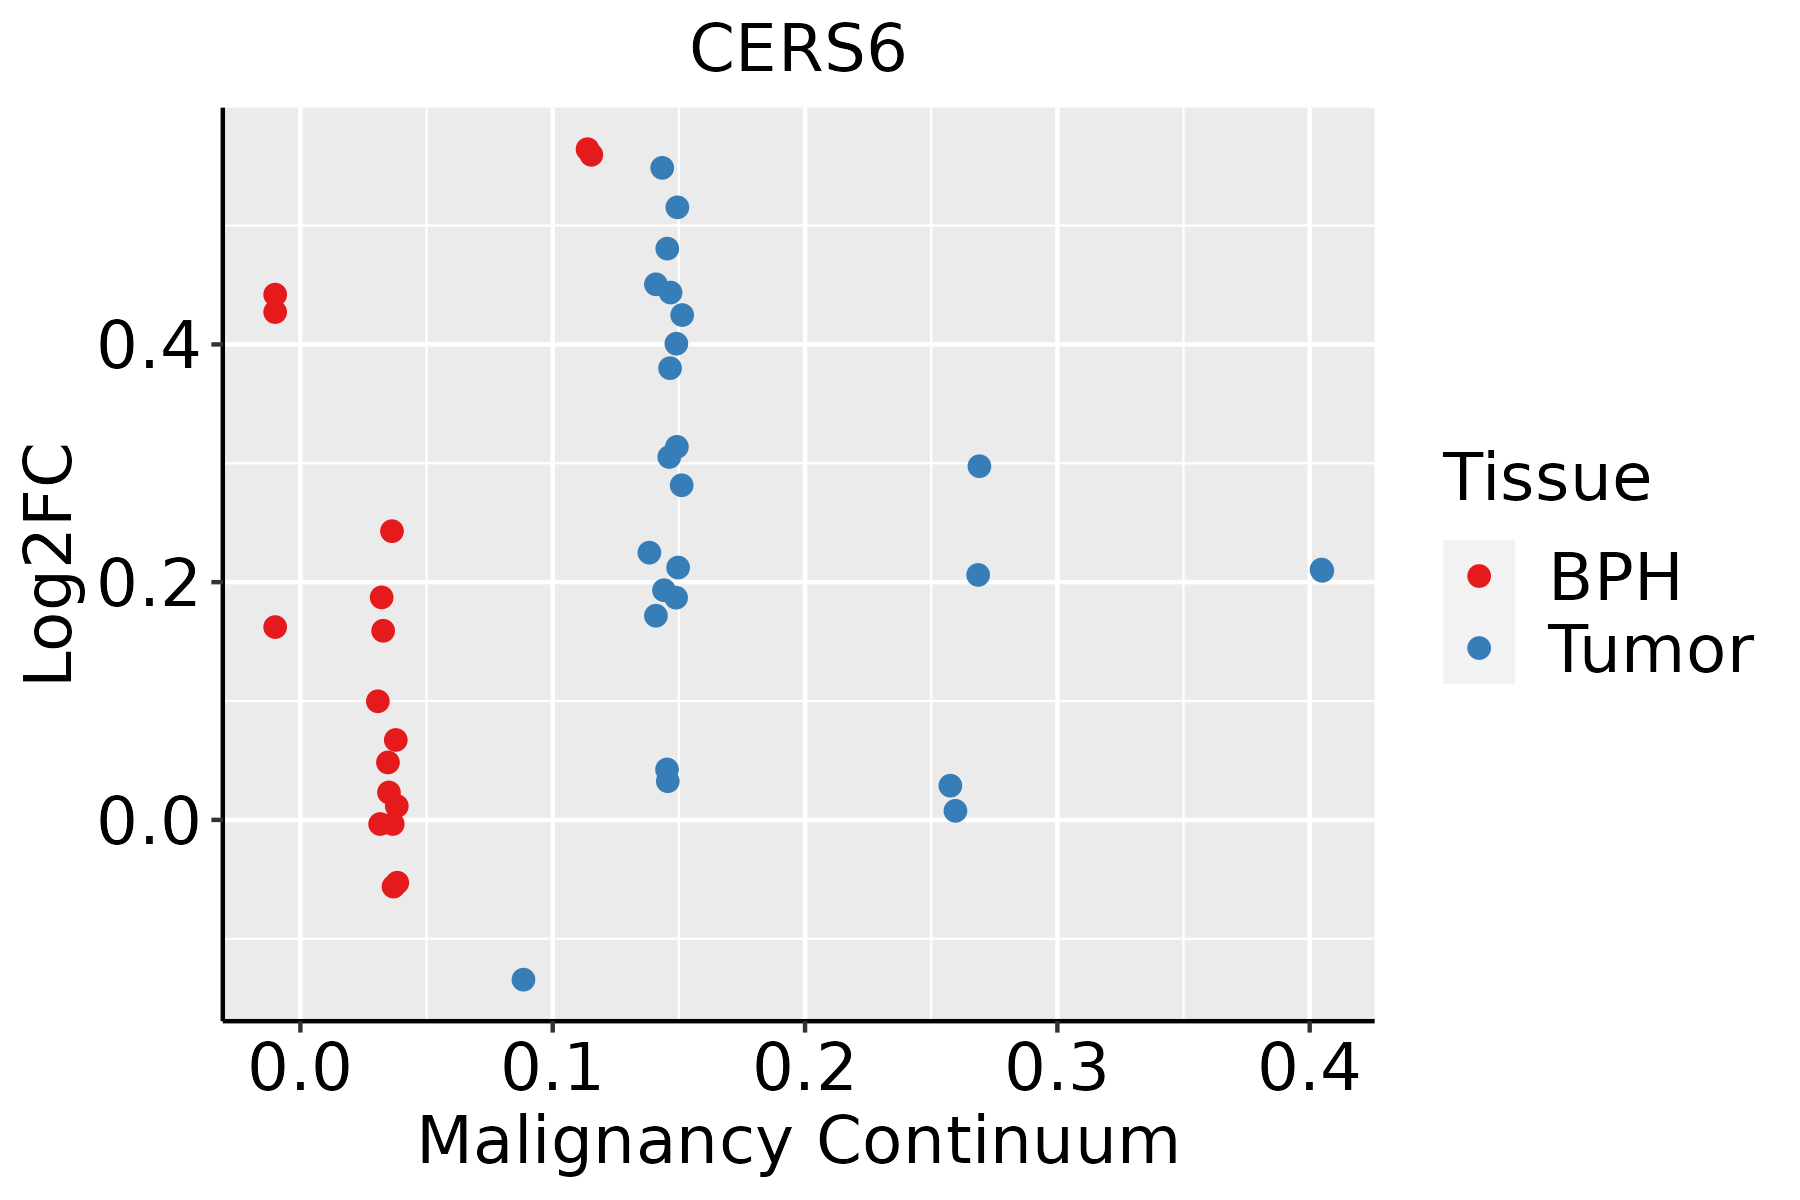 | BPH: Benign Prostatic Hyperplasia |
| Skin |  | AK: Actinic keratosis |
| cSCC: Cutaneous squamous cell carcinoma | ||
| SCCIS:squamous cell carcinoma in situ | ||
| Thyroid |  | ATC: Anaplastic thyroid cancer |
| HT: Hashimoto's thyroiditis | ||
| PTC: Papillary thyroid cancer |
| ∗log2FC in expression of this searched gene in stem-like cells from each diseased tissue sample relative to stem-like cells in normal samples in each tissue plotted against the malignancy continuum. Samples are colored based on if they are from different disease stage. |
Top |
Malignant transformation related pathway analysis |
| Find out the enriched GO biological processes and KEGG pathways involved in transition from healthy to precancer to cancer |
| Tissue | Disease Stage | Enriched GO biological Processes |
| Colorectum | AD |  |
| Colorectum | SER |  |
| Colorectum | MSS |  |
| Colorectum | MSI-H |  |
| Colorectum | FAP |  |
| ∗Top 15 enriched GO BP terms are showed in the bar plot of each disease state in each tissue. Each row represents a significant GO biological process which is colored according to the -log10(p.adjust). |
| Page: 1 2 3 4 5 6 7 8 9 |
| GO ID | Tissue | Disease Stage | Description | Gene Ratio | Bg Ratio | pvalue | p.adjust | Count |
| GO:00066433 | Esophagus | ESCC | membrane lipid metabolic process | 130/8552 | 203/18723 | 9.29e-08 | 1.54e-06 | 130 |
| GO:00464673 | Esophagus | ESCC | membrane lipid biosynthetic process | 91/8552 | 142/18723 | 7.19e-06 | 7.19e-05 | 91 |
| GO:00066652 | Esophagus | ESCC | sphingolipid metabolic process | 96/8552 | 155/18723 | 3.21e-05 | 2.66e-04 | 96 |
| GO:00301481 | Esophagus | ESCC | sphingolipid biosynthetic process | 62/8552 | 103/18723 | 2.10e-03 | 9.38e-03 | 62 |
| GO:00066721 | Esophagus | ESCC | ceramide metabolic process | 61/8552 | 102/18723 | 2.82e-03 | 1.19e-02 | 61 |
| GO:0046513 | Esophagus | ESCC | ceramide biosynthetic process | 40/8552 | 65/18723 | 7.25e-03 | 2.63e-02 | 40 |
| GO:0006643 | Liver | Cirrhotic | membrane lipid metabolic process | 69/4634 | 203/18723 | 1.89e-03 | 1.19e-02 | 69 |
| GO:00066431 | Liver | HCC | membrane lipid metabolic process | 115/7958 | 203/18723 | 3.17e-05 | 3.22e-04 | 115 |
| GO:0006665 | Liver | HCC | sphingolipid metabolic process | 85/7958 | 155/18723 | 1.27e-03 | 6.92e-03 | 85 |
| GO:0046467 | Liver | HCC | membrane lipid biosynthetic process | 78/7958 | 142/18723 | 1.85e-03 | 9.46e-03 | 78 |
| GO:00066432 | Oral cavity | OSCC | membrane lipid metabolic process | 111/7305 | 203/18723 | 4.02e-06 | 4.69e-05 | 111 |
| GO:00066651 | Oral cavity | OSCC | sphingolipid metabolic process | 84/7305 | 155/18723 | 8.64e-05 | 6.61e-04 | 84 |
| GO:00464672 | Oral cavity | OSCC | membrane lipid biosynthetic process | 77/7305 | 142/18723 | 1.63e-04 | 1.13e-03 | 77 |
| GO:0006672 | Oral cavity | OSCC | ceramide metabolic process | 53/7305 | 102/18723 | 5.28e-03 | 2.06e-02 | 53 |
| GO:0030148 | Oral cavity | OSCC | sphingolipid biosynthetic process | 53/7305 | 103/18723 | 6.81e-03 | 2.53e-02 | 53 |
| GO:000664311 | Oral cavity | LP | membrane lipid metabolic process | 69/4623 | 203/18723 | 1.77e-03 | 1.34e-02 | 69 |
| GO:00464671 | Oral cavity | LP | membrane lipid biosynthetic process | 49/4623 | 142/18723 | 5.44e-03 | 3.31e-02 | 49 |
| Page: 1 |
| Pathway ID | Tissue | Disease Stage | Description | Gene Ratio | Bg Ratio | pvalue | p.adjust | qvalue | Count |
| hsa0407110 | Cervix | CC | Sphingolipid signaling pathway | 35/1267 | 121/8465 | 5.70e-05 | 3.93e-04 | 2.32e-04 | 35 |
| hsa0407113 | Cervix | CC | Sphingolipid signaling pathway | 35/1267 | 121/8465 | 5.70e-05 | 3.93e-04 | 2.32e-04 | 35 |
| hsa04071 | Colorectum | AD | Sphingolipid signaling pathway | 43/2092 | 121/8465 | 4.83e-03 | 2.28e-02 | 1.45e-02 | 43 |
| hsa040711 | Colorectum | AD | Sphingolipid signaling pathway | 43/2092 | 121/8465 | 4.83e-03 | 2.28e-02 | 1.45e-02 | 43 |
| hsa040712 | Colorectum | MSS | Sphingolipid signaling pathway | 40/1875 | 121/8465 | 3.56e-03 | 1.64e-02 | 1.01e-02 | 40 |
| hsa040713 | Colorectum | MSS | Sphingolipid signaling pathway | 40/1875 | 121/8465 | 3.56e-03 | 1.64e-02 | 1.01e-02 | 40 |
| hsa040714 | Colorectum | FAP | Sphingolipid signaling pathway | 34/1404 | 121/8465 | 9.53e-04 | 5.22e-03 | 3.17e-03 | 34 |
| hsa040715 | Colorectum | FAP | Sphingolipid signaling pathway | 34/1404 | 121/8465 | 9.53e-04 | 5.22e-03 | 3.17e-03 | 34 |
| hsa040716 | Colorectum | CRC | Sphingolipid signaling pathway | 30/1091 | 121/8465 | 2.49e-04 | 3.09e-03 | 2.09e-03 | 30 |
| hsa040717 | Colorectum | CRC | Sphingolipid signaling pathway | 30/1091 | 121/8465 | 2.49e-04 | 3.09e-03 | 2.09e-03 | 30 |
| hsa0407116 | Esophagus | ESCC | Sphingolipid signaling pathway | 85/4205 | 121/8465 | 3.04e-06 | 1.73e-05 | 8.84e-06 | 85 |
| hsa006003 | Esophagus | ESCC | Sphingolipid metabolism | 36/4205 | 53/8465 | 5.41e-03 | 1.36e-02 | 6.99e-03 | 36 |
| hsa0407117 | Esophagus | ESCC | Sphingolipid signaling pathway | 85/4205 | 121/8465 | 3.04e-06 | 1.73e-05 | 8.84e-06 | 85 |
| hsa0060012 | Esophagus | ESCC | Sphingolipid metabolism | 36/4205 | 53/8465 | 5.41e-03 | 1.36e-02 | 6.99e-03 | 36 |
| hsa040718 | Liver | HCC | Sphingolipid signaling pathway | 72/4020 | 121/8465 | 5.01e-03 | 1.47e-02 | 8.18e-03 | 72 |
| hsa00600 | Liver | HCC | Sphingolipid metabolism | 34/4020 | 53/8465 | 1.06e-02 | 2.71e-02 | 1.51e-02 | 34 |
| hsa0407111 | Liver | HCC | Sphingolipid signaling pathway | 72/4020 | 121/8465 | 5.01e-03 | 1.47e-02 | 8.18e-03 | 72 |
| hsa006001 | Liver | HCC | Sphingolipid metabolism | 34/4020 | 53/8465 | 1.06e-02 | 2.71e-02 | 1.51e-02 | 34 |
| hsa040719 | Lung | IAC | Sphingolipid signaling pathway | 28/1053 | 121/8465 | 7.30e-04 | 6.08e-03 | 4.04e-03 | 28 |
| hsa0407112 | Lung | IAC | Sphingolipid signaling pathway | 28/1053 | 121/8465 | 7.30e-04 | 6.08e-03 | 4.04e-03 | 28 |
| Page: 1 2 |
Top |
Cell-cell communication analysis |
| Identification of potential cell-cell interactions between two cell types and their ligand-receptor pairs for different disease states |
| Ligand | Receptor | LRpair | Pathway | Tissue | Disease Stage |
| Page: 1 |
Top |
Single-cell gene regulatory network inference analysis |
| Find out the significant the regulons (TFs) and the target genes of each regulon across cell types for different disease states |
| TF | Cell Type | Tissue | Disease Stage | Target Gene | RSS | Regulon Activity |
| CERS6 | TREG | Endometrium | ADJ | SRGAP2C,ALKBH5,NAV1, etc. | 6.78e-02 |  |
| CERS6 | TREG | Endometrium | AEH | SRGAP2C,ALKBH5,NAV1, etc. | 1.50e-01 |  |
| CERS6 | INCAF | Esophagus | ESCC | TIMP3,ZNF549,HMGCR, etc. | 2.98e-01 |  |
| CERS6 | MYOFIB | Esophagus | ESCC | TIMP3,ZNF549,HMGCR, etc. | 3.21e-01 | |
| CERS6 | LYMEND | Esophagus | Healthy | TIMP3,ZNF549,HMGCR, etc. | 9.16e-02 |  |
| CERS6 | MSC | Liver | HCC | IL17RE,GBE1,NEDD4L, etc. | 1.53e-02 |  |
| CERS6 | MSC.MVA | Liver | Healthy | IL17RE,GBE1,NEDD4L, etc. | 1.77e-02 |  |
| ∗The dot plots of a searched regulon are shown for all cell subpopulations in each disease state of each tissue based on the regulon specific score inferred using pySCENIC and by calculating the average expression. |
| Page: 1 |
Top |
Somatic mutation of malignant transformation related genes |
| Annotation of somatic variants for genes involved in malignant transformation |
| Hugo Symbol | Variant Class | Variant Classification | dbSNP RS | HGVSc | HGVSp | HGVSp Short | SWISSPROT | BIOTYPE | SIFT | PolyPhen | Tumor Sample Barcode | Tissue | Histology | Sex | Age | Stage | Therapy Types | Drugs | Outcome |
| CERS6 | SNV | Missense_Mutation | c.24N>G | p.Phe8Leu | p.F8L | Q6ZMG9 | protein_coding | tolerated(0.9) | benign(0.021) | TCGA-A8-A07B-01 | Breast | breast invasive carcinoma | Female | >=65 | I/II | Unknown | Unknown | SD | |
| CERS6 | SNV | Missense_Mutation | novel | c.404N>A | p.Ser135Asn | p.S135N | Q6ZMG9 | protein_coding | deleterious(0) | probably_damaging(0.988) | TCGA-AN-A046-01 | Breast | breast invasive carcinoma | Female | >=65 | I/II | Unknown | Unknown | SD |
| CERS6 | SNV | Missense_Mutation | c.416N>G | p.Phe139Cys | p.F139C | Q6ZMG9 | protein_coding | deleterious(0.01) | probably_damaging(0.99) | TCGA-A6-2681-01 | Colorectum | colon adenocarcinoma | Female | >=65 | I/II | Unknown | Unknown | PD | |
| CERS6 | SNV | Missense_Mutation | c.4N>A | p.Ala2Thr | p.A2T | Q6ZMG9 | protein_coding | deleterious(0.01) | benign(0.441) | TCGA-AA-3492-01 | Colorectum | colon adenocarcinoma | Female | >=65 | I/II | Unknown | Unknown | SD | |
| CERS6 | SNV | Missense_Mutation | c.746N>T | p.Lys249Ile | p.K249I | Q6ZMG9 | protein_coding | deleterious(0) | probably_damaging(0.999) | TCGA-AA-A010-01 | Colorectum | colon adenocarcinoma | Female | <65 | I/II | Chemotherapy | folinic | CR | |
| CERS6 | SNV | Missense_Mutation | c.46N>T | p.Pro16Ser | p.P16S | Q6ZMG9 | protein_coding | deleterious(0) | probably_damaging(1) | TCGA-G4-6320-01 | Colorectum | colon adenocarcinoma | Male | >=65 | III/IV | Chemotherapy | oxaliplatin | SD | |
| CERS6 | SNV | Missense_Mutation | c.317N>G | p.Leu106Arg | p.L106R | Q6ZMG9 | protein_coding | deleterious(0.01) | probably_damaging(0.999) | TCGA-AF-A56N-01 | Colorectum | rectum adenocarcinoma | Female | <65 | I/II | Chemotherapy | xeloda | CR | |
| CERS6 | SNV | Missense_Mutation | novel | c.595N>T | p.Asp199Tyr | p.D199Y | Q6ZMG9 | protein_coding | deleterious(0) | probably_damaging(1) | TCGA-AG-A002-01 | Colorectum | rectum adenocarcinoma | Male | <65 | I/II | Unknown | Unknown | SD |
| CERS6 | SNV | Missense_Mutation | novel | c.614N>G | p.Phe205Cys | p.F205C | Q6ZMG9 | protein_coding | deleterious(0.01) | probably_damaging(0.996) | TCGA-AG-A002-01 | Colorectum | rectum adenocarcinoma | Male | <65 | I/II | Unknown | Unknown | SD |
| CERS6 | insertion | Frame_Shift_Ins | novel | c.567_568insTGGTCTTTGA | p.Phe194ValfsTer9 | p.F194Vfs*9 | Q6ZMG9 | protein_coding | TCGA-EI-6514-01 | Colorectum | rectum adenocarcinoma | Female | <65 | I/II | Chemotherapy | 5-fu | SD |
| Page: 1 2 3 4 5 |
Top |
Related drugs of malignant transformation related genes |
| Identification of chemicals and drugs interact with genes involved in malignant transfromation |
| (DGIdb 4.0) |
| Entrez ID | Symbol | Category | Interaction Types | Drug Claim Name | Drug Name | PMIDs |
| 253782 | CERS6 | ENZYME | Tumor necrosis factor alpha (TNF-alpha) inhibitors |
| Page: 1 |

Copyright 2023-Present -The University of Texas Health Science Center at Houston |