
|
|||||
|
 | |
| |
| |
| |
| |
| |
|
Gene: CD63 |
Gene summary for CD63 |
| Gene information | Species | Human | Gene symbol | CD63 | Gene ID | 967 |
| Gene name | CD63 molecule | |
| Gene Alias | LAMP-3 | |
| Cytomap | 12q13.2 | |
| Gene Type | protein-coding | GO ID | GO:0002090 | UniProtAcc | A0A024RB05 |
Top |
Malignant transformation analysis |
| Identification of the aberrant gene expression in precancerous and cancerous lesions by comparing the gene expression of stem-like cells in diseased tissues with normal stem cells |
| Entrez ID | Symbol | Replicates | Species | Organ | Tissue | Adj P-value | Log2FC | Malignancy |
| 967 | CD63 | HCC1_Meng | Human | Liver | HCC | 3.41e-36 | 1.73e-01 | 0.0246 |
| 967 | CD63 | HCC2_Meng | Human | Liver | HCC | 1.07e-15 | 2.14e-01 | 0.0107 |
| 967 | CD63 | cirrhotic1 | Human | Liver | Cirrhotic | 4.33e-33 | 4.42e-01 | 0.0202 |
| 967 | CD63 | cirrhotic2 | Human | Liver | Cirrhotic | 2.80e-34 | 3.71e-01 | 0.0201 |
| 967 | CD63 | cirrhotic3 | Human | Liver | Cirrhotic | 1.02e-32 | 5.49e-01 | 0.0215 |
| 967 | CD63 | HCC1 | Human | Liver | HCC | 5.00e-15 | 5.41e+00 | 0.5336 |
| 967 | CD63 | HCC2 | Human | Liver | HCC | 2.31e-24 | 7.35e+00 | 0.5341 |
| 967 | CD63 | HCC5 | Human | Liver | HCC | 4.55e-10 | 2.59e+00 | 0.4932 |
| 967 | CD63 | Pt13.a | Human | Liver | HCC | 2.05e-12 | 2.21e-01 | 0.021 |
| 967 | CD63 | Pt13.b | Human | Liver | HCC | 1.13e-31 | 2.93e-01 | 0.0251 |
| 967 | CD63 | Pt14.a | Human | Liver | HCC | 1.37e-09 | -1.99e-01 | 0.0169 |
| 967 | CD63 | Pt14.b | Human | Liver | HCC | 1.59e-09 | 6.39e-02 | 0.018 |
| 967 | CD63 | Pt14.d | Human | Liver | HCC | 1.67e-11 | 1.74e-01 | 0.0143 |
| 967 | CD63 | S014 | Human | Liver | HCC | 1.20e-22 | 2.29e+00 | 0.2254 |
| 967 | CD63 | S015 | Human | Liver | HCC | 7.36e-30 | 3.22e+00 | 0.2375 |
| 967 | CD63 | S016 | Human | Liver | HCC | 1.06e-25 | 2.73e+00 | 0.2243 |
| 967 | CD63 | S027 | Human | Liver | HCC | 1.31e-29 | 3.54e+00 | 0.2446 |
| 967 | CD63 | S028 | Human | Liver | HCC | 5.28e-40 | 3.26e+00 | 0.2503 |
| 967 | CD63 | S029 | Human | Liver | HCC | 1.85e-37 | 3.71e+00 | 0.2581 |
| 967 | CD63 | TD9 | Human | Lung | IAC | 2.59e-12 | -3.68e-01 | 0.088 |
| Page: 1 2 3 4 5 6 7 8 9 10 11 12 13 14 15 16 17 |
| Tissue | Expression Dynamics | Abbreviation |
| Breast |  | IDC: Invasive ductal carcinoma |
| DCIS: Ductal carcinoma in situ | ||
| Precancer(BRCA1-mut): Precancerous lesion from BRCA1 mutation carriers | ||
| Cervix |  | CC: Cervix cancer |
| HSIL_HPV: HPV-infected high-grade squamous intraepithelial lesions | ||
| N_HPV: HPV-infected normal cervix | ||
| Colorectum (GSE201348) |  | FAP: Familial adenomatous polyposis |
| CRC: Colorectal cancer | ||
| Colorectum (HTA11) | 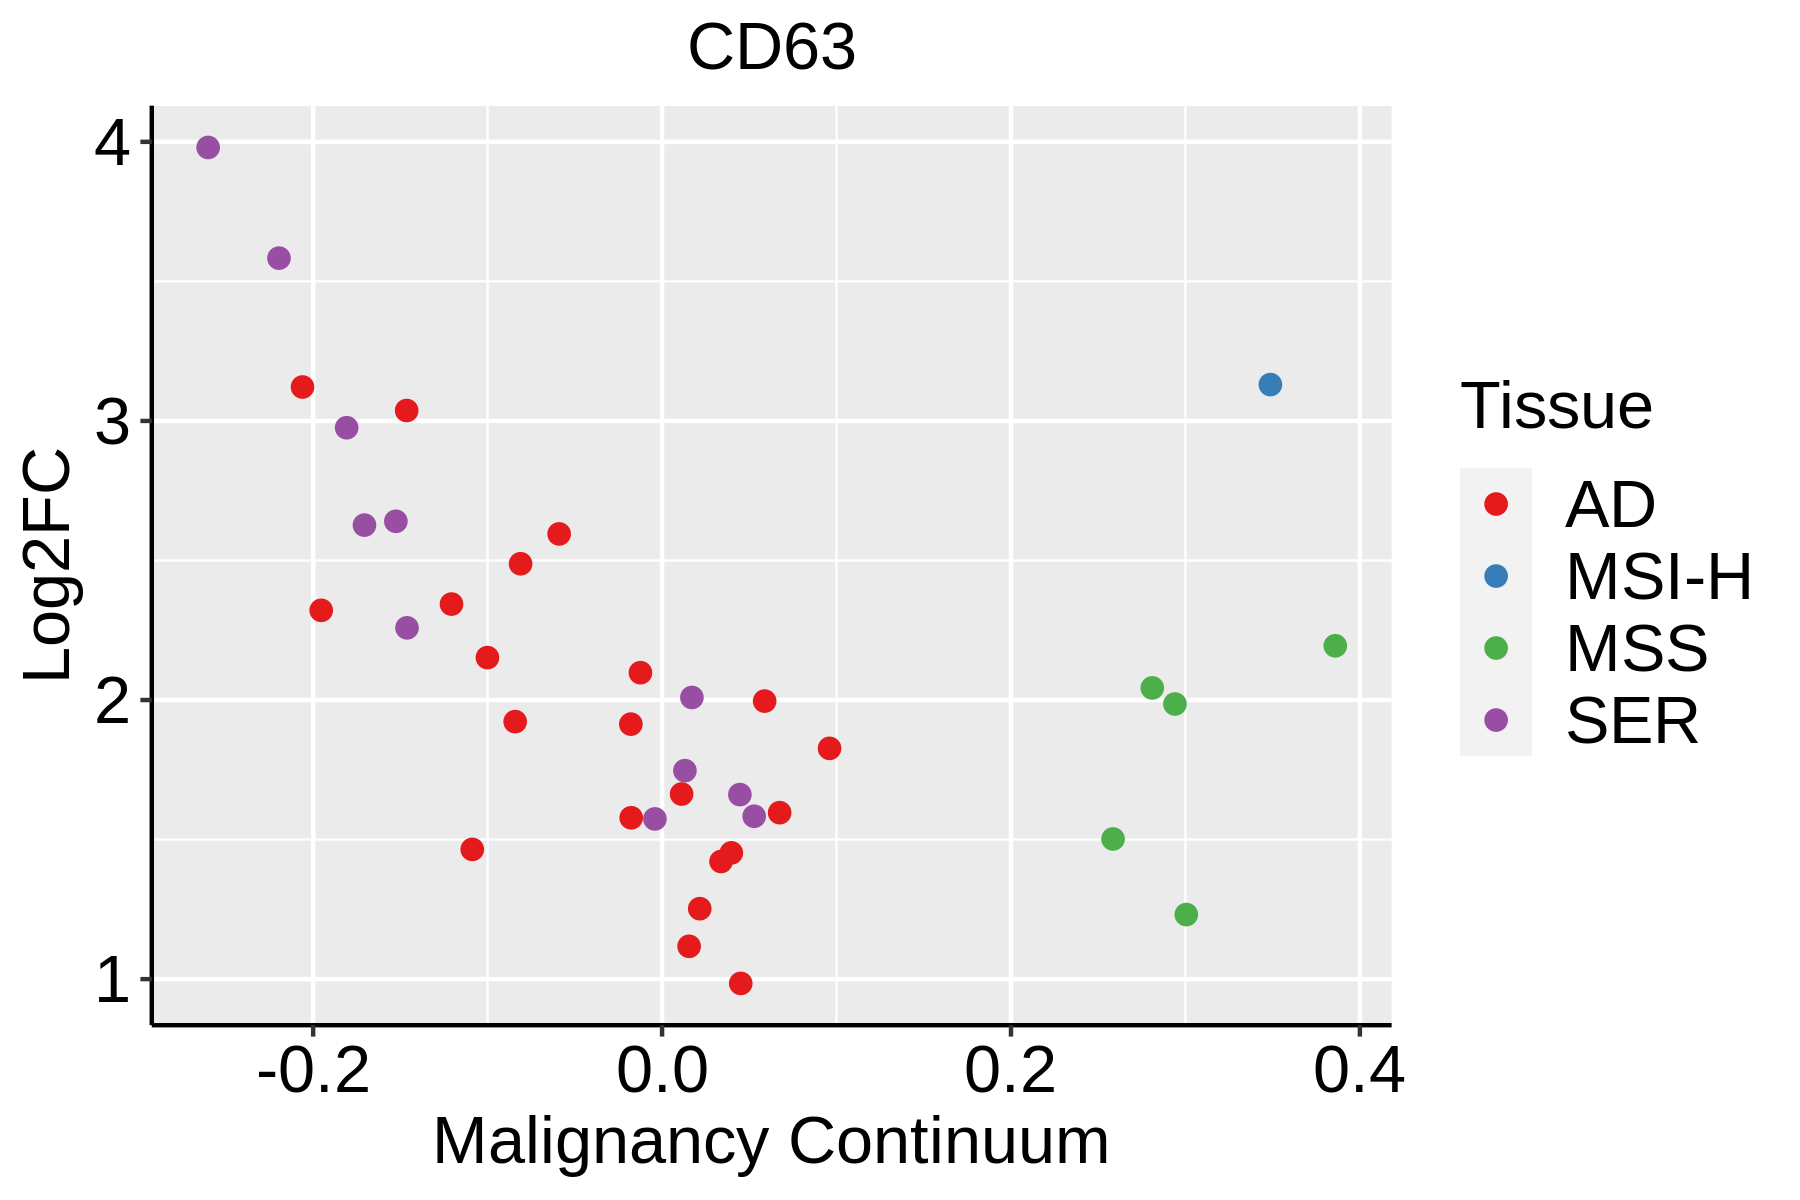 | AD: Adenomas |
| SER: Sessile serrated lesions | ||
| MSI-H: Microsatellite-high colorectal cancer | ||
| MSS: Microsatellite stable colorectal cancer | ||
| Endometrium | 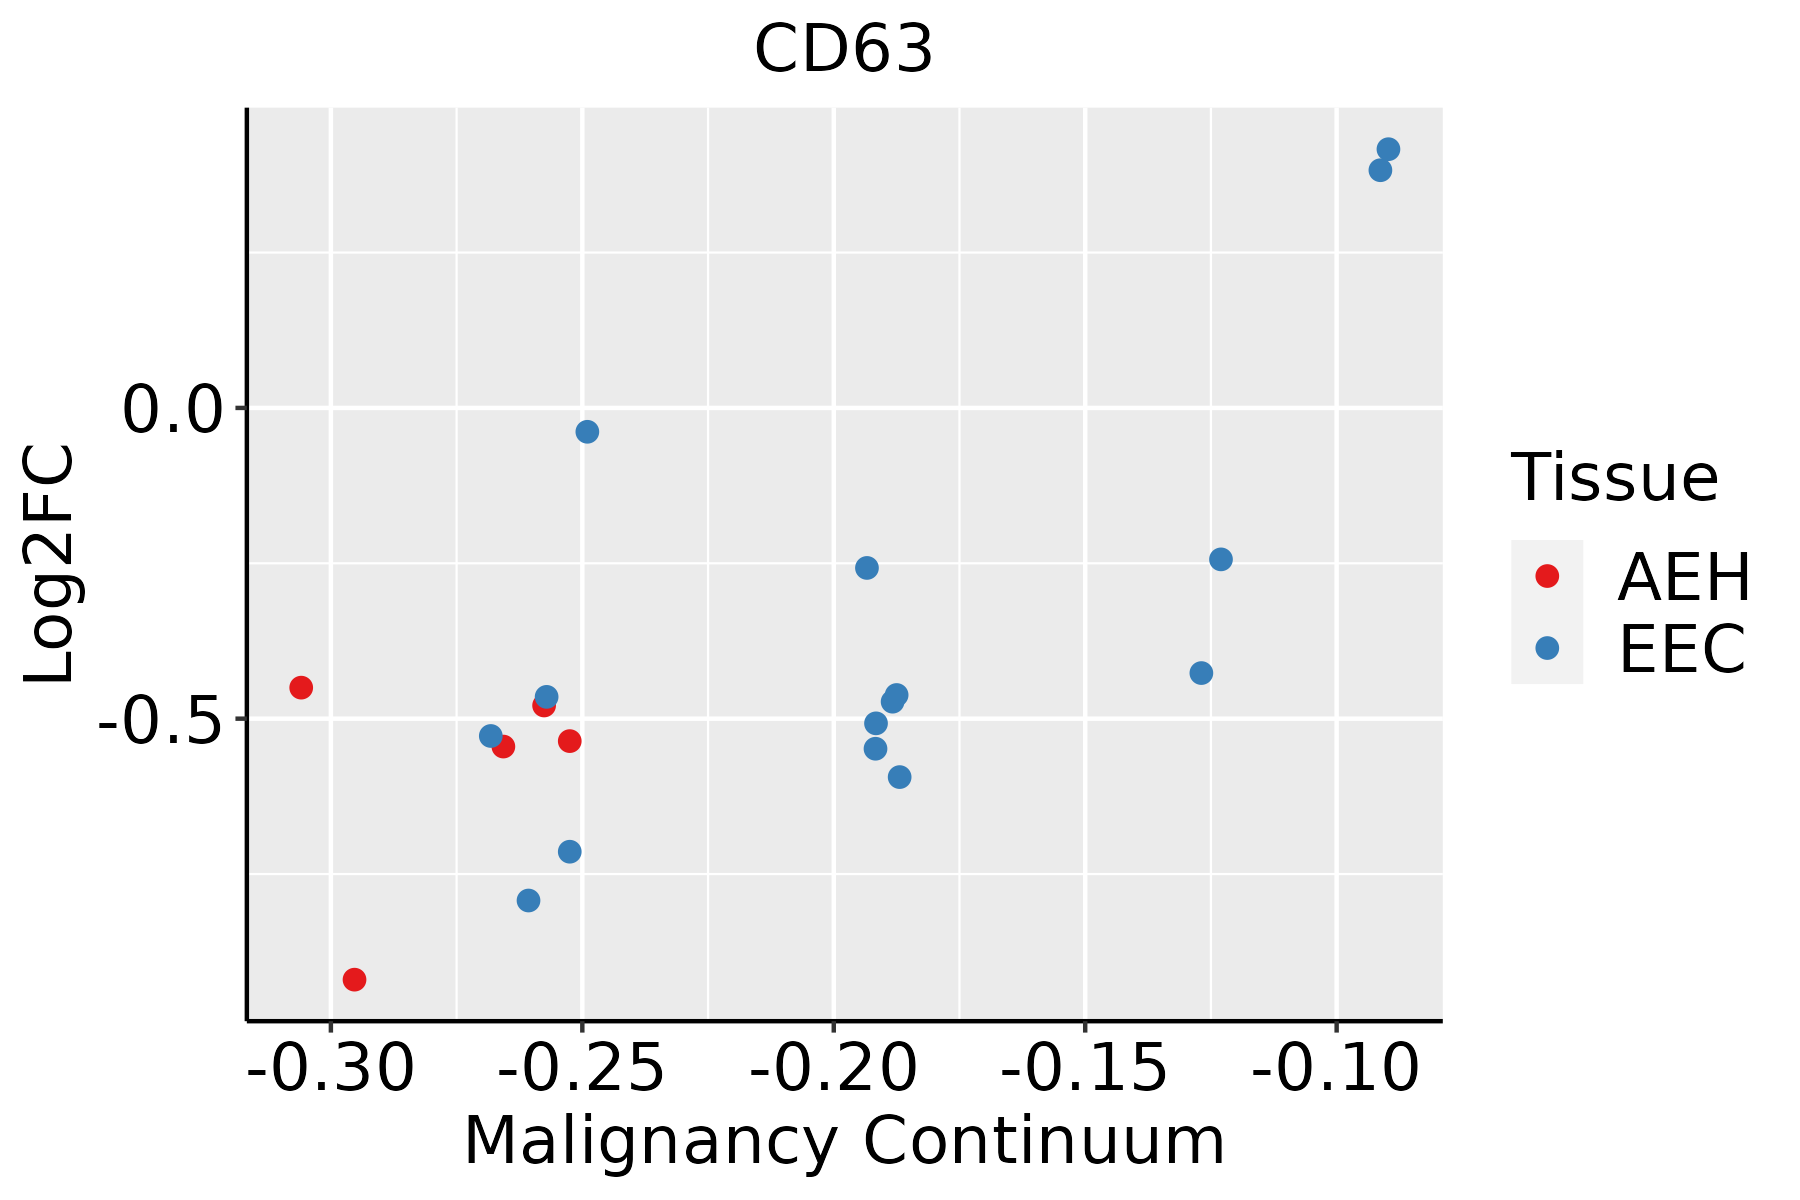 | AEH: Atypical endometrial hyperplasia |
| EEC: Endometrioid Cancer | ||
| Esophagus | 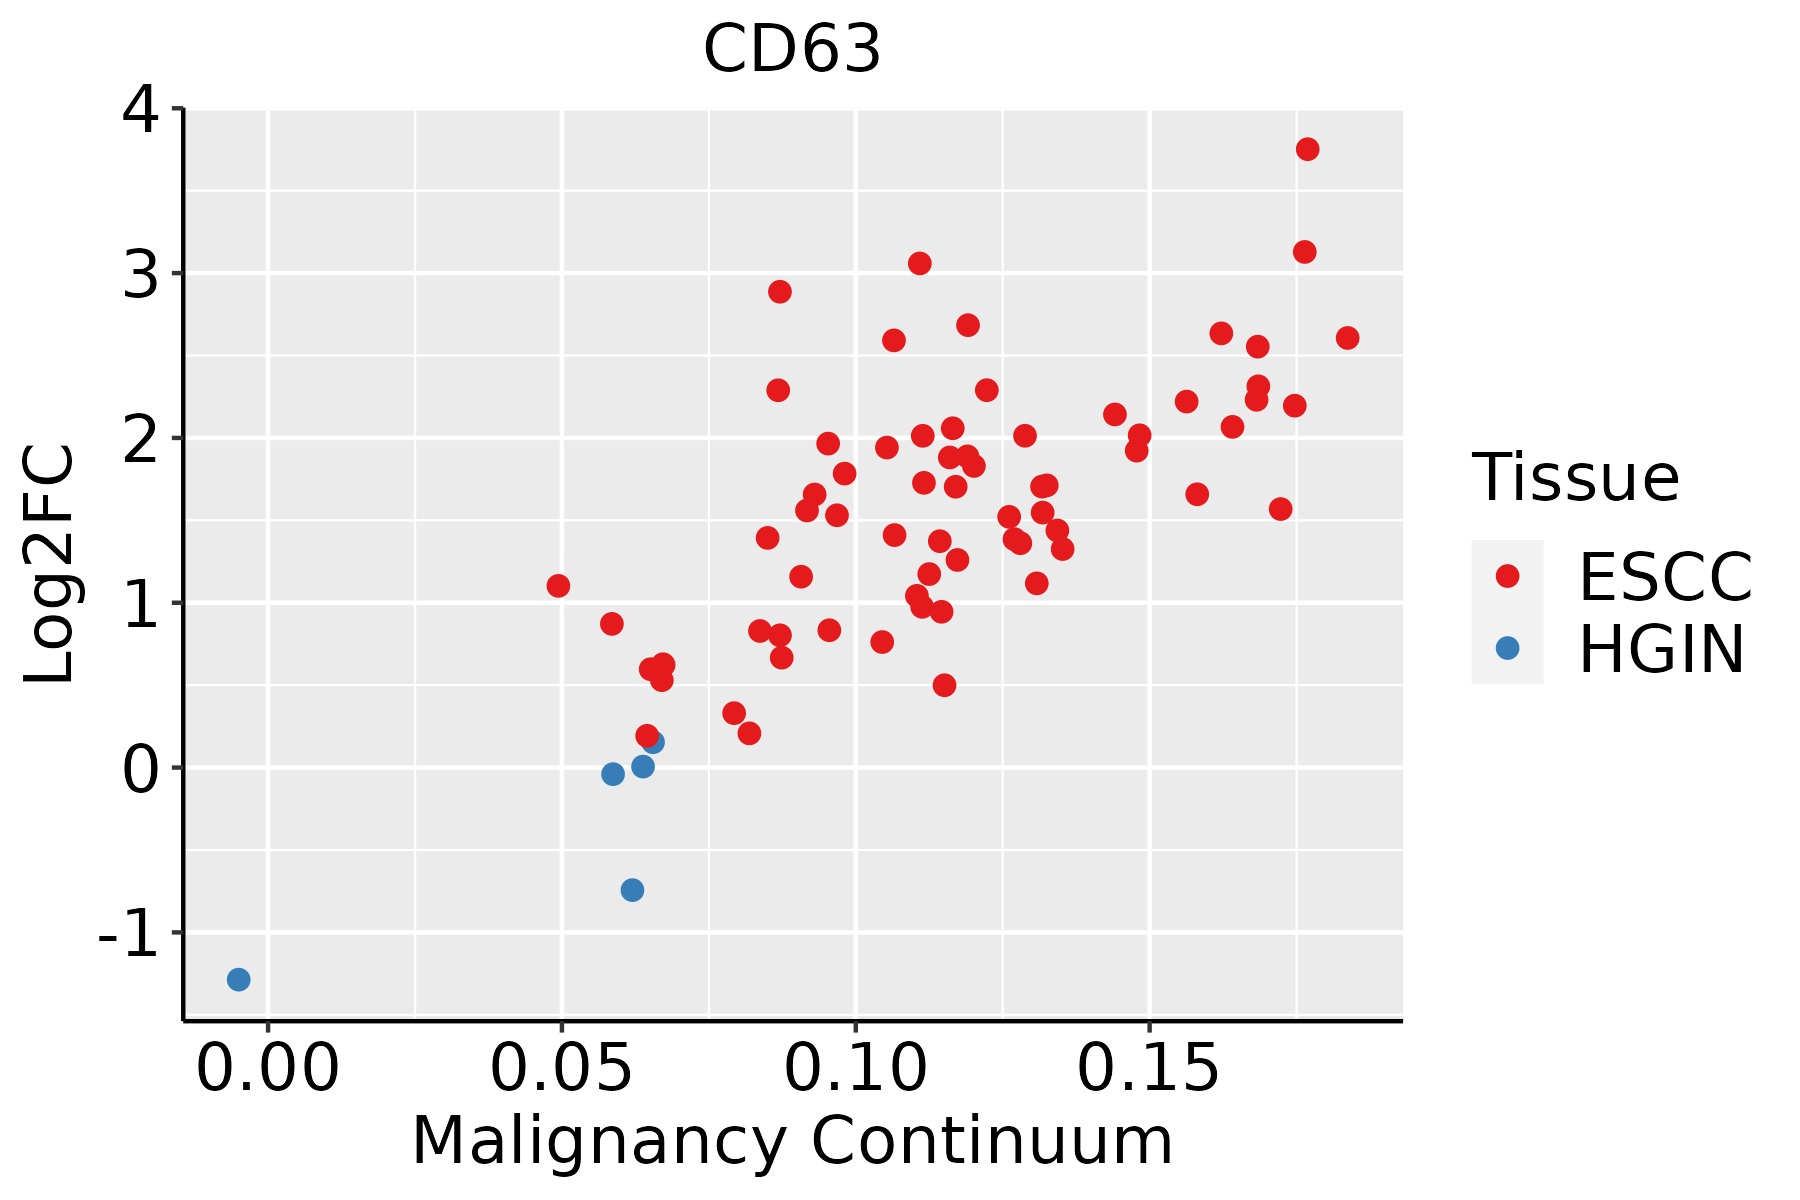 | ESCC: Esophageal squamous cell carcinoma |
| HGIN: High-grade intraepithelial neoplasias | ||
| LGIN: Low-grade intraepithelial neoplasias | ||
| Liver | 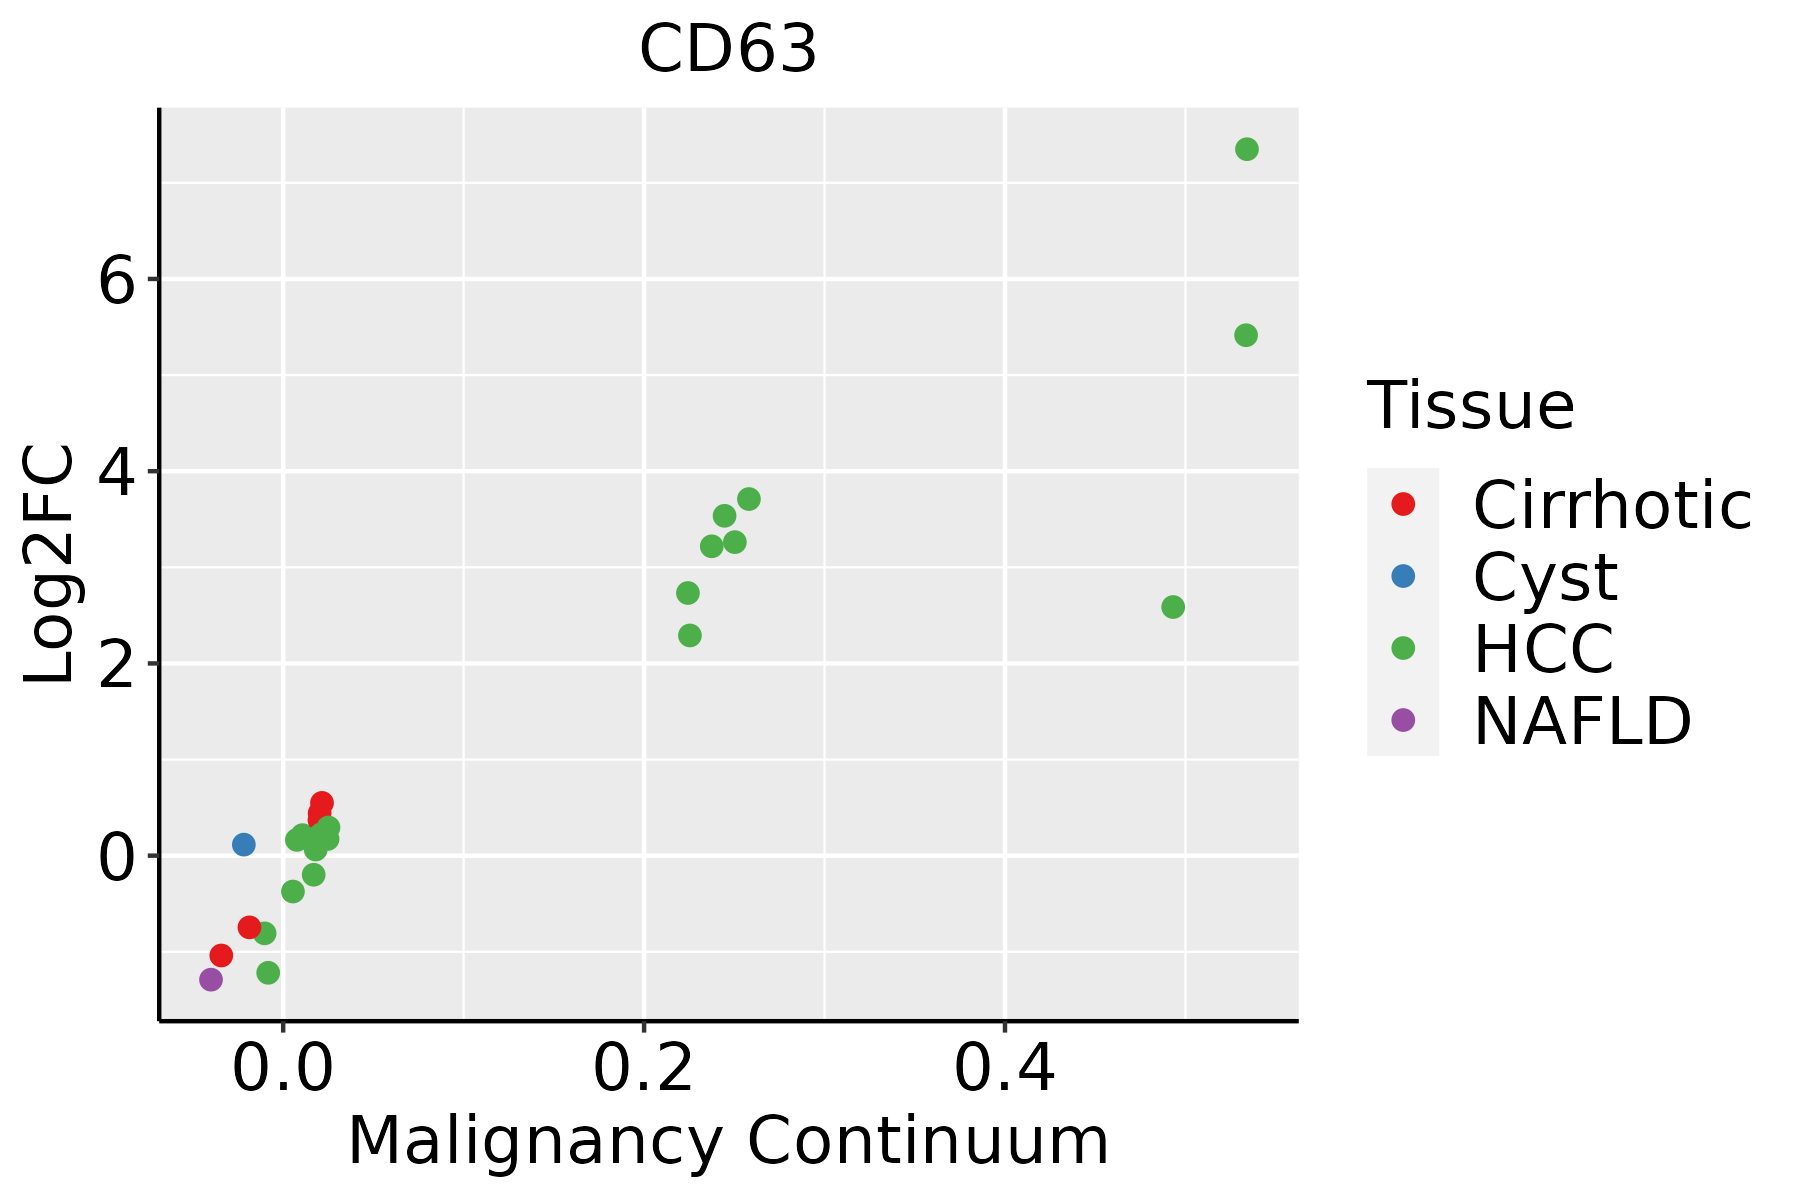 | HCC: Hepatocellular carcinoma |
| NAFLD: Non-alcoholic fatty liver disease | ||
| Lung | 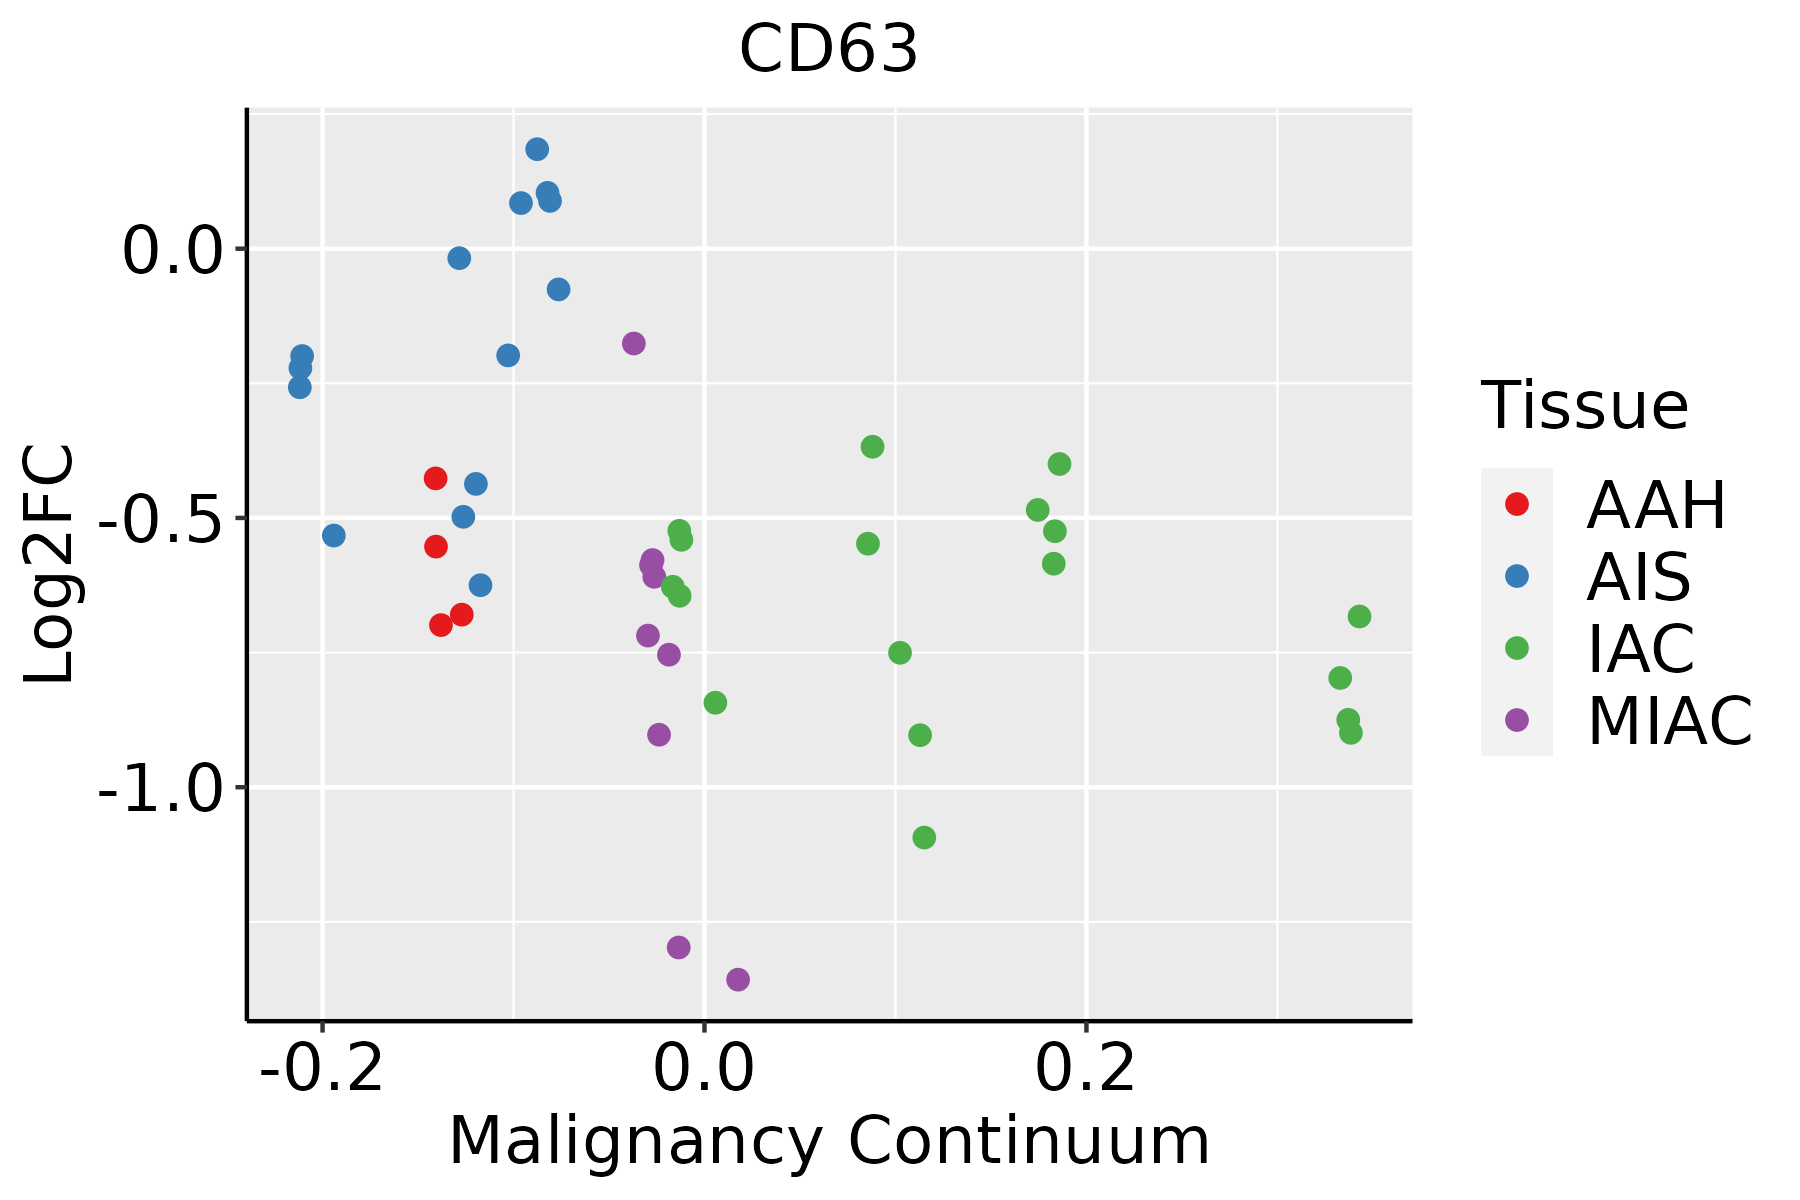 | AAH: Atypical adenomatous hyperplasia |
| AIS: Adenocarcinoma in situ | ||
| IAC: Invasive lung adenocarcinoma | ||
| MIA: Minimally invasive adenocarcinoma | ||
| Oral Cavity | 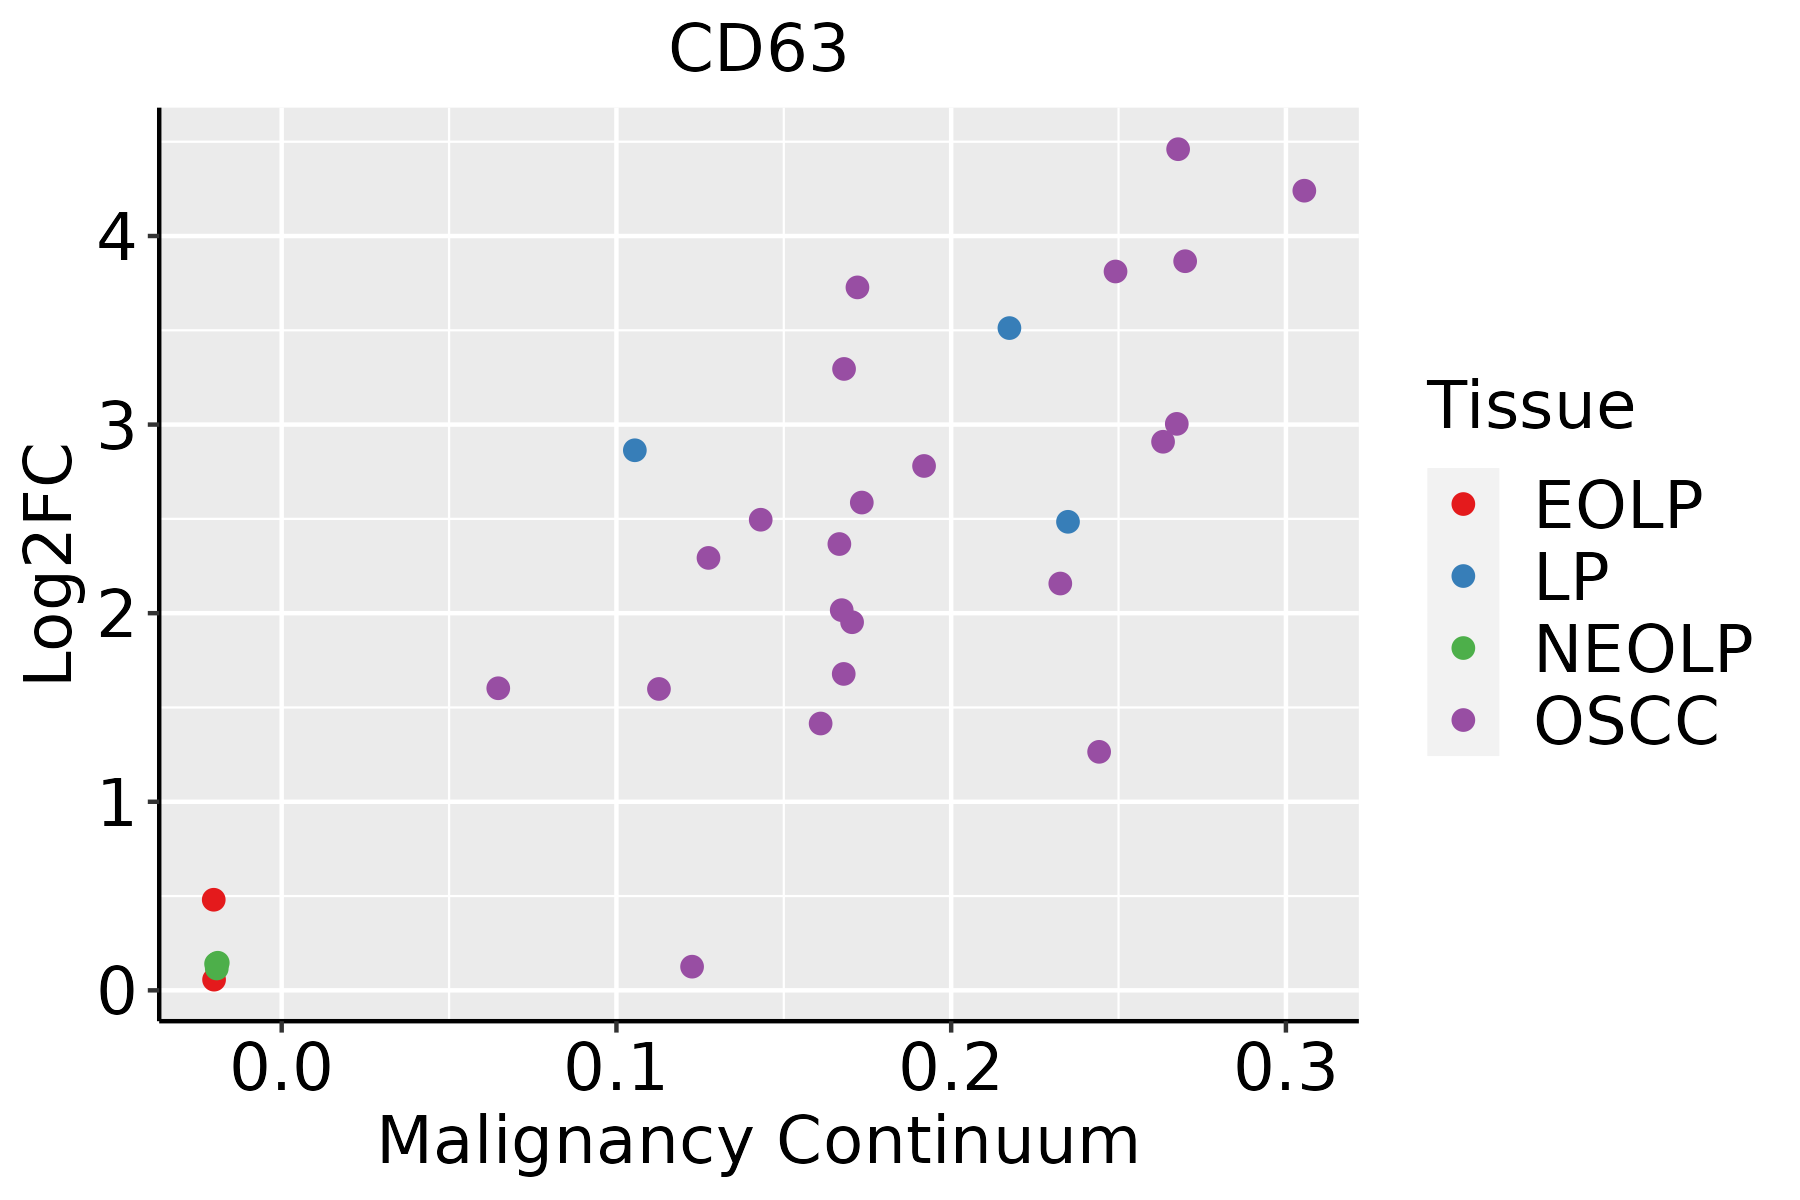 | EOLP: Erosive Oral lichen planus |
| LP: leukoplakia | ||
| NEOLP: Non-erosive oral lichen planus | ||
| OSCC: Oral squamous cell carcinoma | ||
| Prostate | 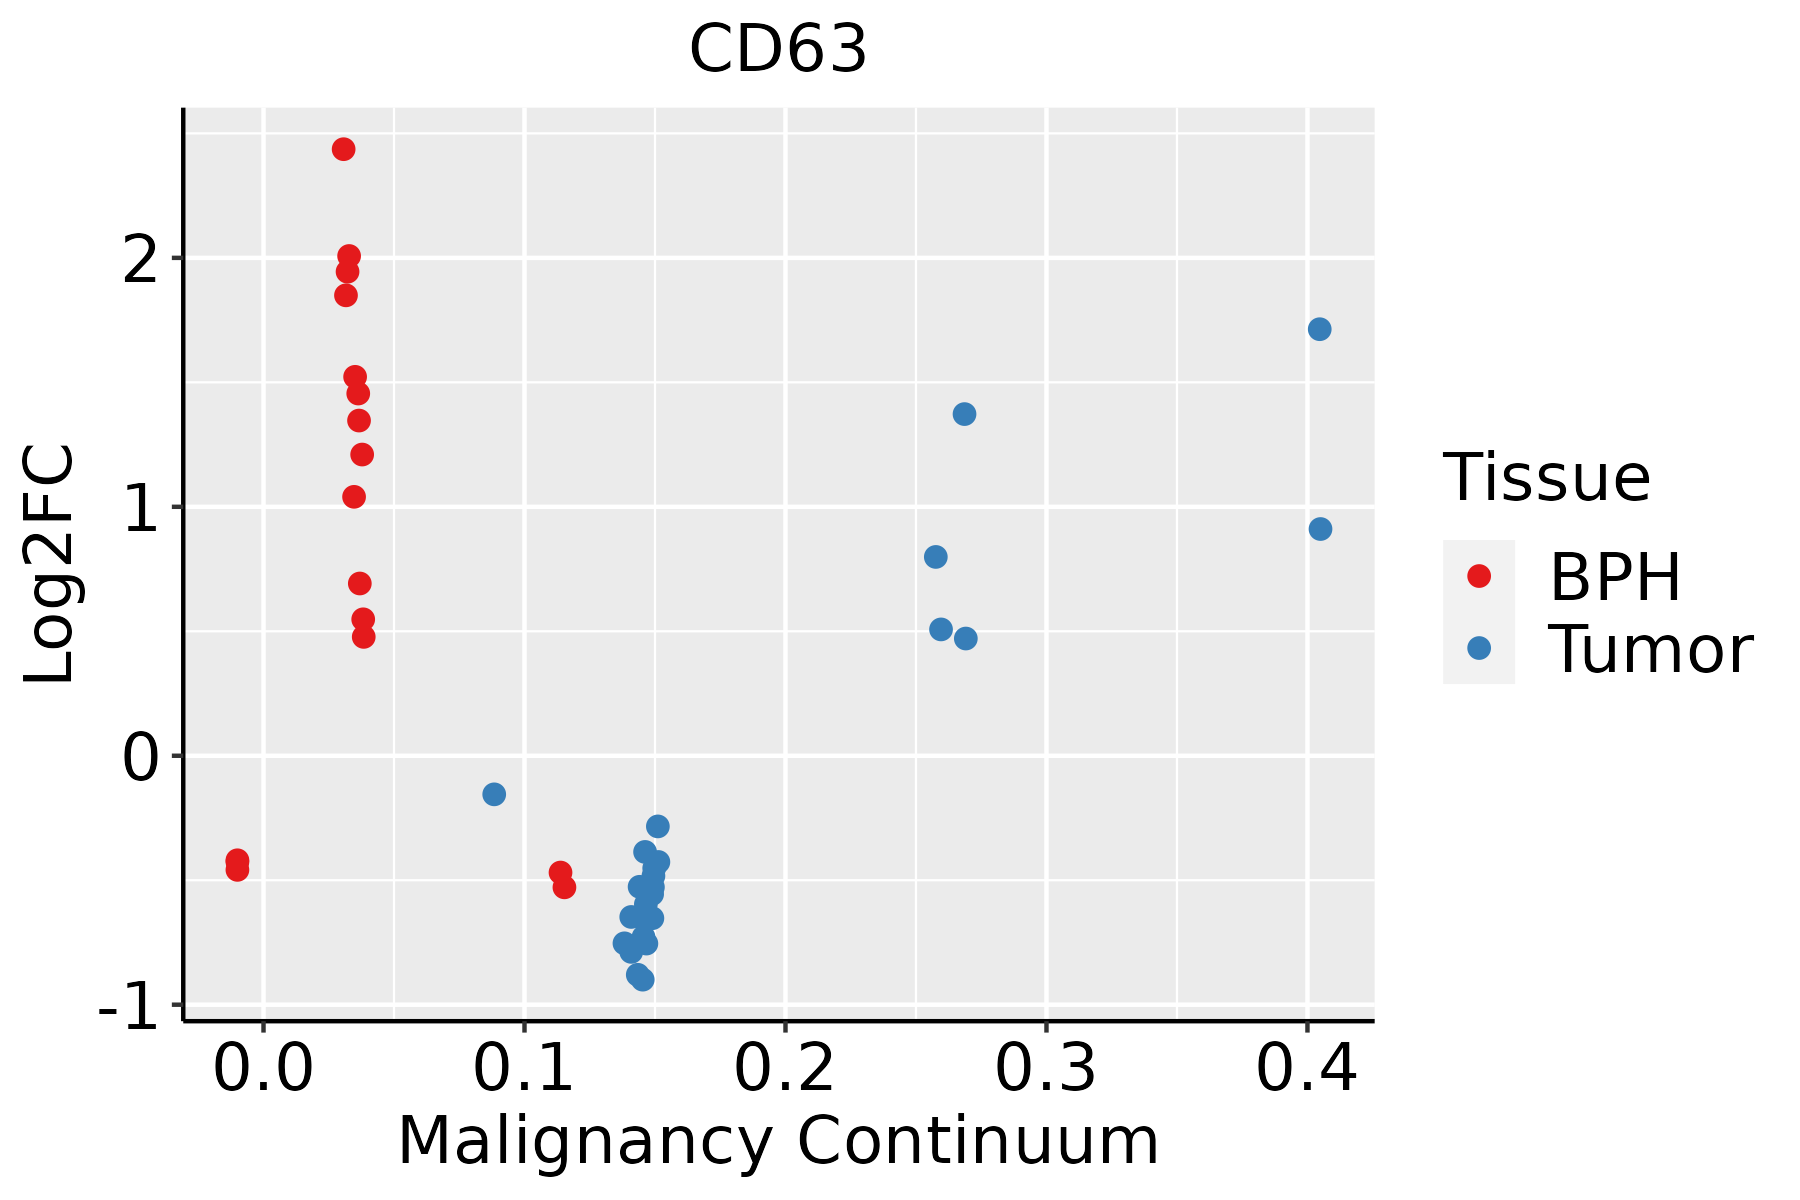 | BPH: Benign Prostatic Hyperplasia |
| Skin | 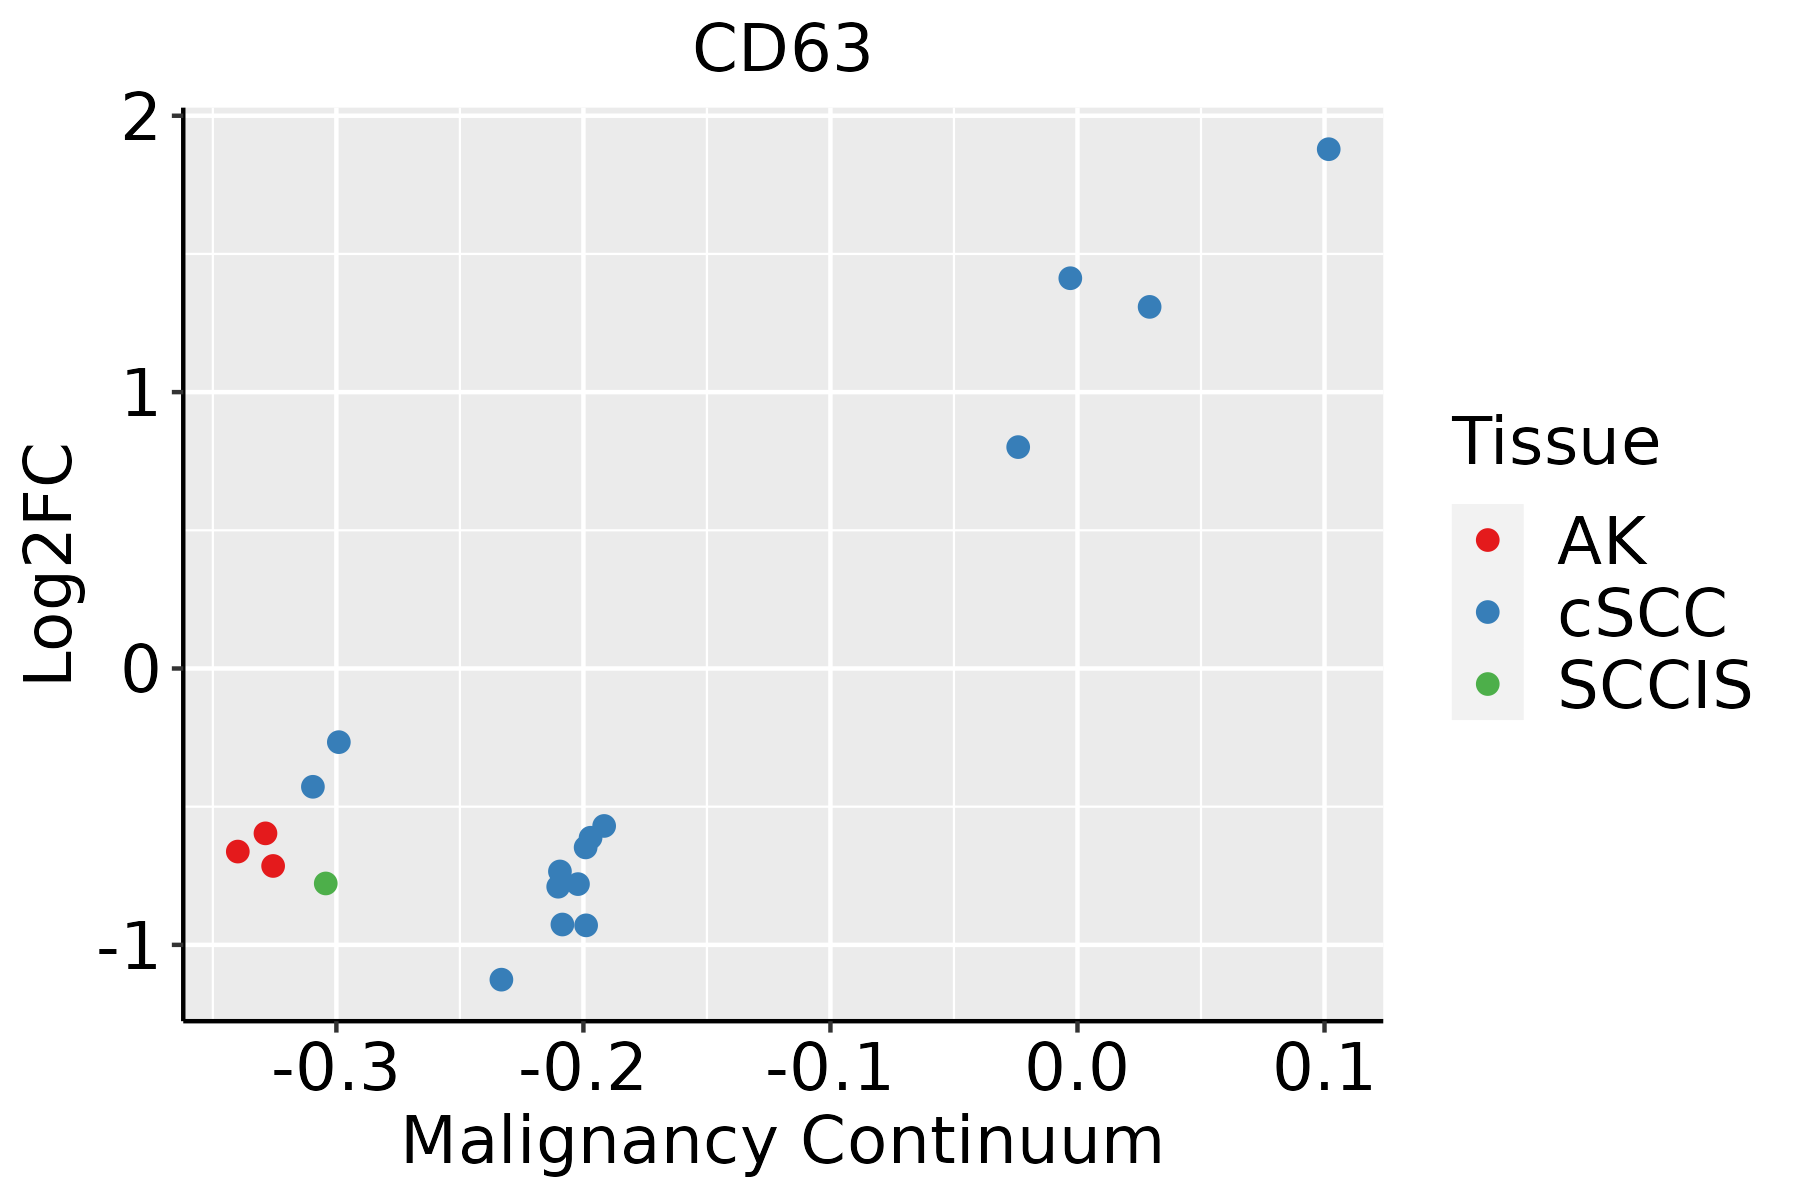 | AK: Actinic keratosis |
| cSCC: Cutaneous squamous cell carcinoma | ||
| SCCIS:squamous cell carcinoma in situ | ||
| Thyroid | 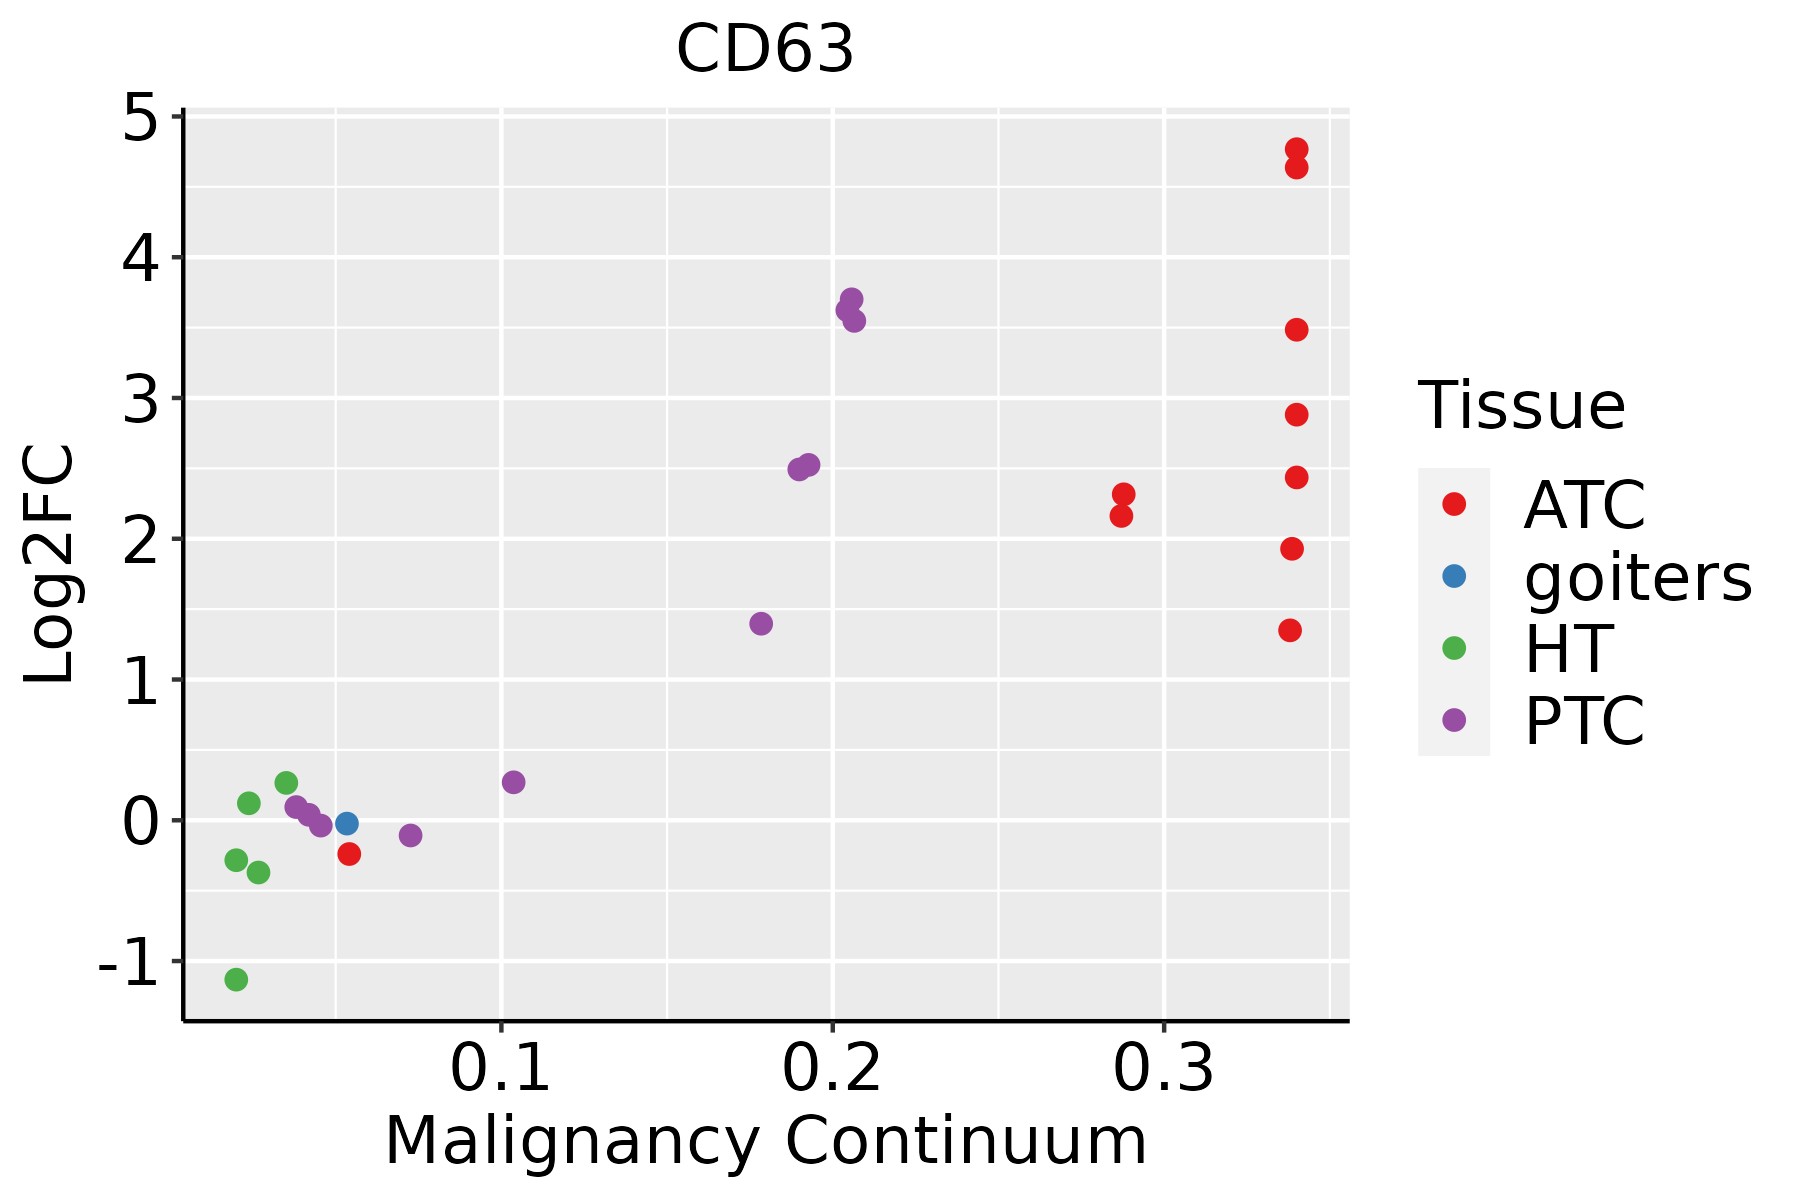 | ATC: Anaplastic thyroid cancer |
| HT: Hashimoto's thyroiditis | ||
| PTC: Papillary thyroid cancer |
| ∗log2FC in expression of this searched gene in stem-like cells from each diseased tissue sample relative to stem-like cells in normal samples in each tissue plotted against the malignancy continuum. Samples are colored based on if they are from different disease stage. |
Top |
Malignant transformation related pathway analysis |
| Find out the enriched GO biological processes and KEGG pathways involved in transition from healthy to precancer to cancer |
| Tissue | Disease Stage | Enriched GO biological Processes |
| Colorectum | AD |  |
| Colorectum | SER |  |
| Colorectum | MSS |  |
| Colorectum | MSI-H |  |
| Colorectum | FAP |  |
| ∗Top 15 enriched GO BP terms are showed in the bar plot of each disease state in each tissue. Each row represents a significant GO biological process which is colored according to the -log10(p.adjust). |
| Page: 1 2 3 4 5 6 7 8 9 |
| GO ID | Tissue | Disease Stage | Description | Gene Ratio | Bg Ratio | pvalue | p.adjust | Count |
| GO:00068986 | Breast | Precancer | receptor-mediated endocytosis | 27/1080 | 244/18723 | 9.01e-04 | 1.03e-02 | 27 |
| GO:00458076 | Breast | Precancer | positive regulation of endocytosis | 14/1080 | 100/18723 | 1.77e-03 | 1.74e-02 | 14 |
| GO:00316235 | Breast | Precancer | receptor internalization | 15/1080 | 113/18723 | 2.11e-03 | 2.00e-02 | 15 |
| GO:00482606 | Breast | Precancer | positive regulation of receptor-mediated endocytosis | 9/1080 | 52/18723 | 2.67e-03 | 2.36e-02 | 9 |
| GO:00109596 | Breast | Precancer | regulation of metal ion transport | 37/1080 | 406/18723 | 4.07e-03 | 3.22e-02 | 37 |
| GO:001095913 | Breast | IDC | regulation of metal ion transport | 52/1434 | 406/18723 | 1.76e-04 | 2.97e-03 | 52 |
| GO:000689813 | Breast | IDC | receptor-mediated endocytosis | 35/1434 | 244/18723 | 2.38e-04 | 3.75e-03 | 35 |
| GO:004580713 | Breast | IDC | positive regulation of endocytosis | 18/1434 | 100/18723 | 5.40e-04 | 6.96e-03 | 18 |
| GO:003162311 | Breast | IDC | receptor internalization | 19/1434 | 113/18723 | 9.17e-04 | 1.05e-02 | 19 |
| GO:00431126 | Breast | IDC | receptor metabolic process | 23/1434 | 166/18723 | 4.04e-03 | 3.25e-02 | 23 |
| GO:004826013 | Breast | IDC | positive regulation of receptor-mediated endocytosis | 10/1434 | 52/18723 | 5.49e-03 | 4.03e-02 | 10 |
| GO:00301007 | Breast | IDC | regulation of endocytosis | 27/1434 | 211/18723 | 5.92e-03 | 4.26e-02 | 27 |
| GO:000689823 | Breast | DCIS | receptor-mediated endocytosis | 35/1390 | 244/18723 | 1.31e-04 | 2.25e-03 | 35 |
| GO:001095921 | Breast | DCIS | regulation of metal ion transport | 50/1390 | 406/18723 | 2.86e-04 | 4.22e-03 | 50 |
| GO:003162321 | Breast | DCIS | receptor internalization | 19/1390 | 113/18723 | 6.30e-04 | 7.90e-03 | 19 |
| GO:004580722 | Breast | DCIS | positive regulation of endocytosis | 17/1390 | 100/18723 | 1.05e-03 | 1.15e-02 | 17 |
| GO:004311213 | Breast | DCIS | receptor metabolic process | 23/1390 | 166/18723 | 2.75e-03 | 2.41e-02 | 23 |
| GO:004826021 | Breast | DCIS | positive regulation of receptor-mediated endocytosis | 10/1390 | 52/18723 | 4.41e-03 | 3.41e-02 | 10 |
| GO:00482596 | Breast | DCIS | regulation of receptor-mediated endocytosis | 16/1390 | 110/18723 | 7.16e-03 | 4.85e-02 | 16 |
| GO:00315898 | Cervix | CC | cell-substrate adhesion | 96/2311 | 363/18723 | 1.48e-13 | 8.85e-11 | 96 |
| Page: 1 2 3 4 5 6 7 8 9 10 11 12 13 14 15 |
| Pathway ID | Tissue | Disease Stage | Description | Gene Ratio | Bg Ratio | pvalue | p.adjust | qvalue | Count |
| hsa0520514 | Breast | Precancer | Proteoglycans in cancer | 30/684 | 205/8465 | 1.00e-03 | 7.18e-03 | 5.50e-03 | 30 |
| hsa0520515 | Breast | Precancer | Proteoglycans in cancer | 30/684 | 205/8465 | 1.00e-03 | 7.18e-03 | 5.50e-03 | 30 |
| hsa0520523 | Breast | IDC | Proteoglycans in cancer | 42/867 | 205/8465 | 7.69e-06 | 9.99e-05 | 7.48e-05 | 42 |
| hsa0520533 | Breast | IDC | Proteoglycans in cancer | 42/867 | 205/8465 | 7.69e-06 | 9.99e-05 | 7.48e-05 | 42 |
| hsa0520542 | Breast | DCIS | Proteoglycans in cancer | 39/846 | 205/8465 | 5.36e-05 | 5.58e-04 | 4.11e-04 | 39 |
| hsa0520552 | Breast | DCIS | Proteoglycans in cancer | 39/846 | 205/8465 | 5.36e-05 | 5.58e-04 | 4.11e-04 | 39 |
| hsa0520516 | Cervix | CC | Proteoglycans in cancer | 60/1267 | 205/8465 | 9.13e-08 | 1.18e-06 | 7.00e-07 | 60 |
| hsa0520517 | Cervix | CC | Proteoglycans in cancer | 60/1267 | 205/8465 | 9.13e-08 | 1.18e-06 | 7.00e-07 | 60 |
| hsa05205 | Colorectum | AD | Proteoglycans in cancer | 70/2092 | 205/8465 | 1.37e-03 | 8.46e-03 | 5.39e-03 | 70 |
| hsa052051 | Colorectum | AD | Proteoglycans in cancer | 70/2092 | 205/8465 | 1.37e-03 | 8.46e-03 | 5.39e-03 | 70 |
| hsa052052 | Colorectum | SER | Proteoglycans in cancer | 58/1580 | 205/8465 | 4.37e-04 | 3.82e-03 | 2.77e-03 | 58 |
| hsa04142 | Colorectum | SER | Lysosome | 38/1580 | 132/8465 | 2.87e-03 | 2.03e-02 | 1.47e-02 | 38 |
| hsa052053 | Colorectum | SER | Proteoglycans in cancer | 58/1580 | 205/8465 | 4.37e-04 | 3.82e-03 | 2.77e-03 | 58 |
| hsa041421 | Colorectum | SER | Lysosome | 38/1580 | 132/8465 | 2.87e-03 | 2.03e-02 | 1.47e-02 | 38 |
| hsa052054 | Colorectum | MSS | Proteoglycans in cancer | 65/1875 | 205/8465 | 8.66e-04 | 5.38e-03 | 3.29e-03 | 65 |
| hsa052055 | Colorectum | MSS | Proteoglycans in cancer | 65/1875 | 205/8465 | 8.66e-04 | 5.38e-03 | 3.29e-03 | 65 |
| hsa052056 | Colorectum | FAP | Proteoglycans in cancer | 57/1404 | 205/8465 | 3.05e-05 | 3.29e-04 | 2.00e-04 | 57 |
| hsa052057 | Colorectum | FAP | Proteoglycans in cancer | 57/1404 | 205/8465 | 3.05e-05 | 3.29e-04 | 2.00e-04 | 57 |
| hsa0520518 | Endometrium | AEH | Proteoglycans in cancer | 53/1197 | 205/8465 | 5.43e-06 | 6.53e-05 | 4.78e-05 | 53 |
| hsa0520519 | Endometrium | AEH | Proteoglycans in cancer | 53/1197 | 205/8465 | 5.43e-06 | 6.53e-05 | 4.78e-05 | 53 |
| Page: 1 2 3 |
Top |
Cell-cell communication analysis |
| Identification of potential cell-cell interactions between two cell types and their ligand-receptor pairs for different disease states |
| Ligand | Receptor | LRpair | Pathway | Tissue | Disease Stage |
| Page: 1 |
Top |
Single-cell gene regulatory network inference analysis |
| Find out the significant the regulons (TFs) and the target genes of each regulon across cell types for different disease states |
| TF | Cell Type | Tissue | Disease Stage | Target Gene | RSS | Regulon Activity |
| ∗The dot plots of a searched regulon are shown for all cell subpopulations in each disease state of each tissue based on the regulon specific score inferred using pySCENIC and by calculating the average expression. |
| Page: 1 |
Top |
Somatic mutation of malignant transformation related genes |
| Annotation of somatic variants for genes involved in malignant transformation |
| Hugo Symbol | Variant Class | Variant Classification | dbSNP RS | HGVSc | HGVSp | HGVSp Short | SWISSPROT | BIOTYPE | SIFT | PolyPhen | Tumor Sample Barcode | Tissue | Histology | Sex | Age | Stage | Therapy Types | Drugs | Outcome |
| CD63 | SNV | Missense_Mutation | rs11574657 | c.482N>T | p.Ser161Leu | p.S161L | P08962 | protein_coding | tolerated(0.22) | benign(0.013) | TCGA-AC-A23H-01 | Breast | breast invasive carcinoma | Female | >=65 | I/II | Unknown | Unknown | PD |
| CD63 | SNV | Missense_Mutation | novel | c.635N>T | p.Gly212Val | p.G212V | P08962 | protein_coding | tolerated(0.3) | benign(0.393) | TCGA-AN-A046-01 | Breast | breast invasive carcinoma | Female | >=65 | I/II | Unknown | Unknown | SD |
| CD63 | SNV | Missense_Mutation | c.486G>T | p.Lys162Asn | p.K162N | P08962 | protein_coding | tolerated(0.16) | benign(0.007) | TCGA-FU-A3HZ-01 | Cervix | cervical & endocervical cancer | Female | <65 | I/II | Chemotherapy | cisplatin | CR | |
| CD63 | SNV | Missense_Mutation | novel | c.468N>C | p.Lys156Asn | p.K156N | P08962 | protein_coding | tolerated(1) | benign(0.001) | TCGA-AA-3984-01 | Colorectum | colon adenocarcinoma | Female | <65 | I/II | Unknown | Unknown | SD |
| CD63 | SNV | Missense_Mutation | c.457N>T | p.Asp153Tyr | p.D153Y | P08962 | protein_coding | deleterious(0) | probably_damaging(0.998) | TCGA-AA-A010-01 | Colorectum | colon adenocarcinoma | Female | <65 | I/II | Chemotherapy | folinic | CR | |
| CD63 | SNV | Missense_Mutation | rs11574657 | c.482C>T | p.Ser161Leu | p.S161L | P08962 | protein_coding | tolerated(0.22) | benign(0.013) | TCGA-AA-A02Y-01 | Colorectum | colon adenocarcinoma | Male | >=65 | I/II | Unknown | Unknown | SD |
| CD63 | SNV | Missense_Mutation | rs200393279 | c.358N>T | p.Arg120Trp | p.R120W | P08962 | protein_coding | deleterious(0.05) | possibly_damaging(0.773) | TCGA-AZ-6601-01 | Colorectum | colon adenocarcinoma | Male | >=65 | I/II | Unknown | Unknown | PD |
| CD63 | SNV | Missense_Mutation | novel | c.467N>C | p.Lys156Thr | p.K156T | P08962 | protein_coding | tolerated(0.56) | benign(0.001) | TCGA-AJ-A3EL-01 | Endometrium | uterine corpus endometrioid carcinoma | Female | <65 | I/II | Unknown | Unknown | SD |
| CD63 | SNV | Missense_Mutation | novel | c.206N>C | p.Phe69Ser | p.F69S | P08962 | protein_coding | deleterious(0.01) | possibly_damaging(0.724) | TCGA-AJ-A3EL-01 | Endometrium | uterine corpus endometrioid carcinoma | Female | <65 | I/II | Unknown | Unknown | SD |
| CD63 | SNV | Missense_Mutation | novel | c.58N>A | p.Ala20Thr | p.A20T | P08962 | protein_coding | tolerated(0.23) | benign(0.014) | TCGA-AX-A1CE-01 | Endometrium | uterine corpus endometrioid carcinoma | Female | <65 | I/II | Unspecific | Paclitaxel | SD |
| Page: 1 2 |
Top |
Related drugs of malignant transformation related genes |
| Identification of chemicals and drugs interact with genes involved in malignant transfromation |
| (DGIdb 4.0) |
| Entrez ID | Symbol | Category | Interaction Types | Drug Claim Name | Drug Name | PMIDs |
| 967 | CD63 | CELL SURFACE, DRUGGABLE GENOME, KINASE | NONSTEROIDAL ANTI-INFLAMMATORY DRUGS | 15608437 | ||
| 967 | CD63 | CELL SURFACE, DRUGGABLE GENOME, KINASE | NSAIDS | 15608437 |
| Page: 1 |

Copyright 2023-Present -The University of Texas Health Science Center at Houston |