
|
|||||
|
 | |
| |
| |
| |
| |
| |
|
Gene: BRI3 |
Gene summary for BRI3 |
| Gene information | Species | Human | Gene symbol | BRI3 | Gene ID | 25798 |
| Gene name | brain protein I3 | |
| Gene Alias | I3 | |
| Cytomap | 7q21.3 | |
| Gene Type | protein-coding | GO ID | GO:0000323 | UniProtAcc | F5GXW6 |
Top |
Malignant transformation analysis |
| Identification of the aberrant gene expression in precancerous and cancerous lesions by comparing the gene expression of stem-like cells in diseased tissues with normal stem cells |
| Entrez ID | Symbol | Replicates | Species | Organ | Tissue | Adj P-value | Log2FC | Malignancy |
| 25798 | BRI3 | RNA-P6T2-P6T2-4 | Human | Lung | IAC | 1.41e-15 | -1.62e-01 | -0.0121 |
| 25798 | BRI3 | RNA-P7T1-P7T1-1 | Human | Lung | AIS | 9.70e-07 | -2.36e-01 | -0.0961 |
| 25798 | BRI3 | RNA-P7T1-P7T1-2 | Human | Lung | AIS | 2.21e-06 | -1.79e-01 | -0.0876 |
| 25798 | BRI3 | RNA-P7T1-P7T1-3 | Human | Lung | AIS | 4.00e-06 | -1.49e-01 | -0.0822 |
| 25798 | BRI3 | RNA-P7T1-P7T1-4 | Human | Lung | AIS | 4.62e-07 | -1.78e-01 | -0.0809 |
| 25798 | BRI3 | C04 | Human | Oral cavity | OSCC | 6.21e-21 | 1.38e+00 | 0.2633 |
| 25798 | BRI3 | C21 | Human | Oral cavity | OSCC | 3.64e-34 | 1.71e+00 | 0.2678 |
| 25798 | BRI3 | C30 | Human | Oral cavity | OSCC | 9.84e-45 | 2.10e+00 | 0.3055 |
| 25798 | BRI3 | C38 | Human | Oral cavity | OSCC | 4.37e-10 | 1.59e+00 | 0.172 |
| 25798 | BRI3 | C43 | Human | Oral cavity | OSCC | 3.87e-15 | 4.73e-01 | 0.1704 |
| 25798 | BRI3 | C46 | Human | Oral cavity | OSCC | 7.52e-08 | 6.25e-01 | 0.1673 |
| 25798 | BRI3 | C51 | Human | Oral cavity | OSCC | 3.60e-18 | 1.29e+00 | 0.2674 |
| 25798 | BRI3 | C57 | Human | Oral cavity | OSCC | 2.74e-06 | 7.73e-01 | 0.1679 |
| 25798 | BRI3 | C06 | Human | Oral cavity | OSCC | 8.90e-09 | 1.43e+00 | 0.2699 |
| 25798 | BRI3 | C07 | Human | Oral cavity | OSCC | 1.98e-15 | 1.73e+00 | 0.2491 |
| 25798 | BRI3 | C08 | Human | Oral cavity | OSCC | 6.64e-83 | 2.01e+00 | 0.1919 |
| 25798 | BRI3 | C09 | Human | Oral cavity | OSCC | 8.39e-04 | 6.22e-01 | 0.1431 |
| 25798 | BRI3 | LN22 | Human | Oral cavity | OSCC | 2.58e-02 | 9.49e-01 | 0.1733 |
| 25798 | BRI3 | LN38 | Human | Oral cavity | OSCC | 3.09e-05 | 1.26e+00 | 0.168 |
| 25798 | BRI3 | LN46 | Human | Oral cavity | OSCC | 3.67e-12 | 1.14e+00 | 0.1666 |
| Page: 1 2 3 4 5 6 7 8 9 10 11 12 13 14 |
| Tissue | Expression Dynamics | Abbreviation |
| Breast | 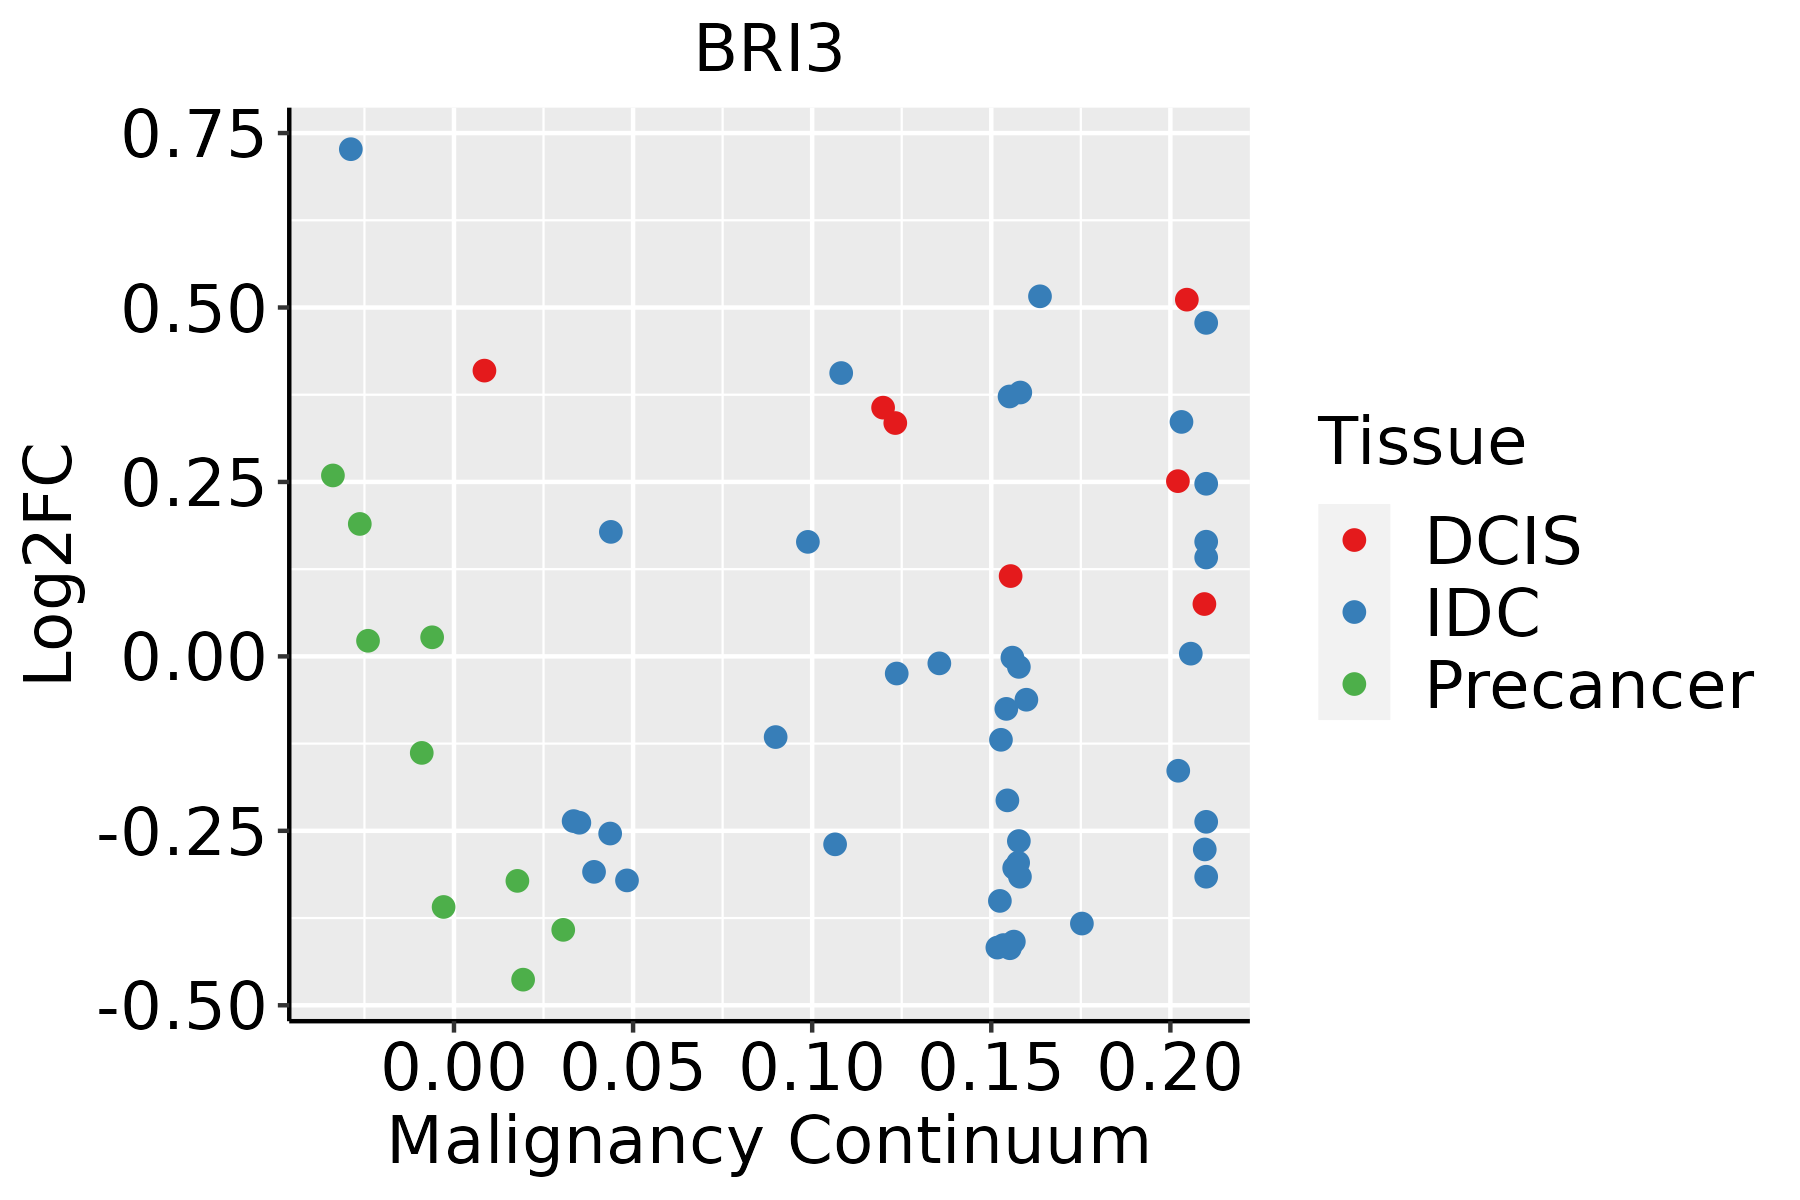 | IDC: Invasive ductal carcinoma |
| DCIS: Ductal carcinoma in situ | ||
| Precancer(BRCA1-mut): Precancerous lesion from BRCA1 mutation carriers | ||
| Cervix | 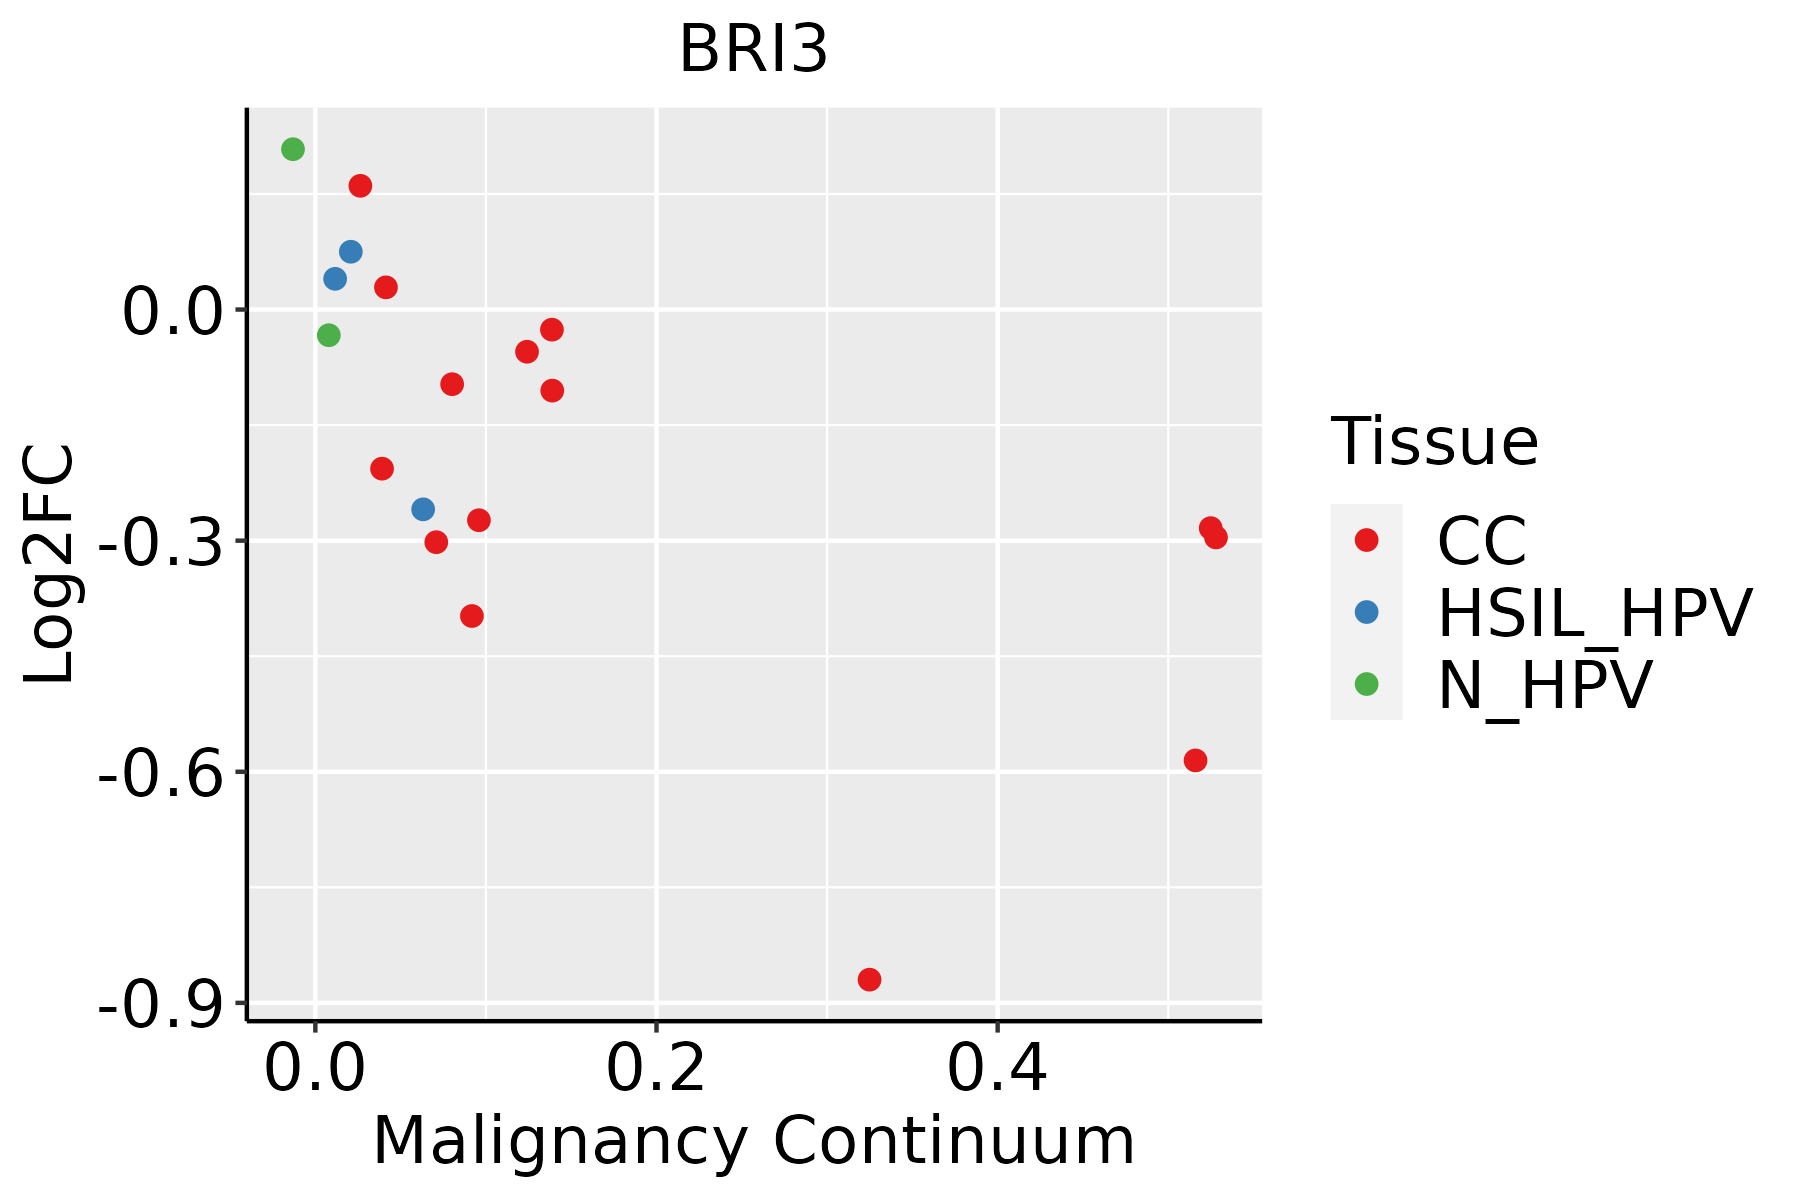 | CC: Cervix cancer |
| HSIL_HPV: HPV-infected high-grade squamous intraepithelial lesions | ||
| N_HPV: HPV-infected normal cervix | ||
| Colorectum (GSE201348) |  | FAP: Familial adenomatous polyposis |
| CRC: Colorectal cancer | ||
| Colorectum (HTA11) |  | AD: Adenomas |
| SER: Sessile serrated lesions | ||
| MSI-H: Microsatellite-high colorectal cancer | ||
| MSS: Microsatellite stable colorectal cancer | ||
| Esophagus |  | ESCC: Esophageal squamous cell carcinoma |
| HGIN: High-grade intraepithelial neoplasias | ||
| LGIN: Low-grade intraepithelial neoplasias | ||
| Liver |  | HCC: Hepatocellular carcinoma |
| NAFLD: Non-alcoholic fatty liver disease | ||
| Lung |  | AAH: Atypical adenomatous hyperplasia |
| AIS: Adenocarcinoma in situ | ||
| IAC: Invasive lung adenocarcinoma | ||
| MIA: Minimally invasive adenocarcinoma | ||
| Oral Cavity |  | EOLP: Erosive Oral lichen planus |
| LP: leukoplakia | ||
| NEOLP: Non-erosive oral lichen planus | ||
| OSCC: Oral squamous cell carcinoma | ||
| Prostate | 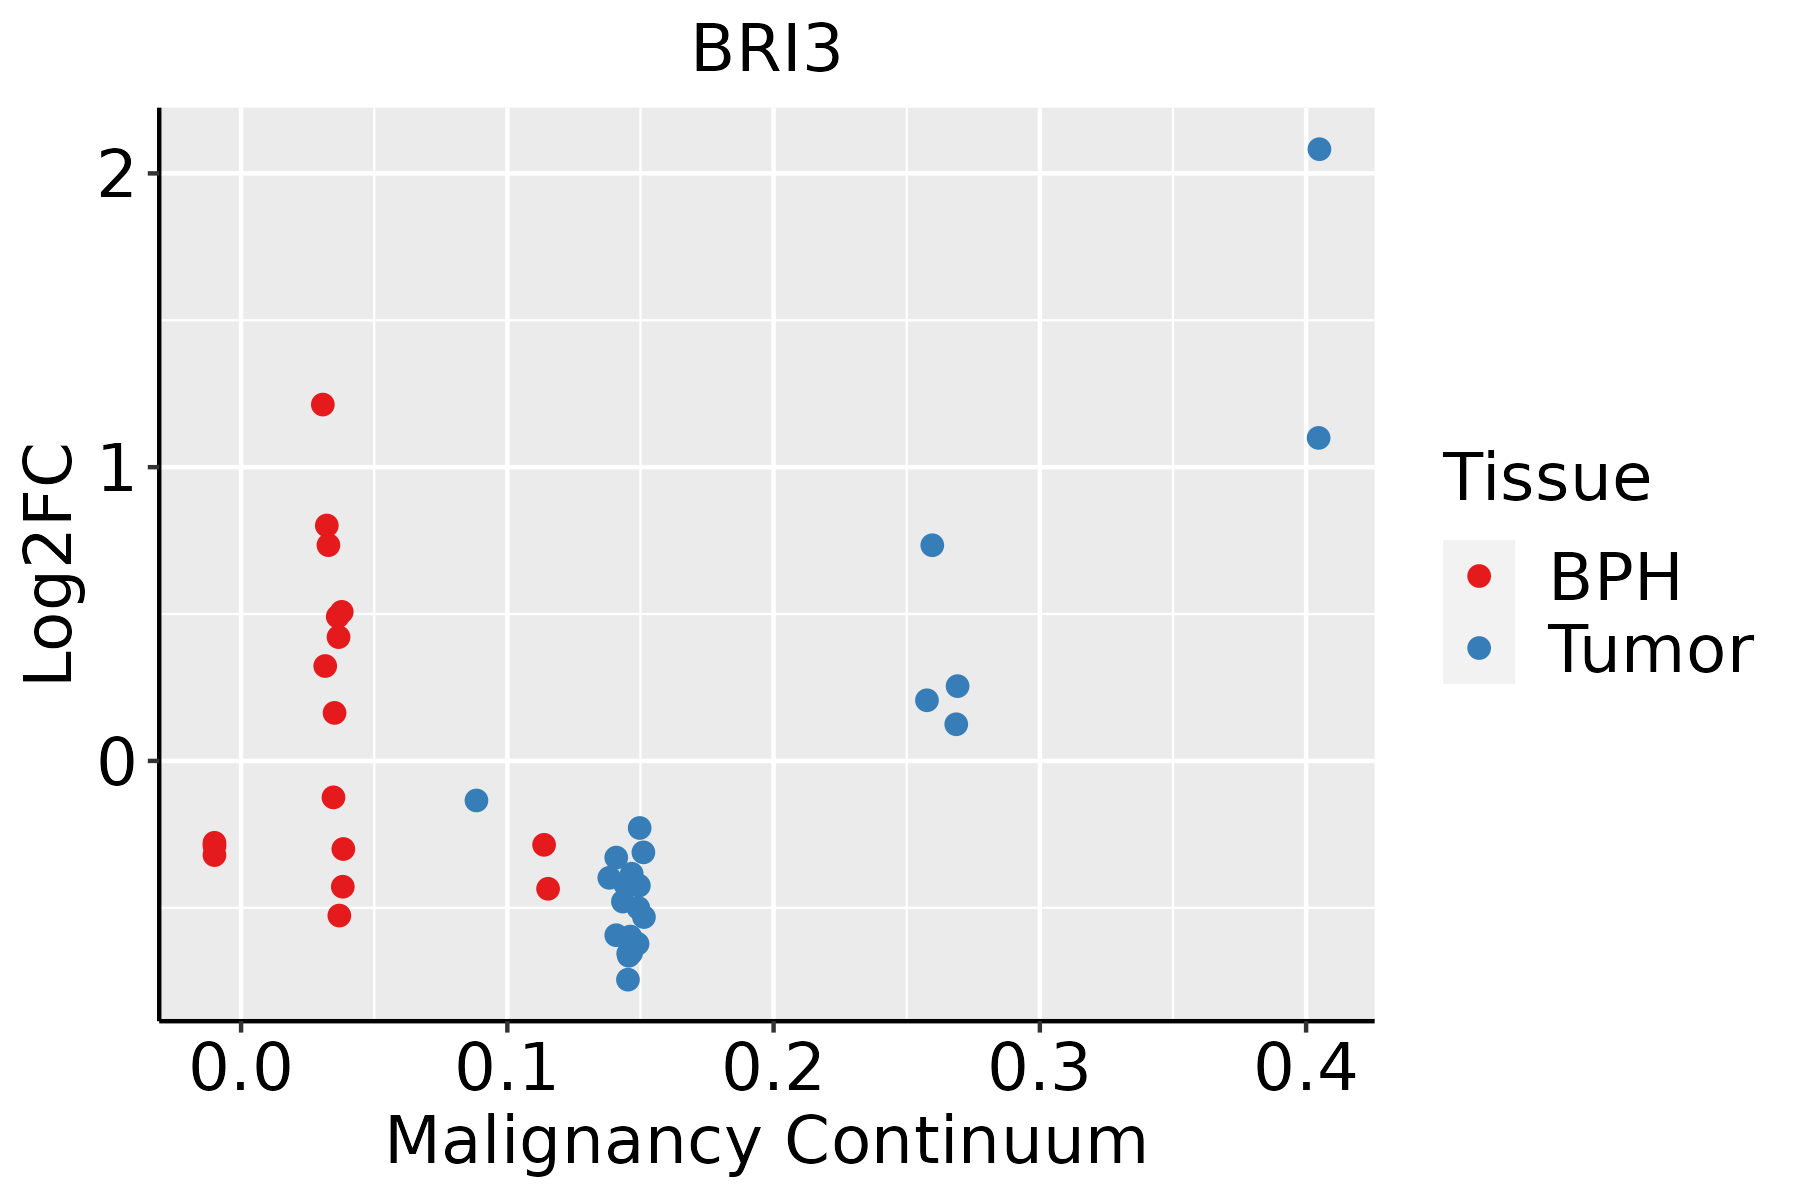 | BPH: Benign Prostatic Hyperplasia |
| Skin | 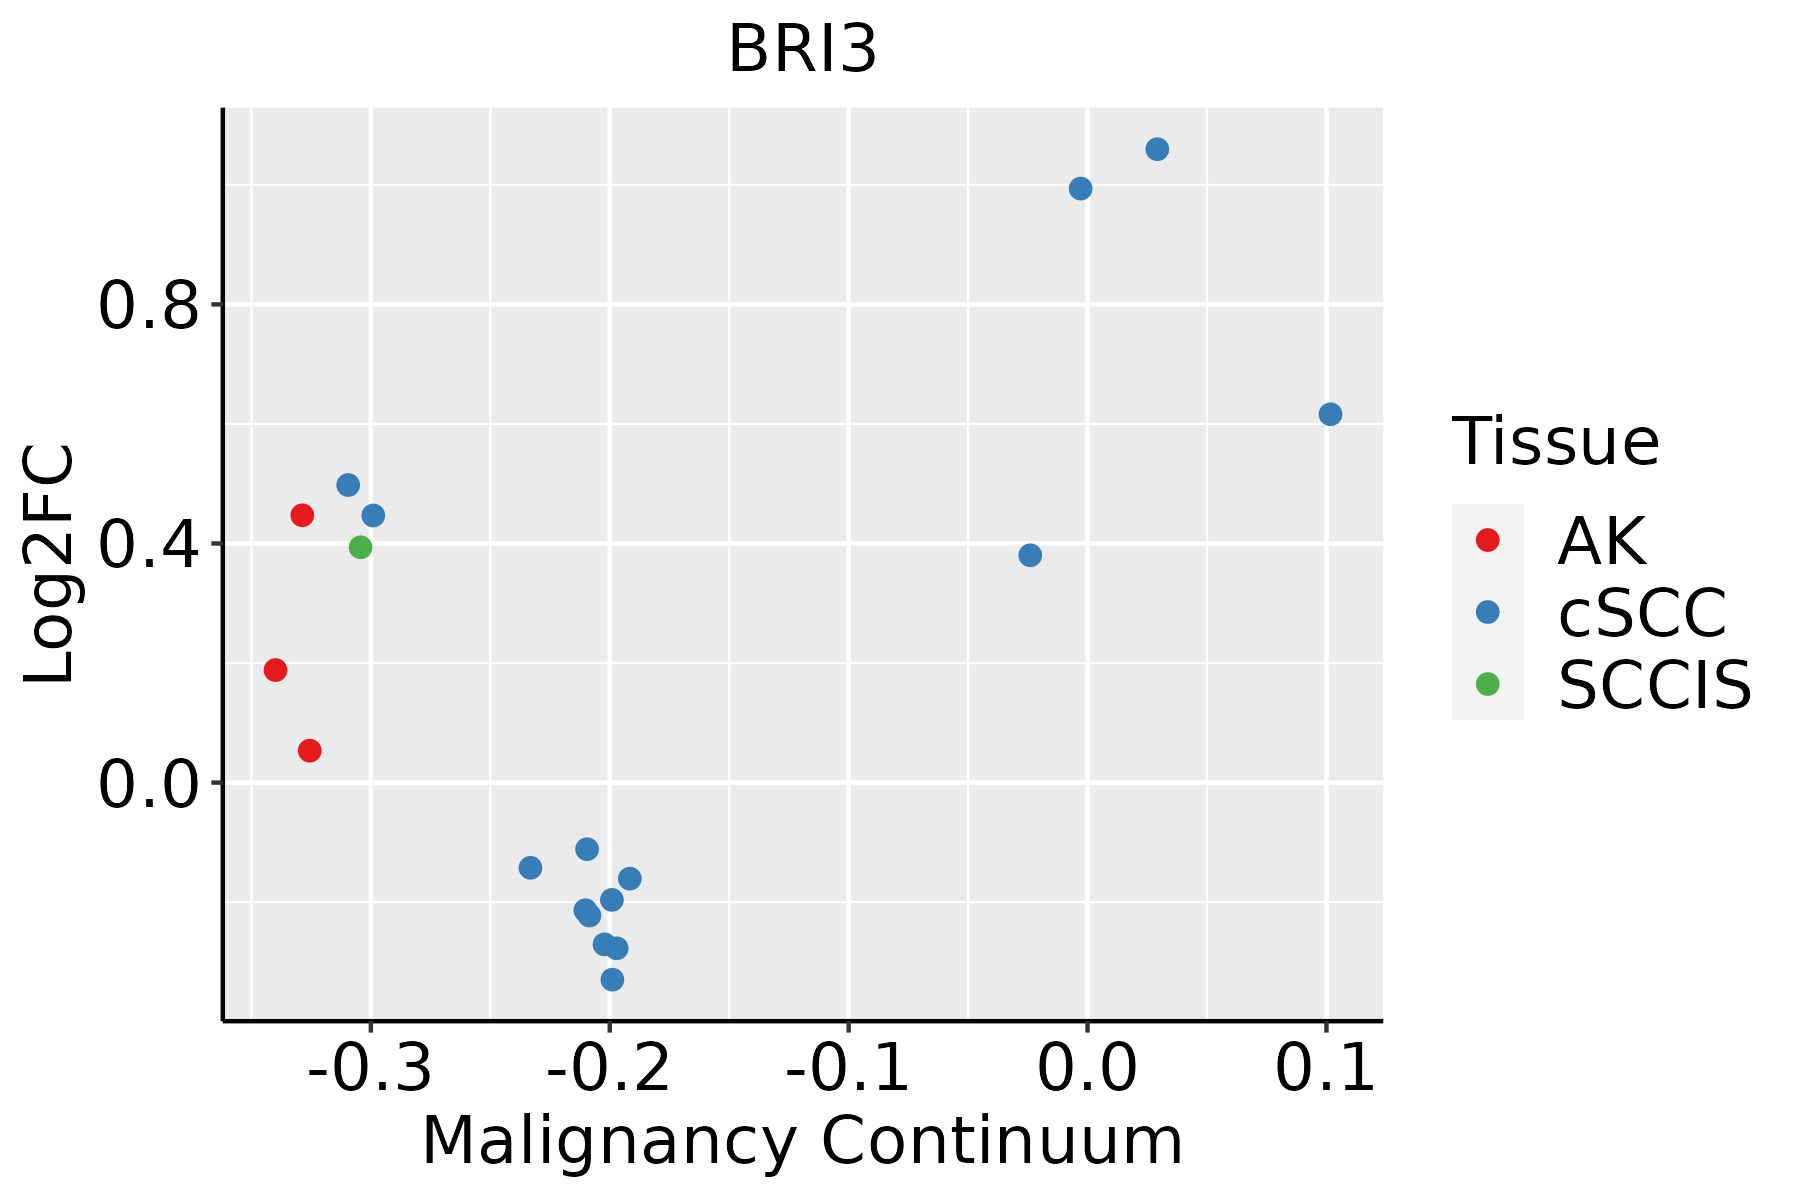 | AK: Actinic keratosis |
| cSCC: Cutaneous squamous cell carcinoma | ||
| SCCIS:squamous cell carcinoma in situ | ||
| Thyroid | 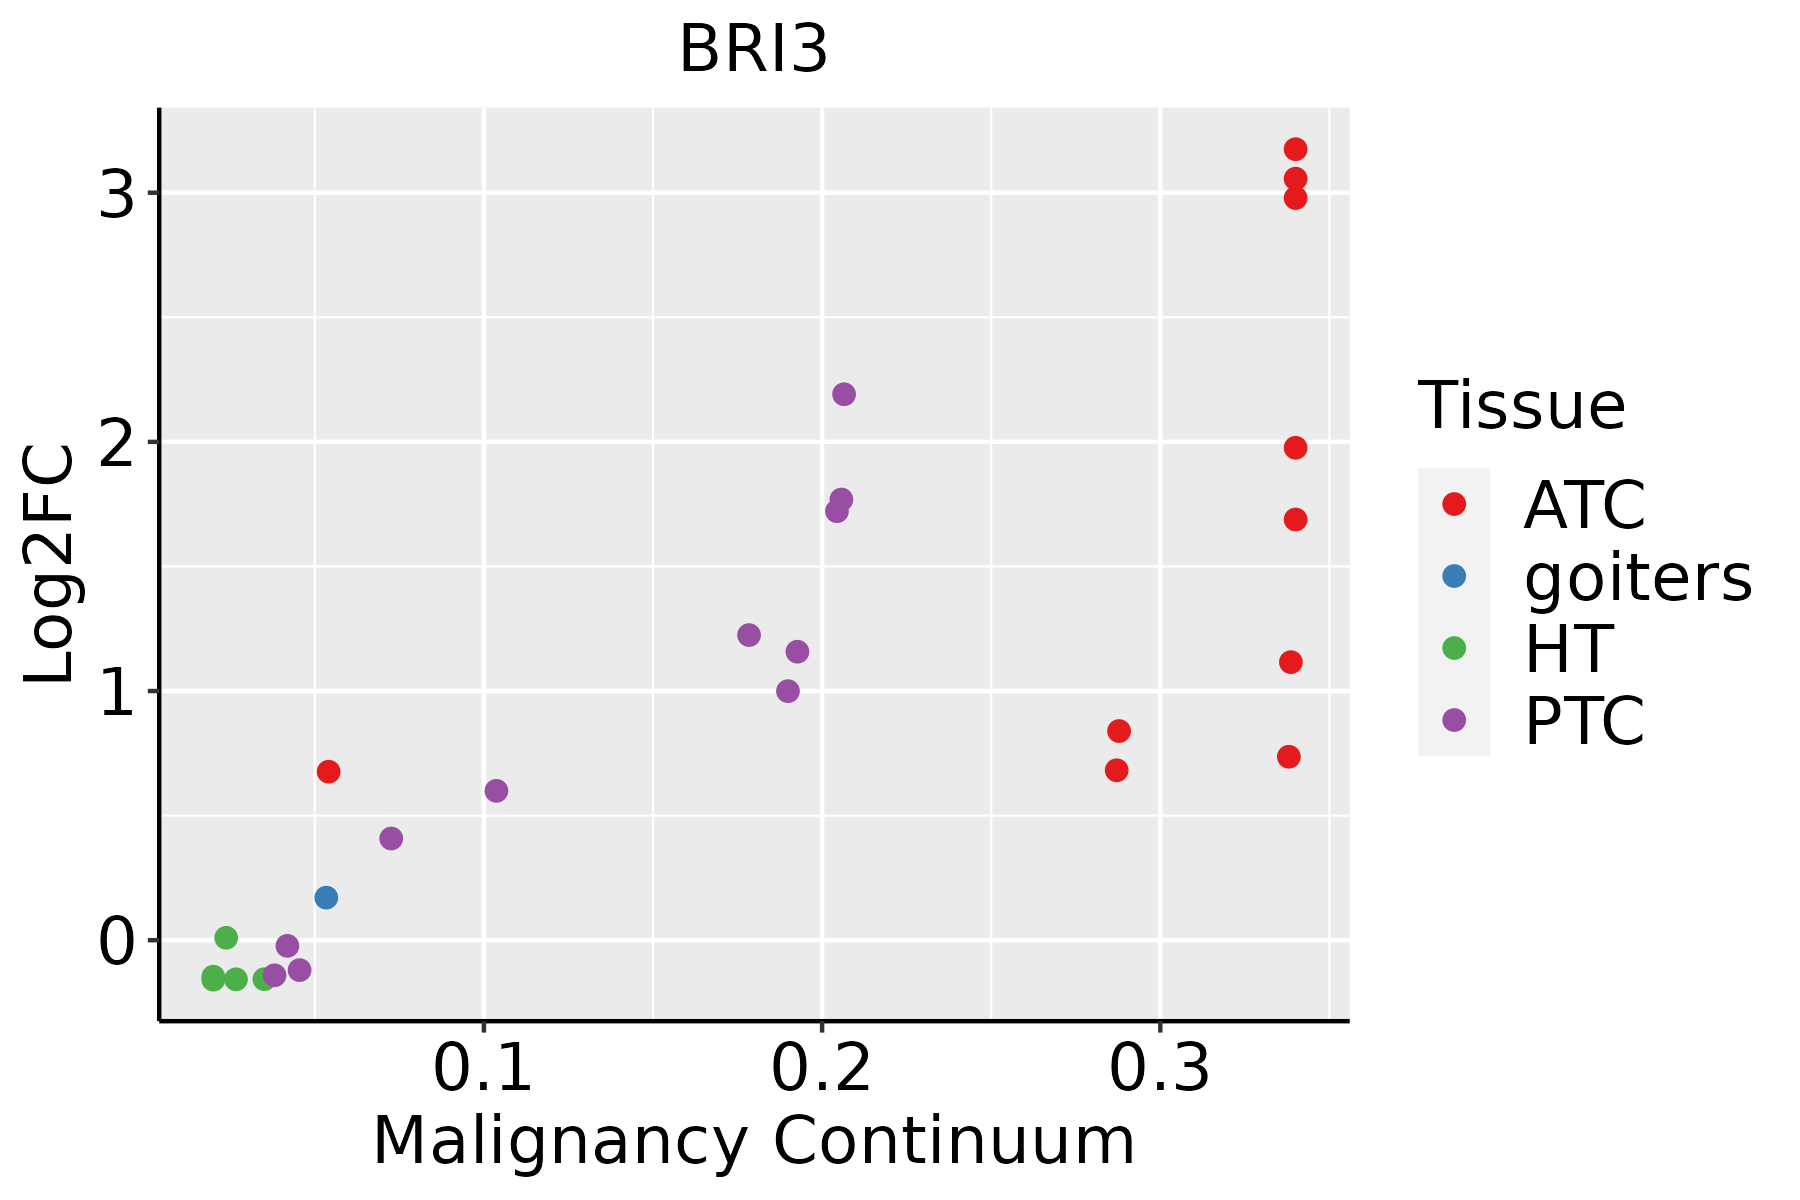 | ATC: Anaplastic thyroid cancer |
| HT: Hashimoto's thyroiditis | ||
| PTC: Papillary thyroid cancer |
| ∗log2FC in expression of this searched gene in stem-like cells from each diseased tissue sample relative to stem-like cells in normal samples in each tissue plotted against the malignancy continuum. Samples are colored based on if they are from different disease stage. |
Top |
Malignant transformation related pathway analysis |
| Find out the enriched GO biological processes and KEGG pathways involved in transition from healthy to precancer to cancer |
| Tissue | Disease Stage | Enriched GO biological Processes |
| Colorectum | AD |  |
| Colorectum | SER |  |
| Colorectum | MSS |  |
| Colorectum | MSI-H |  |
| Colorectum | FAP |  |
| ∗Top 15 enriched GO BP terms are showed in the bar plot of each disease state in each tissue. Each row represents a significant GO biological process which is colored according to the -log10(p.adjust). |
| Page: 1 2 3 4 5 6 7 8 9 |
| GO ID | Tissue | Disease Stage | Description | Gene Ratio | Bg Ratio | pvalue | p.adjust | Count |
| Page: 1 |
| Pathway ID | Tissue | Disease Stage | Description | Gene Ratio | Bg Ratio | pvalue | p.adjust | qvalue | Count |
| Page: 1 |
Top |
Cell-cell communication analysis |
| Identification of potential cell-cell interactions between two cell types and their ligand-receptor pairs for different disease states |
| Ligand | Receptor | LRpair | Pathway | Tissue | Disease Stage |
| Page: 1 |
Top |
Single-cell gene regulatory network inference analysis |
| Find out the significant the regulons (TFs) and the target genes of each regulon across cell types for different disease states |
| TF | Cell Type | Tissue | Disease Stage | Target Gene | RSS | Regulon Activity |
| ∗The dot plots of a searched regulon are shown for all cell subpopulations in each disease state of each tissue based on the regulon specific score inferred using pySCENIC and by calculating the average expression. |
| Page: 1 |
Top |
Somatic mutation of malignant transformation related genes |
| Annotation of somatic variants for genes involved in malignant transformation |
| Hugo Symbol | Variant Class | Variant Classification | dbSNP RS | HGVSc | HGVSp | HGVSp Short | SWISSPROT | BIOTYPE | SIFT | PolyPhen | Tumor Sample Barcode | Tissue | Histology | Sex | Age | Stage | Therapy Types | Drugs | Outcome |
| BRI3 | SNV | Missense_Mutation | rs772300526 | c.347N>A | p.Arg116Gln | p.R116Q | O95415 | protein_coding | deleterious(0.01) | possibly_damaging(0.832) | TCGA-D8-A1JA-01 | Breast | breast invasive carcinoma | Female | <65 | III/IV | Chemotherapy | adriamycin | PD |
| BRI3 | SNV | Missense_Mutation | c.236N>G | p.Pro79Arg | p.P79R | O95415 | protein_coding | deleterious(0) | probably_damaging(0.999) | TCGA-D5-6535-01 | Colorectum | colon adenocarcinoma | Female | >=65 | III/IV | Unknown | Unknown | SD | |
| BRI3 | SNV | Missense_Mutation | rs766249032 | c.206N>T | p.Ala69Val | p.A69V | O95415 | protein_coding | tolerated(0.12) | benign(0.006) | TCGA-AP-A059-01 | Endometrium | uterine corpus endometrioid carcinoma | Female | >=65 | I/II | Unknown | Unknown | SD |
| BRI3 | SNV | Missense_Mutation | rs867982825 | c.332C>T | p.Ala111Val | p.A111V | O95415 | protein_coding | deleterious(0.02) | probably_damaging(0.983) | TCGA-BA-4078-01 | Oral cavity | head & neck squamous cell carcinoma | Male | >=65 | I/II | Unknown | Unknown | PD |
| Page: 1 |
Top |
Related drugs of malignant transformation related genes |
| Identification of chemicals and drugs interact with genes involved in malignant transfromation |
| (DGIdb 4.0) |
| Entrez ID | Symbol | Category | Interaction Types | Drug Claim Name | Drug Name | PMIDs |
| Page: 1 |

Copyright 2023-Present -The University of Texas Health Science Center at Houston |