
|
|||||
|
 | |
| |
| |
| |
| |
| |
|
Gene: ANKHD1 |
Gene summary for ANKHD1 |
| Gene information | Species | Human | Gene symbol | ANKHD1 | Gene ID | 54882 |
| Gene name | ankyrin repeat and KH domain containing 1 | |
| Gene Alias | MASK | |
| Cytomap | 5q31.3 | |
| Gene Type | protein-coding | GO ID | GO:0002376 | UniProtAcc | Q8IWZ3 |
Top |
Malignant transformation analysis |
| Identification of the aberrant gene expression in precancerous and cancerous lesions by comparing the gene expression of stem-like cells in diseased tissues with normal stem cells |
| Entrez ID | Symbol | Replicates | Species | Organ | Tissue | Adj P-value | Log2FC | Malignancy |
| 54882 | ANKHD1 | GSM5353243_PA_PR5261_T1_S23_L002 | Human | Prostate | Tumor | 3.47e-05 | -2.52e-01 | 0.1545 |
| 54882 | ANKHD1 | GSM5353244_PA_PR5261_T2_S24_L002 | Human | Prostate | Tumor | 3.92e-03 | -2.44e-01 | 0.1569 |
| 54882 | ANKHD1 | P1_S1_AK | Human | Skin | AK | 2.59e-65 | 9.66e-01 | -0.3399 |
| 54882 | ANKHD1 | P2_S3_AK | Human | Skin | AK | 4.37e-66 | 9.36e-01 | -0.3287 |
| 54882 | ANKHD1 | P2_S4_SCCIS | Human | Skin | SCCIS | 7.30e-25 | 5.68e-01 | -0.3043 |
| 54882 | ANKHD1 | P3_S6_AK | Human | Skin | AK | 9.30e-32 | 7.90e-01 | -0.3256 |
| 54882 | ANKHD1 | P4_S8_cSCC | Human | Skin | cSCC | 2.04e-28 | 6.79e-01 | -0.3095 |
| 54882 | ANKHD1 | P5_S10_cSCC | Human | Skin | cSCC | 1.30e-47 | 6.51e-01 | -0.299 |
| 54882 | ANKHD1 | P1_cSCC | Human | Skin | cSCC | 3.28e-03 | 2.00e-01 | 0.0292 |
| Page: 1 2 3 4 5 6 7 8 9 10 |
| Tissue | Expression Dynamics | Abbreviation |
| Colorectum (GSE201348) |  | FAP: Familial adenomatous polyposis |
| CRC: Colorectal cancer | ||
| Colorectum (HTA11) |  | AD: Adenomas |
| SER: Sessile serrated lesions | ||
| MSI-H: Microsatellite-high colorectal cancer | ||
| MSS: Microsatellite stable colorectal cancer | ||
| Endometrium | 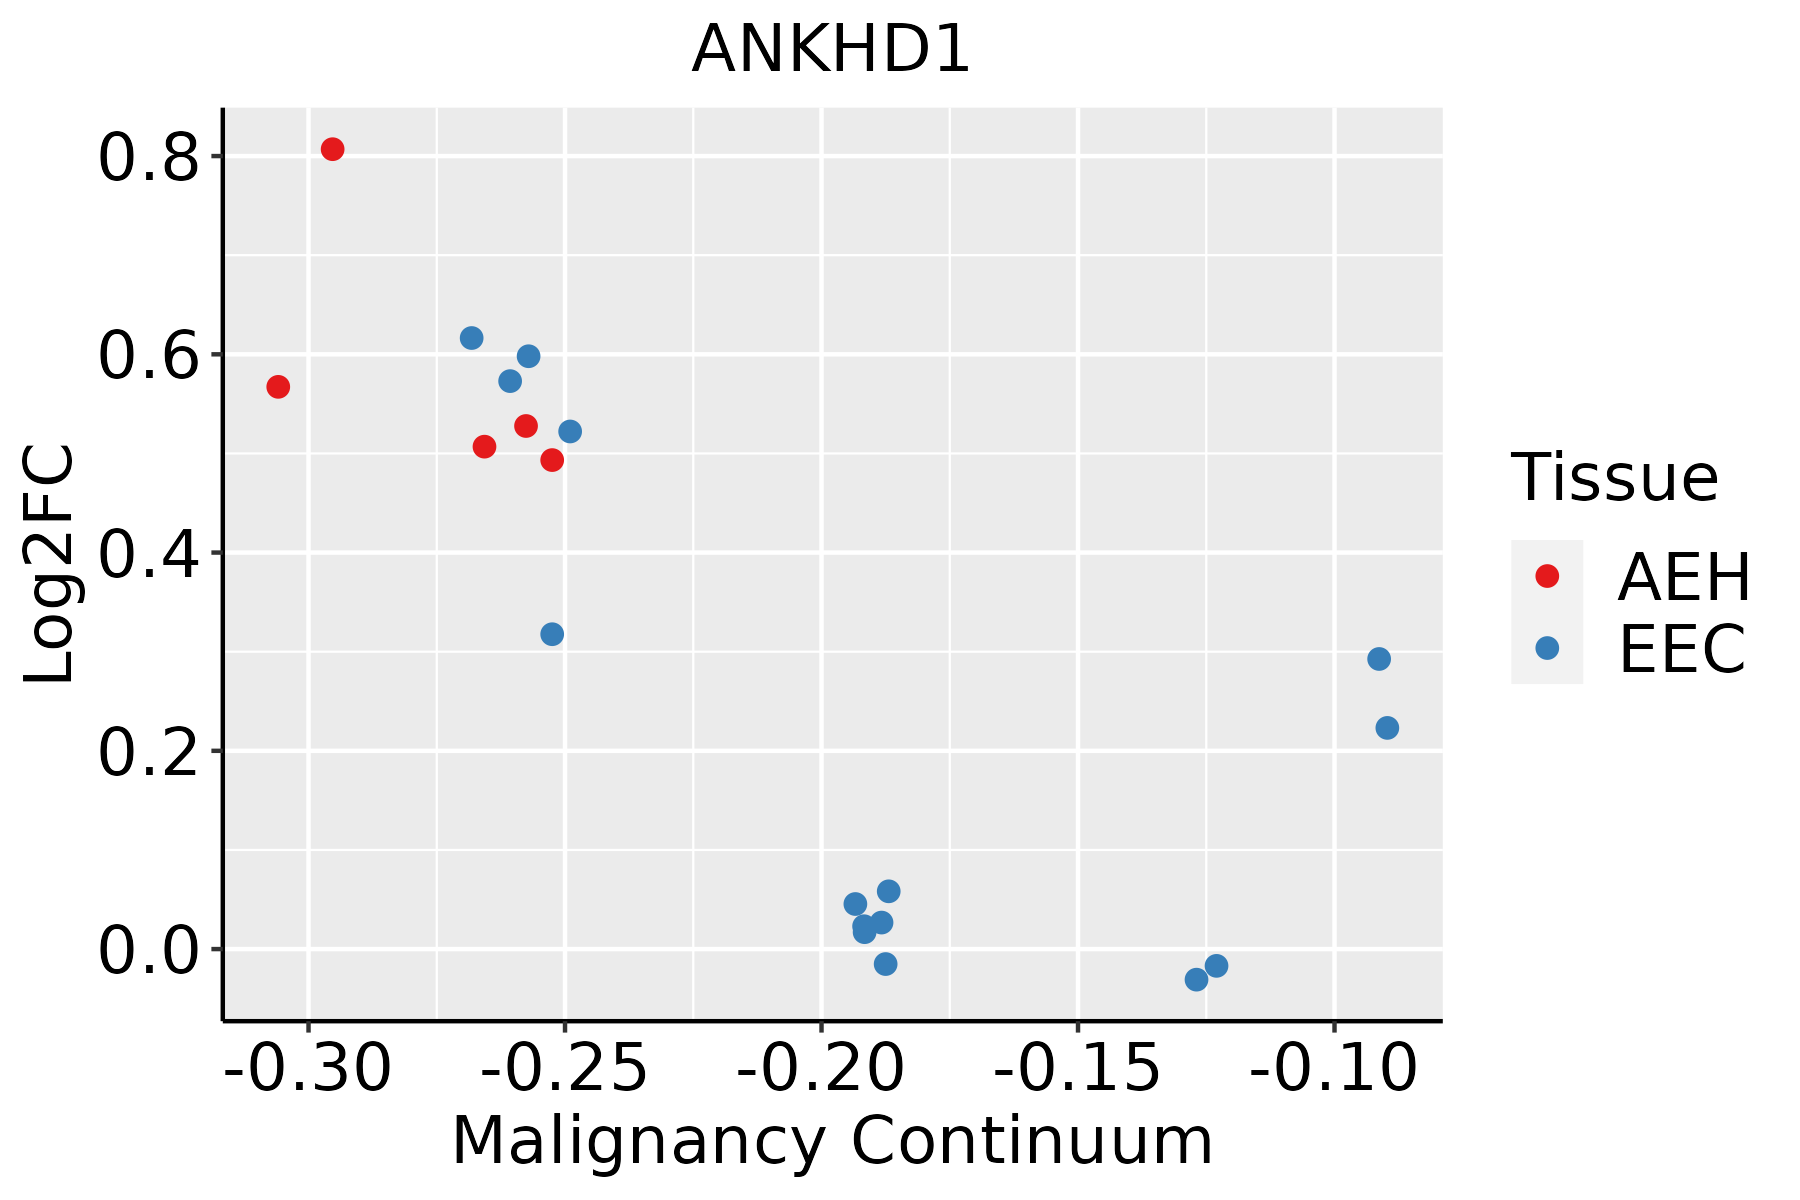 | AEH: Atypical endometrial hyperplasia |
| EEC: Endometrioid Cancer | ||
| Esophagus |  | ESCC: Esophageal squamous cell carcinoma |
| HGIN: High-grade intraepithelial neoplasias | ||
| LGIN: Low-grade intraepithelial neoplasias | ||
| Liver | 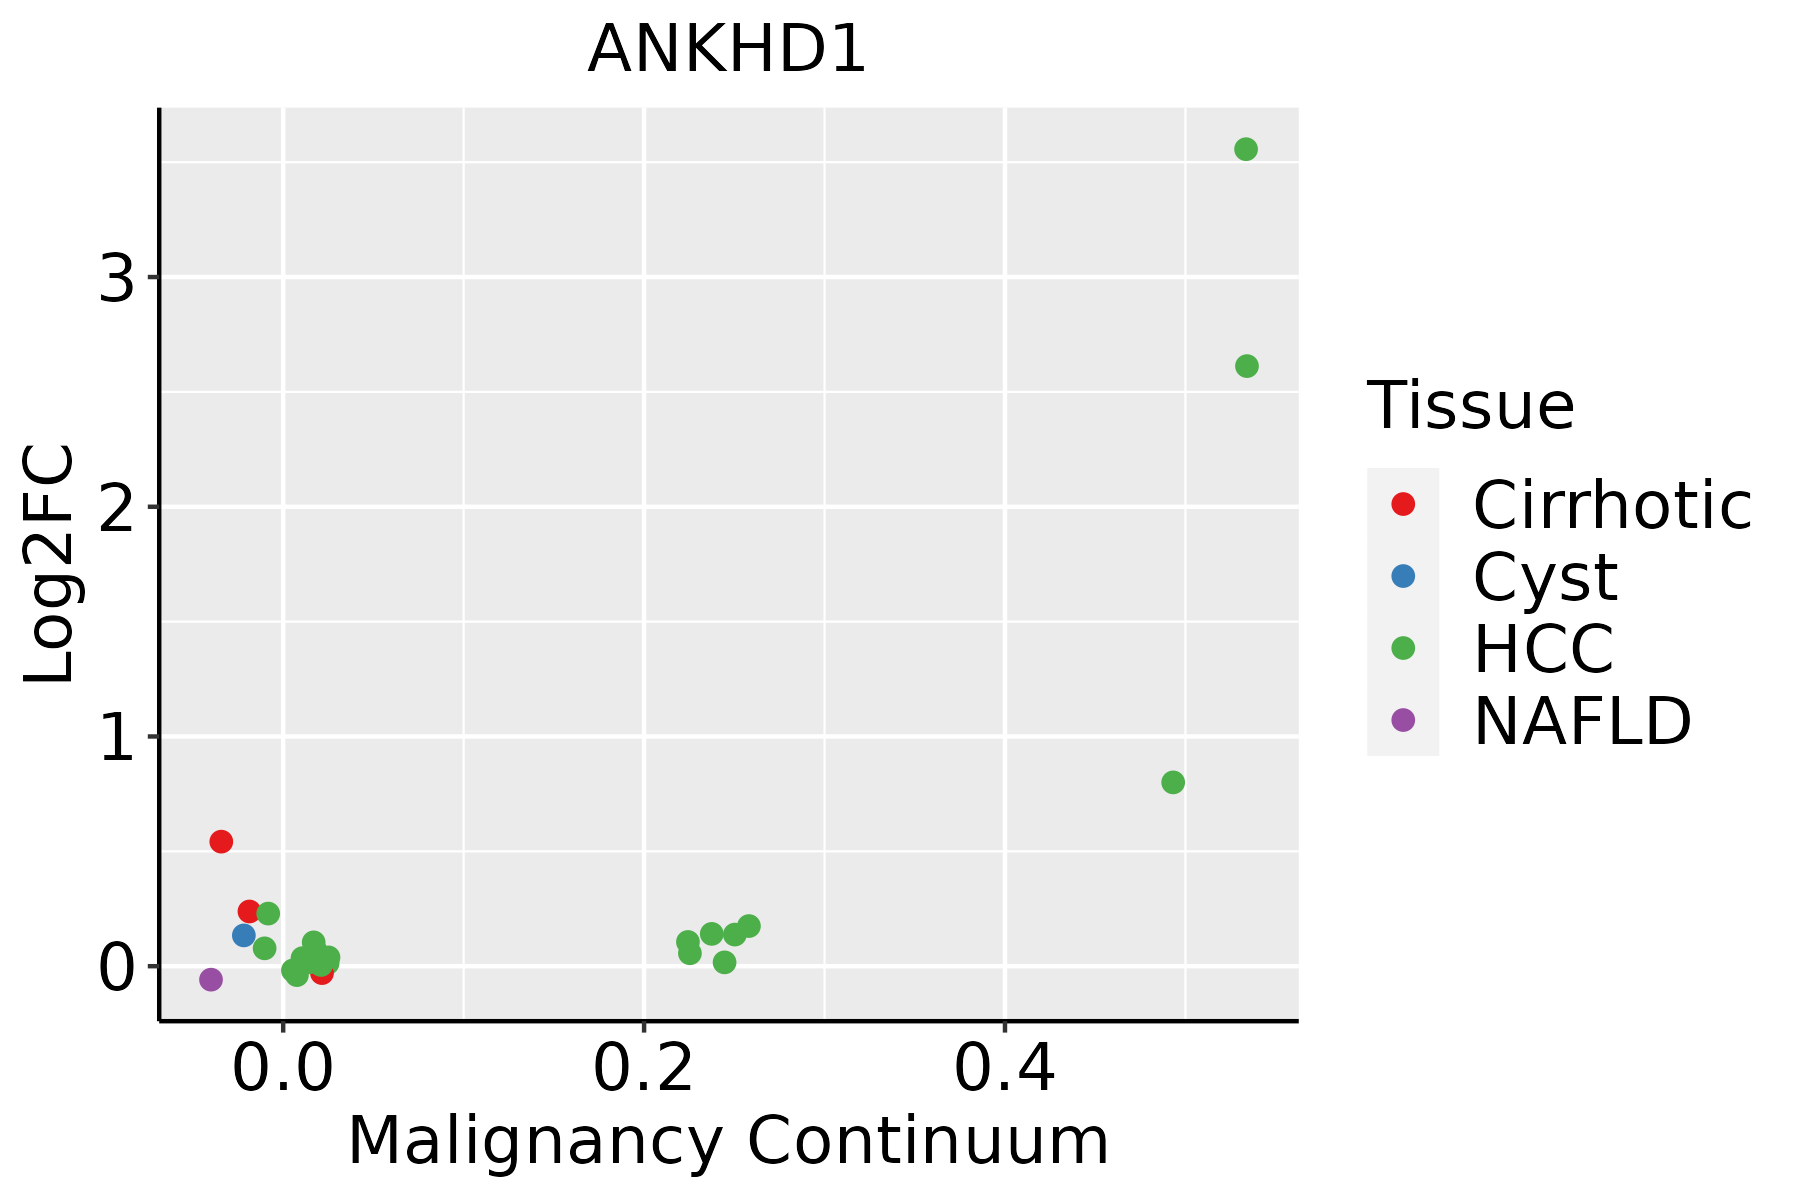 | HCC: Hepatocellular carcinoma |
| NAFLD: Non-alcoholic fatty liver disease | ||
| Lung | 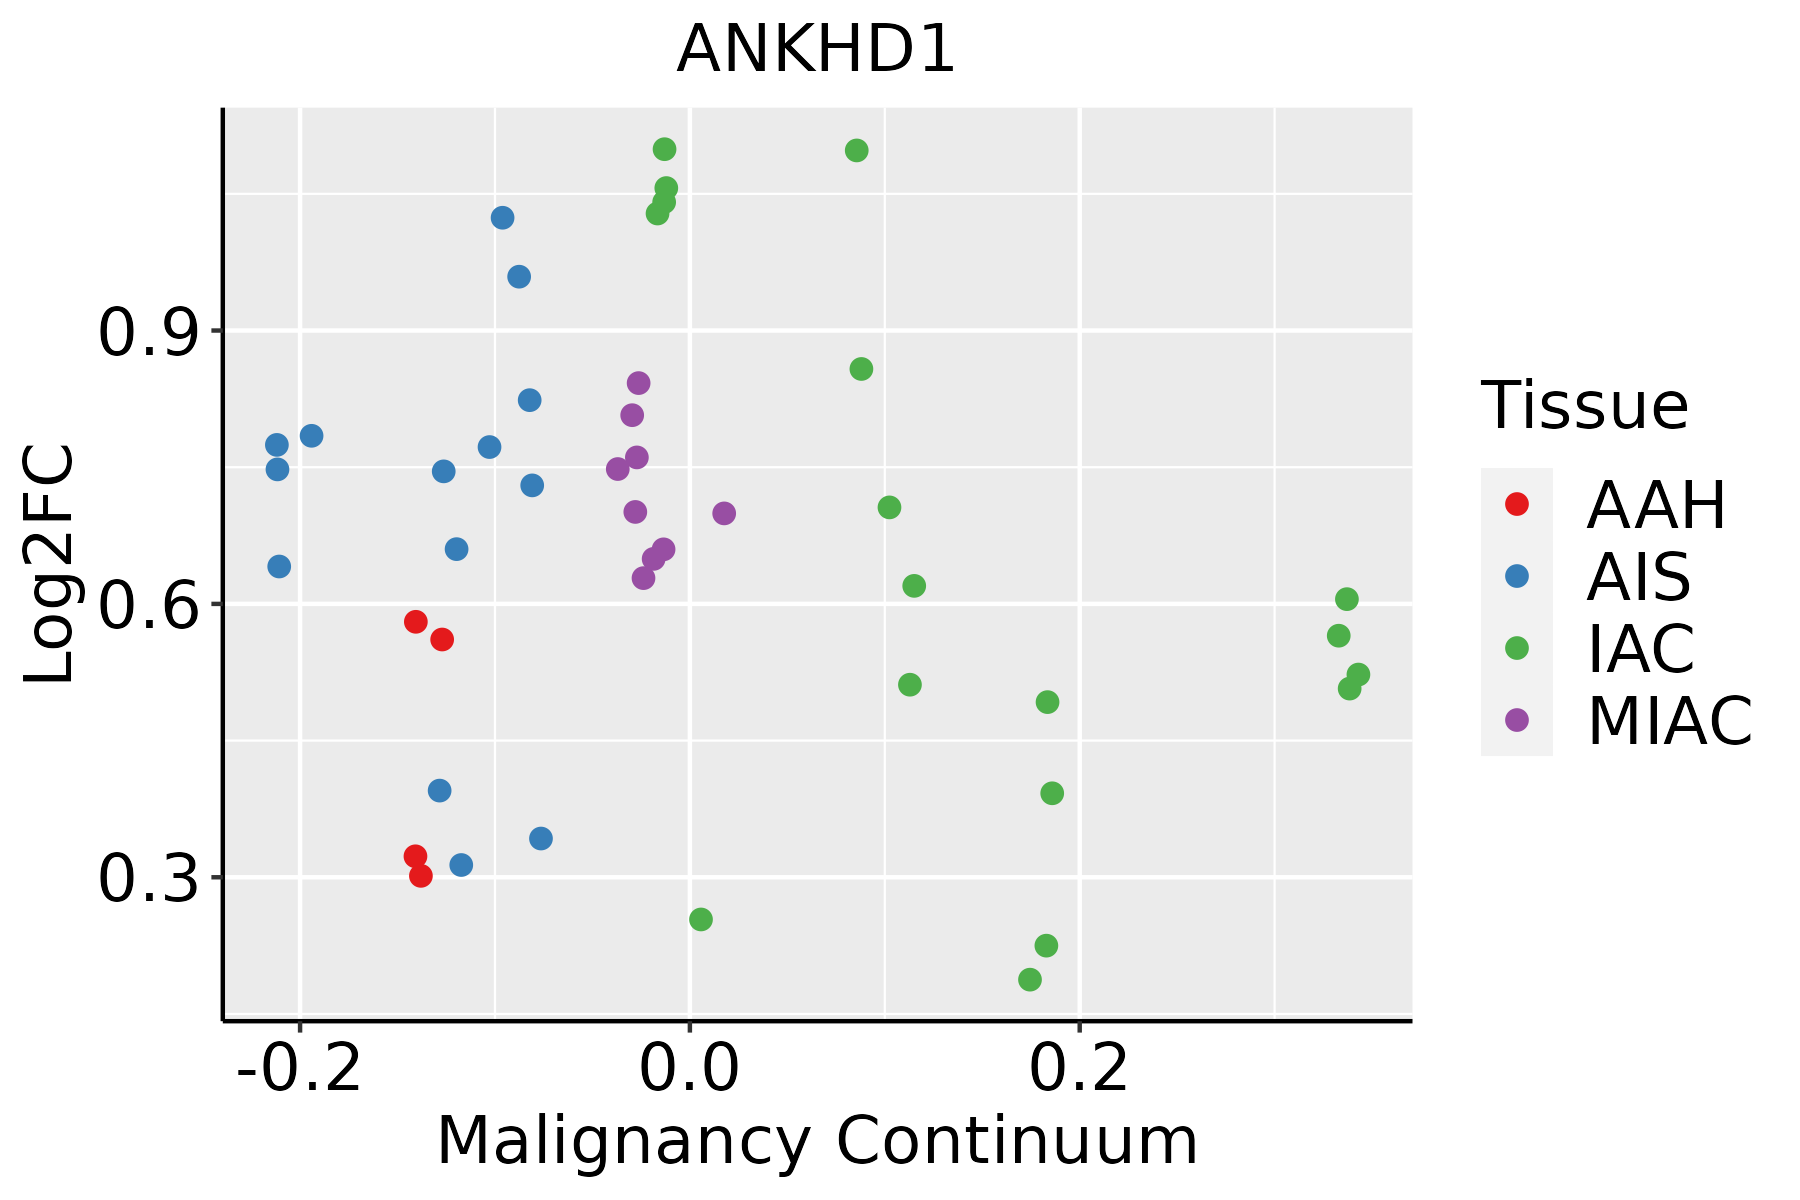 | AAH: Atypical adenomatous hyperplasia |
| AIS: Adenocarcinoma in situ | ||
| IAC: Invasive lung adenocarcinoma | ||
| MIA: Minimally invasive adenocarcinoma | ||
| Oral Cavity | 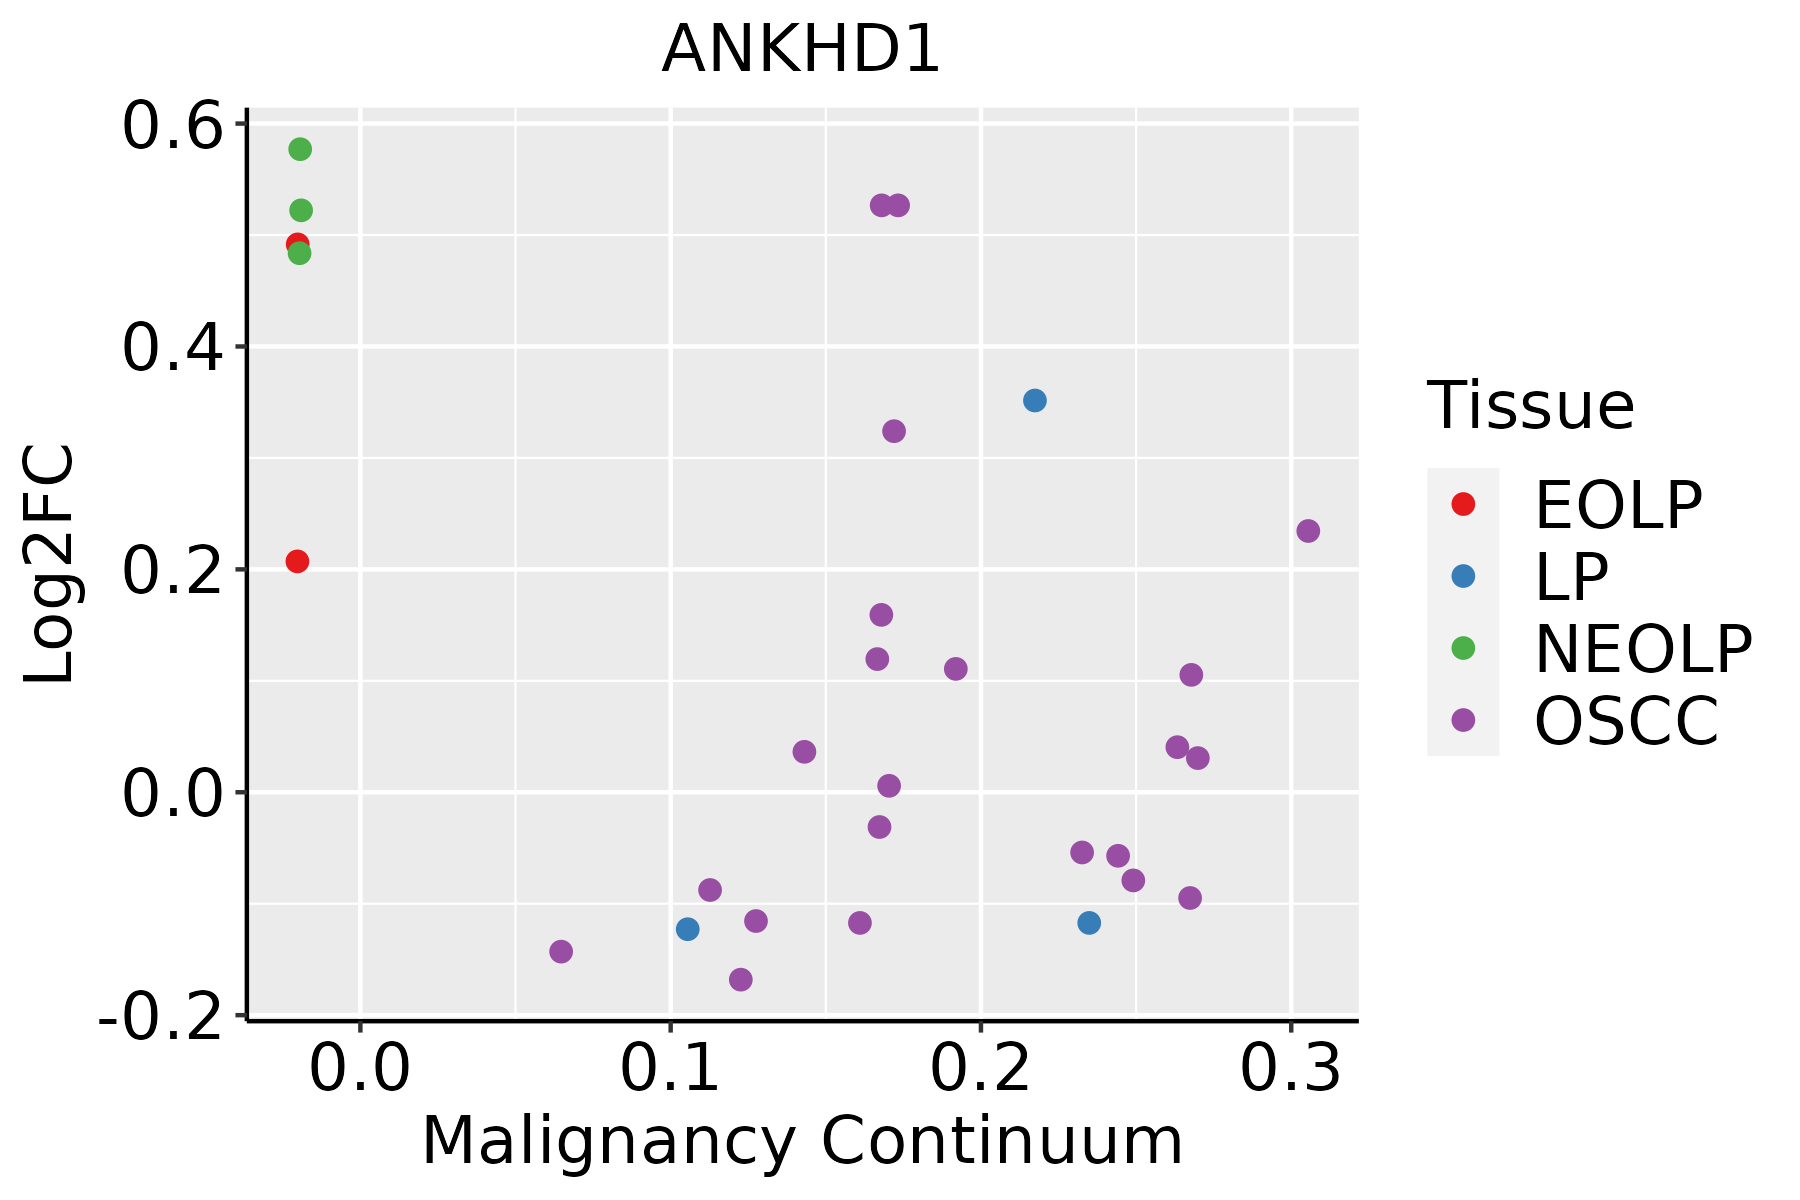 | EOLP: Erosive Oral lichen planus |
| LP: leukoplakia | ||
| NEOLP: Non-erosive oral lichen planus | ||
| OSCC: Oral squamous cell carcinoma | ||
| Prostate | 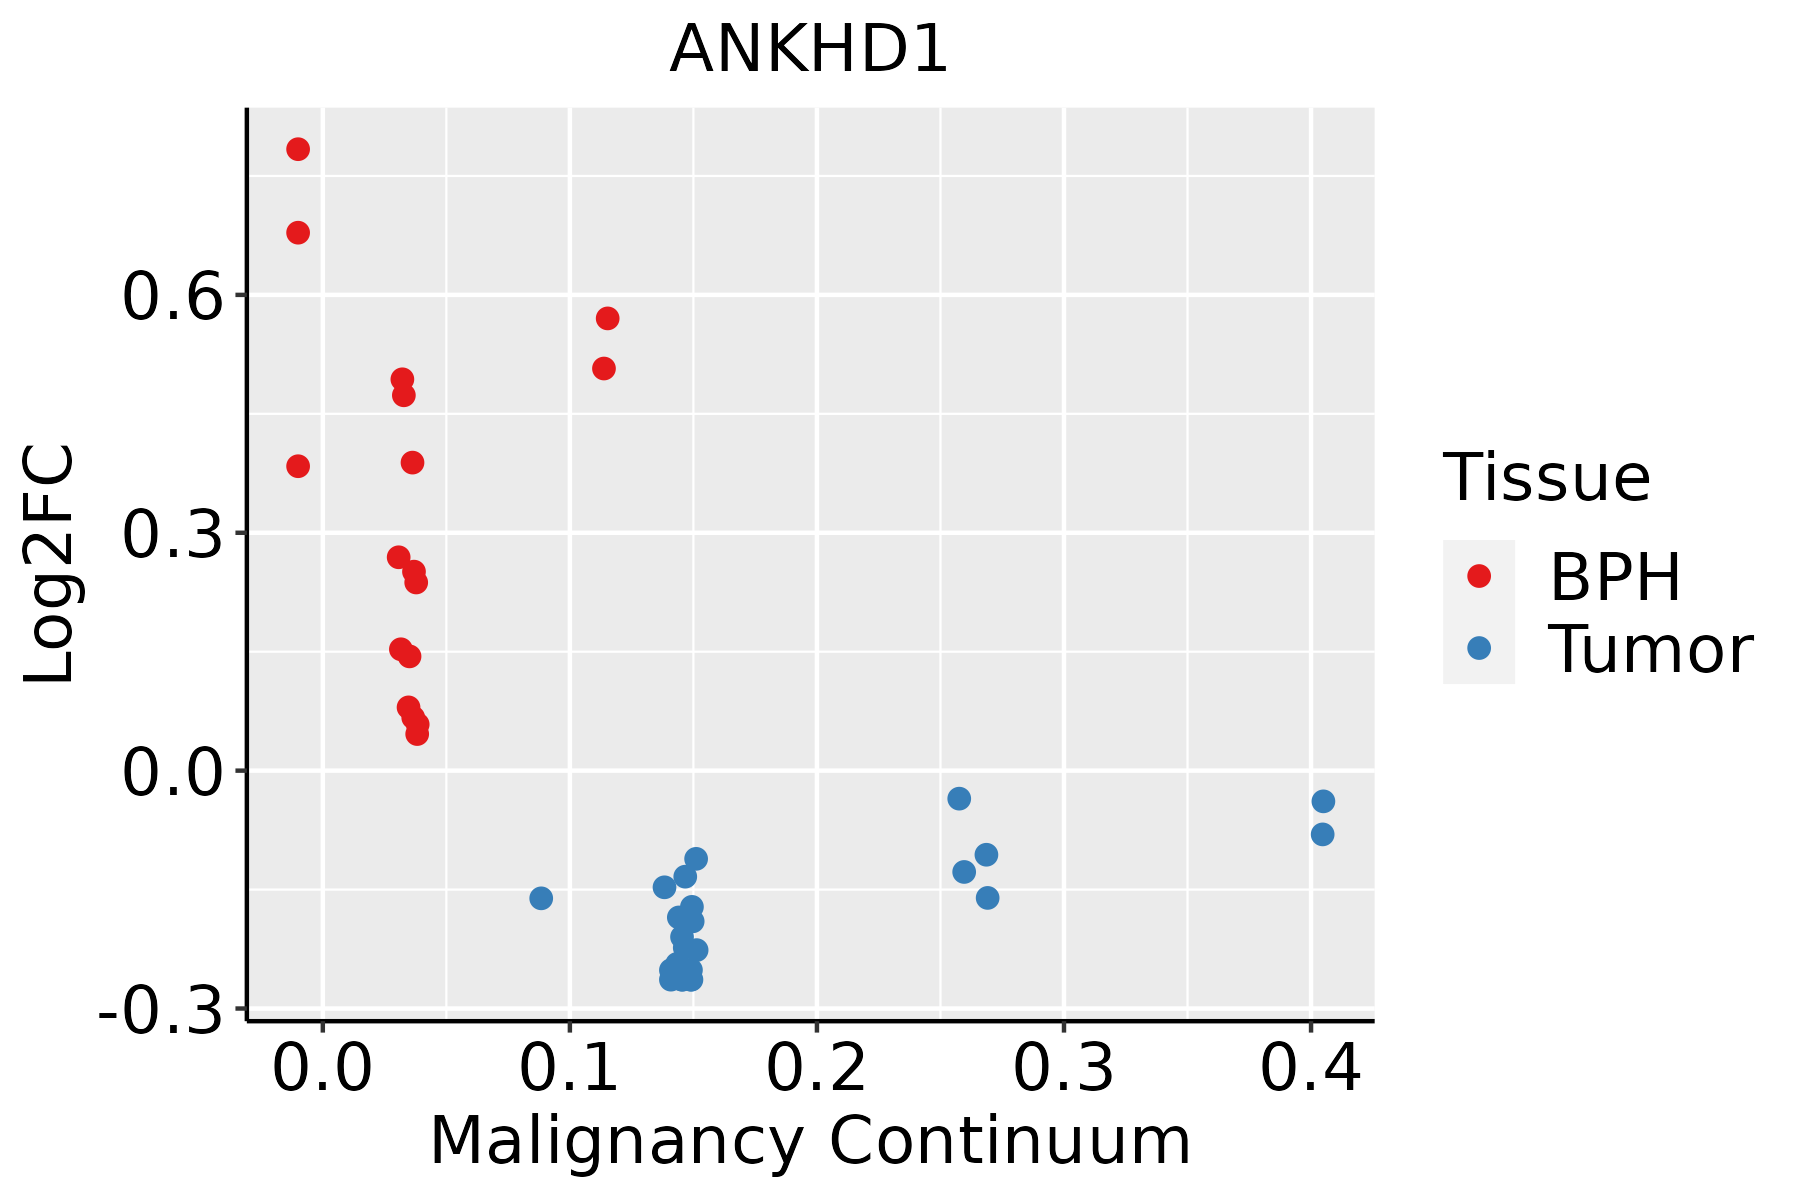 | BPH: Benign Prostatic Hyperplasia |
| Skin | 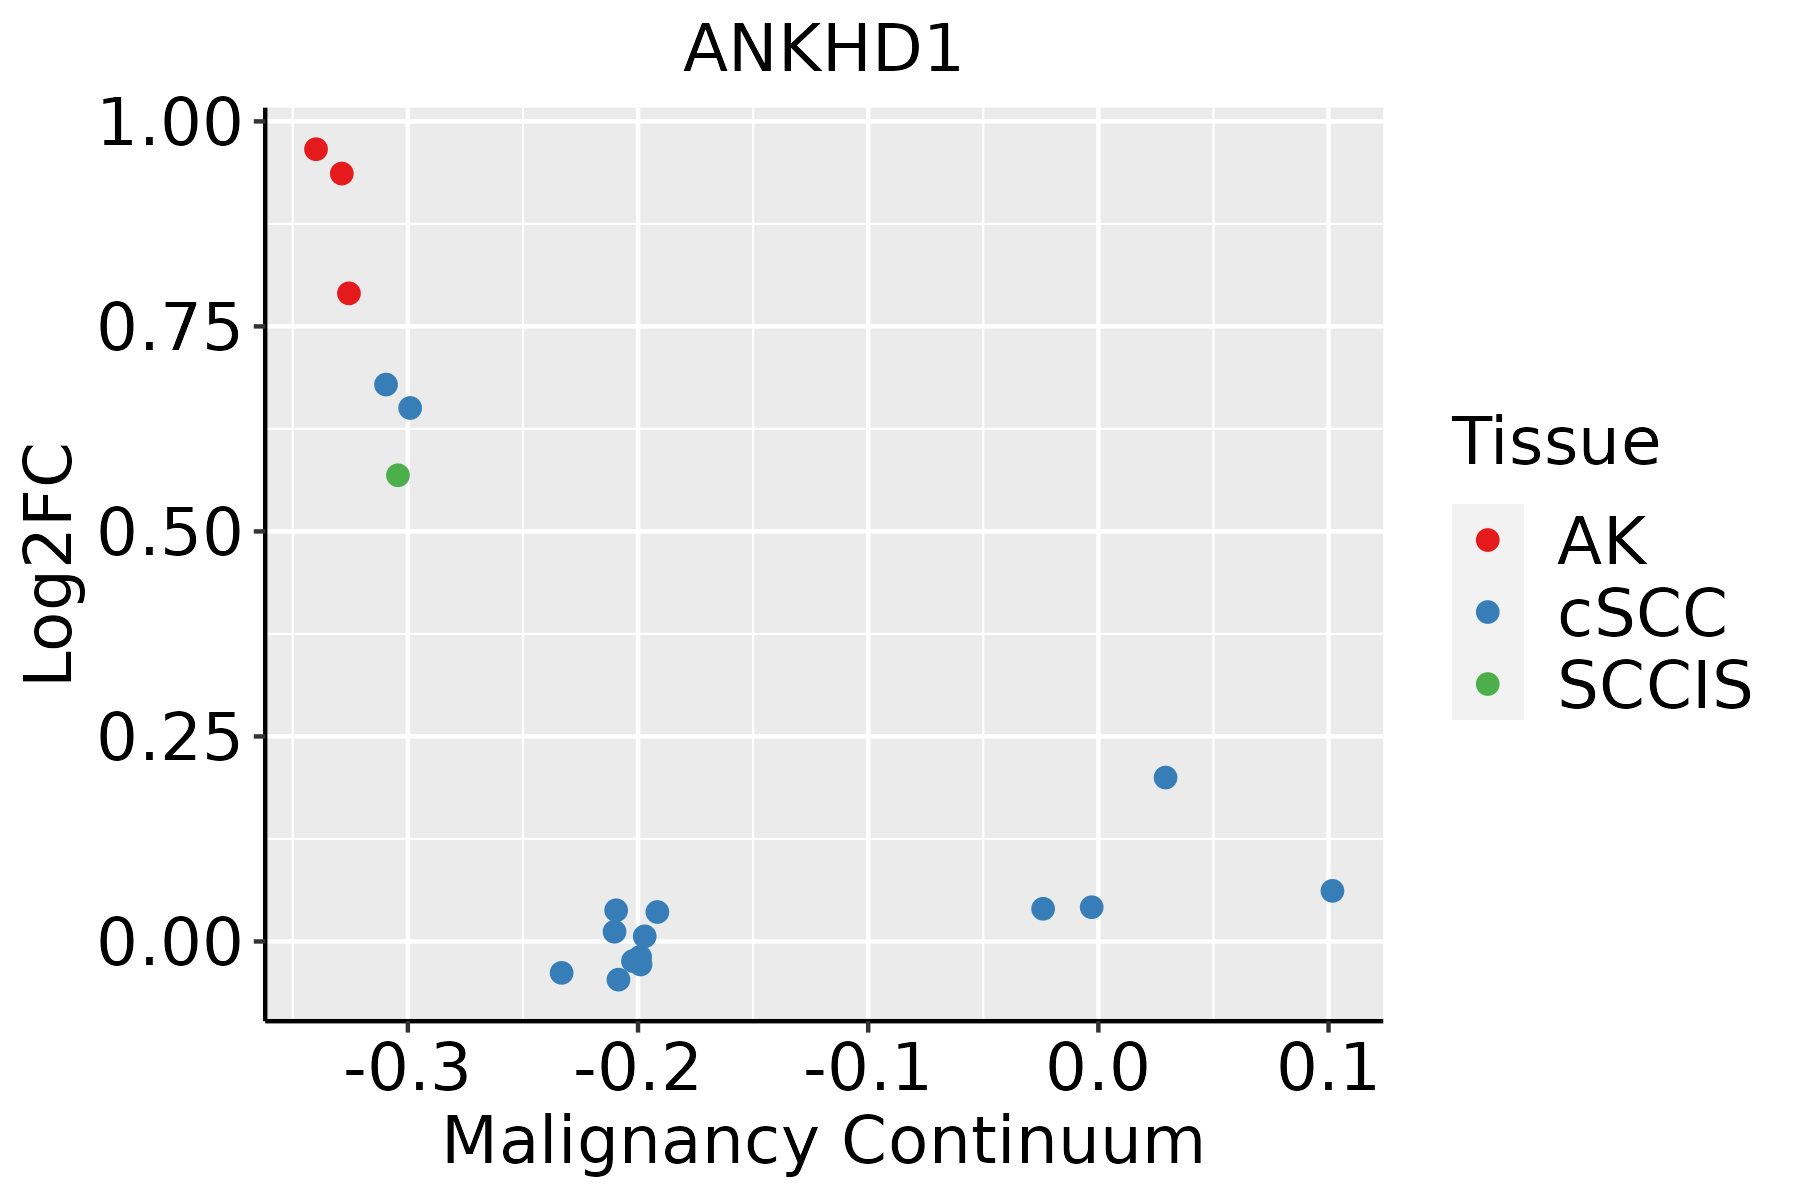 | AK: Actinic keratosis |
| cSCC: Cutaneous squamous cell carcinoma | ||
| SCCIS:squamous cell carcinoma in situ |
| ∗log2FC in expression of this searched gene in stem-like cells from each diseased tissue sample relative to stem-like cells in normal samples in each tissue plotted against the malignancy continuum. Samples are colored based on if they are from different disease stage. |
Top |
Malignant transformation related pathway analysis |
| Find out the enriched GO biological processes and KEGG pathways involved in transition from healthy to precancer to cancer |
| Tissue | Disease Stage | Enriched GO biological Processes |
| Colorectum | AD |  |
| Colorectum | SER |  |
| Colorectum | MSS |  |
| Colorectum | MSI-H |  |
| Colorectum | FAP |  |
| ∗Top 15 enriched GO BP terms are showed in the bar plot of each disease state in each tissue. Each row represents a significant GO biological process which is colored according to the -log10(p.adjust). |
| Page: 1 2 3 4 5 6 7 8 9 |
| GO ID | Tissue | Disease Stage | Description | Gene Ratio | Bg Ratio | pvalue | p.adjust | Count |
| Page: 1 |
| Pathway ID | Tissue | Disease Stage | Description | Gene Ratio | Bg Ratio | pvalue | p.adjust | qvalue | Count |
| Page: 1 |
Top |
Cell-cell communication analysis |
| Identification of potential cell-cell interactions between two cell types and their ligand-receptor pairs for different disease states |
| Ligand | Receptor | LRpair | Pathway | Tissue | Disease Stage |
| Page: 1 |
Top |
Single-cell gene regulatory network inference analysis |
| Find out the significant the regulons (TFs) and the target genes of each regulon across cell types for different disease states |
| TF | Cell Type | Tissue | Disease Stage | Target Gene | RSS | Regulon Activity |
| ∗The dot plots of a searched regulon are shown for all cell subpopulations in each disease state of each tissue based on the regulon specific score inferred using pySCENIC and by calculating the average expression. |
| Page: 1 |
Top |
Somatic mutation of malignant transformation related genes |
| Annotation of somatic variants for genes involved in malignant transformation |
| Hugo Symbol | Variant Class | Variant Classification | dbSNP RS | HGVSc | HGVSp | HGVSp Short | SWISSPROT | BIOTYPE | SIFT | PolyPhen | Tumor Sample Barcode | Tissue | Histology | Sex | Age | Stage | Therapy Types | Drugs | Outcome |
| ANKHD1 | SNV | Missense_Mutation | novel | c.1635N>T | p.Glu545Asp | p.E545D | Q8IWZ3 | protein_coding | deleterious(0.01) | probably_damaging(0.989) | TCGA-A1-A0SI-01 | Breast | breast invasive carcinoma | Female | <65 | I/II | Unknown | Unknown | SD |
| ANKHD1 | SNV | Missense_Mutation | novel | c.6194N>C | p.His2065Pro | p.H2065P | Q8IWZ3 | protein_coding | tolerated_low_confidence(0.32) | benign(0.026) | TCGA-A2-A0CS-01 | Breast | breast invasive carcinoma | Female | >=65 | III/IV | Hormone Therapy | anastrozole | SD |
| ANKHD1 | SNV | Missense_Mutation | rs770326358 | c.817A>C | p.Ile273Leu | p.I273L | Q8IWZ3 | protein_coding | tolerated(0.09) | probably_damaging(0.956) | TCGA-A2-A0CV-01 | Breast | breast invasive carcinoma | Female | <65 | I/II | Chemotherapy | cytoxan | SD |
| ANKHD1 | SNV | Missense_Mutation | c.1529C>G | p.Thr510Ser | p.T510S | Q8IWZ3 | protein_coding | tolerated(0.08) | probably_damaging(0.989) | TCGA-A2-A1G6-01 | Breast | breast invasive carcinoma | Female | <65 | III/IV | Chemotherapy | adriamycin | SD | |
| ANKHD1 | SNV | Missense_Mutation | novel | c.4187N>A | p.Thr1396Lys | p.T1396K | Q8IWZ3 | protein_coding | deleterious(0) | probably_damaging(0.987) | TCGA-A7-A26I-01 | Breast | breast invasive carcinoma | Female | >=65 | I/II | Chemotherapy | cytoxan | SD |
| ANKHD1 | SNV | Missense_Mutation | rs755308583 | c.2843N>A | p.Ser948Tyr | p.S948Y | Q8IWZ3 | protein_coding | deleterious_low_confidence(0.02) | possibly_damaging(0.758) | TCGA-AN-A046-01 | Breast | breast invasive carcinoma | Female | >=65 | I/II | Unknown | Unknown | SD |
| ANKHD1 | SNV | Missense_Mutation | c.2968C>G | p.Gln990Glu | p.Q990E | Q8IWZ3 | protein_coding | deleterious_low_confidence(0.03) | possibly_damaging(0.9) | TCGA-B6-A0RQ-01 | Breast | breast invasive carcinoma | Female | >=65 | I/II | Unknown | Unknown | SD | |
| ANKHD1 | SNV | Missense_Mutation | c.3946G>T | p.Ala1316Ser | p.A1316S | Q8IWZ3 | protein_coding | deleterious(0.03) | benign(0.106) | TCGA-BH-A0DK-01 | Breast | breast invasive carcinoma | Female | <65 | I/II | Hormone Therapy | tamoxiphen | SD | |
| ANKHD1 | SNV | Missense_Mutation | c.524T>C | p.Leu175Pro | p.L175P | Q8IWZ3 | protein_coding | deleterious_low_confidence(0) | probably_damaging(0.995) | TCGA-BH-A18G-01 | Breast | breast invasive carcinoma | Female | >=65 | I/II | Unknown | Unknown | SD | |
| ANKHD1 | SNV | Missense_Mutation | c.5539N>G | p.Leu1847Val | p.L1847V | Q8IWZ3 | protein_coding | deleterious_low_confidence(0) | benign(0.301) | TCGA-BH-A18P-01 | Breast | breast invasive carcinoma | Female | <65 | I/II | Unknown | Unknown | PD |
| Page: 1 2 3 4 5 6 7 8 9 10 11 12 13 14 15 16 17 18 19 20 21 22 23 24 25 |
Top |
Related drugs of malignant transformation related genes |
| Identification of chemicals and drugs interact with genes involved in malignant transfromation |
| (DGIdb 4.0) |
| Entrez ID | Symbol | Category | Interaction Types | Drug Claim Name | Drug Name | PMIDs |
| Page: 1 |

Copyright 2023-Present -The University of Texas Health Science Center at Houston |