|
|
||||||||
|
||||||||

Gene summary for ITGA1 |
| Gene Symbol | ITGA1 | Gene ID | 3672 |
| Gene name | integrin subunit alpha 1 |
| Synonyms | CD49A;VLA1 |
| Type of gene | protein_coding |
| UniProtAcc | P56199 |
| GO ID | GO term |
| GO:0007155 | cell adhesion |
| GO:0007229 | integrin-mediated signaling pathway |
| GO:0008285 | negative regulation of cell population proliferation |
| GO:0098609 | cell-cell adhesion |
| GO:0007160 | cell-matrix adhesion |
| GO:0033627 | cell adhesion mediated by integrin |
| GO:0032516 | positive regulation of phosphoprotein phosphatase activity |
| GO:0042059 | negative regulation of epidermal growth factor receptor signaling pathway |
| GO:0030593 | neutrophil chemotaxis |
| GO:0042311 | vasodilation |
| GO:0043410 | positive regulation of MAPK cascade |
| GO:0043525 | positive regulation of neuron apoptotic process |
| GO:0045123 | cellular extravasation |
| GO:0048812 | neuron projection morphogenesis |
| GO:0060326 | cell chemotaxis |
Top |
Literatures describing the association of ITGA1 and immune escape mechanisms |
Top |
Comparison of the ITGA1 expression level between tumor and normal groups |
Top |
Comparison of the ITGA1 methylation level between tumor and normal groups |
No significant differences were found in ITGA1 methylation in promoter region.
No significant differences were found in ITGA1 methylation in genebody region.
Top |
Summary of the copy number in TCGA tumor samples |
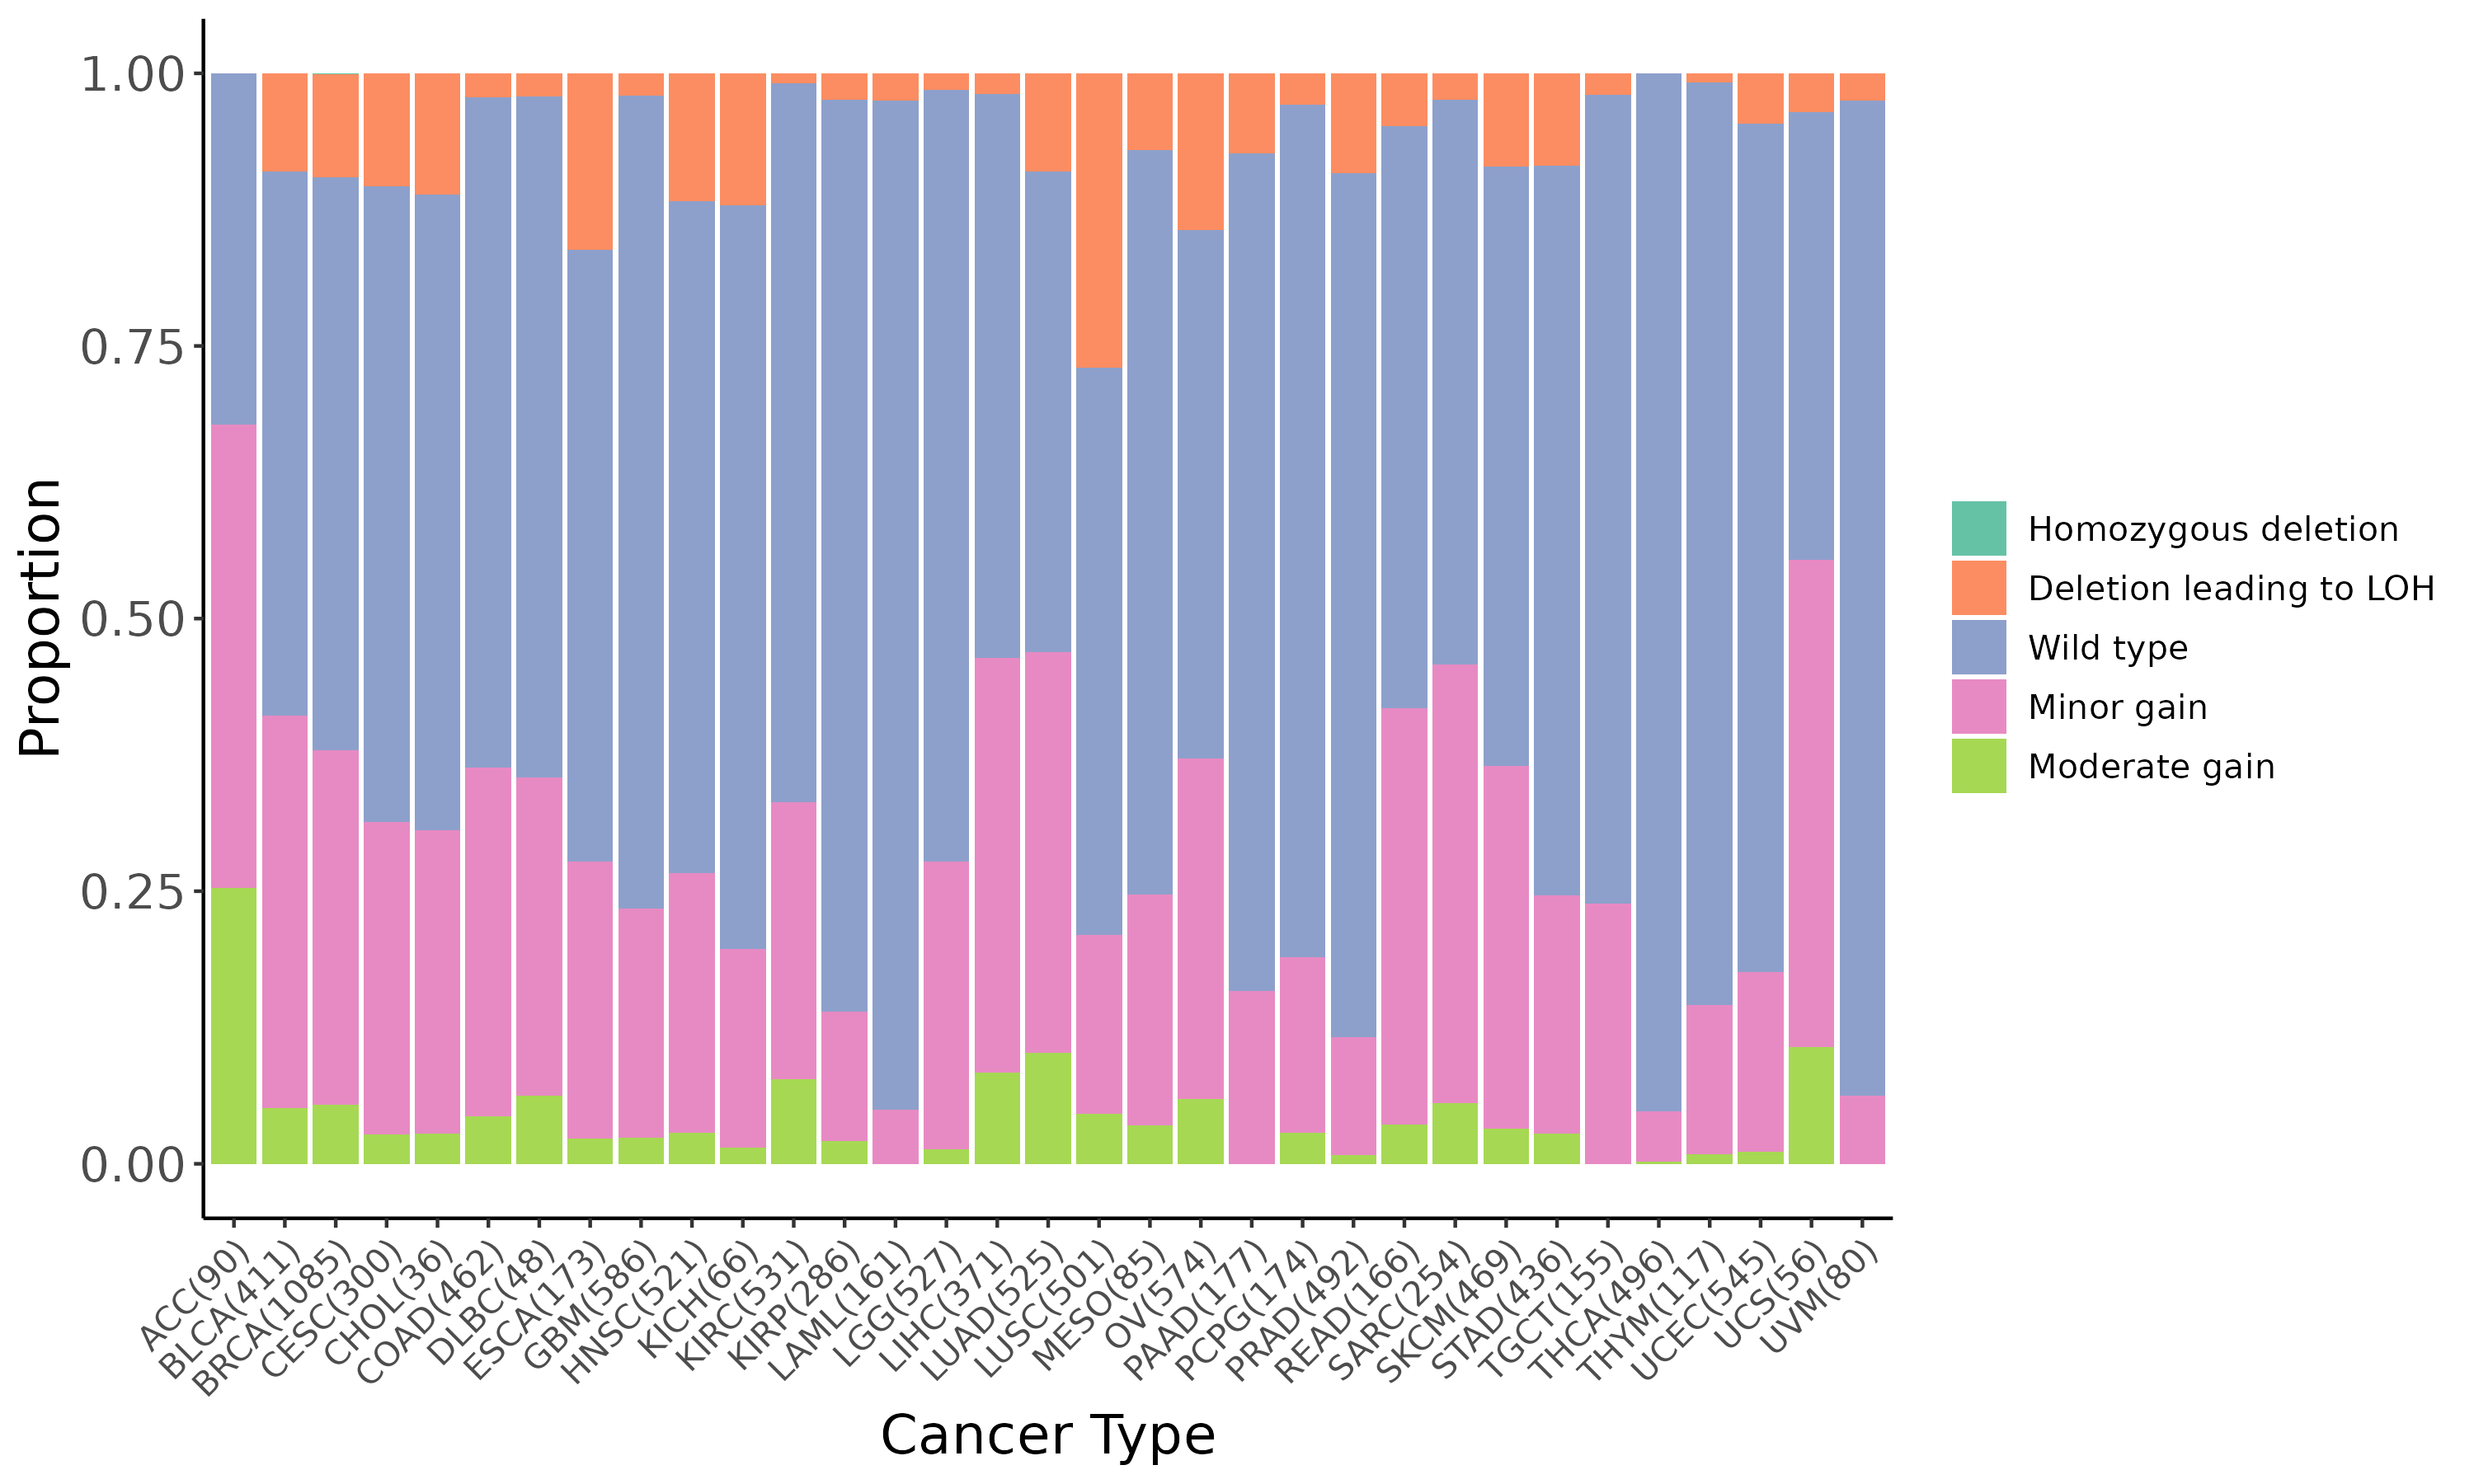 |
Top |
DEGs and the enrichment analysis between the mutated and wild type groups |
| Gene ID | Symbol | Log2 Fold Change | P-value | Adjusted P-value |
|---|---|---|---|---|
| ENSG00000091704 | CPA1 | -4.04e+00 | 1.93e-03 | 2.84e-02 |
| ENSG00000262185 | RP11-462G12.1 | -1.72e+00 | 1.93e-03 | 2.85e-02 |
| ENSG00000079156 | OSBPL6 | -2.33e+00 | 1.94e-03 | 2.85e-02 |
| ENSG00000248896 | CTD-2135J3.3 | -1.45e+00 | 1.94e-03 | 2.86e-02 |
| ENSG00000142494 | SLC47A1 | -2.20e+00 | 1.95e-03 | 2.86e-02 |
| ENSG00000287609 | NA | -5.14e+00 | 1.95e-03 | 2.86e-02 |
| ENSG00000072864 | NDE1 | -1.00e+00 | 1.95e-03 | 2.87e-02 |
| ENSG00000152910 | CNTNAP4 | -5.54e+00 | 1.96e-03 | 2.87e-02 |
| ENSG00000248898 | CTD-2288O8.1 | -2.40e+00 | 1.96e-03 | 2.88e-02 |
| ENSG00000241163 | LINC00877 | -2.22e+00 | 1.97e-03 | 2.89e-02 |
| ENSG00000104689 | TNFRSF10A | -1.14e+00 | 1.98e-03 | 2.89e-02 |
| ENSG00000056291 | NPFFR2 | -3.94e+00 | 1.99e-03 | 2.91e-02 |
| ENSG00000178562 | CD28 | -1.88e+00 | 2.00e-03 | 2.92e-02 |
| ENSG00000260763 | RP11-445O3.3 | -5.36e+00 | 2.00e-03 | 2.92e-02 |
| ENSG00000185518 | SV2B | -2.70e+00 | 2.01e-03 | 2.93e-02 |
| ENSG00000188820 | FAM26F | -2.71e+00 | 2.01e-03 | 2.93e-02 |
| ENSG00000065911 | MTHFD2 | -1.12e+00 | 2.01e-03 | 2.94e-02 |
| ENSG00000260517 | RP11-426C22.5 | -2.24e+00 | 2.02e-03 | 2.94e-02 |
| ENSG00000159339 | PADI4 | -2.39e+00 | 2.02e-03 | 2.94e-02 |
| ENSG00000239445 | ST3GAL6-AS1 | -2.05e+00 | 2.02e-03 | 2.94e-02 |
| Page: 1 2 ... 93 94 95 96 97 ... 126 127 |
Down-regulated KEGG pathways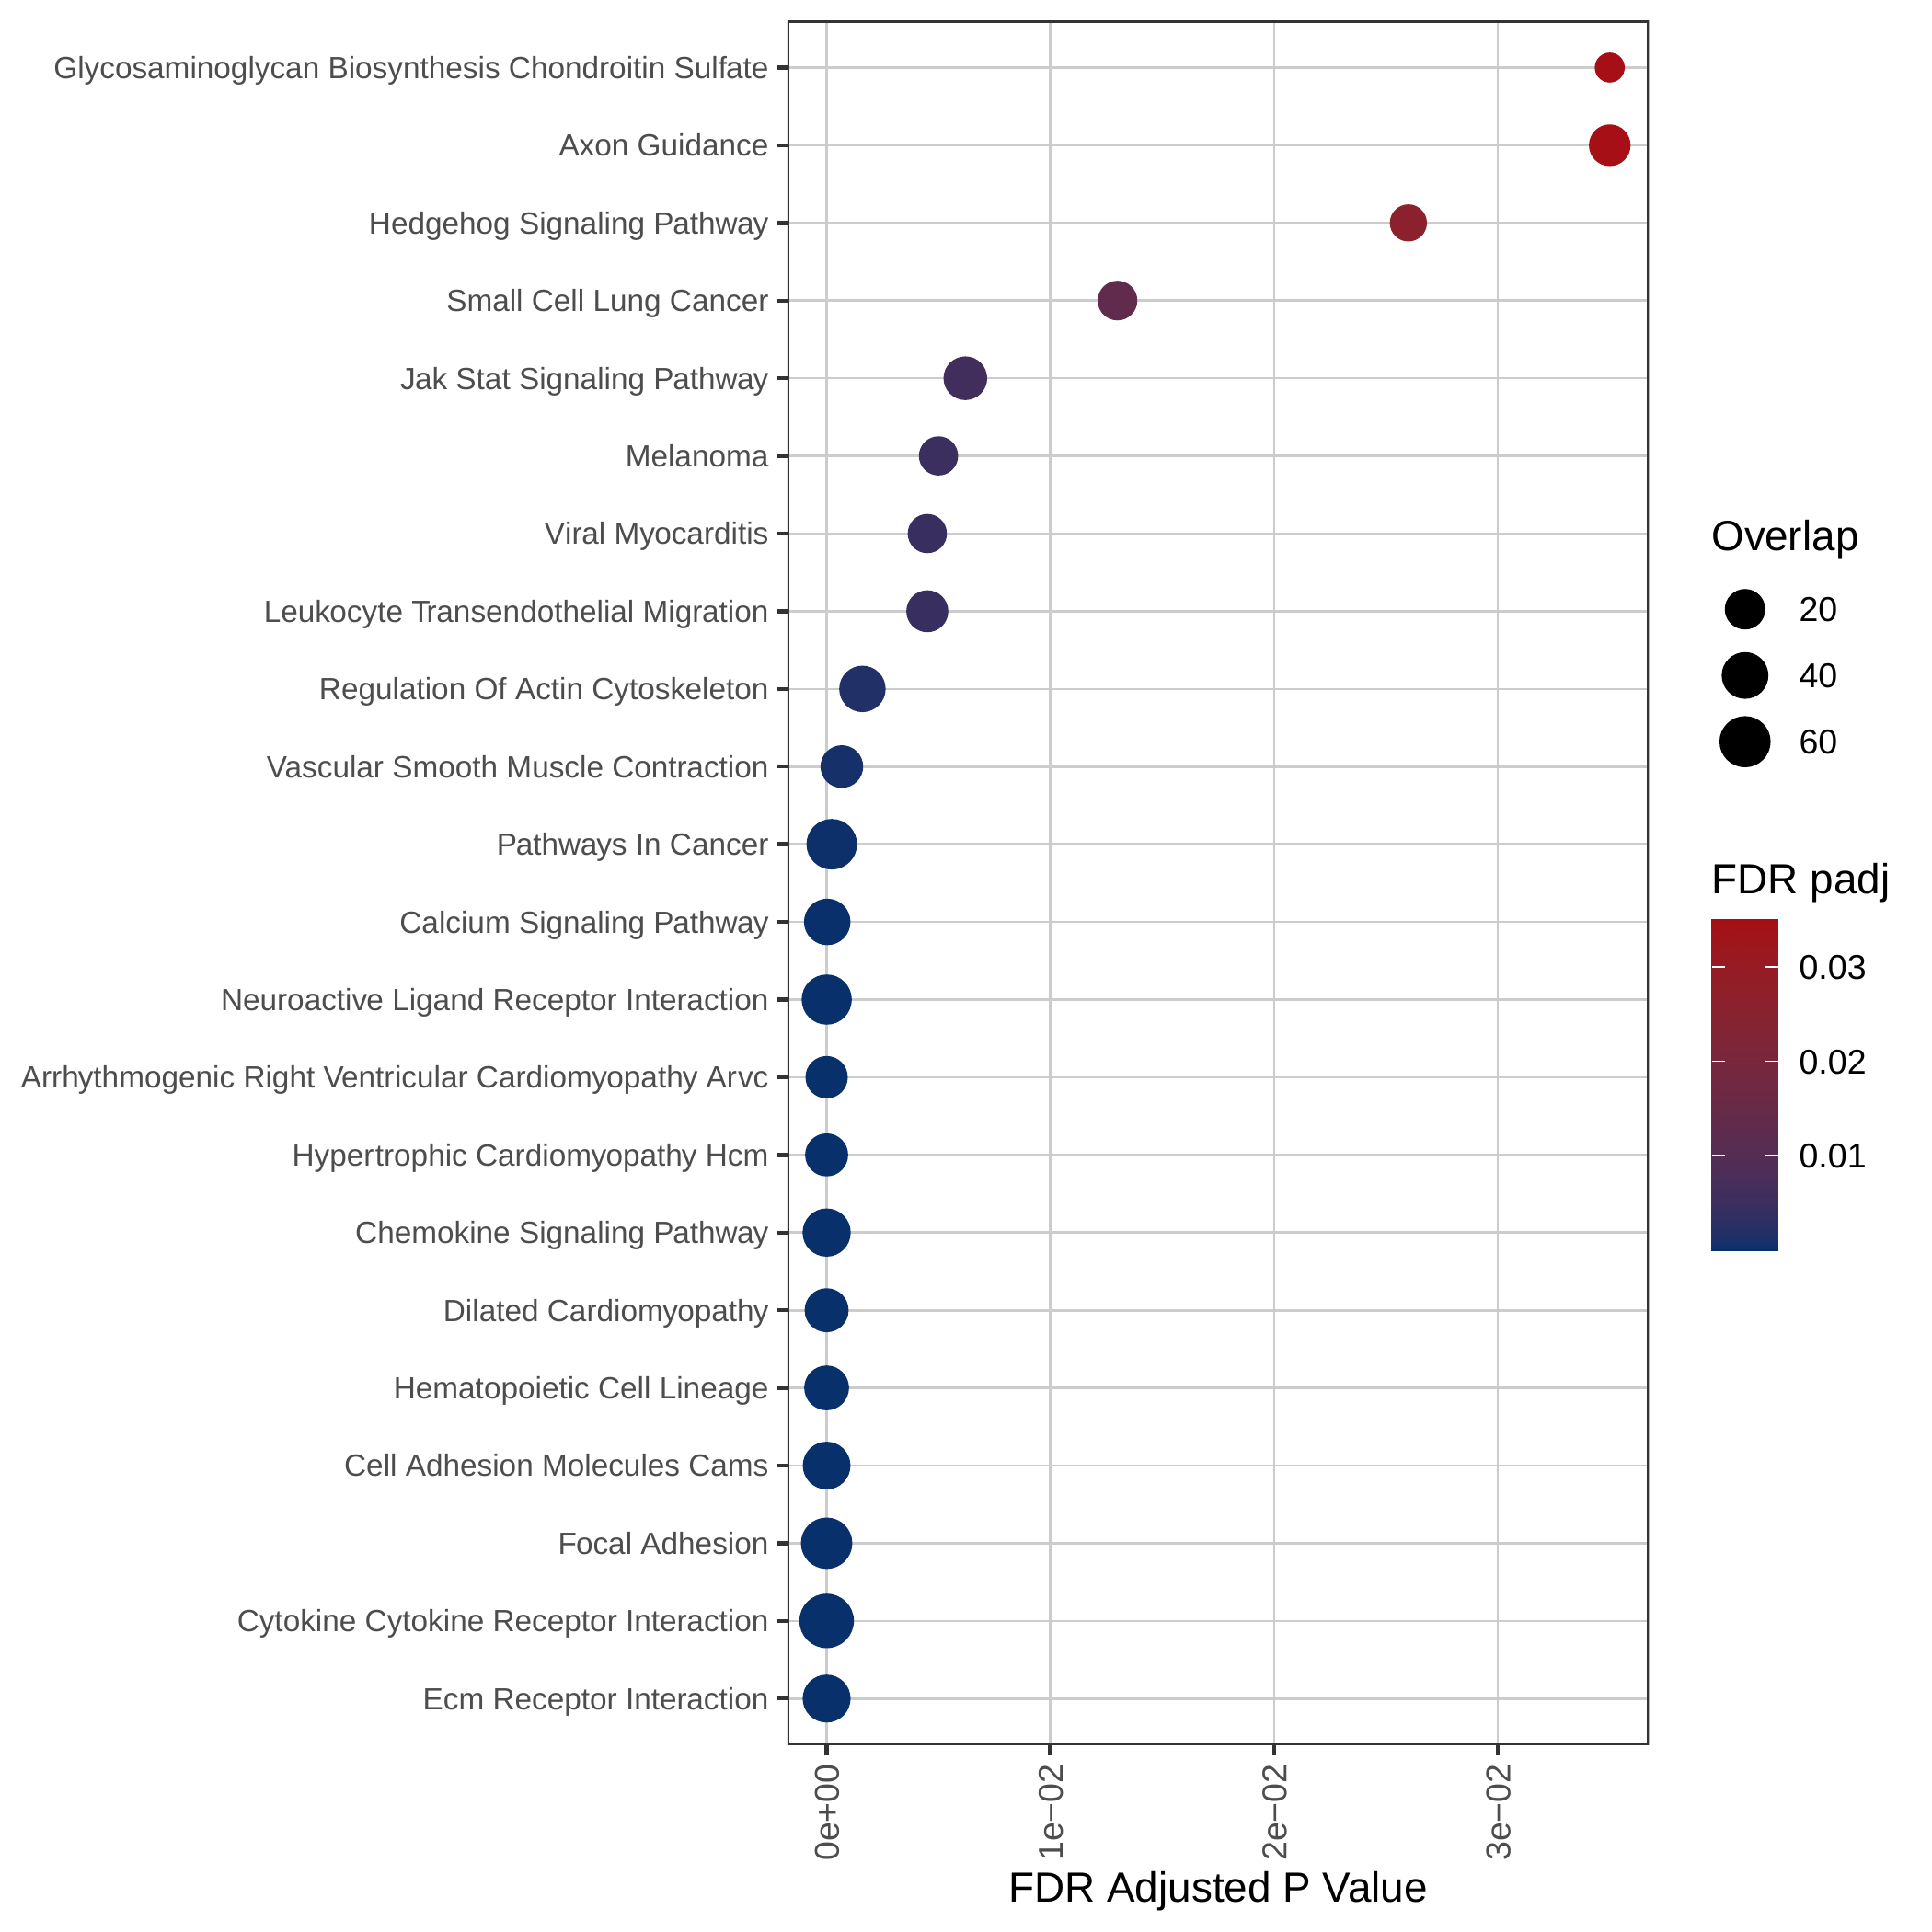 | Down-regulated GOBP pathways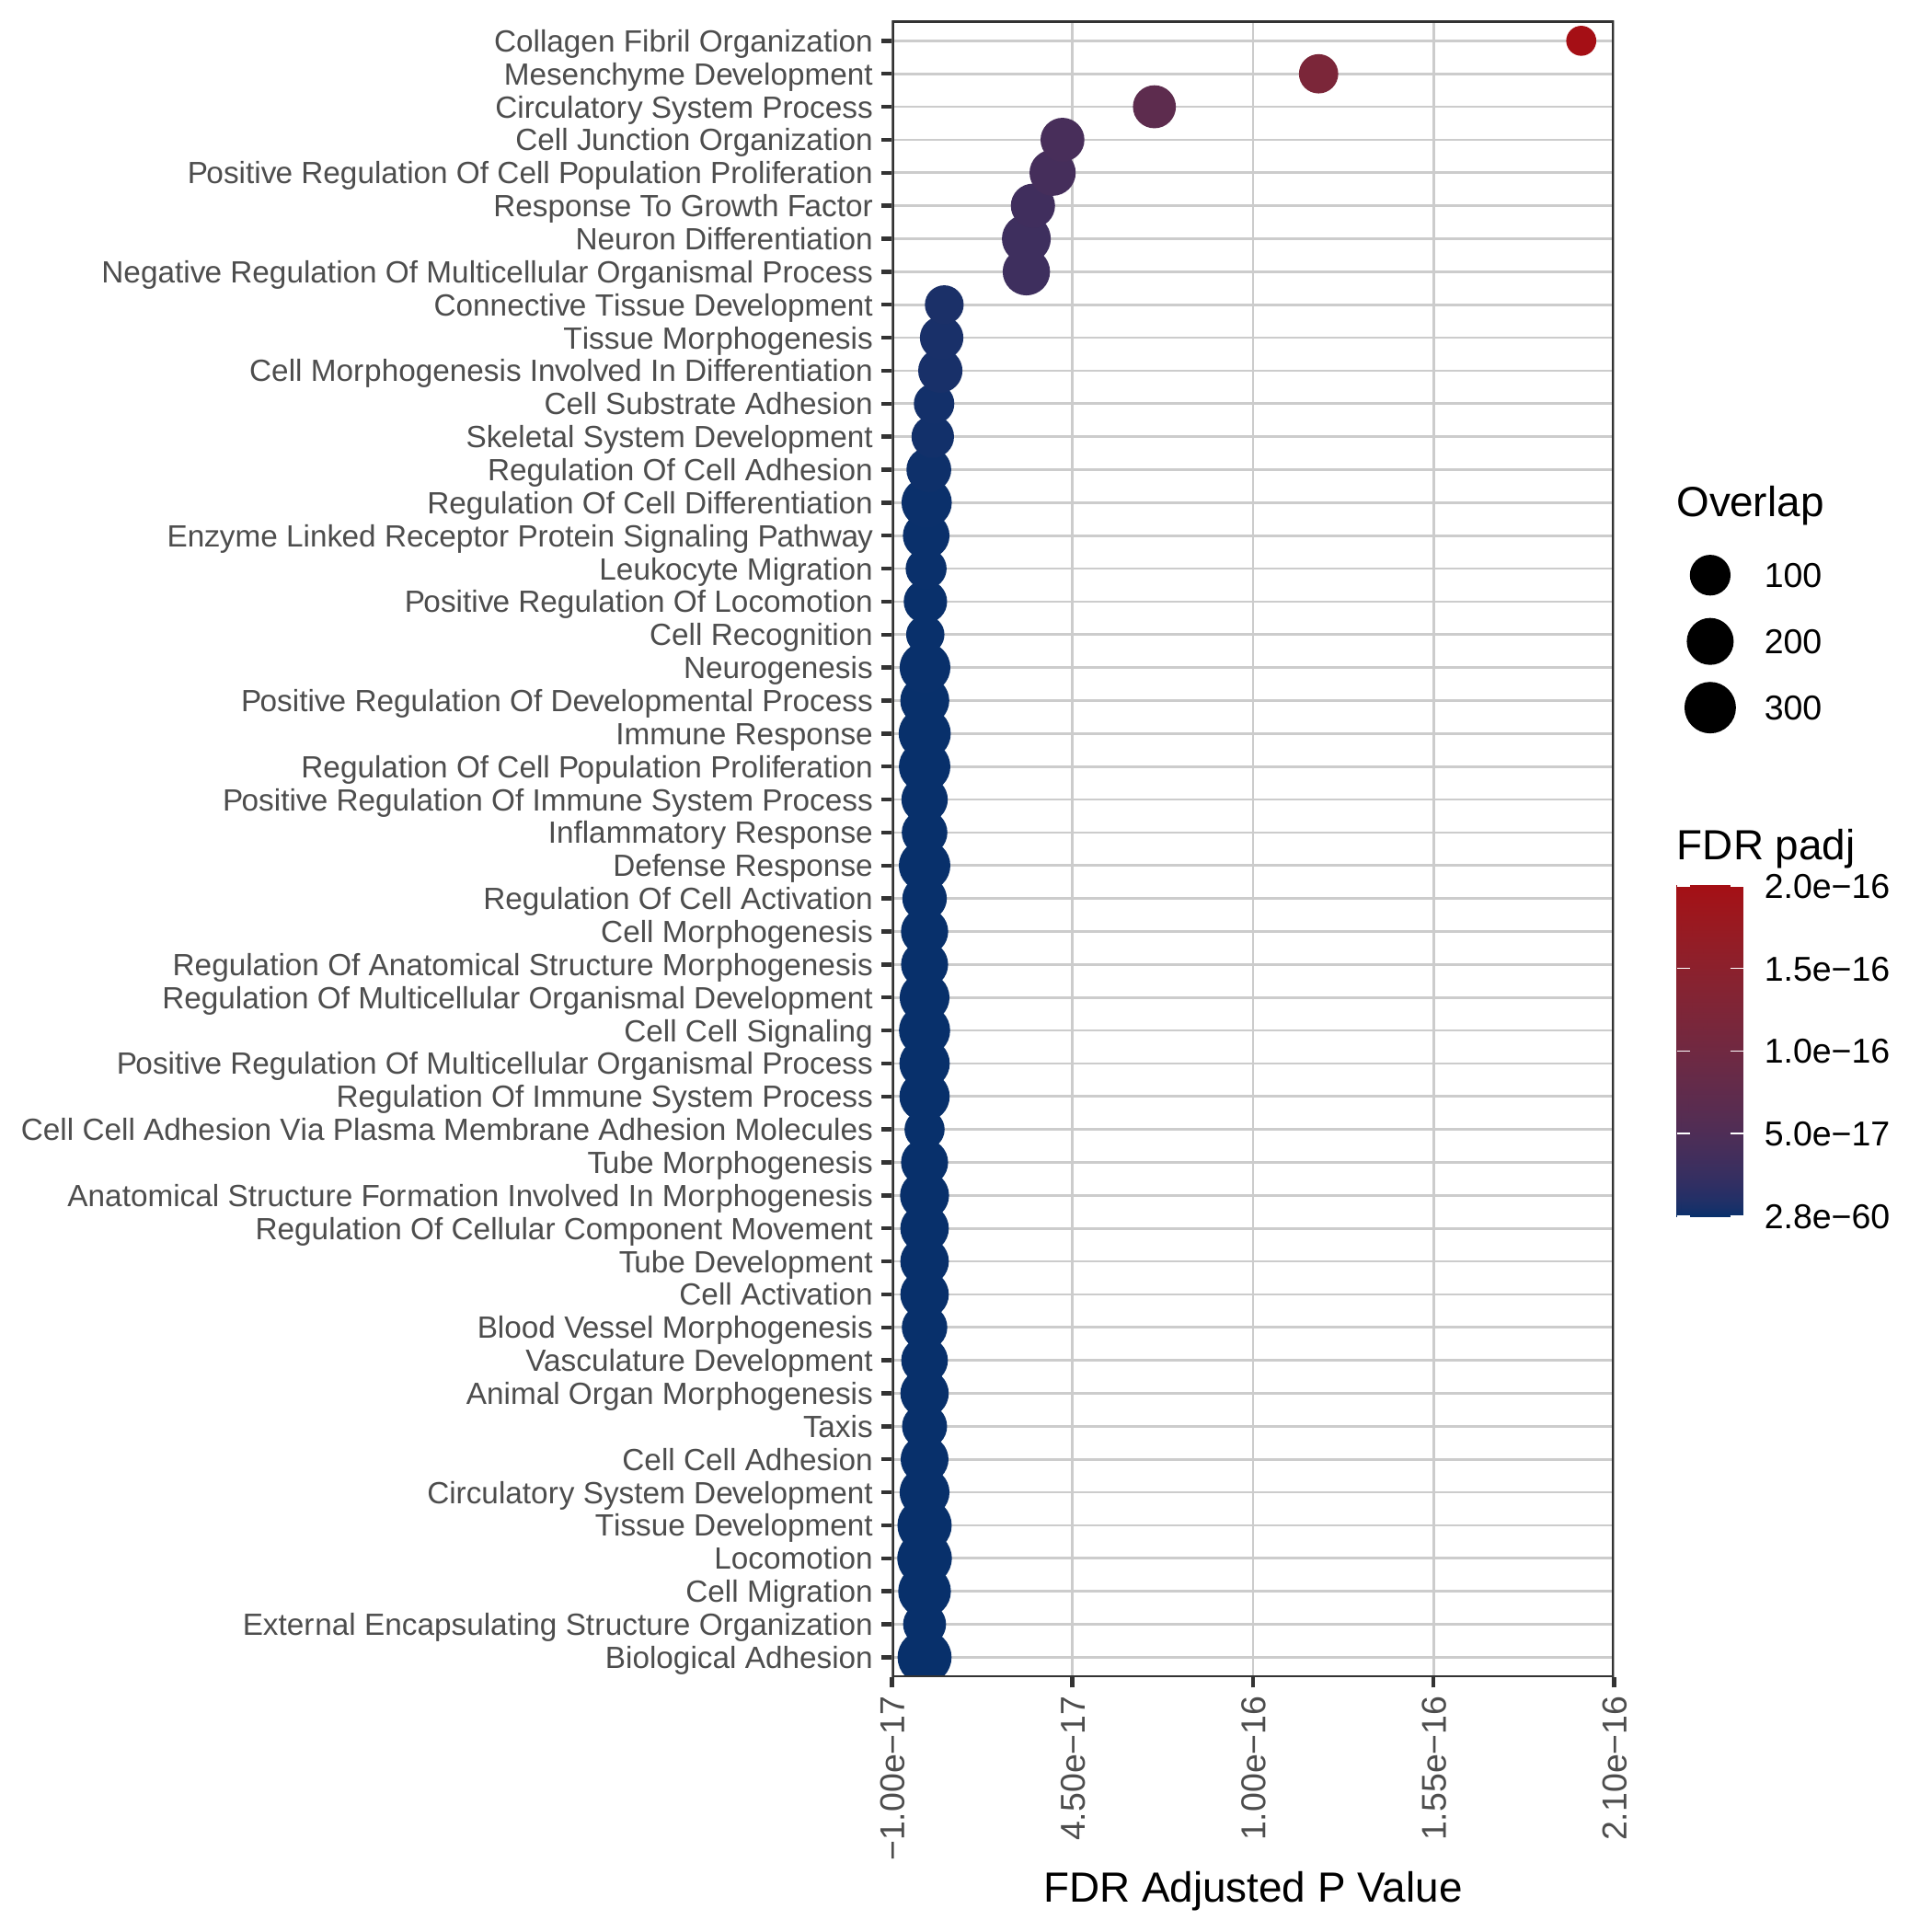 | Down-regulated Hallmark pathways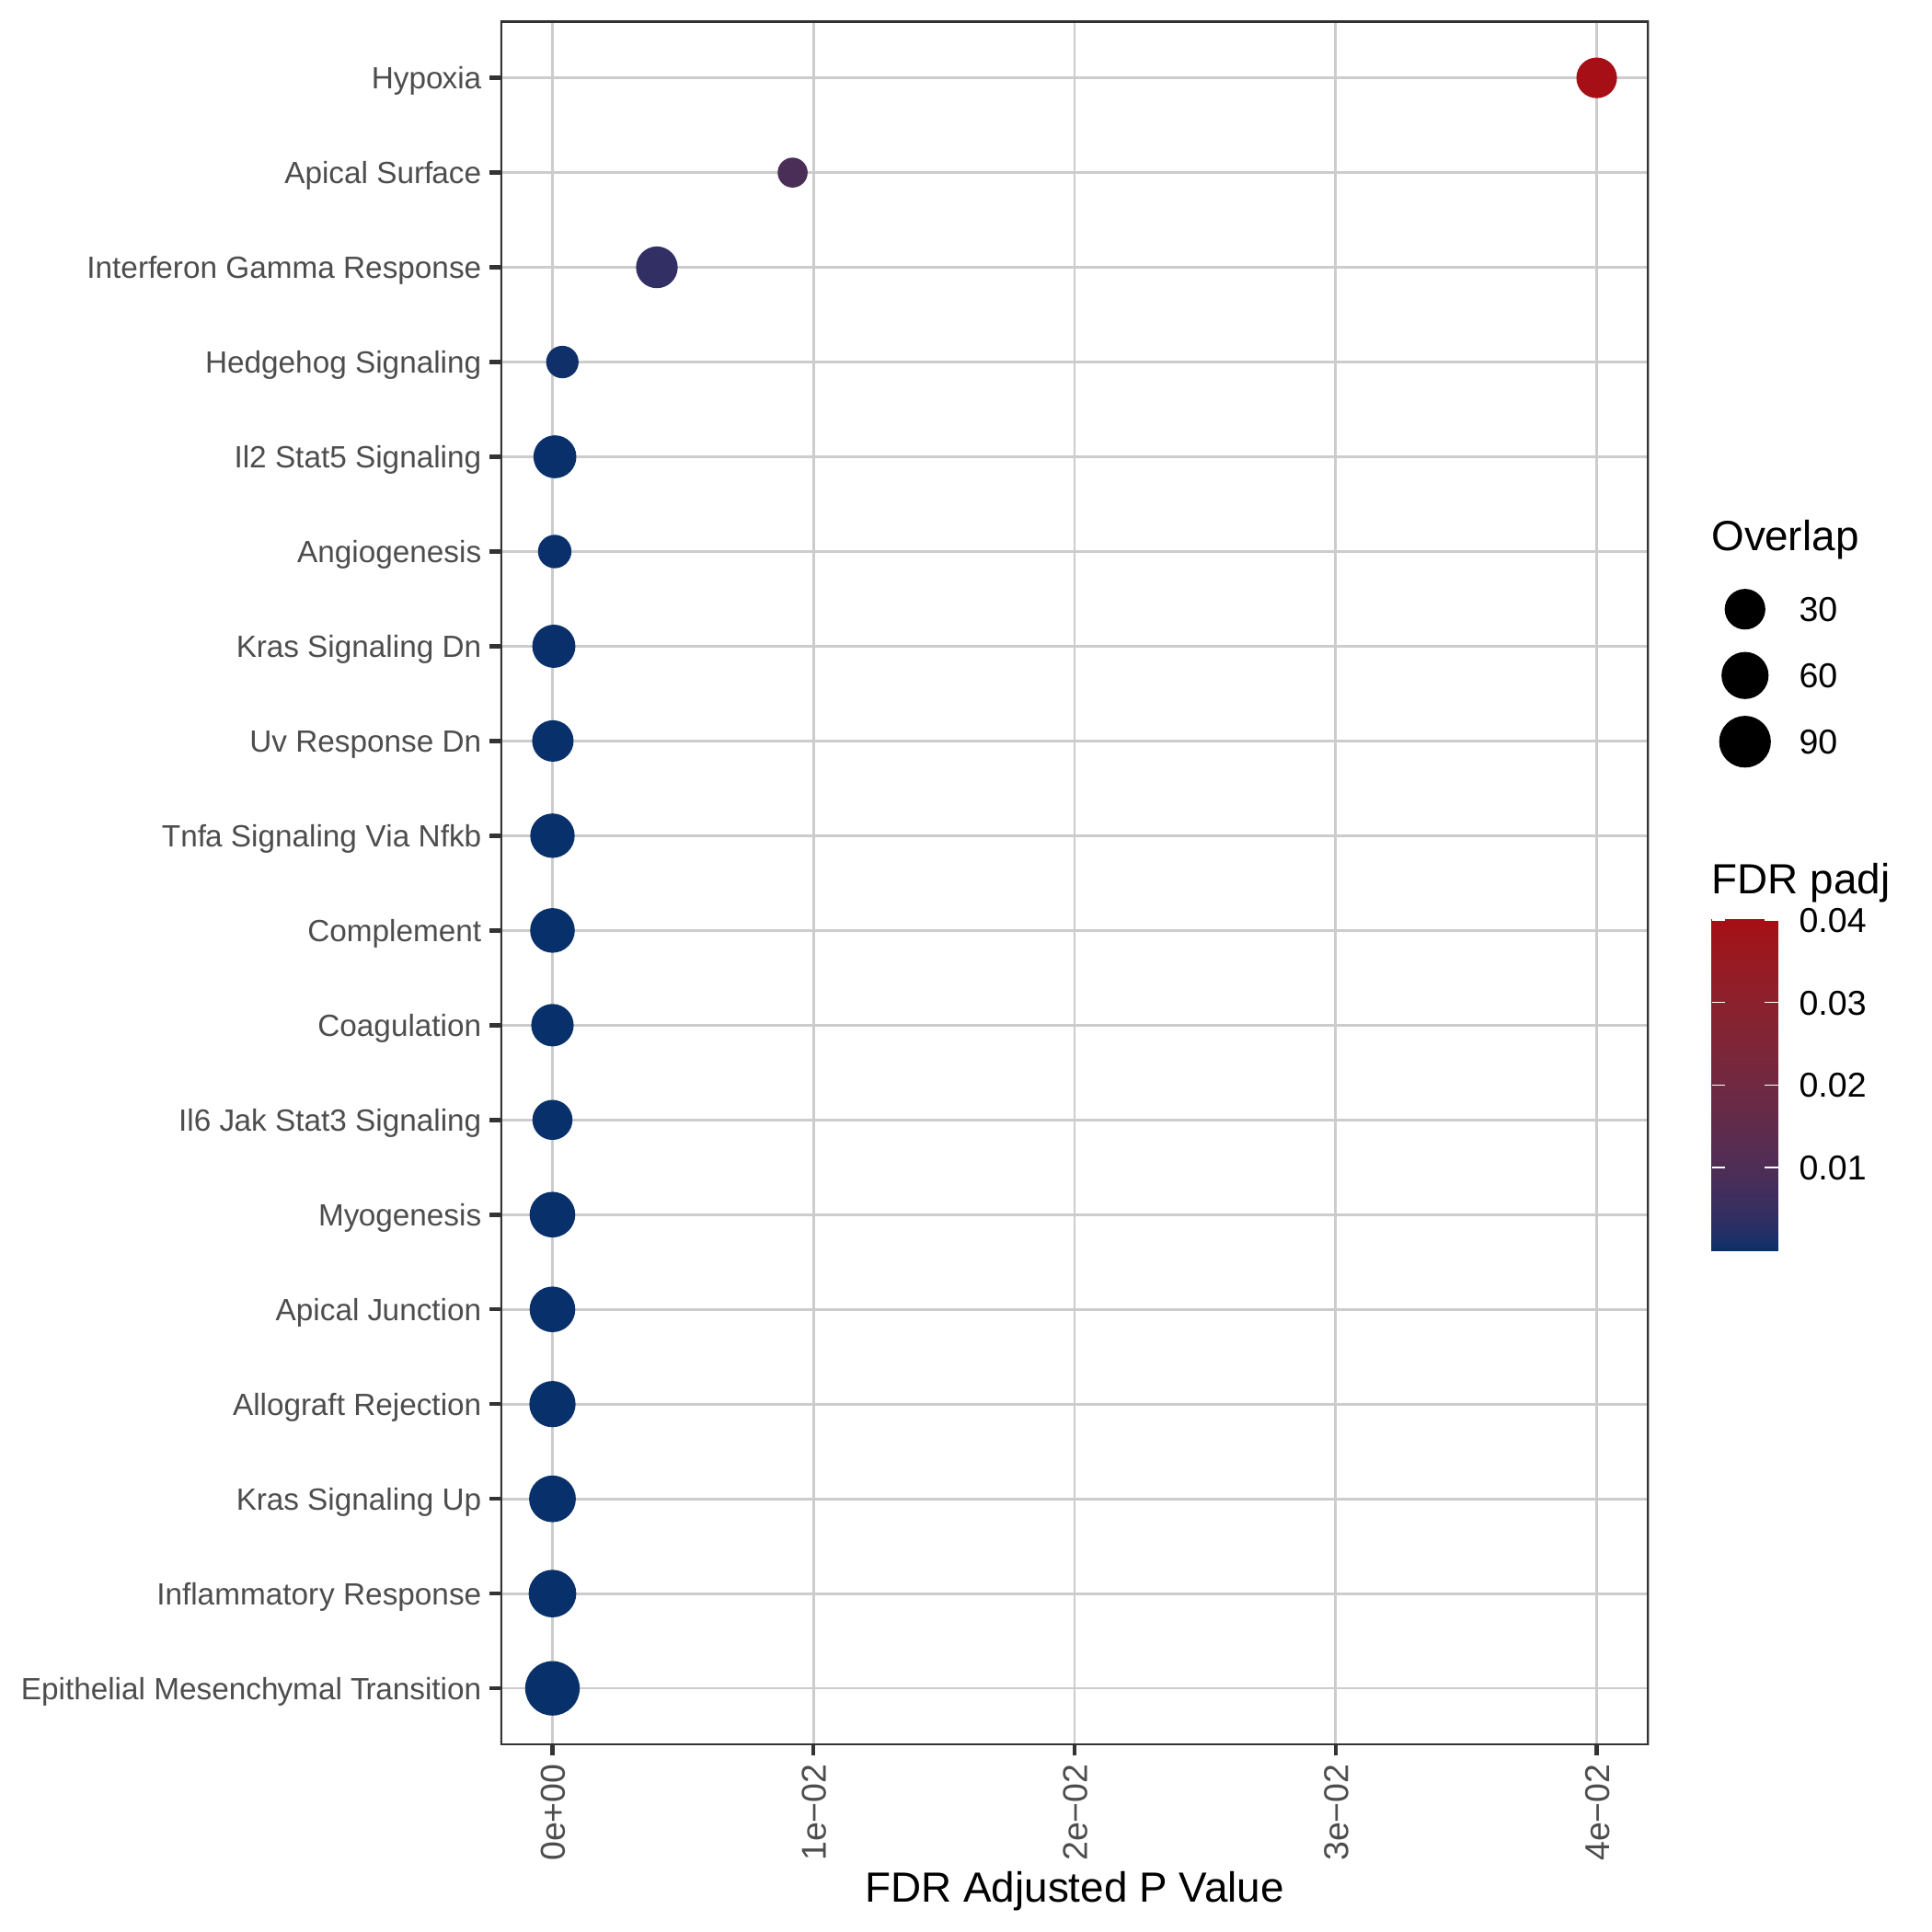 |
Gene expression and mutation differences between non-responders and responders after immunotherapy |
| Expression | Mutation |
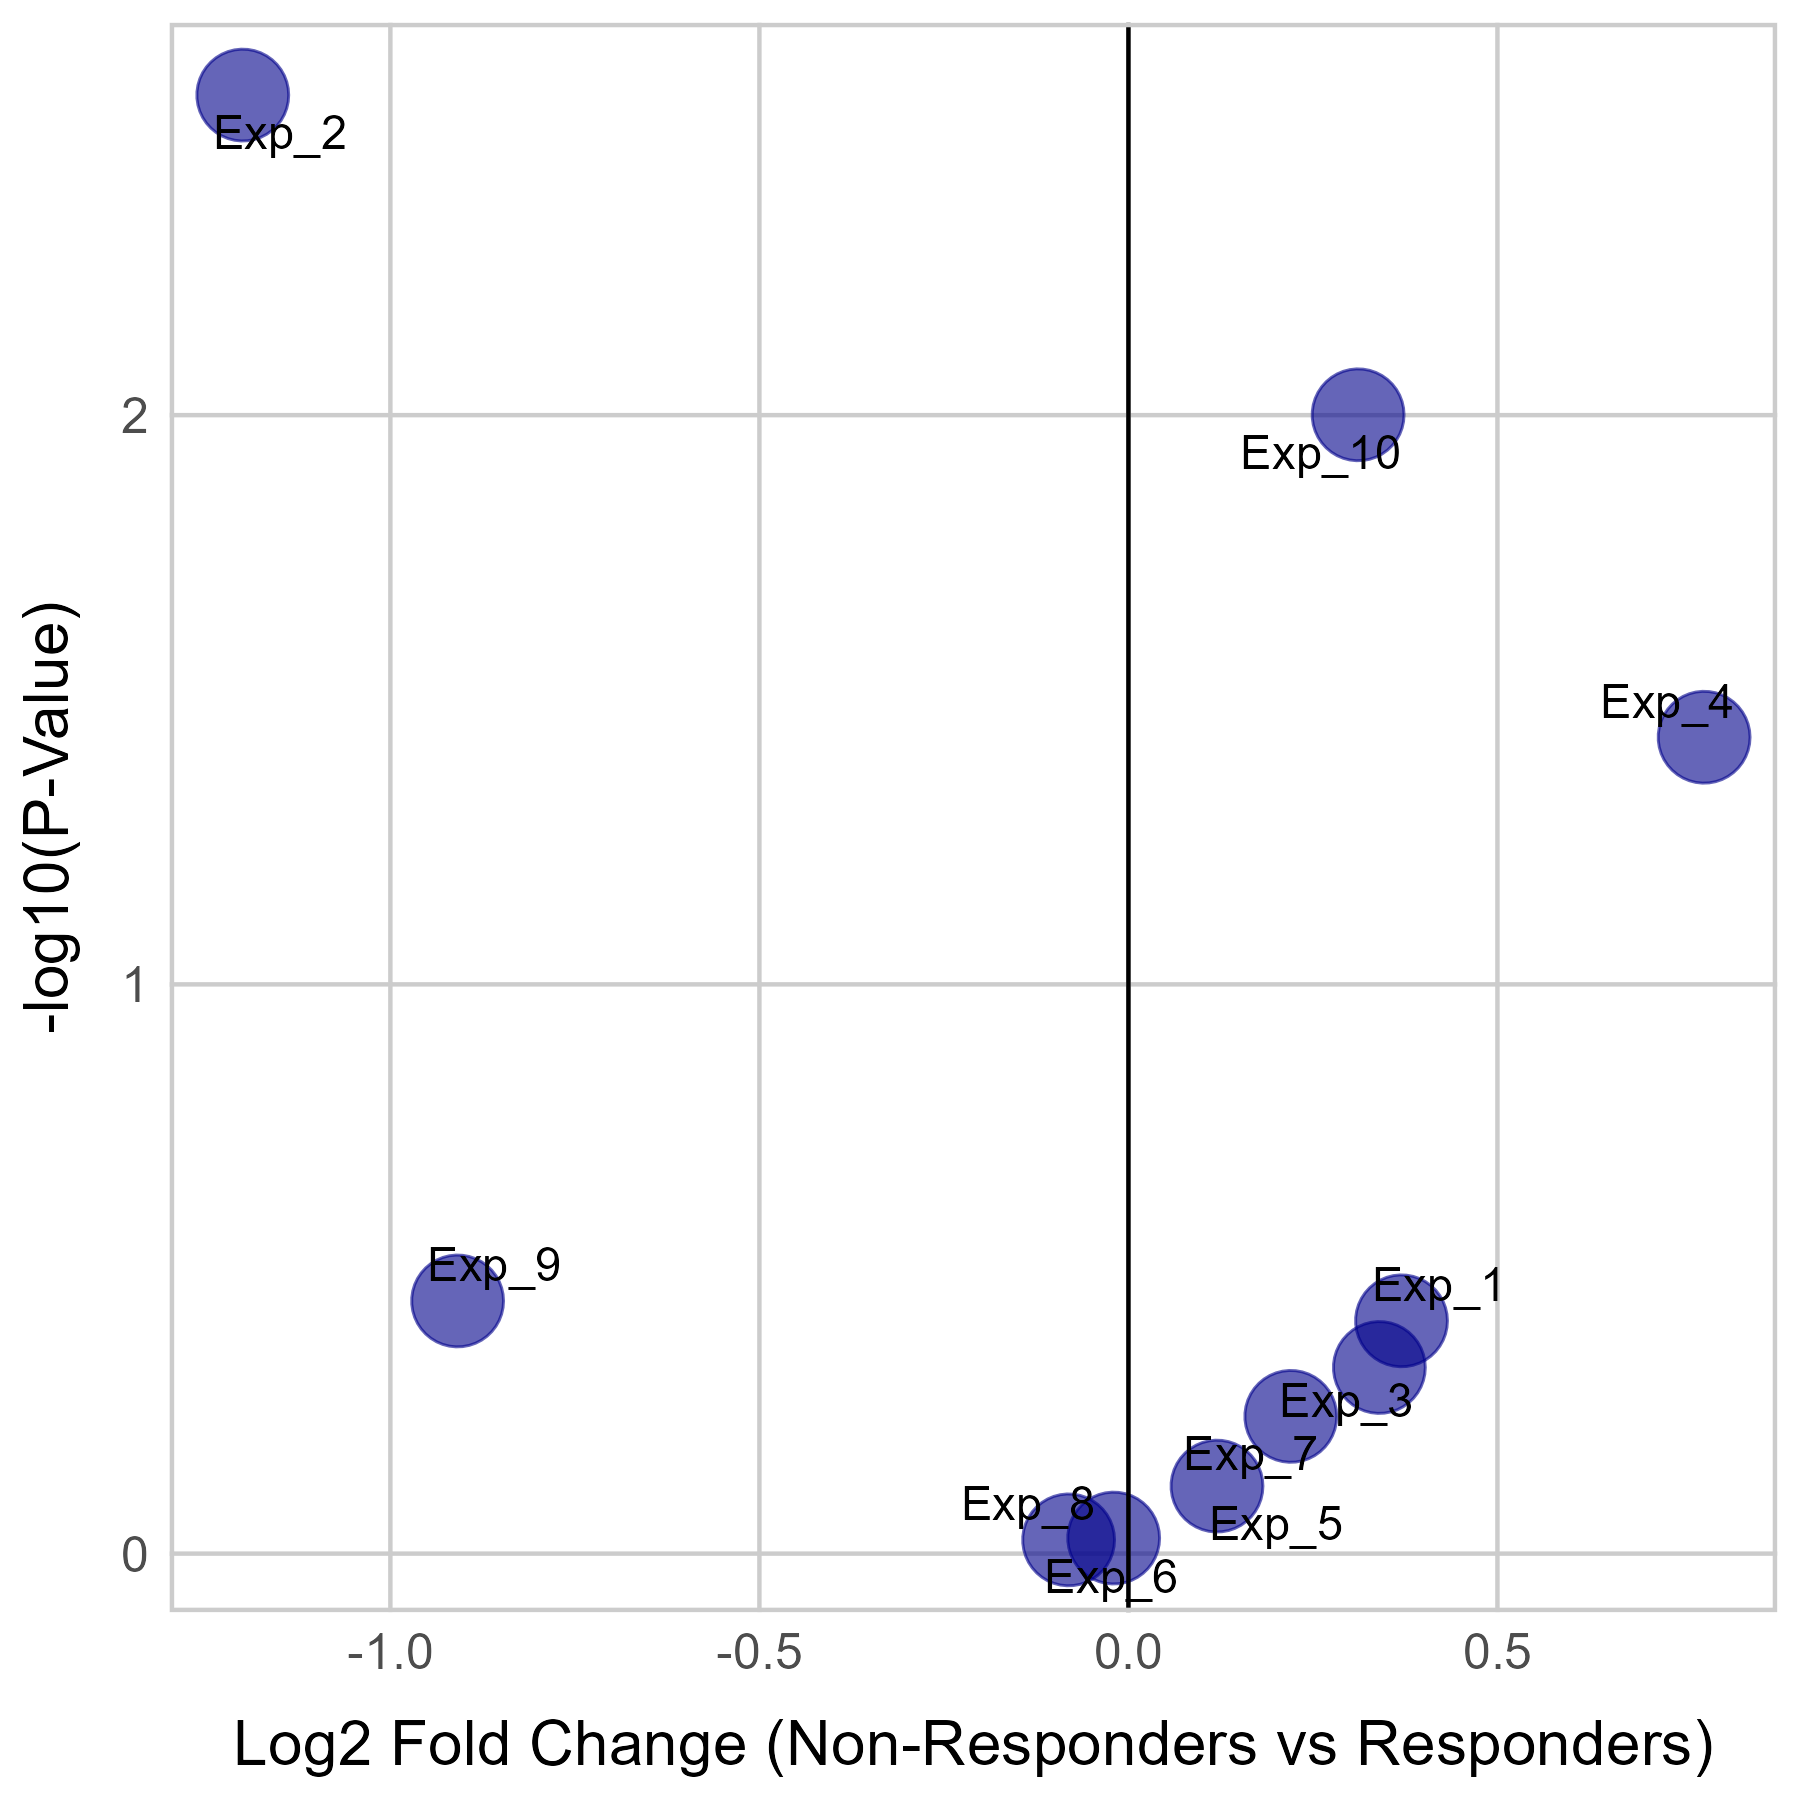 | 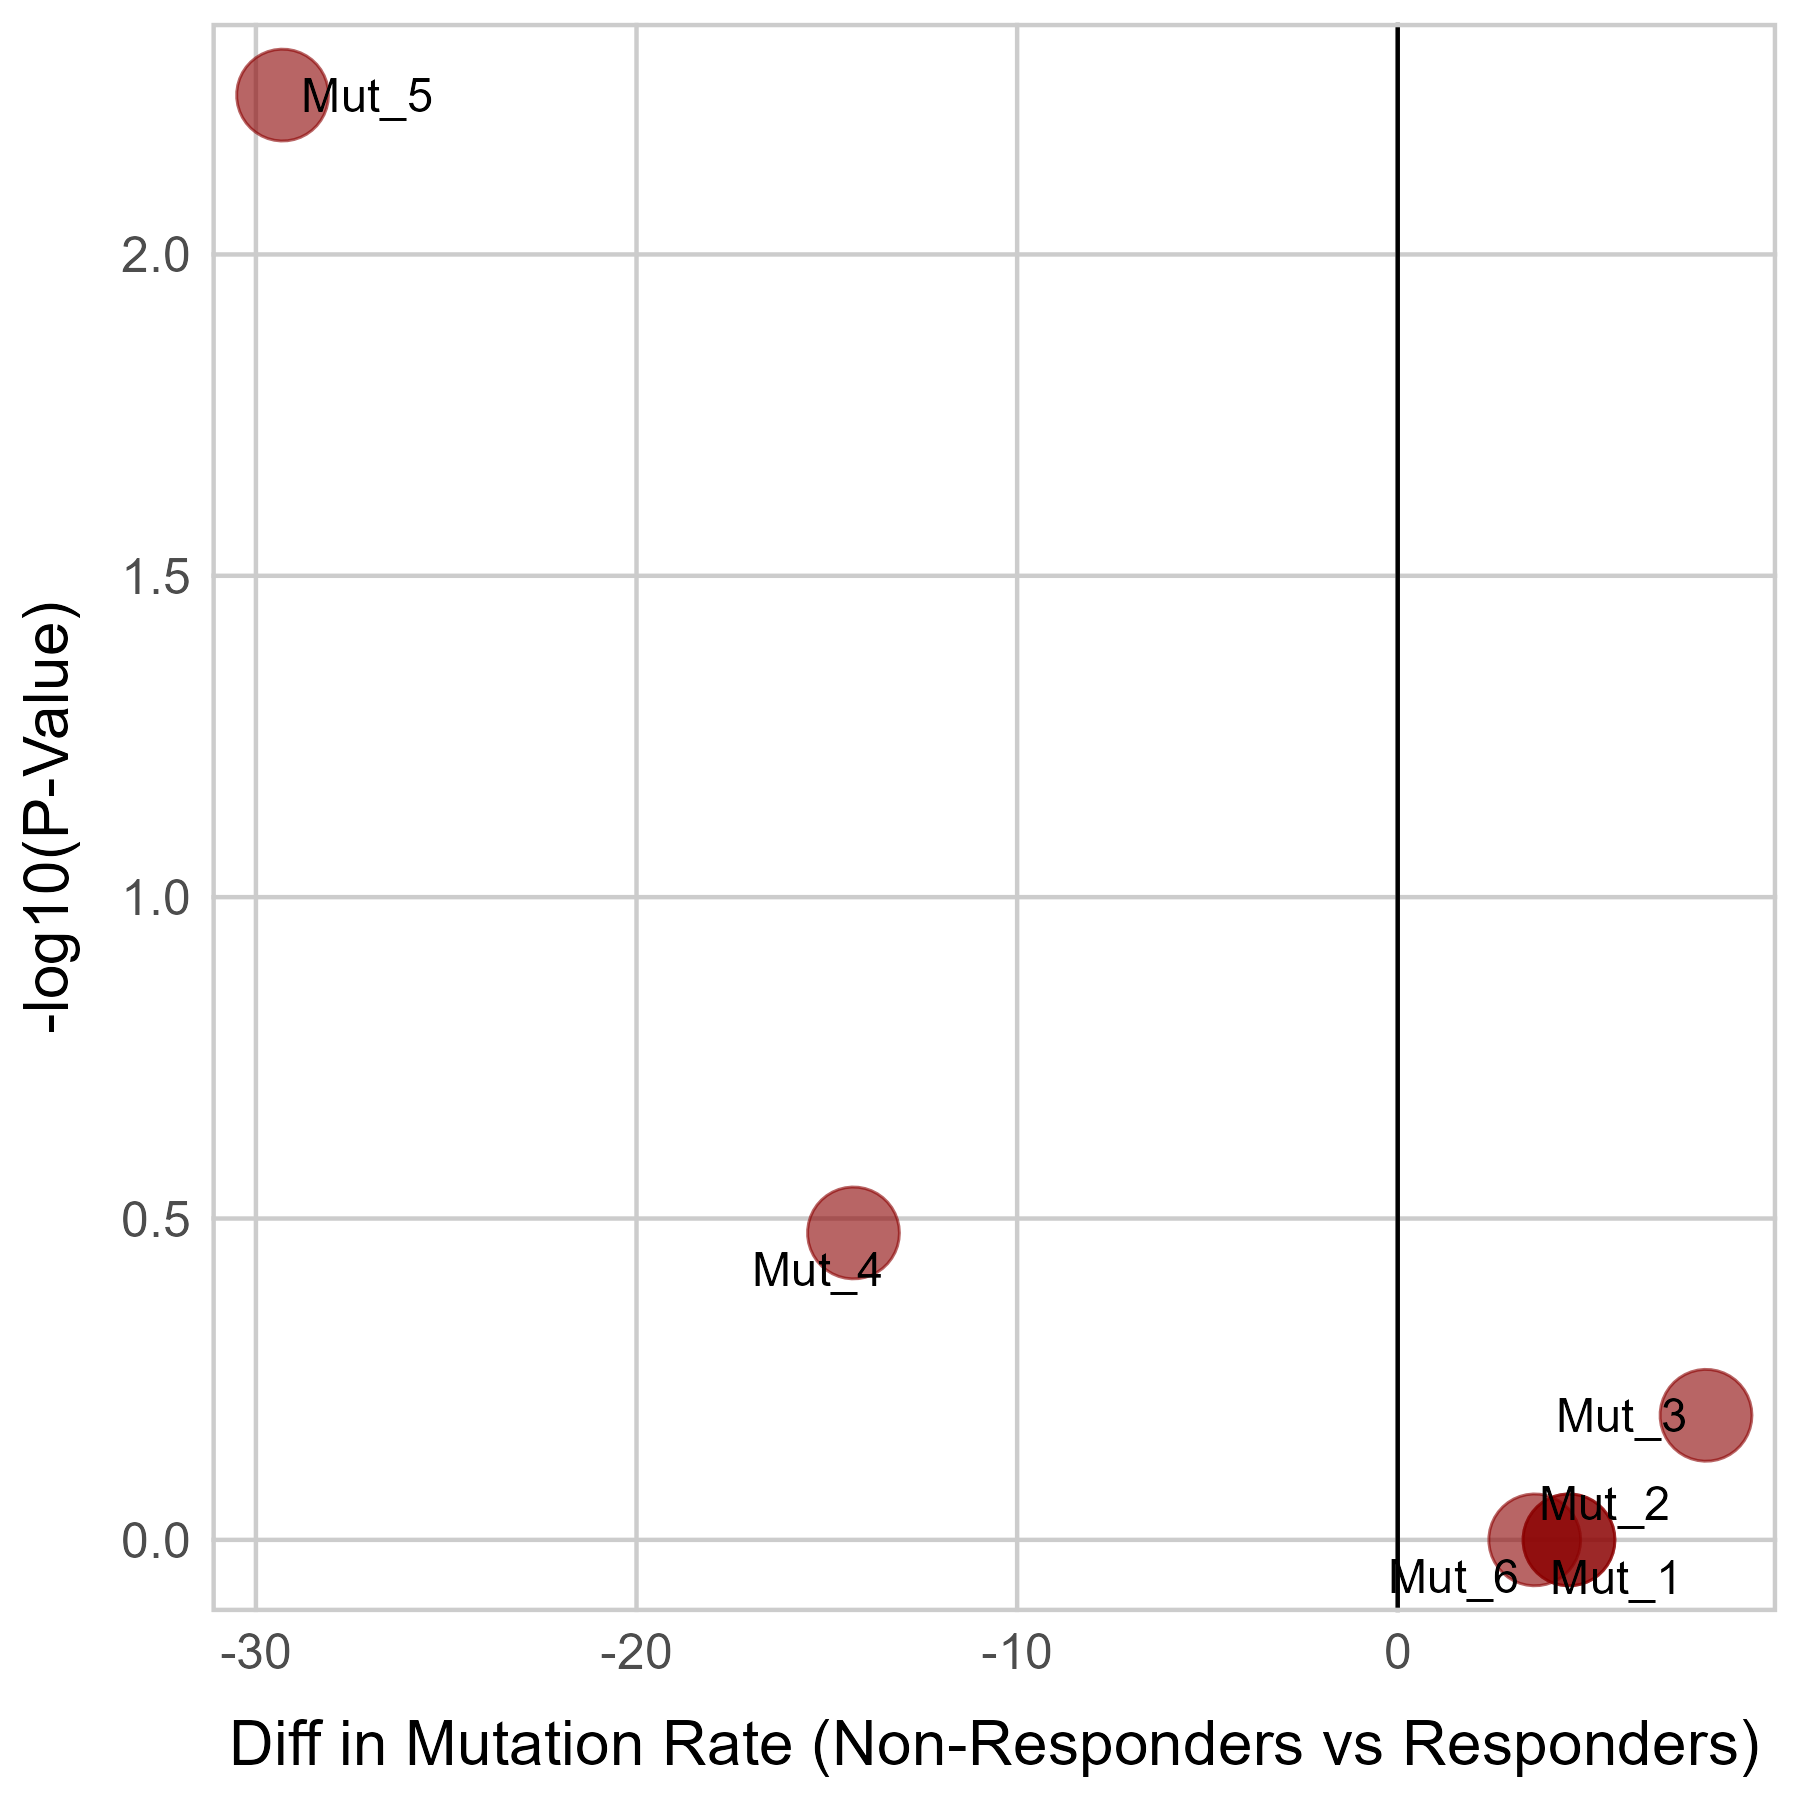 |
Top |
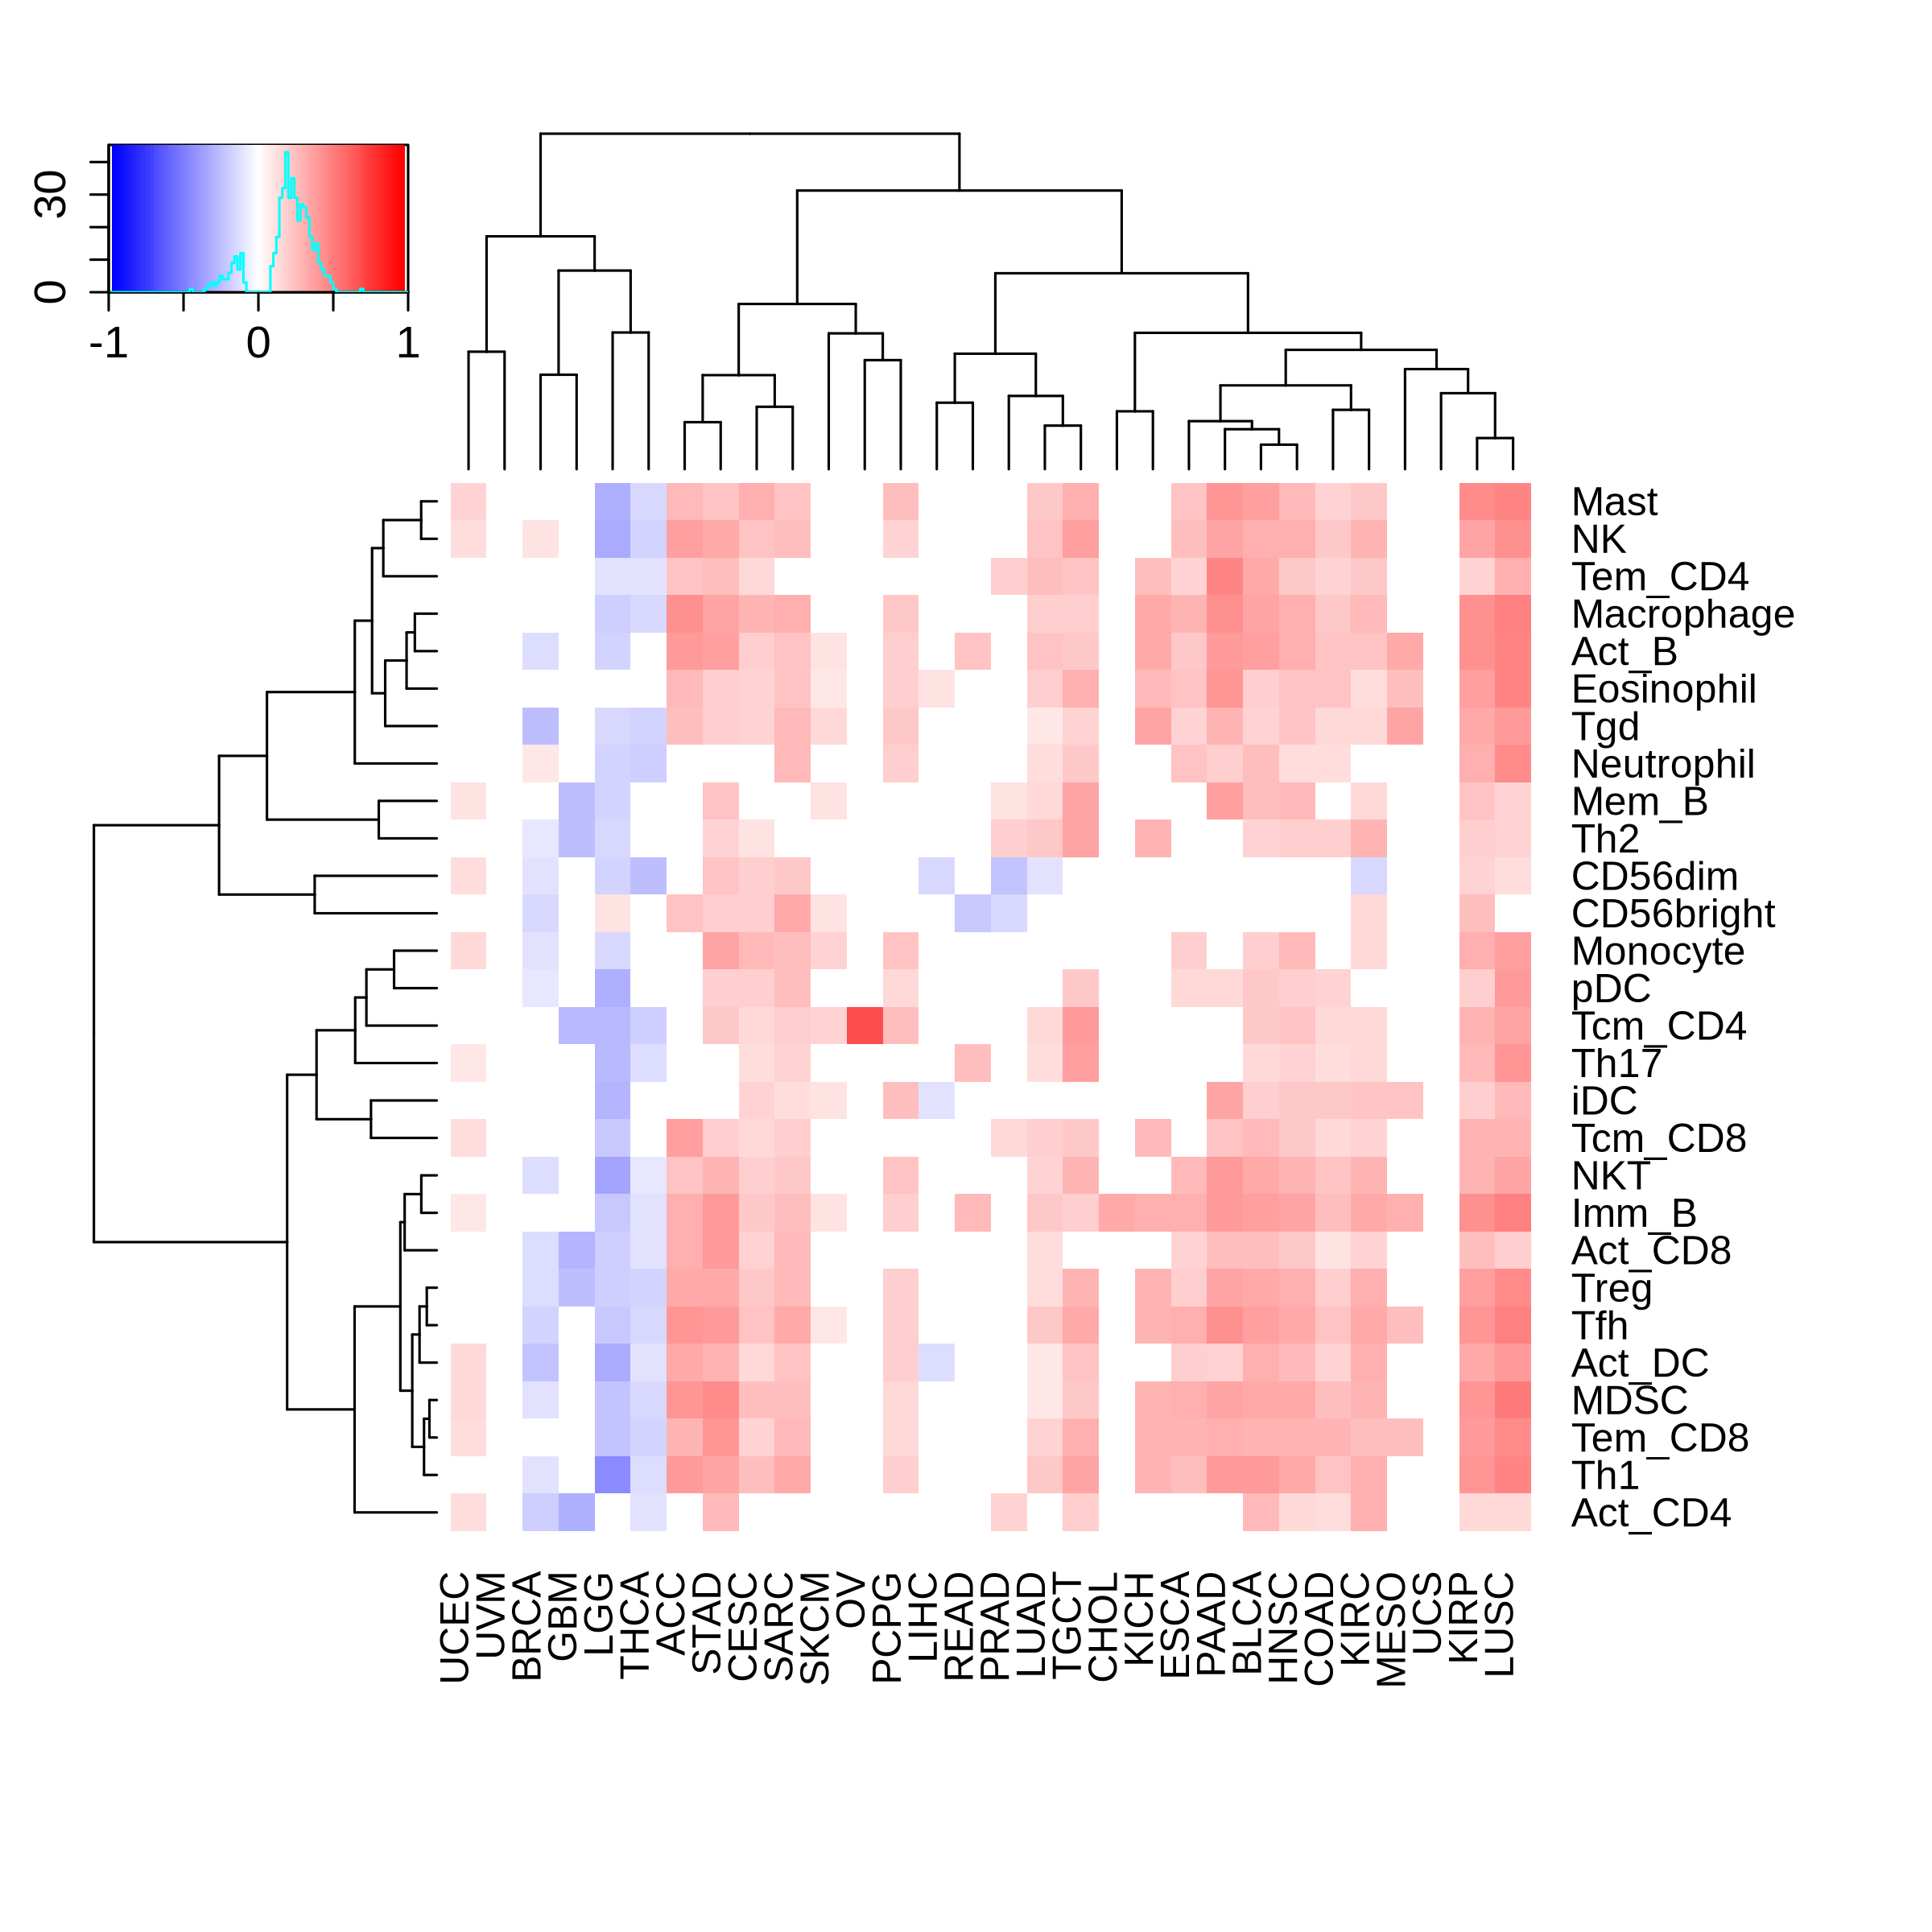
Correlation between the composition of TIL and gene expression, methylation and CNV |
| Expression | Copy number variation |
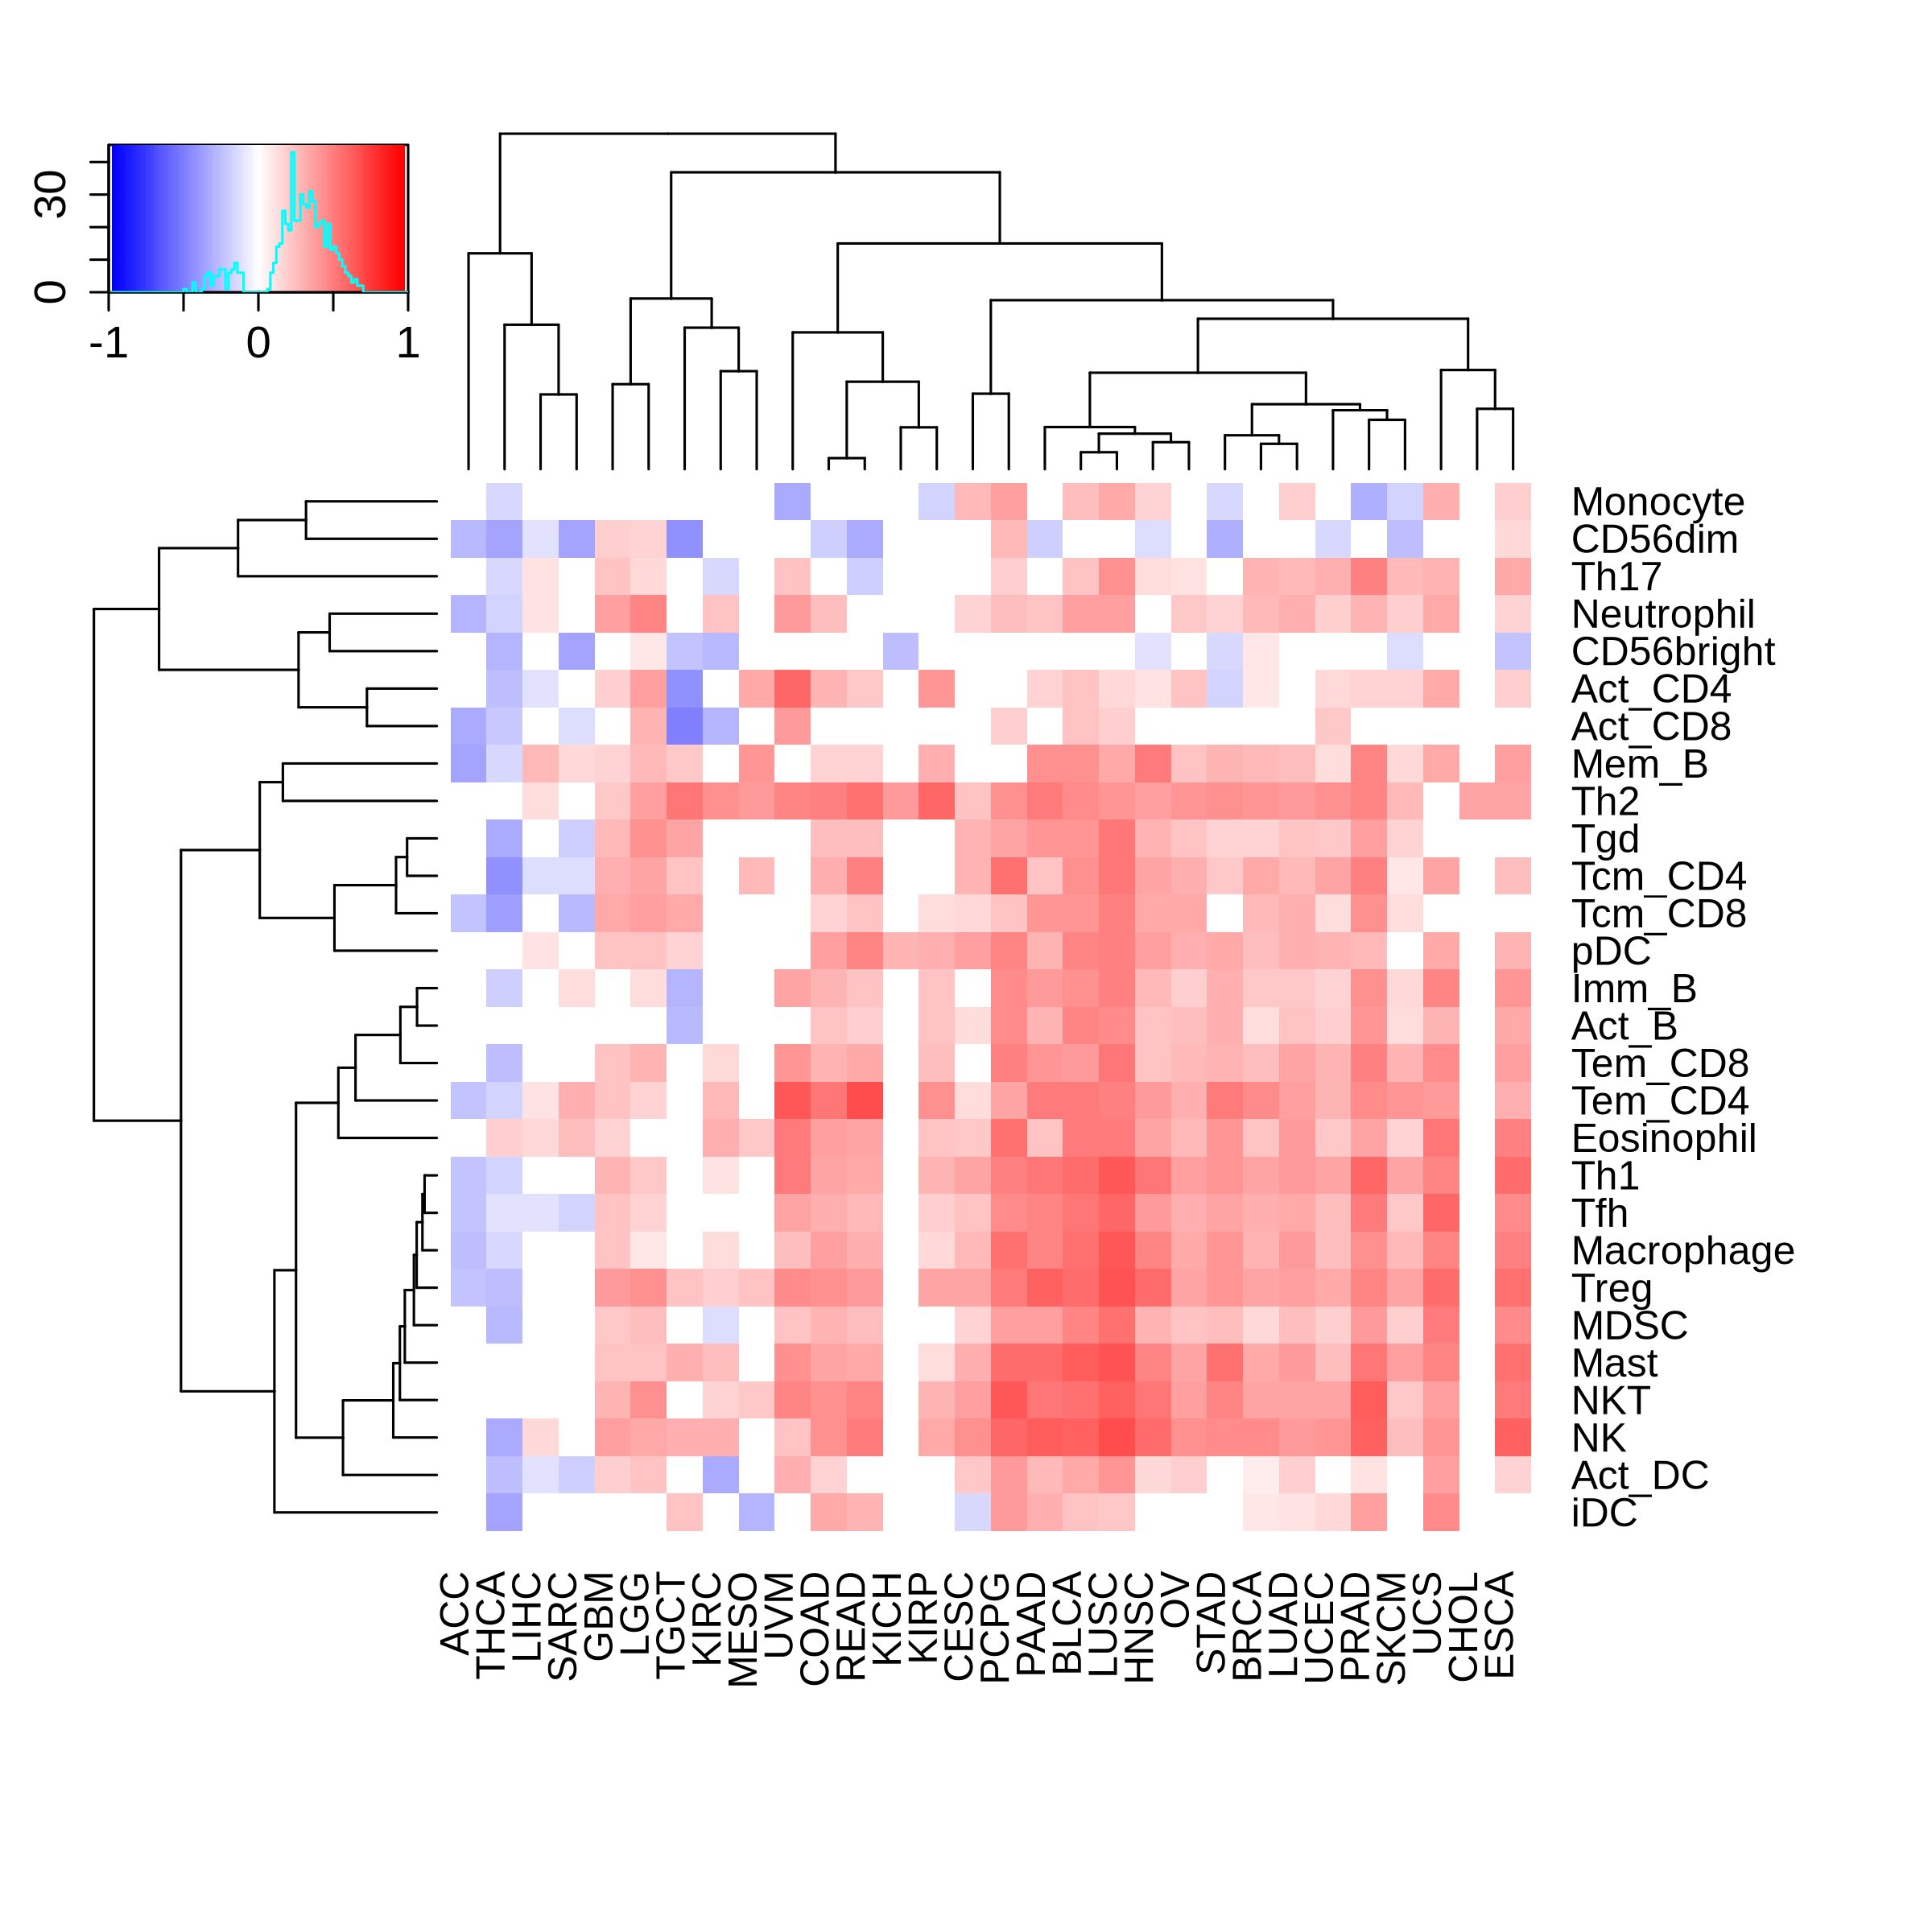 | 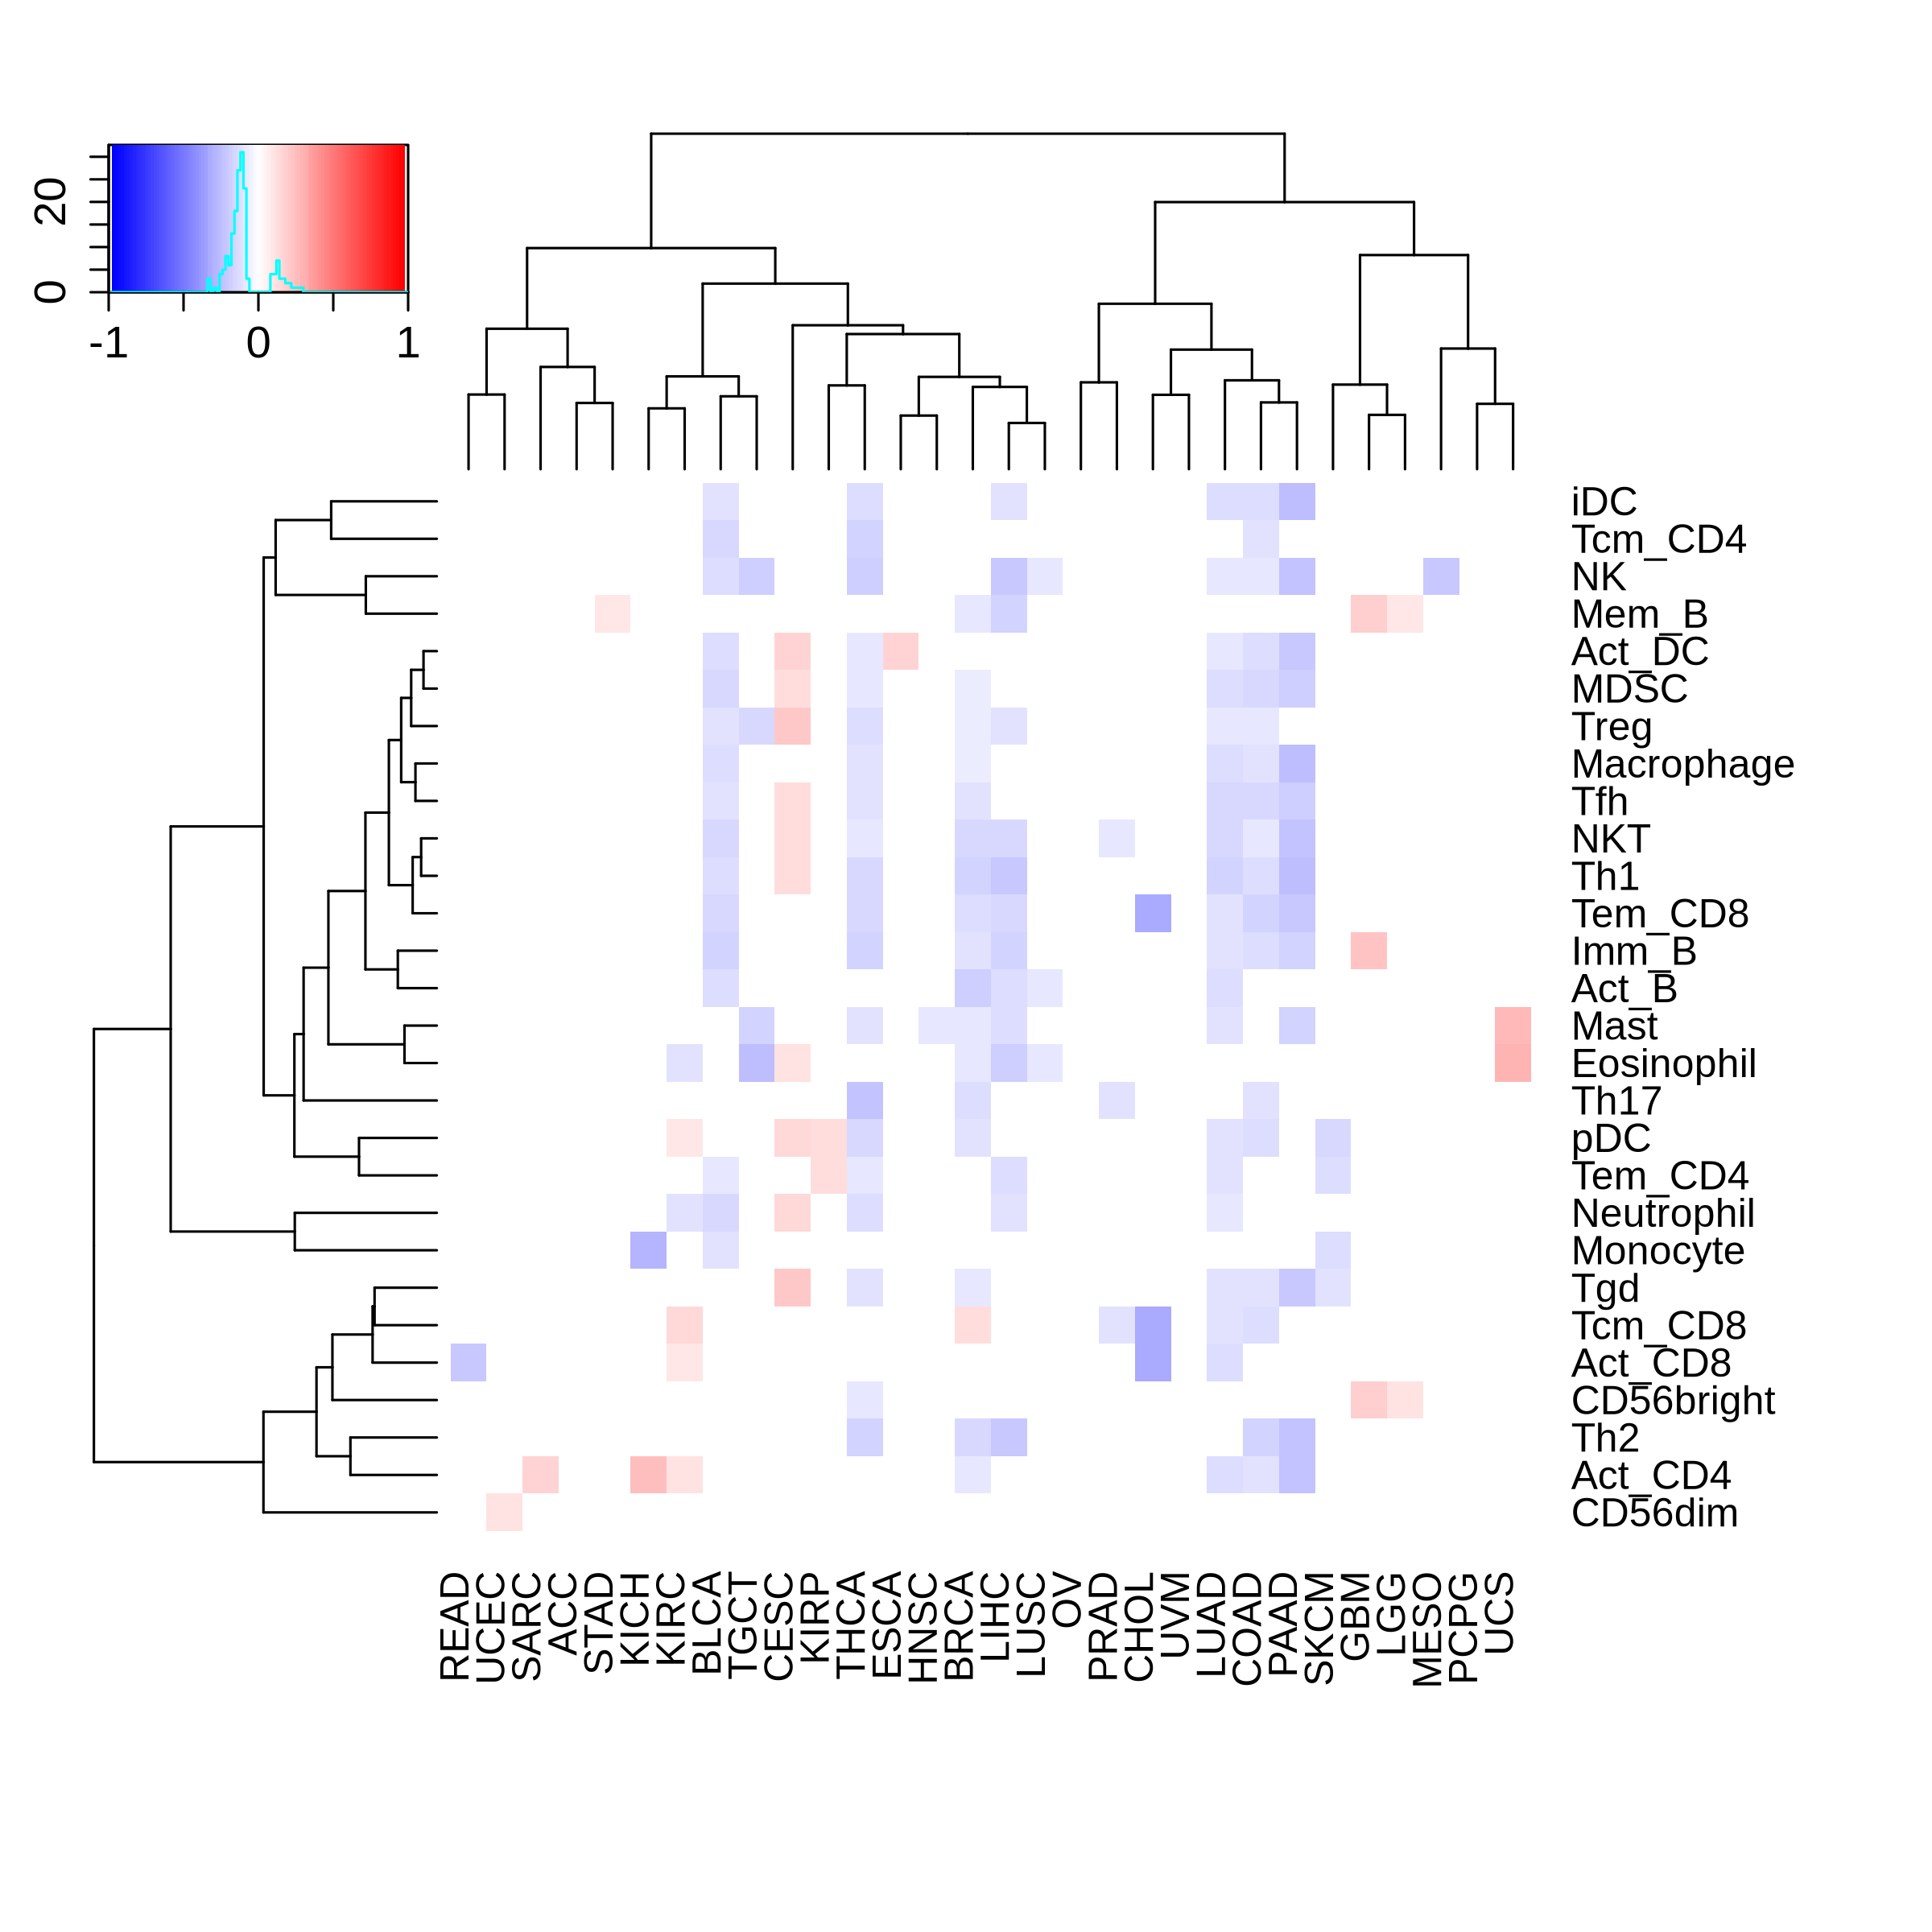 |
| Promoter methylation | Genebody methylation |
 | 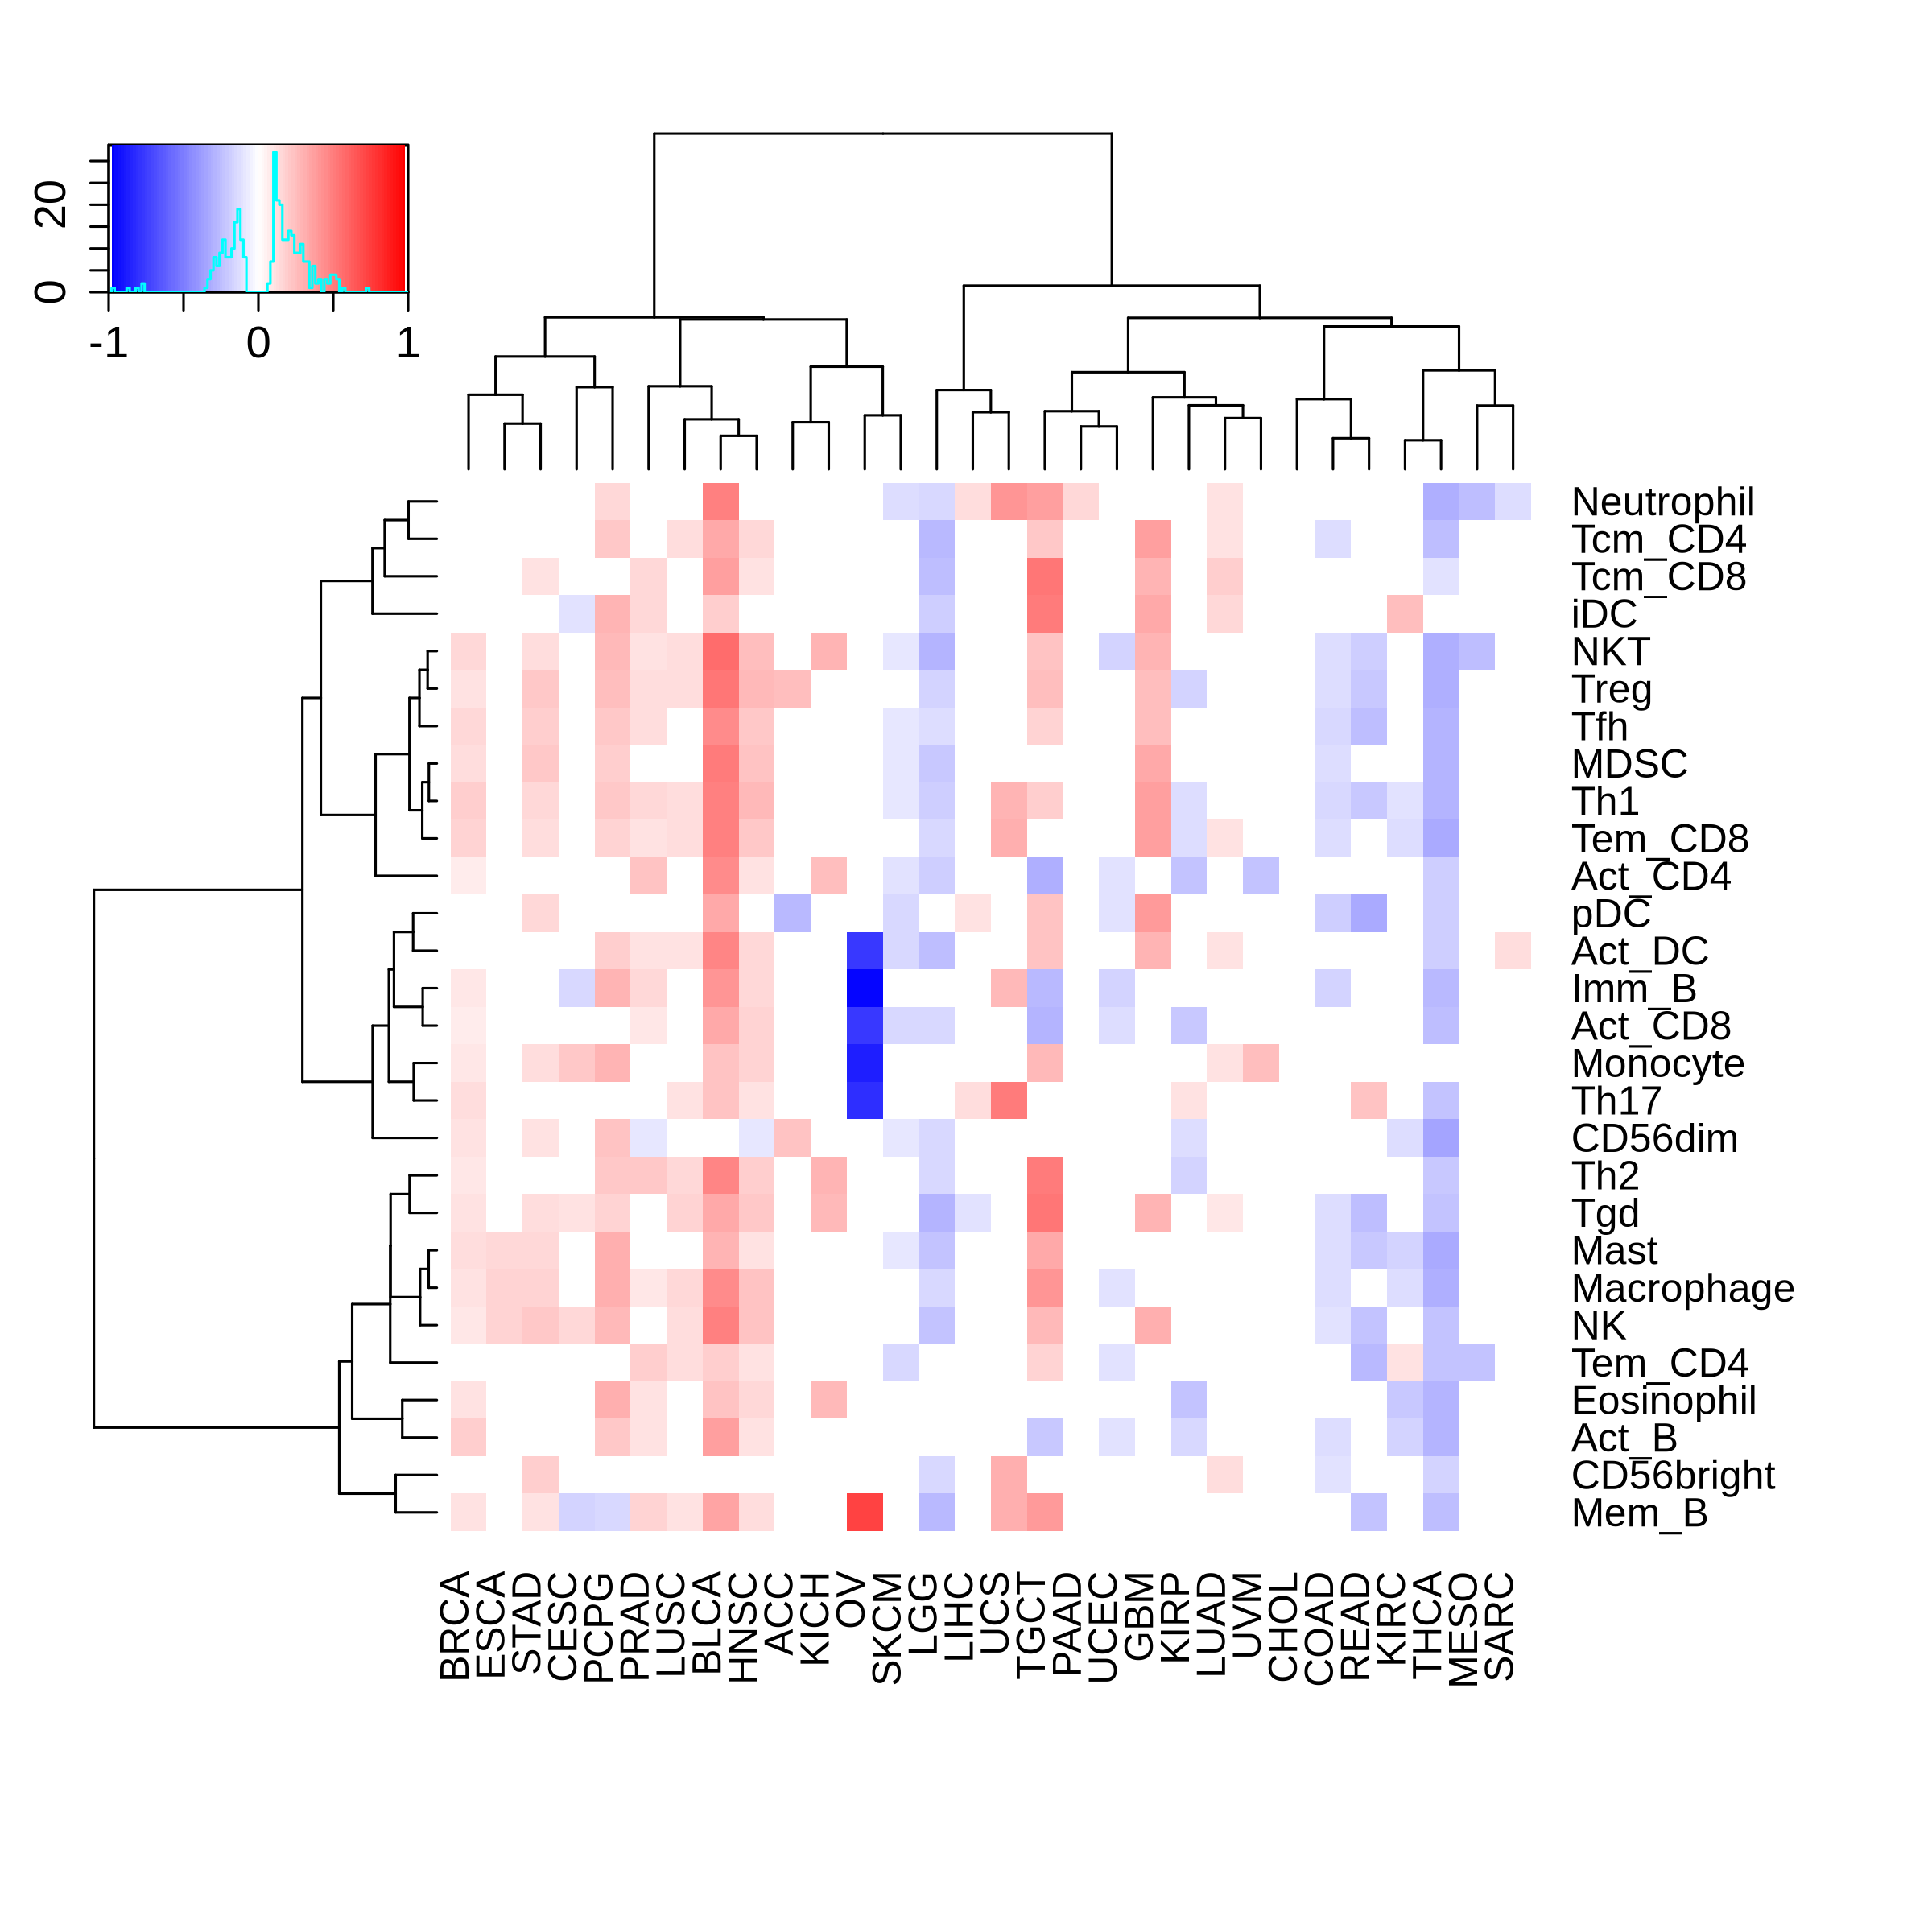 |
Top |
The association between ITGA1 expression and immune subtypes/status |
Top |
Drugs targeting ITGA1 and diseases related to ITGA1. |
| Drug-gene interaction | Disease-gene association |
No drugs targeting ITGA1. |  |
Top |
Survival analysis based on ITGA1 expression |
Top |
| Reference |
| [1] Steele CD, Abbasi A, Islam SMA, et al. Signatures of copy number alterations in human cancer. Nature. 2022 Jun;606(7916):984-991. doi: 10.1038/s41586-022-04738-6. Epub 2022 Jun 15. PMID: 35705804; PMCID: PMC9242861. [2] Beibei Ru, Ching Ngar Wong, Yin Tong, et al. TISIDB: an integrated repository portal for tumor–immune system interactions, Bioinformatics, Volume 35, Issue 20, October 2019, Pages 4200–4202, https://doi.org/10.1093/bioinformatics/btz210. [3] Zhongyang Liu, Jiale Liu, Xinyue Liu, et al. CTR–DB, an omnibus for patient-derived gene expression signatures correlated with cancer drug response, Nucleic Acids Research, Volume 50, Issue D1, 7 January 2022, Pages D1184–D1199, https://doi.org/10.1093/nar/gkab860. [4] Charoentong P, Finotello F, Angelova M, et al. Pan-cancer Immunogenomic Analyses Reveal Genotype-Immunophenotype Relationships and Predictors of Response to Checkpoint Blockade. Cell Rep. 2017 Jan 3;18(1):248–262. doi: 10.1016/j.celrep.2016.12.019. PMID: 28052254. [5] Thorsson V, Gibbs DL, Brown SD, et al. The Immune Landscape of Cancer. Immunity. 2018 Apr 17;48(4):812-830.e14. doi: 10.1016/j.immuni.2018.03.023. Epub 2018 Apr 5. Erratum in: Immunity. 2019 Aug 20;51(2):411-412. doi: 10.1016/j.immuni.2019.08.004. PMID: 29628290; PMCID: PMC5982584. [6] Zapata L, Caravagna G, Williams MJ, et al. Immune selection determines tumor antigenicity and influences response to checkpoint inhibitors. Nat Genet. 2023 Mar;55(3):451-460. doi: 10.1038/s41588-023-01313-1. Epub 2023 Mar 9. PMID: 36894710; PMCID: PMC10011129. [7] Cortes-Ciriano I, Lee S, Park WY, et al. A molecular portrait of microsatellite instability across multiple cancers. Nat Commun. 2017 Jun 6;8:15180. doi: 10.1038/ncomms15180. PMID: 28585546; PMCID: PMC5467167. [8] Cannon M, Stevenson J, Stahl K, et al. DGIdb 5.0: rebuilding the drug-gene interaction database for precision medicine and drug discovery platforms. Nucleic Acids Res. 2024 Jan 5;52(D1):D1227-D1235. doi: 10.1093/nar/gkad1040. PMID: 37953380; PMCID: PMC10767982. [9] Grissa D, Junge A, Oprea TI, Jensen LJ. Diseases 2.0: a weekly updated database of disease-gene associations from text mining and data integration. Database (Oxford). 2022 Mar 28;2022:baac019. doi: 10.1093/database/baac019. PMID: 35348648; PMCID: PMC9216524. |

Copyright 2024-Present -The University of Texas Health Science Center at Houston |