|
|
||||||||
|
||||||||

Gene summary for CTNNB1 |
| Gene Symbol | CTNNB1 | Gene ID | 1499 |
| Gene name | catenin beta 1 |
| Synonyms | BETA-CATENIN;CTNNB;ARMADILLO |
| Type of gene | protein_coding |
| UniProtAcc | P35222 |
| GO ID | GO term |
| GO:0007155 | cell adhesion |
| GO:0016055 | Wnt signaling pathway |
| GO:0007399 | nervous system development |
| GO:0045893 | positive regulation of DNA-templated transcription |
| GO:0045944 | positive regulation of transcription by RNA polymerase II |
| GO:0043065 | positive regulation of apoptotic process |
| GO:0008285 | negative regulation of cell population proliferation |
| GO:0045892 | negative regulation of DNA-templated transcription |
| GO:0043161 | proteasome-mediated ubiquitin-dependent protein catabolic process |
| GO:0060070 | canonical Wnt signaling pathway |
| GO:0008284 | positive regulation of cell population proliferation |
| GO:0043066 | negative regulation of apoptotic process |
| GO:0000209 | protein polyubiquitination |
| GO:0098609 | cell-cell adhesion |
| GO:0045597 | positive regulation of cell differentiation |
| GO:0032355 | response to estradiol |
| GO:0003151 | outflow tract morphogenesis |
| GO:0001569 | branching involved in blood vessel morphogenesis |
| GO:1904948 | midbrain dopaminergic neuron differentiation |
| GO:0016525 | negative regulation of angiogenesis |
| GO:0034333 | adherens junction assembly |
| GO:0035995 | detection of muscle stretch |
| GO:0010718 | positive regulation of epithelial to mesenchymal transition |
| GO:0071363 | cellular response to growth factor stimulus |
| GO:0045765 | regulation of angiogenesis |
| GO:0019827 | stem cell population maintenance |
| GO:0035315 | hair cell differentiation |
| GO:0009410 | response to xenobiotic stimulus |
| GO:0090279 | regulation of calcium ion import |
| GO:2000008 | regulation of protein localization to cell surface |
| GO:0050767 | regulation of neurogenesis |
| GO:0071681 | cellular response to indole-3-methanol |
| GO:0001837 | epithelial to mesenchymal transition |
| GO:0034394 | protein localization to cell surface |
| GO:0033234 | negative regulation of protein sumoylation |
| GO:0072182 | regulation of nephron tubule epithelial cell differentiation |
| GO:0032212 | positive regulation of telomere maintenance via telomerase |
| GO:0001649 | osteoblast differentiation |
| GO:0002052 | positive regulation of neuroblast proliferation |
| GO:0010909 | positive regulation of heparan sulfate proteoglycan biosynthetic process |
| GO:0030997 | regulation of centriole-centriole cohesion |
| GO:0031396 | regulation of protein ubiquitination |
| GO:0036023 | embryonic skeletal limb joint morphogenesis |
| GO:0043525 | positive regulation of neuron apoptotic process |
| GO:0045976 | negative regulation of mitotic cell cycle, embryonic |
| GO:0048145 | regulation of fibroblast proliferation |
| GO:0048660 | regulation of smooth muscle cell proliferation |
| GO:0061154 | endothelial tube morphogenesis |
| GO:0061549 | sympathetic ganglion development |
| GO:0070602 | regulation of centromeric sister chromatid cohesion |
| GO:0072497 | mesenchymal stem cell differentiation |
| GO:1990138 | neuron projection extension |
| GO:0000122 | negative regulation of transcription by RNA polymerase II |
| GO:0000165 | MAPK cascade |
| GO:0000578 | embryonic axis specification |
| GO:0000902 | cell morphogenesis |
| GO:0001501 | skeletal system development |
| GO:0001570 | vasculogenesis |
| GO:0001658 | branching involved in ureteric bud morphogenesis |
| GO:0001701 | in utero embryonic development |
| GO:0001702 | gastrulation with mouth forming second |
| GO:0001706 | endoderm formation |
| GO:0001708 | cell fate specification |
| GO:0001711 | endodermal cell fate commitment |
| GO:0001764 | neuron migration |
| GO:0001822 | kidney development |
| GO:0001840 | neural plate development |
| GO:0001894 | tissue homeostasis |
| GO:0001944 | vasculature development |
| GO:0002053 | positive regulation of mesenchymal cell proliferation |
| GO:0002062 | chondrocyte differentiation |
| GO:0002067 | glandular epithelial cell differentiation |
| GO:0002089 | lens morphogenesis in camera-type eye |
| GO:0003266 | regulation of secondary heart field cardioblast proliferation |
| GO:0003338 | metanephros morphogenesis |
| GO:0003340 | negative regulation of mesenchymal to epithelial transition involved in metanephros morphogenesis |
| GO:0006351 | DNA-templated transcription |
| GO:0006357 | regulation of transcription by RNA polymerase II |
| GO:0006366 | transcription by RNA polymerase II |
| GO:0007160 | cell-matrix adhesion |
| GO:0007268 | chemical synaptic transmission |
| GO:0007398 | ectoderm development |
| GO:0007403 | glial cell fate determination |
| GO:0007405 | neuroblast proliferation |
| GO:0007507 | heart development |
| GO:0008104 | protein localization |
| GO:0008283 | cell population proliferation |
| GO:0008543 | fibroblast growth factor receptor signaling pathway |
| GO:0009948 | anterior/posterior axis specification |
| GO:0009950 | dorsal/ventral axis specification |
| GO:0009953 | dorsal/ventral pattern formation |
| GO:0009954 | proximal/distal pattern formation |
| GO:0010463 | mesenchymal cell proliferation |
| GO:0010467 | gene expression |
| GO:0010468 | regulation of gene expression |
| GO:0010628 | positive regulation of gene expression |
| GO:0010629 | negative regulation of gene expression |
| GO:0016331 | morphogenesis of embryonic epithelium |
| GO:0021819 | layer formation in cerebral cortex |
| GO:0021854 | hypothalamus development |
| GO:0022009 | central nervous system vasculogenesis |
| GO:0022405 | hair cycle process |
| GO:0030097 | hemopoiesis |
| GO:0030154 | cell differentiation |
| GO:0030182 | neuron differentiation |
| GO:0030217 | T cell differentiation |
| GO:0030316 | osteoclast differentiation |
| GO:0030324 | lung development |
| GO:0030539 | male genitalia development |
| GO:0030856 | regulation of epithelial cell differentiation |
| GO:0030858 | positive regulation of epithelial cell differentiation |
| GO:0030900 | forebrain development |
| GO:0030901 | midbrain development |
| GO:0030902 | hindbrain development |
| GO:0031016 | pancreas development |
| GO:0031069 | hair follicle morphogenesis |
| GO:0031641 | regulation of myelination |
| GO:0032331 | negative regulation of chondrocyte differentiation |
| GO:0032968 | positive regulation of transcription elongation by RNA polymerase II |
| GO:0033077 | T cell differentiation in thymus |
| GO:0034332 | adherens junction organization |
| GO:0035050 | embryonic heart tube development |
| GO:0035112 | genitalia morphogenesis |
| GO:0035115 | embryonic forelimb morphogenesis |
| GO:0035116 | embryonic hindlimb morphogenesis |
| GO:0036520 | astrocyte-dopaminergic neuron signaling |
| GO:0042127 | regulation of cell population proliferation |
| GO:0042129 | regulation of T cell proliferation |
| GO:0042475 | odontogenesis of dentin-containing tooth |
| GO:0042733 | embryonic digit morphogenesis |
| GO:0042981 | regulation of apoptotic process |
| GO:0043410 | positive regulation of MAPK cascade |
| GO:0043524 | negative regulation of neuron apoptotic process |
| GO:0043588 | skin development |
| GO:0044338 | canonical Wnt signaling pathway involved in mesenchymal stem cell differentiation |
| GO:0045453 | bone resorption |
| GO:0045595 | regulation of cell differentiation |
| GO:0045596 | negative regulation of cell differentiation |
| GO:0045603 | positive regulation of endothelial cell differentiation |
| GO:0045667 | regulation of osteoblast differentiation |
| GO:0045669 | positive regulation of osteoblast differentiation |
| GO:0045670 | regulation of osteoclast differentiation |
| GO:0045671 | negative regulation of osteoclast differentiation |
| GO:0045743 | positive regulation of fibroblast growth factor receptor signaling pathway |
| GO:0048469 | cell maturation |
| GO:0048489 | synaptic vesicle transport |
| GO:0048513 | animal organ development |
| GO:0048538 | thymus development |
| GO:0048568 | embryonic organ development |
| GO:0048599 | oocyte development |
| GO:0048617 | embryonic foregut morphogenesis |
| GO:0048643 | positive regulation of skeletal muscle tissue development |
| GO:0048664 | neuron fate determination |
| GO:0048709 | oligodendrocyte differentiation |
| GO:0048715 | negative regulation of oligodendrocyte differentiation |
| GO:0050768 | negative regulation of neurogenesis |
| GO:0050808 | synapse organization |
| GO:0051145 | smooth muscle cell differentiation |
| GO:0051450 | myoblast proliferation |
| GO:0051884 | regulation of timing of anagen |
| GO:0051963 | regulation of synapse assembly |
| GO:0060066 | oviduct development |
| GO:0060173 | limb development |
| GO:0060439 | trachea morphogenesis |
| GO:0060440 | trachea formation |
| GO:0060441 | epithelial tube branching involved in lung morphogenesis |
| GO:0060479 | lung cell differentiation |
| GO:0060484 | lung-associated mesenchyme development |
| GO:0060487 | lung epithelial cell differentiation |
| GO:0060492 | lung induction |
| GO:0060742 | epithelial cell differentiation involved in prostate gland development |
| GO:0060767 | epithelial cell proliferation involved in prostate gland development |
| GO:0060769 | positive regulation of epithelial cell proliferation involved in prostate gland development |
| GO:0060789 | hair follicle placode formation |
| GO:0060856 | establishment of blood-brain barrier |
| GO:0060916 | mesenchymal cell proliferation involved in lung development |
| GO:0061047 | positive regulation of branching involved in lung morphogenesis |
| GO:0061198 | fungiform papilla formation |
| GO:0061550 | cranial ganglion development |
| GO:0072033 | renal vesicle formation |
| GO:0072053 | renal inner medulla development |
| GO:0072054 | renal outer medulla development |
| GO:0072079 | nephron tubule formation |
| GO:0072089 | stem cell proliferation |
| GO:0090090 | negative regulation of canonical Wnt signaling pathway |
| GO:0090425 | acinar cell differentiation |
| GO:0097091 | synaptic vesicle clustering |
| GO:0097190 | apoptotic signaling pathway |
| GO:1901331 | positive regulation of odontoblast differentiation |
| GO:1903377 | negative regulation of oxidative stress-induced neuron intrinsic apoptotic signaling pathway |
| GO:1904888 | cranial skeletal system development |
| GO:1990403 | embryonic brain development |
| GO:1990791 | dorsal root ganglion development |
| GO:1990963 | establishment of blood-retinal barrier |
| GO:2000017 | positive regulation of determination of dorsal identity |
| GO:2000179 | positive regulation of neural precursor cell proliferation |
| GO:2000288 | positive regulation of myoblast proliferation |
| GO:2000648 | positive regulation of stem cell proliferation |
| GO:2001234 | negative regulation of apoptotic signaling pathway |
Top |
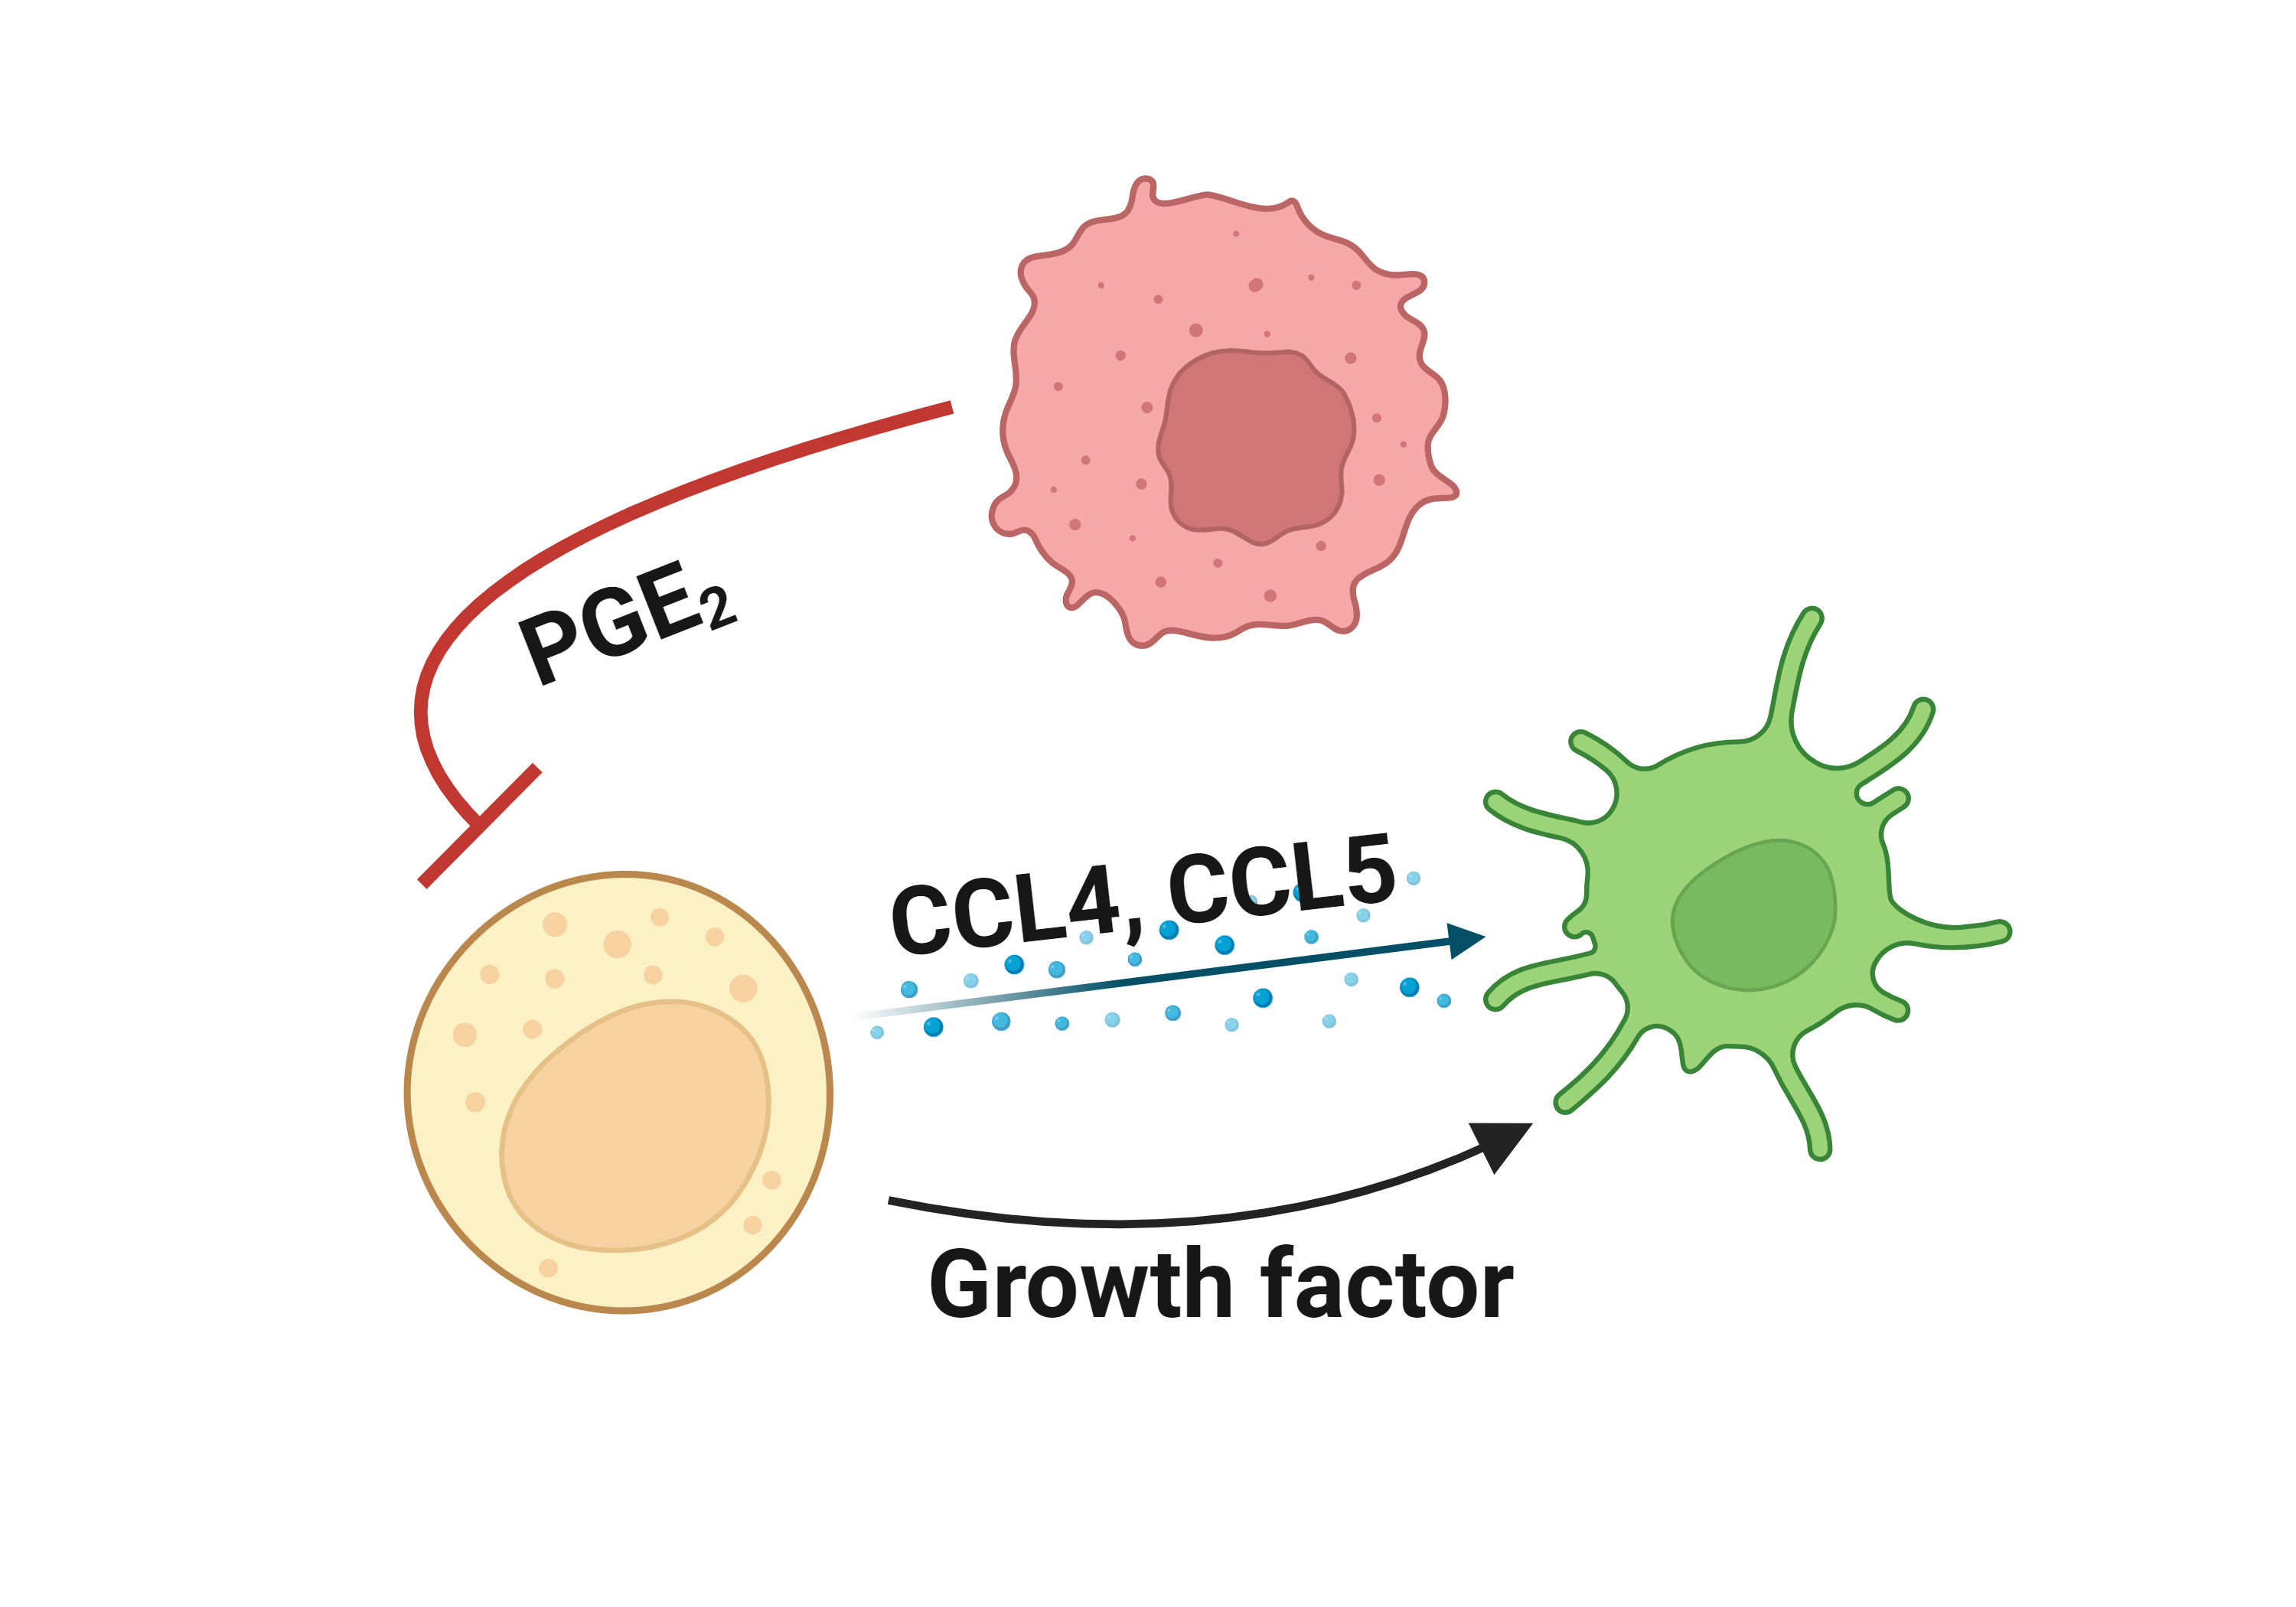
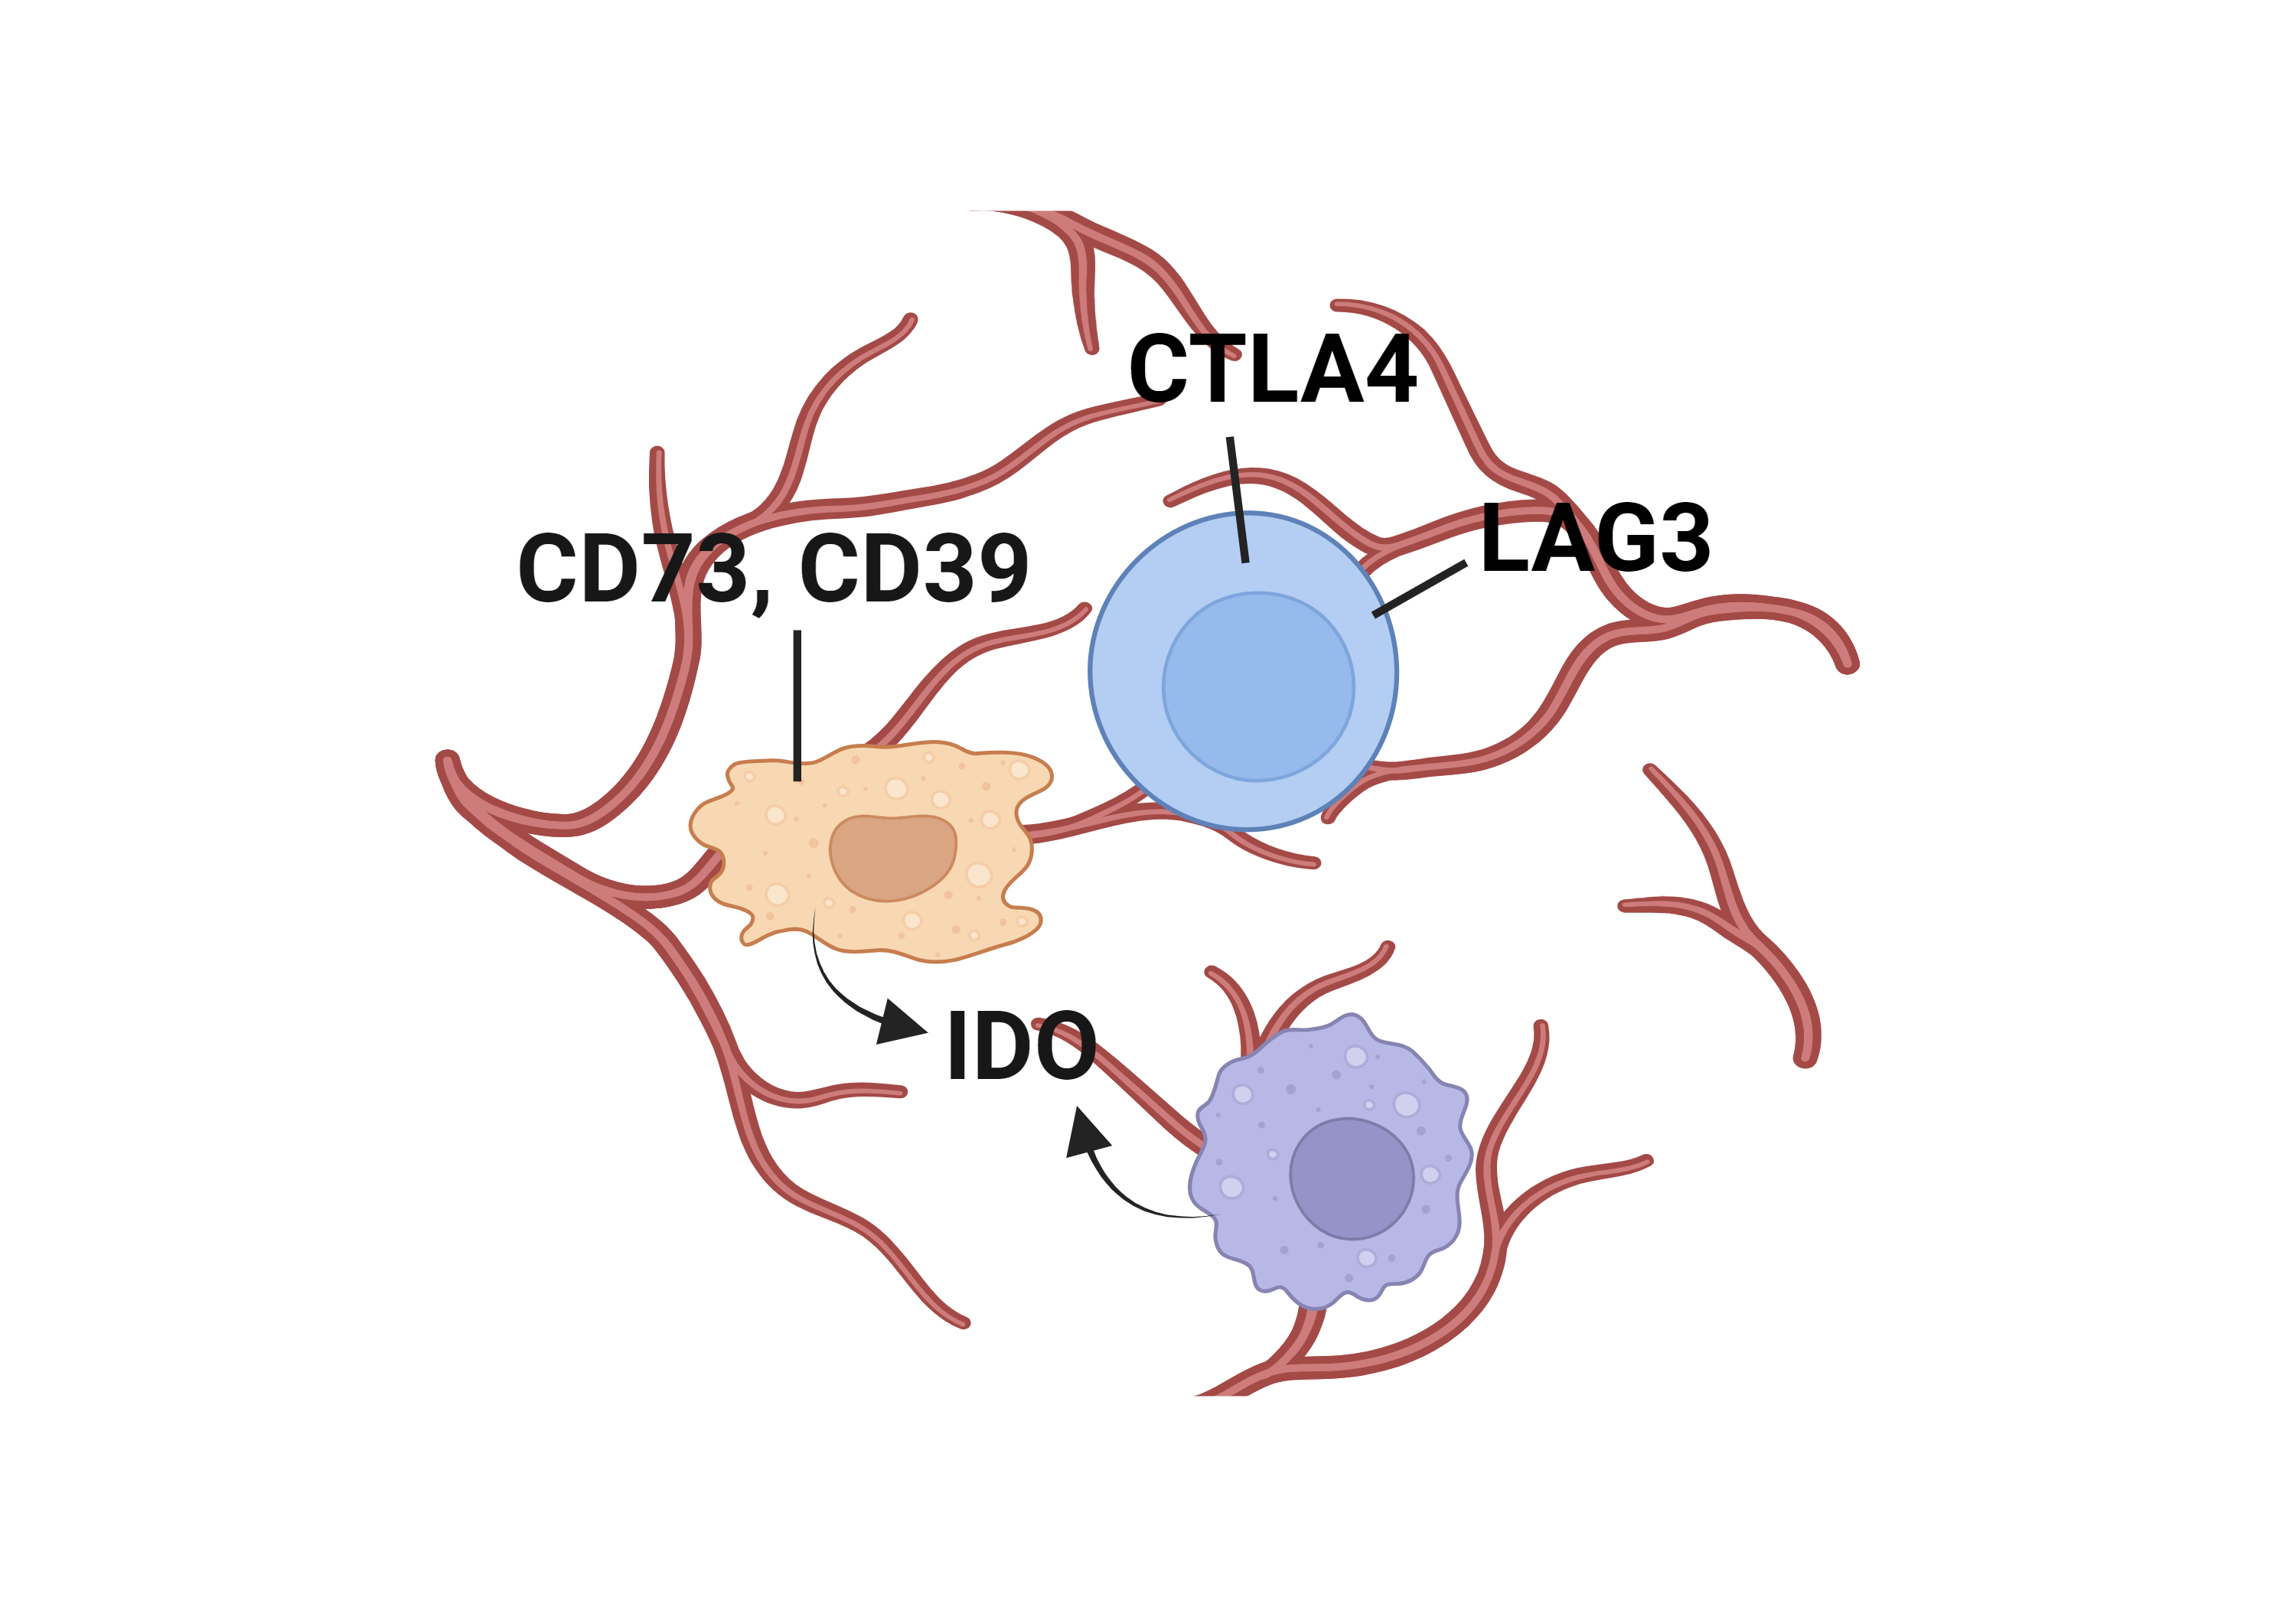
Literatures describing the association of CTNNB1 and immune escape mechanisms |
Top |
Comparison of the CTNNB1 expression level between tumor and normal groups |
No significant differences were found in CTNNB1 expression.
Top |
Comparison of the CTNNB1 methylation level between tumor and normal groups |
No significant differences were found in CTNNB1 methylation in promoter region.
No significant differences were found in CTNNB1 methylation in genebody region.
Top |
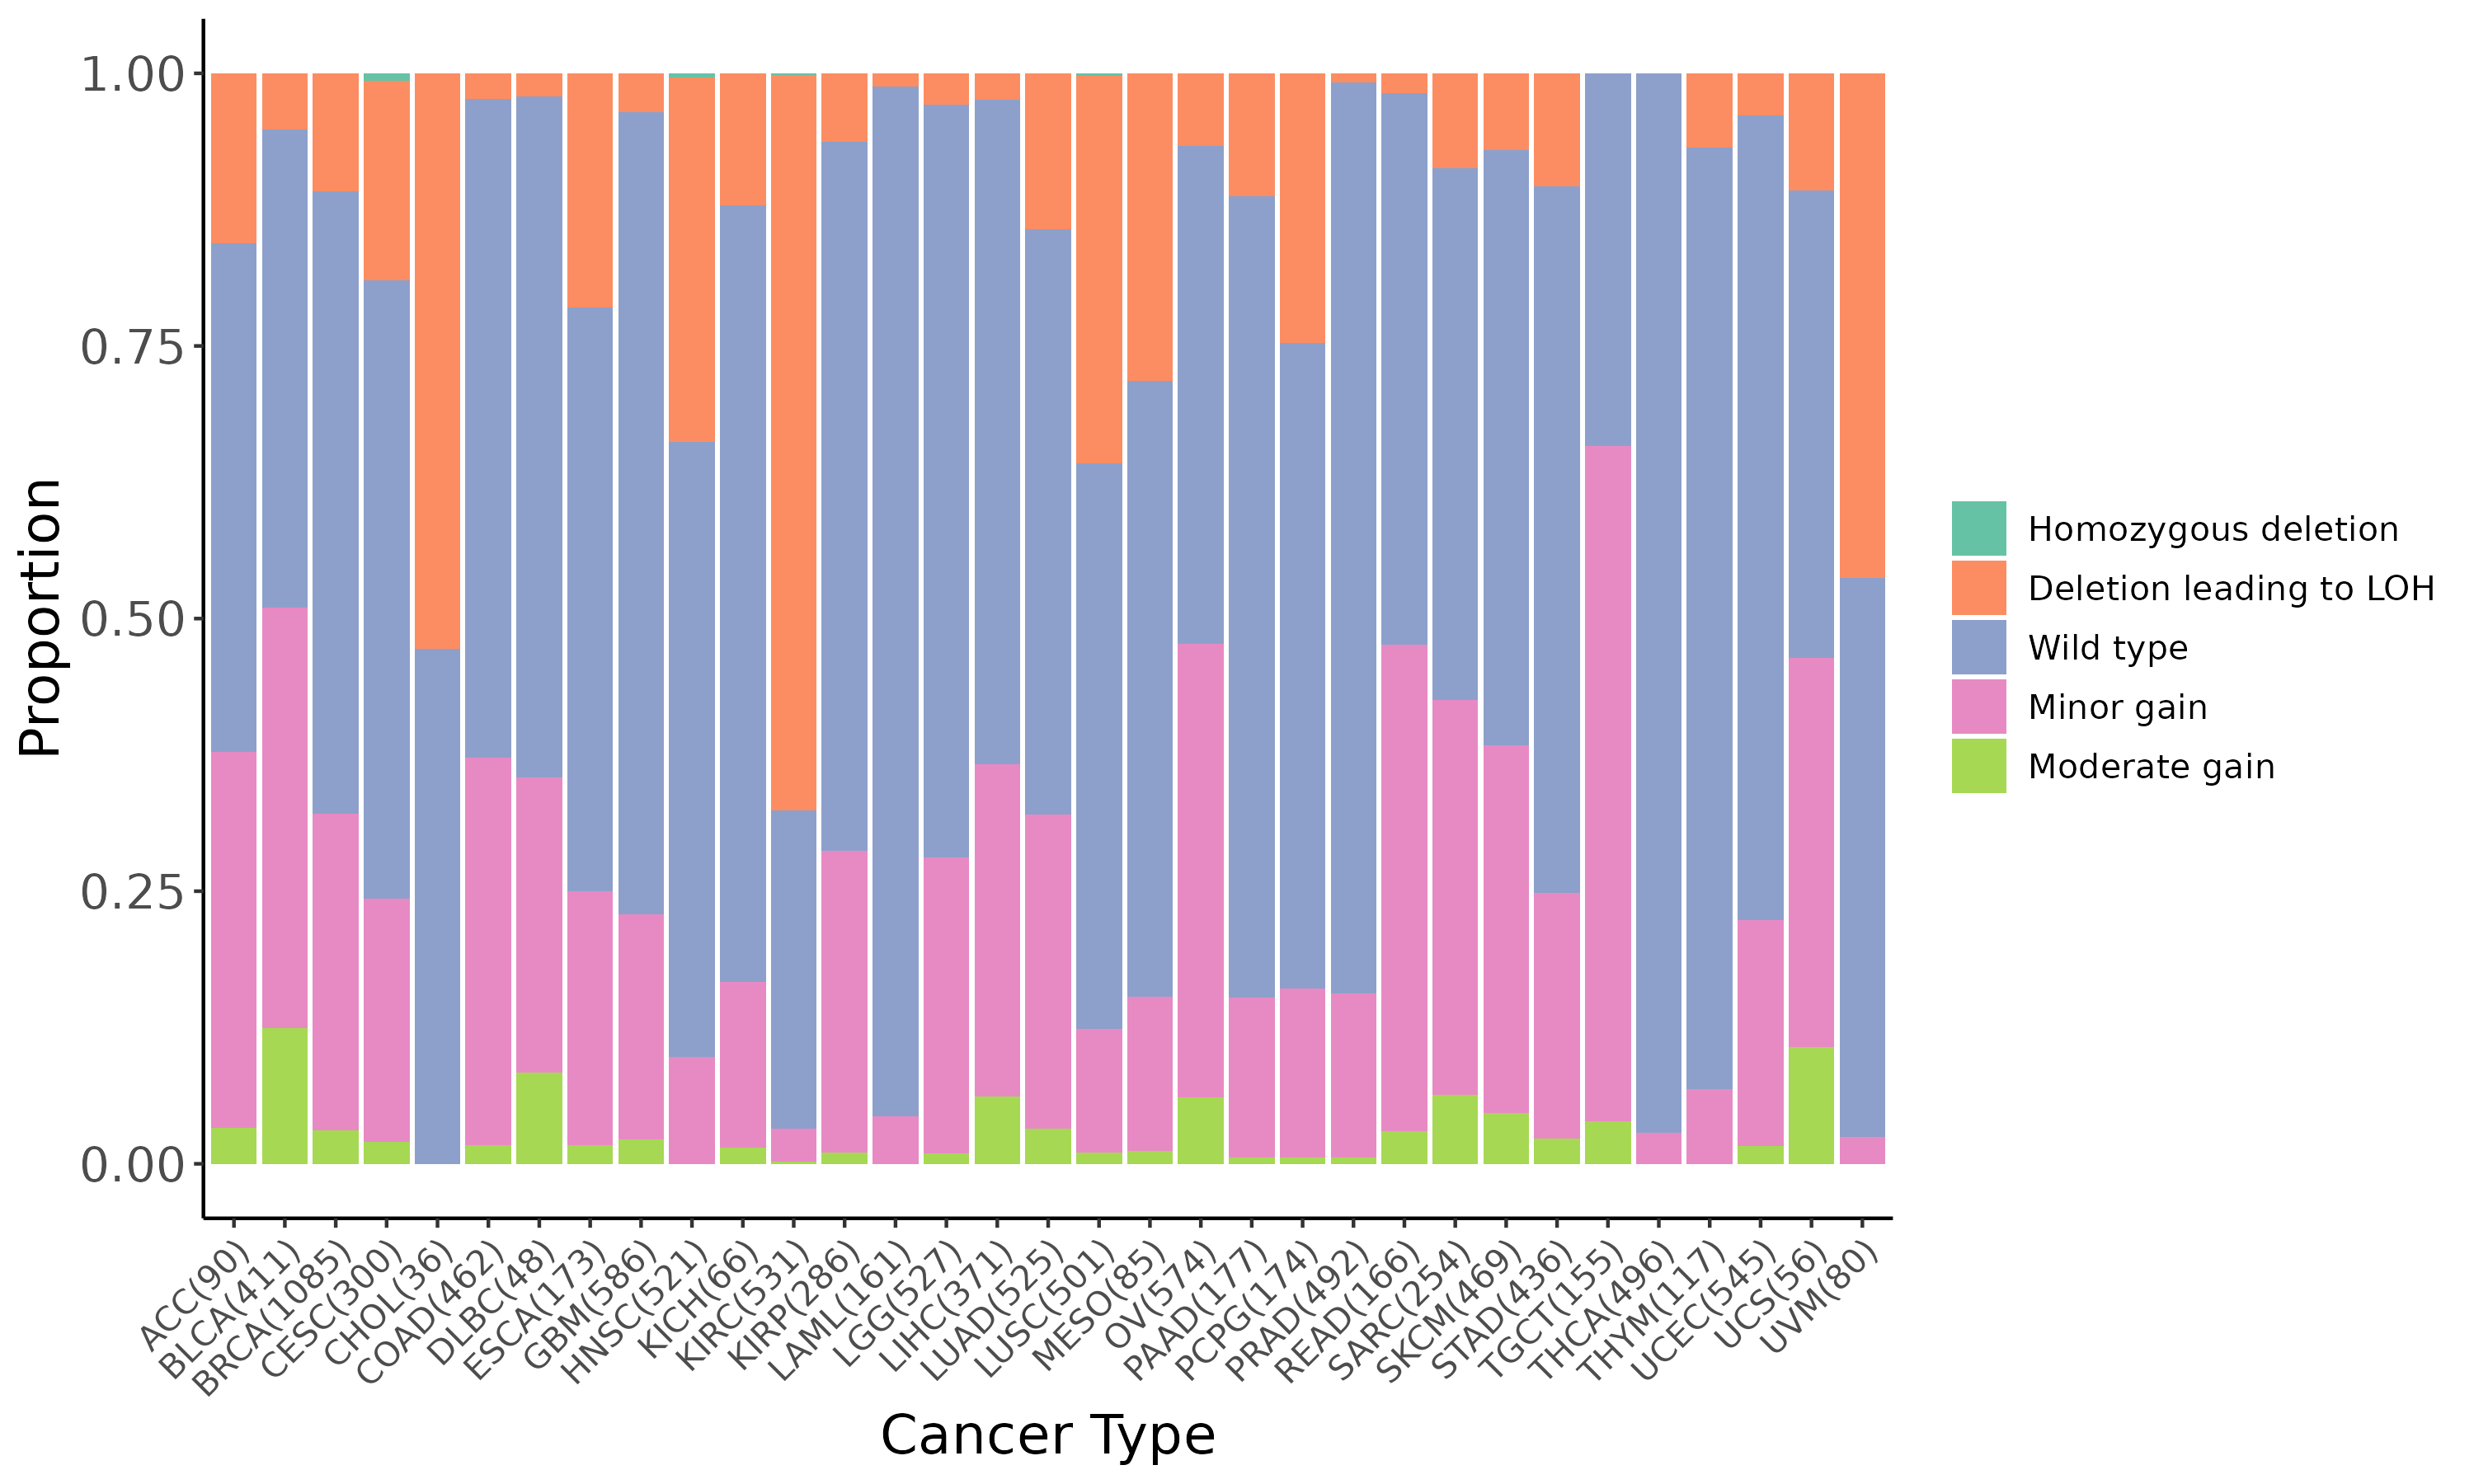
Summary of the copy number in TCGA tumor samples |
 |
Top |
DEGs and the enrichment analysis between the mutated and wild type groups |
| Gene ID | Symbol | Log2 Fold Change | P-value | Adjusted P-value |
|---|---|---|---|---|
| ENSG00000019169 | MARCO | -2.48e+00 | 2.07e-03 | 2.69e-02 |
| ENSG00000128606 | LRRC17 | 1.83e+00 | 2.07e-03 | 2.70e-02 |
| ENSG00000196091 | MYBPC1 | -2.07e+00 | 2.08e-03 | 2.70e-02 |
| ENSG00000139679 | LPAR6 | -1.05e+00 | 2.08e-03 | 2.70e-02 |
| ENSG00000186074 | CD300LF | -1.54e+00 | 2.08e-03 | 2.70e-02 |
| ENSG00000137473 | TTC29 | -3.14e+00 | 2.09e-03 | 2.71e-02 |
| ENSG00000137821 | LRRC49 | 1.06e+00 | 2.09e-03 | 2.71e-02 |
| ENSG00000287568 | NA | -5.98e+00 | 2.09e-03 | 2.71e-02 |
| ENSG00000183715 | OPCML | 2.18e+00 | 2.10e-03 | 2.72e-02 |
| ENSG00000144410 | CPO | -1.53e+00 | 2.10e-03 | 2.72e-02 |
| ENSG00000171051 | FPR1 | -1.89e+00 | 2.10e-03 | 2.72e-02 |
| ENSG00000115884 | SDC1 | 1.21e+00 | 2.11e-03 | 2.72e-02 |
| ENSG00000184500 | PROS1 | -1.07e+00 | 2.11e-03 | 2.72e-02 |
| ENSG00000186994 | KANK3 | -1.14e+00 | 2.11e-03 | 2.72e-02 |
| ENSG00000129451 | KLK10 | -2.49e+00 | 2.11e-03 | 2.72e-02 |
| ENSG00000114251 | WNT5A | 1.58e+00 | 2.12e-03 | 2.74e-02 |
| ENSG00000241684 | ADAMTS9-AS2 | 1.26e+00 | 2.13e-03 | 2.74e-02 |
| ENSG00000116824 | CD2 | -1.99e+00 | 2.13e-03 | 2.75e-02 |
| ENSG00000184261 | KCNK12 | -1.73e+00 | 2.13e-03 | 2.75e-02 |
| ENSG00000188850 | RP11-159F24.2 | 1.83e+00 | 2.13e-03 | 2.75e-02 |
| Page: 1 2 ... 87 88 89 90 91 ... 129 130 |
Up-regulated GOBP pathways | Up-regulated Hallmark pathways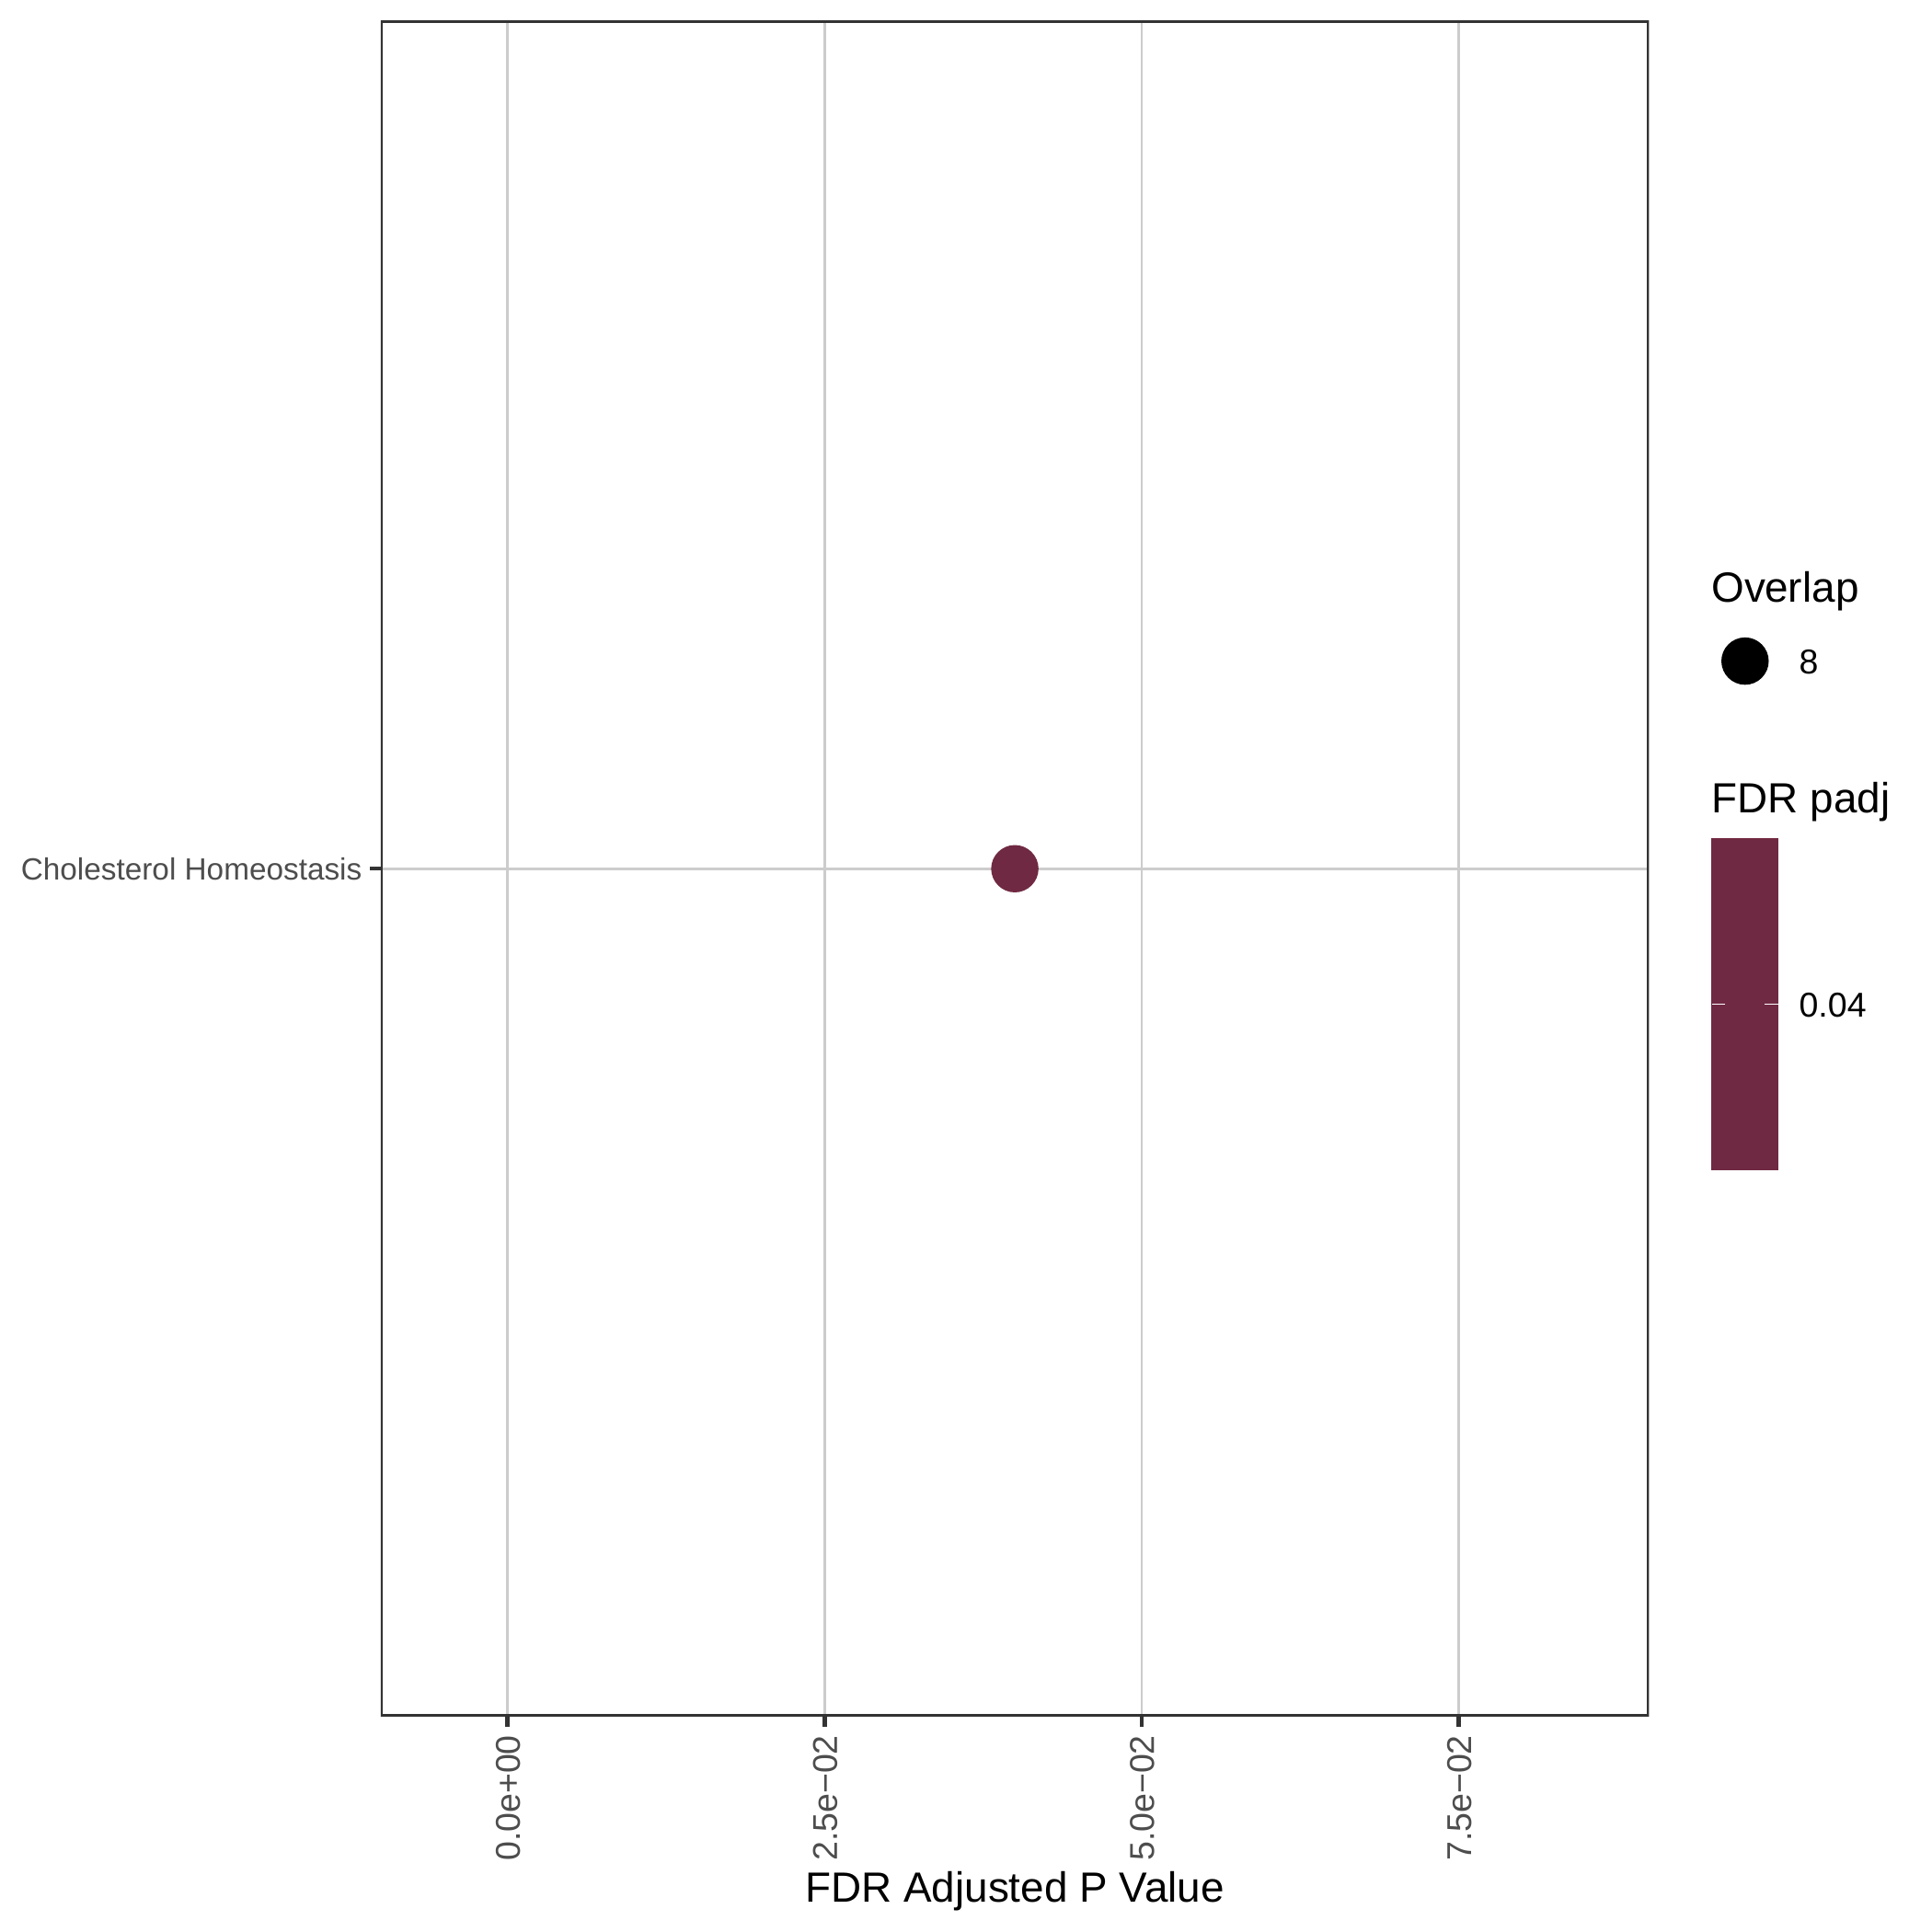 |
Down-regulated KEGG pathways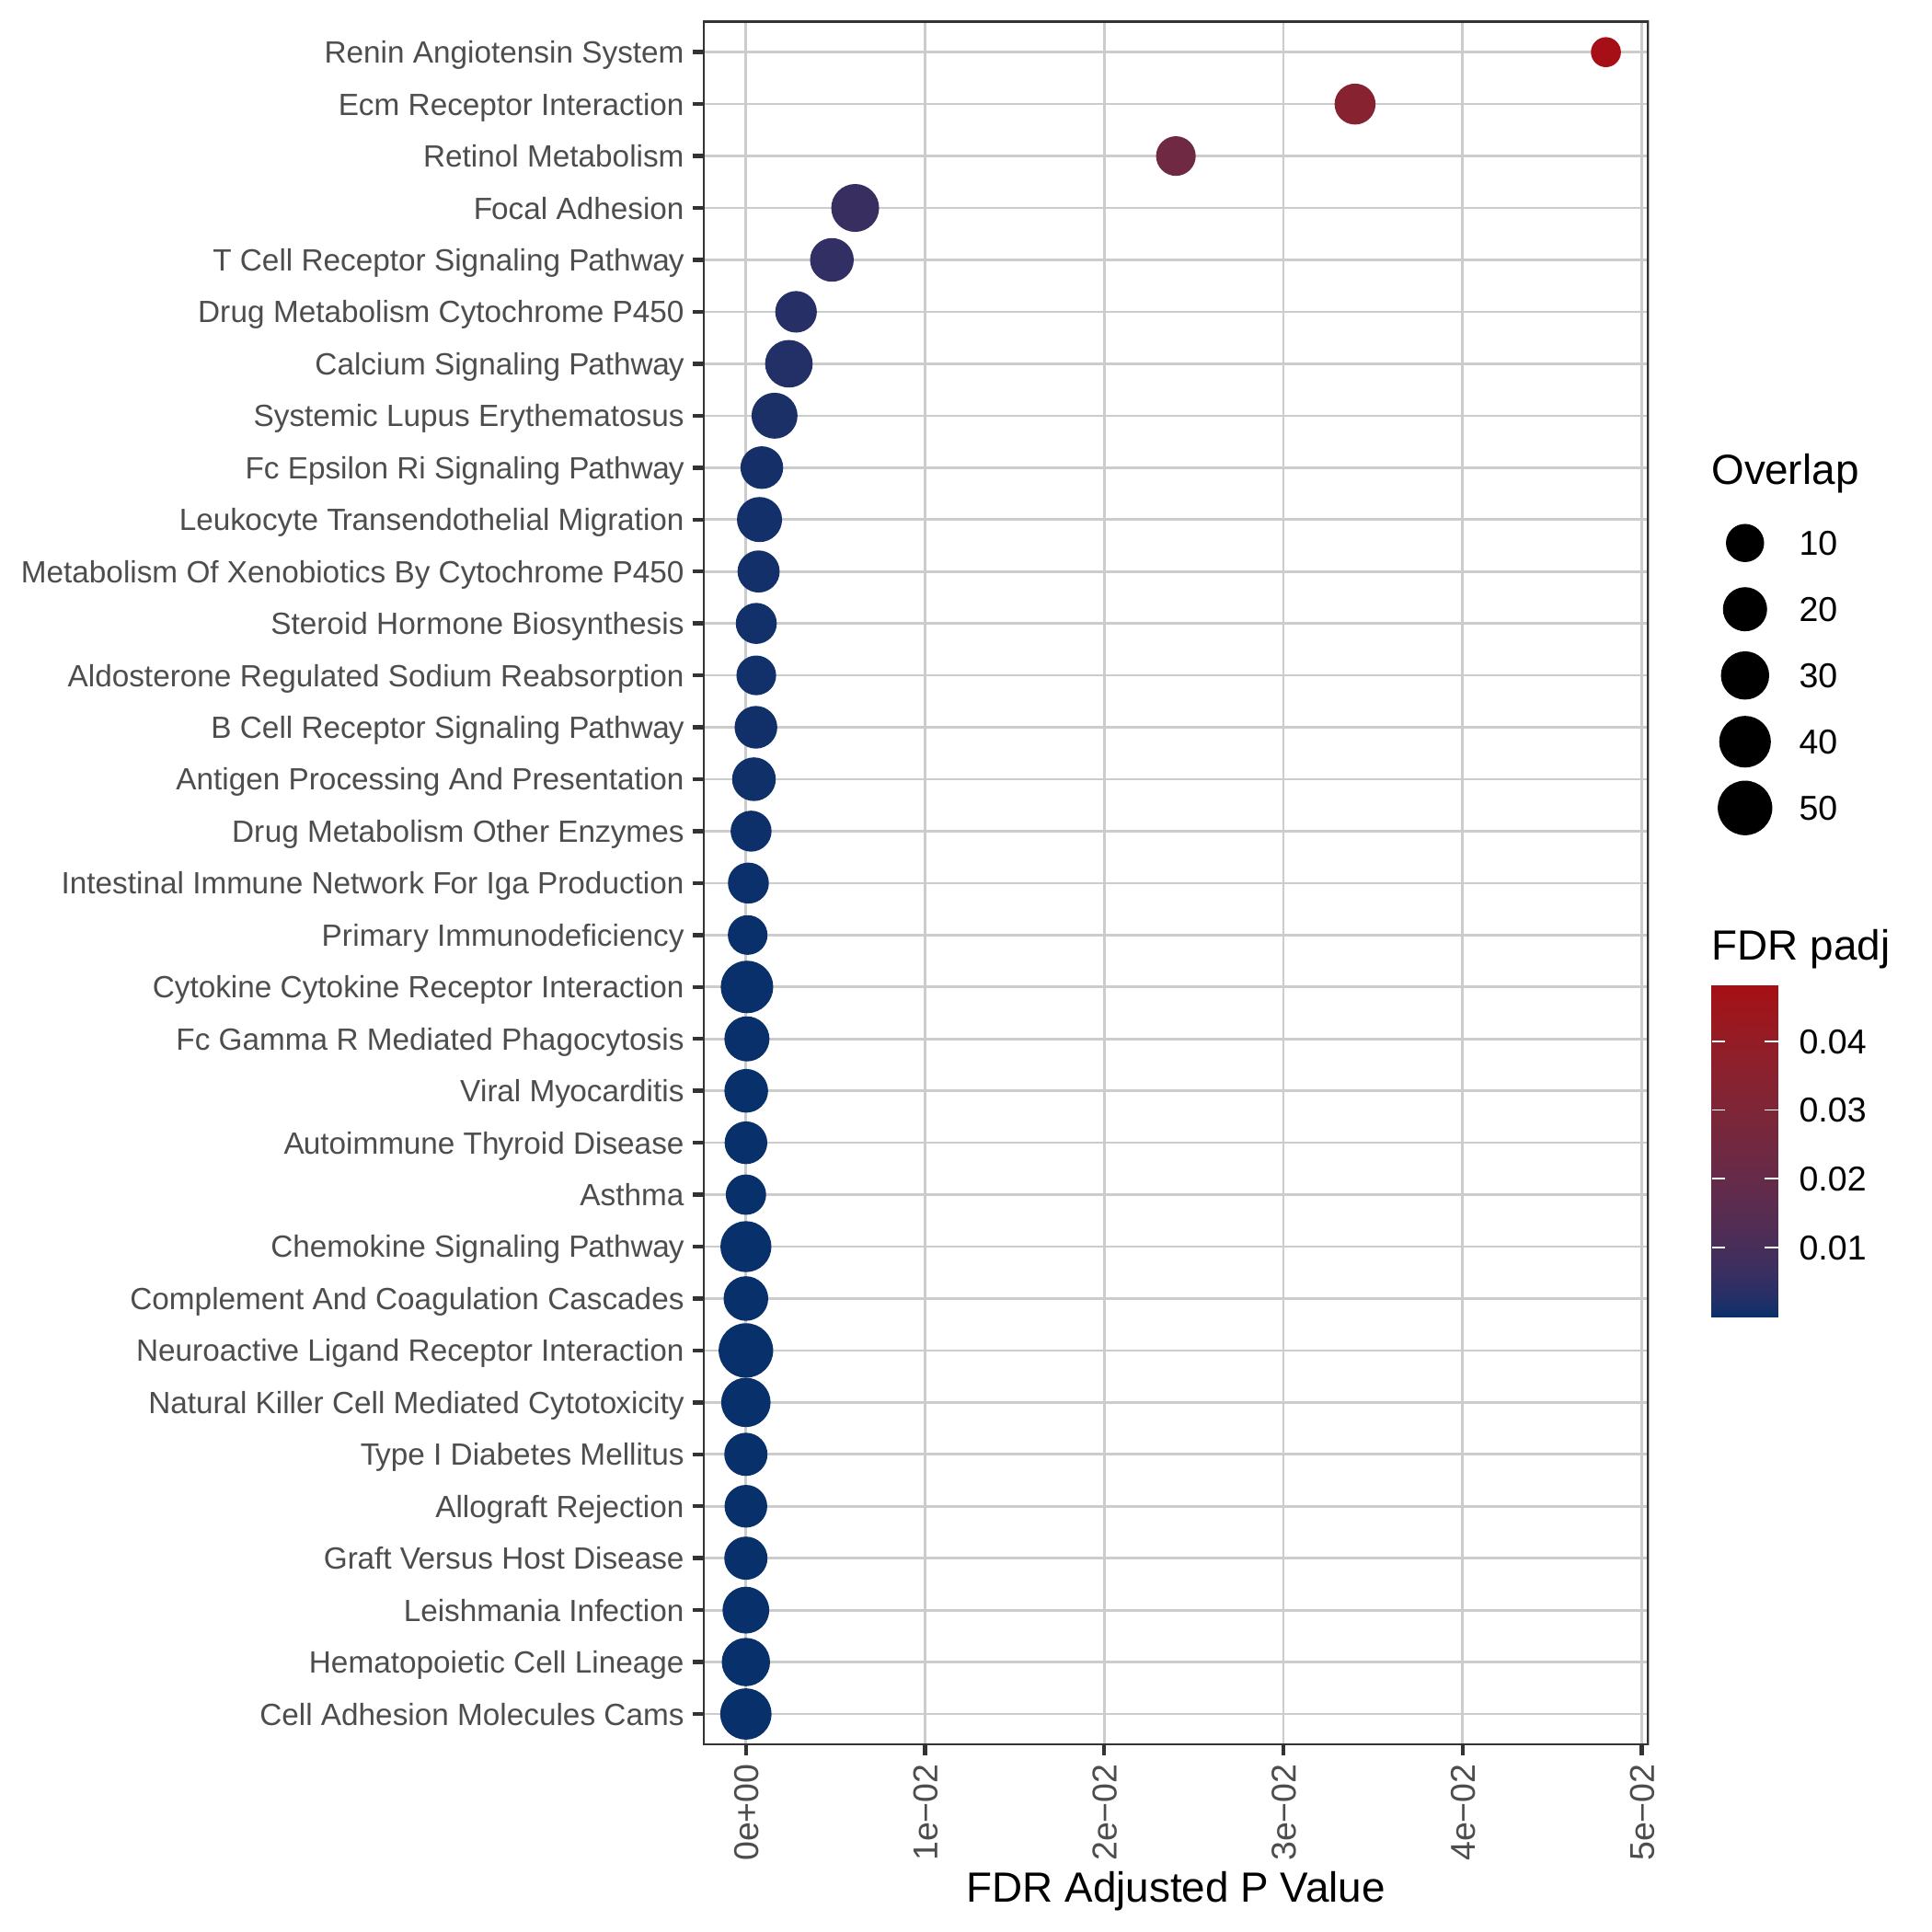 | Down-regulated GOBP pathways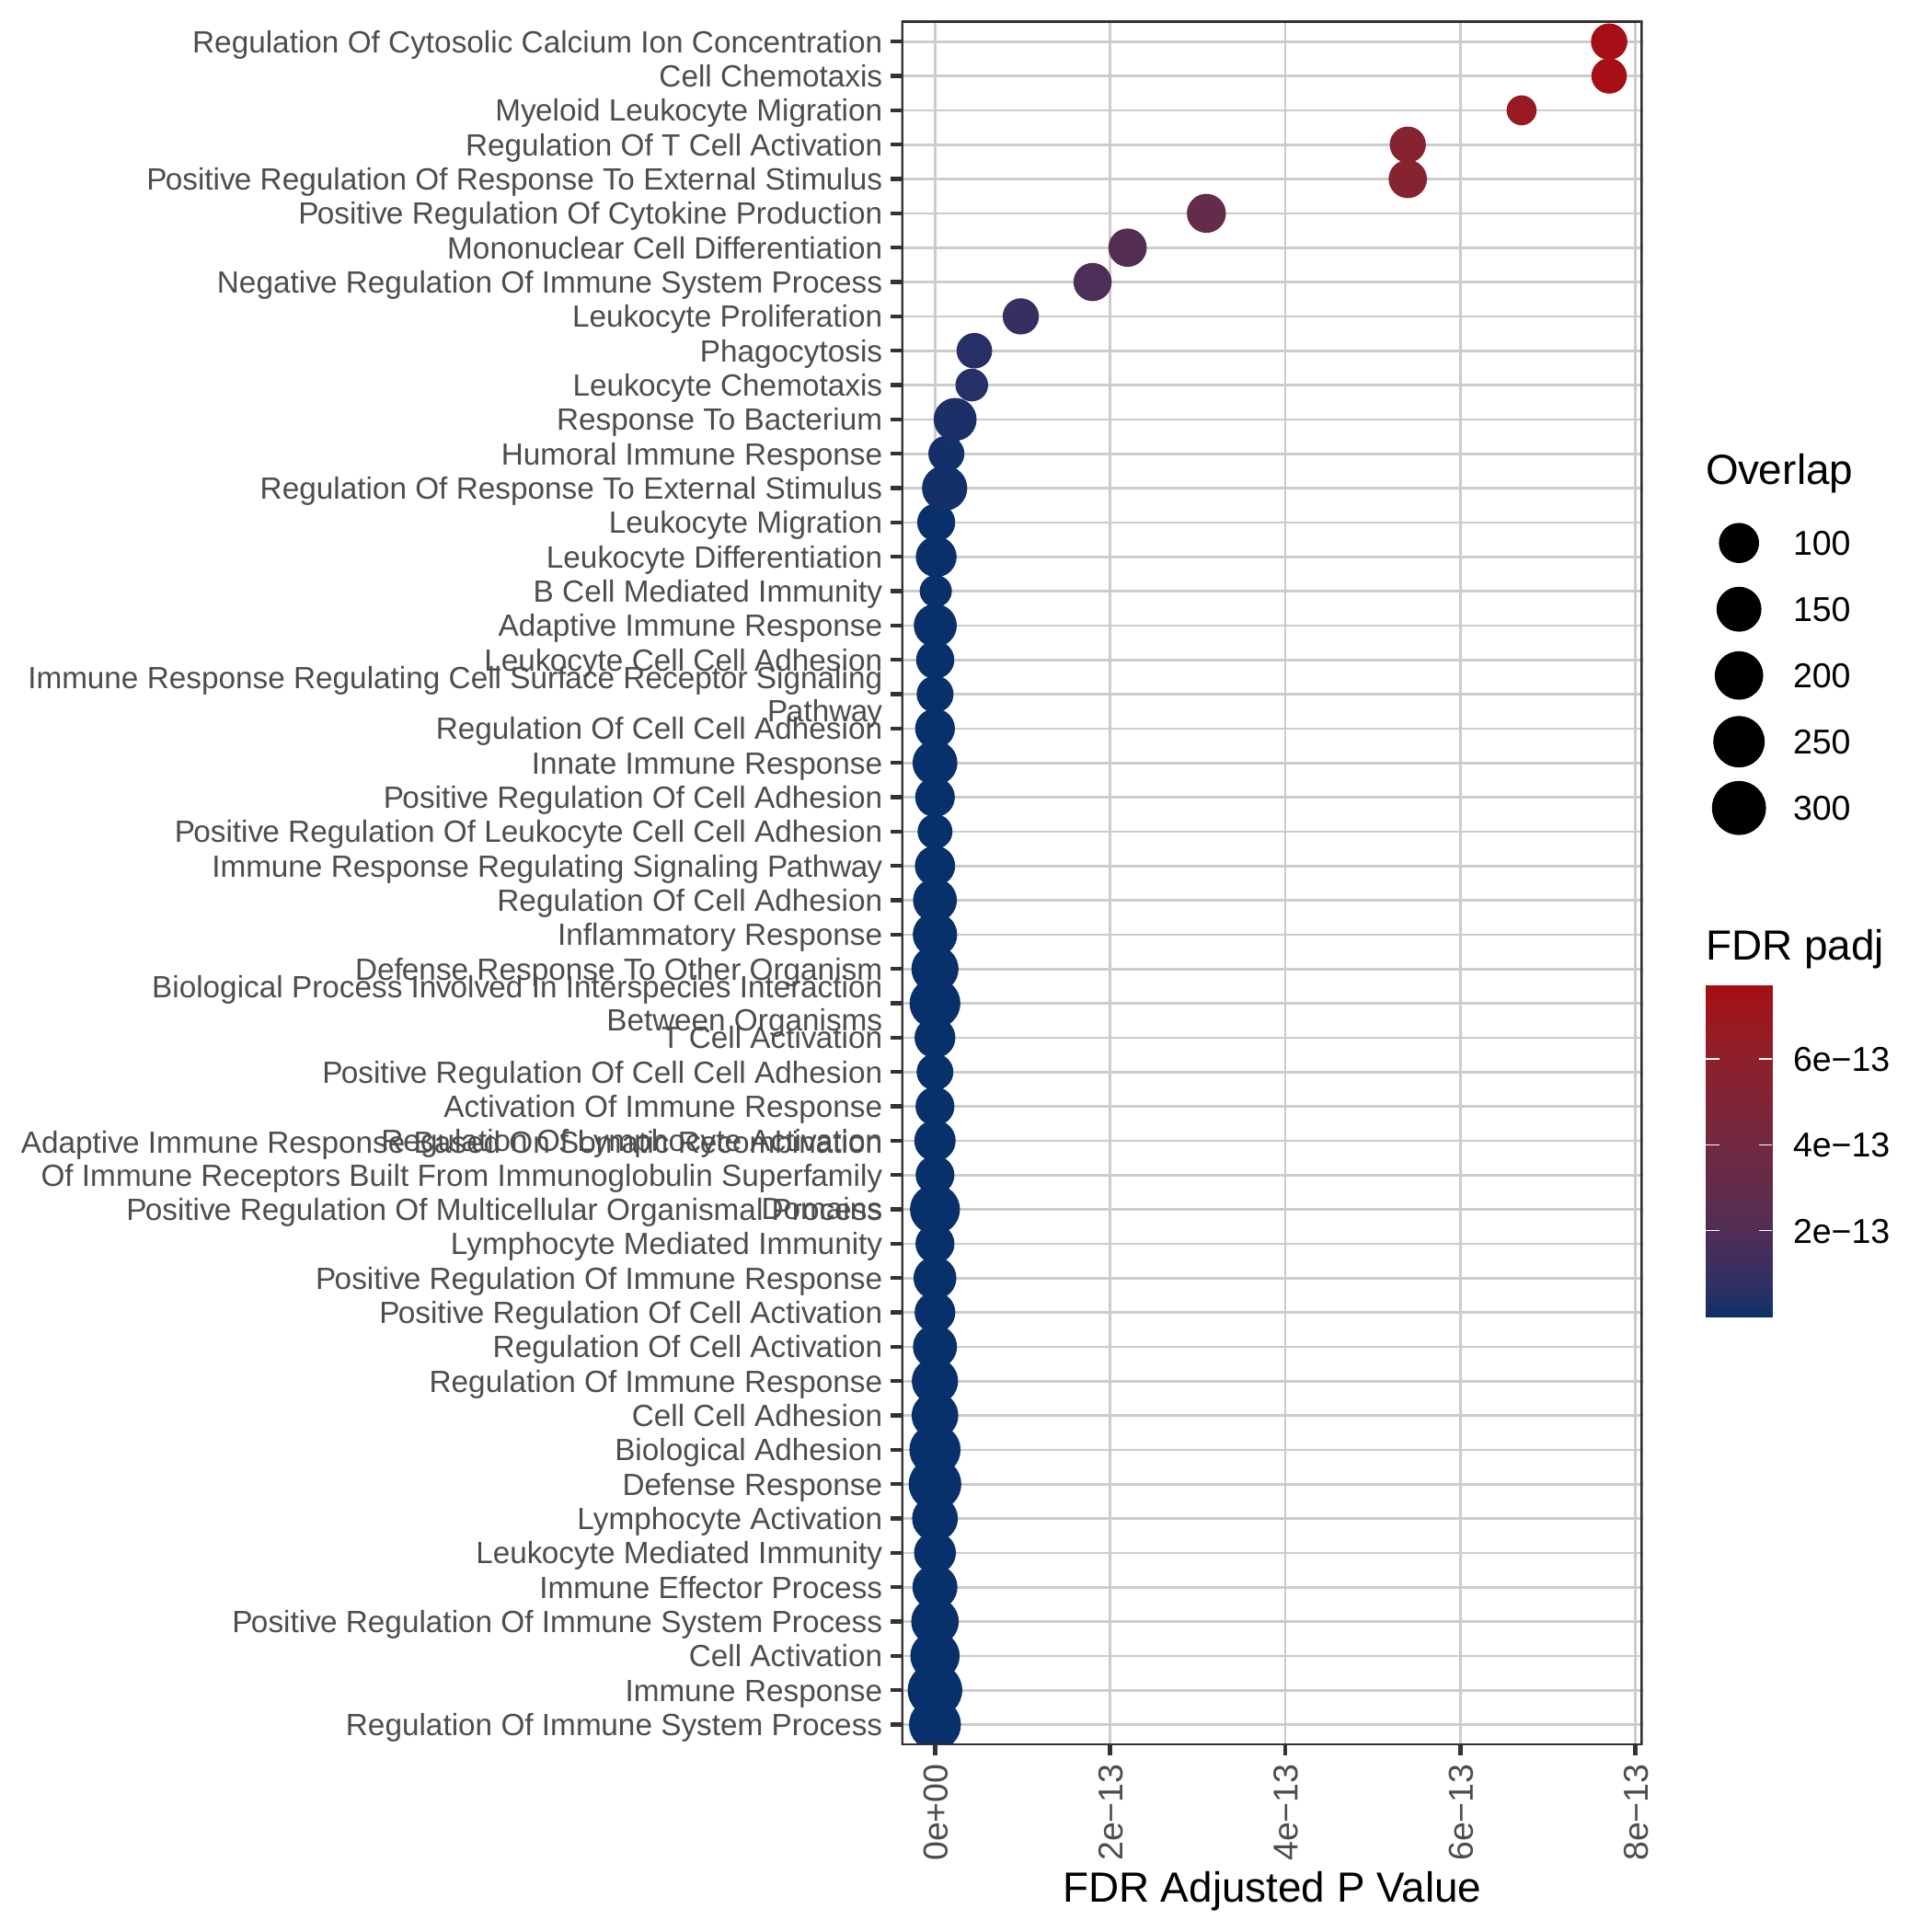 | Down-regulated Hallmark pathways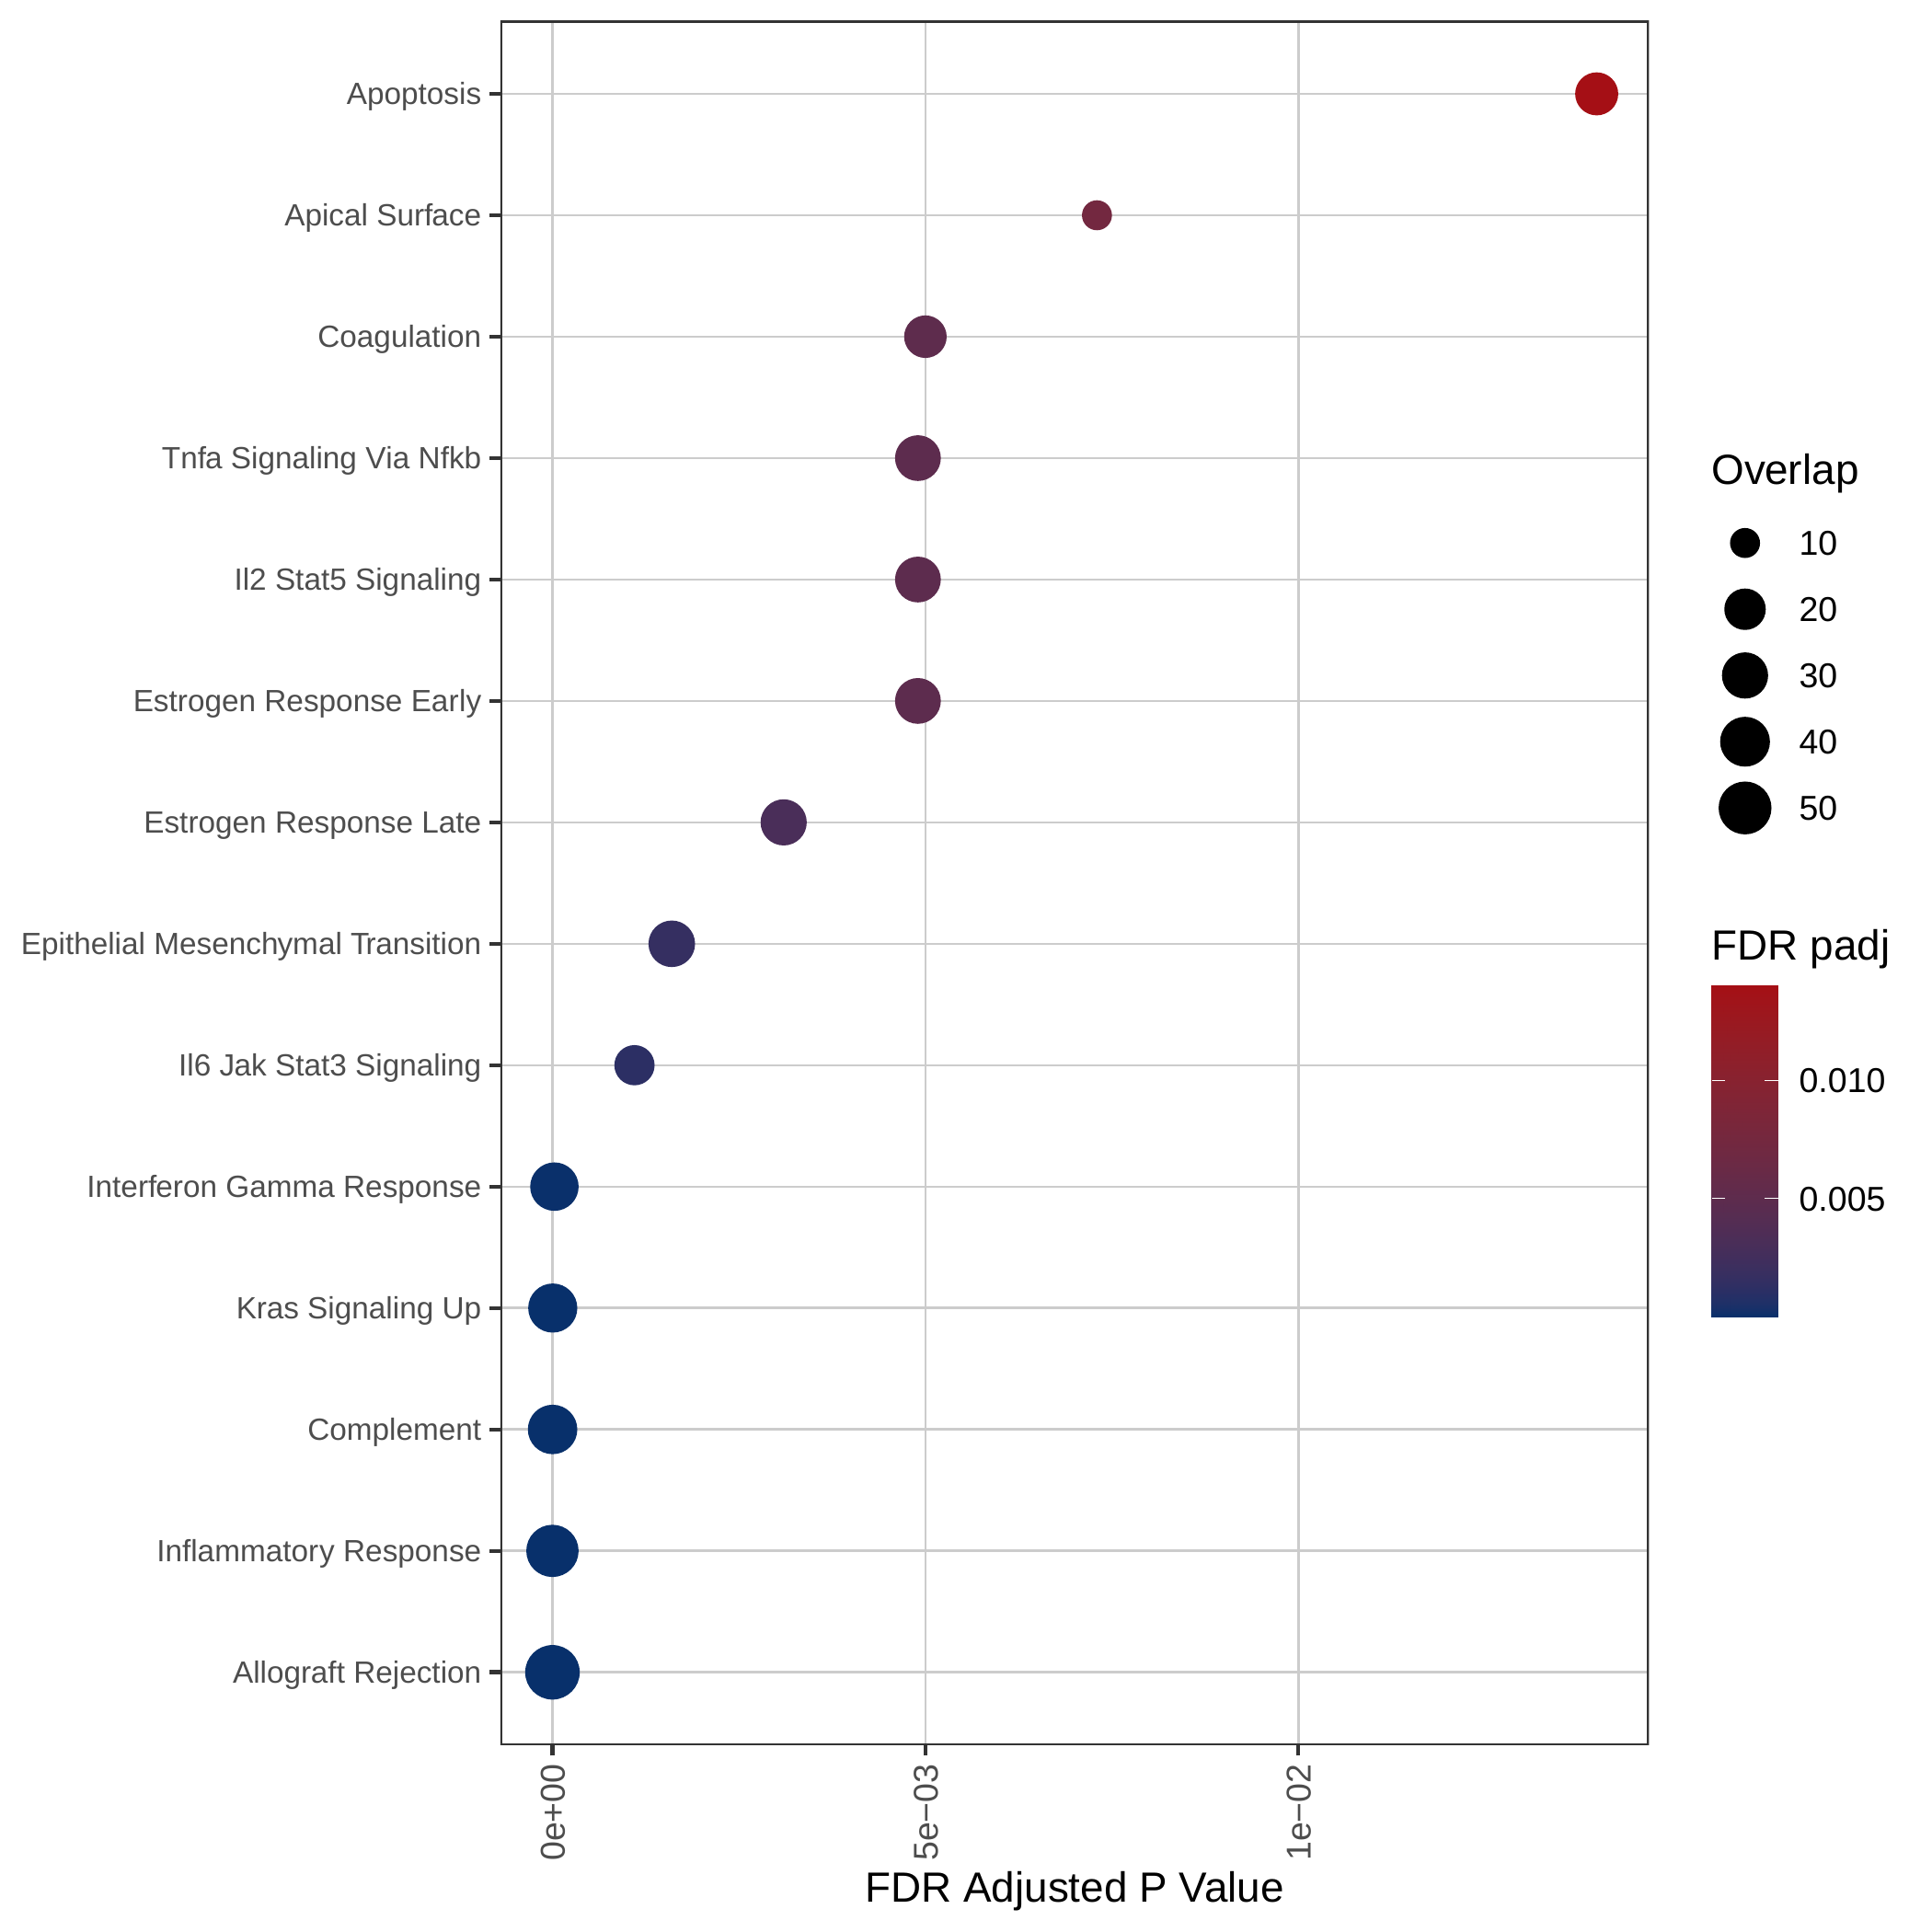 |
Gene expression and mutation differences between non-responders and responders after immunotherapy |
| Expression | Mutation |
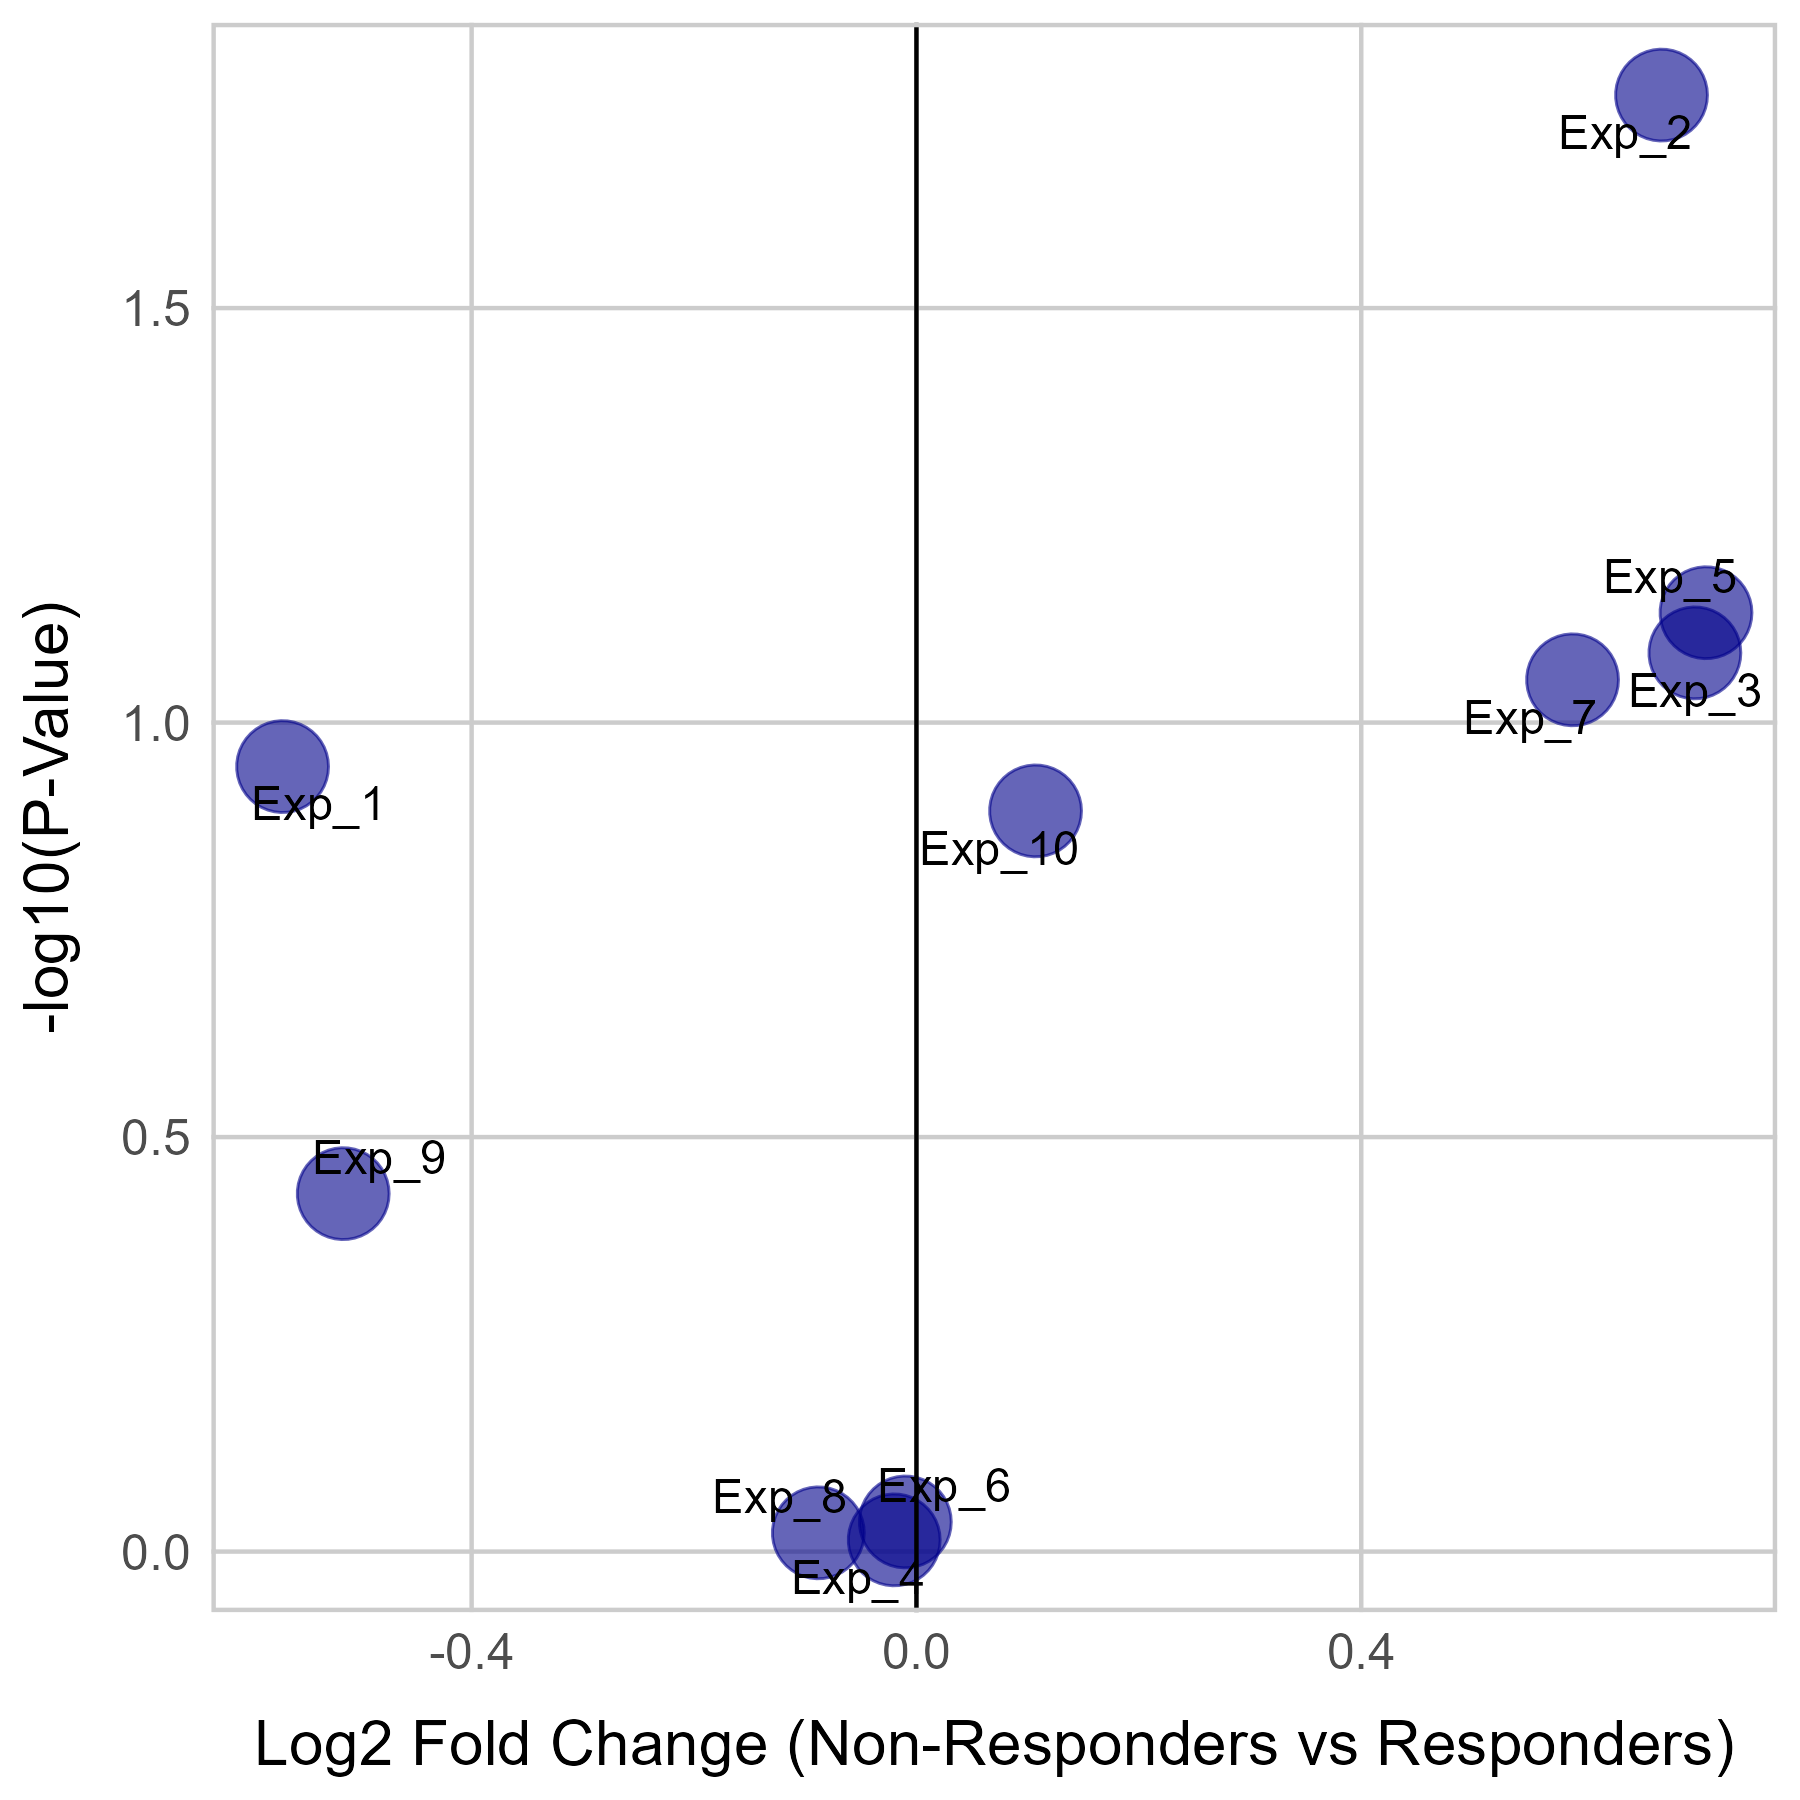 | 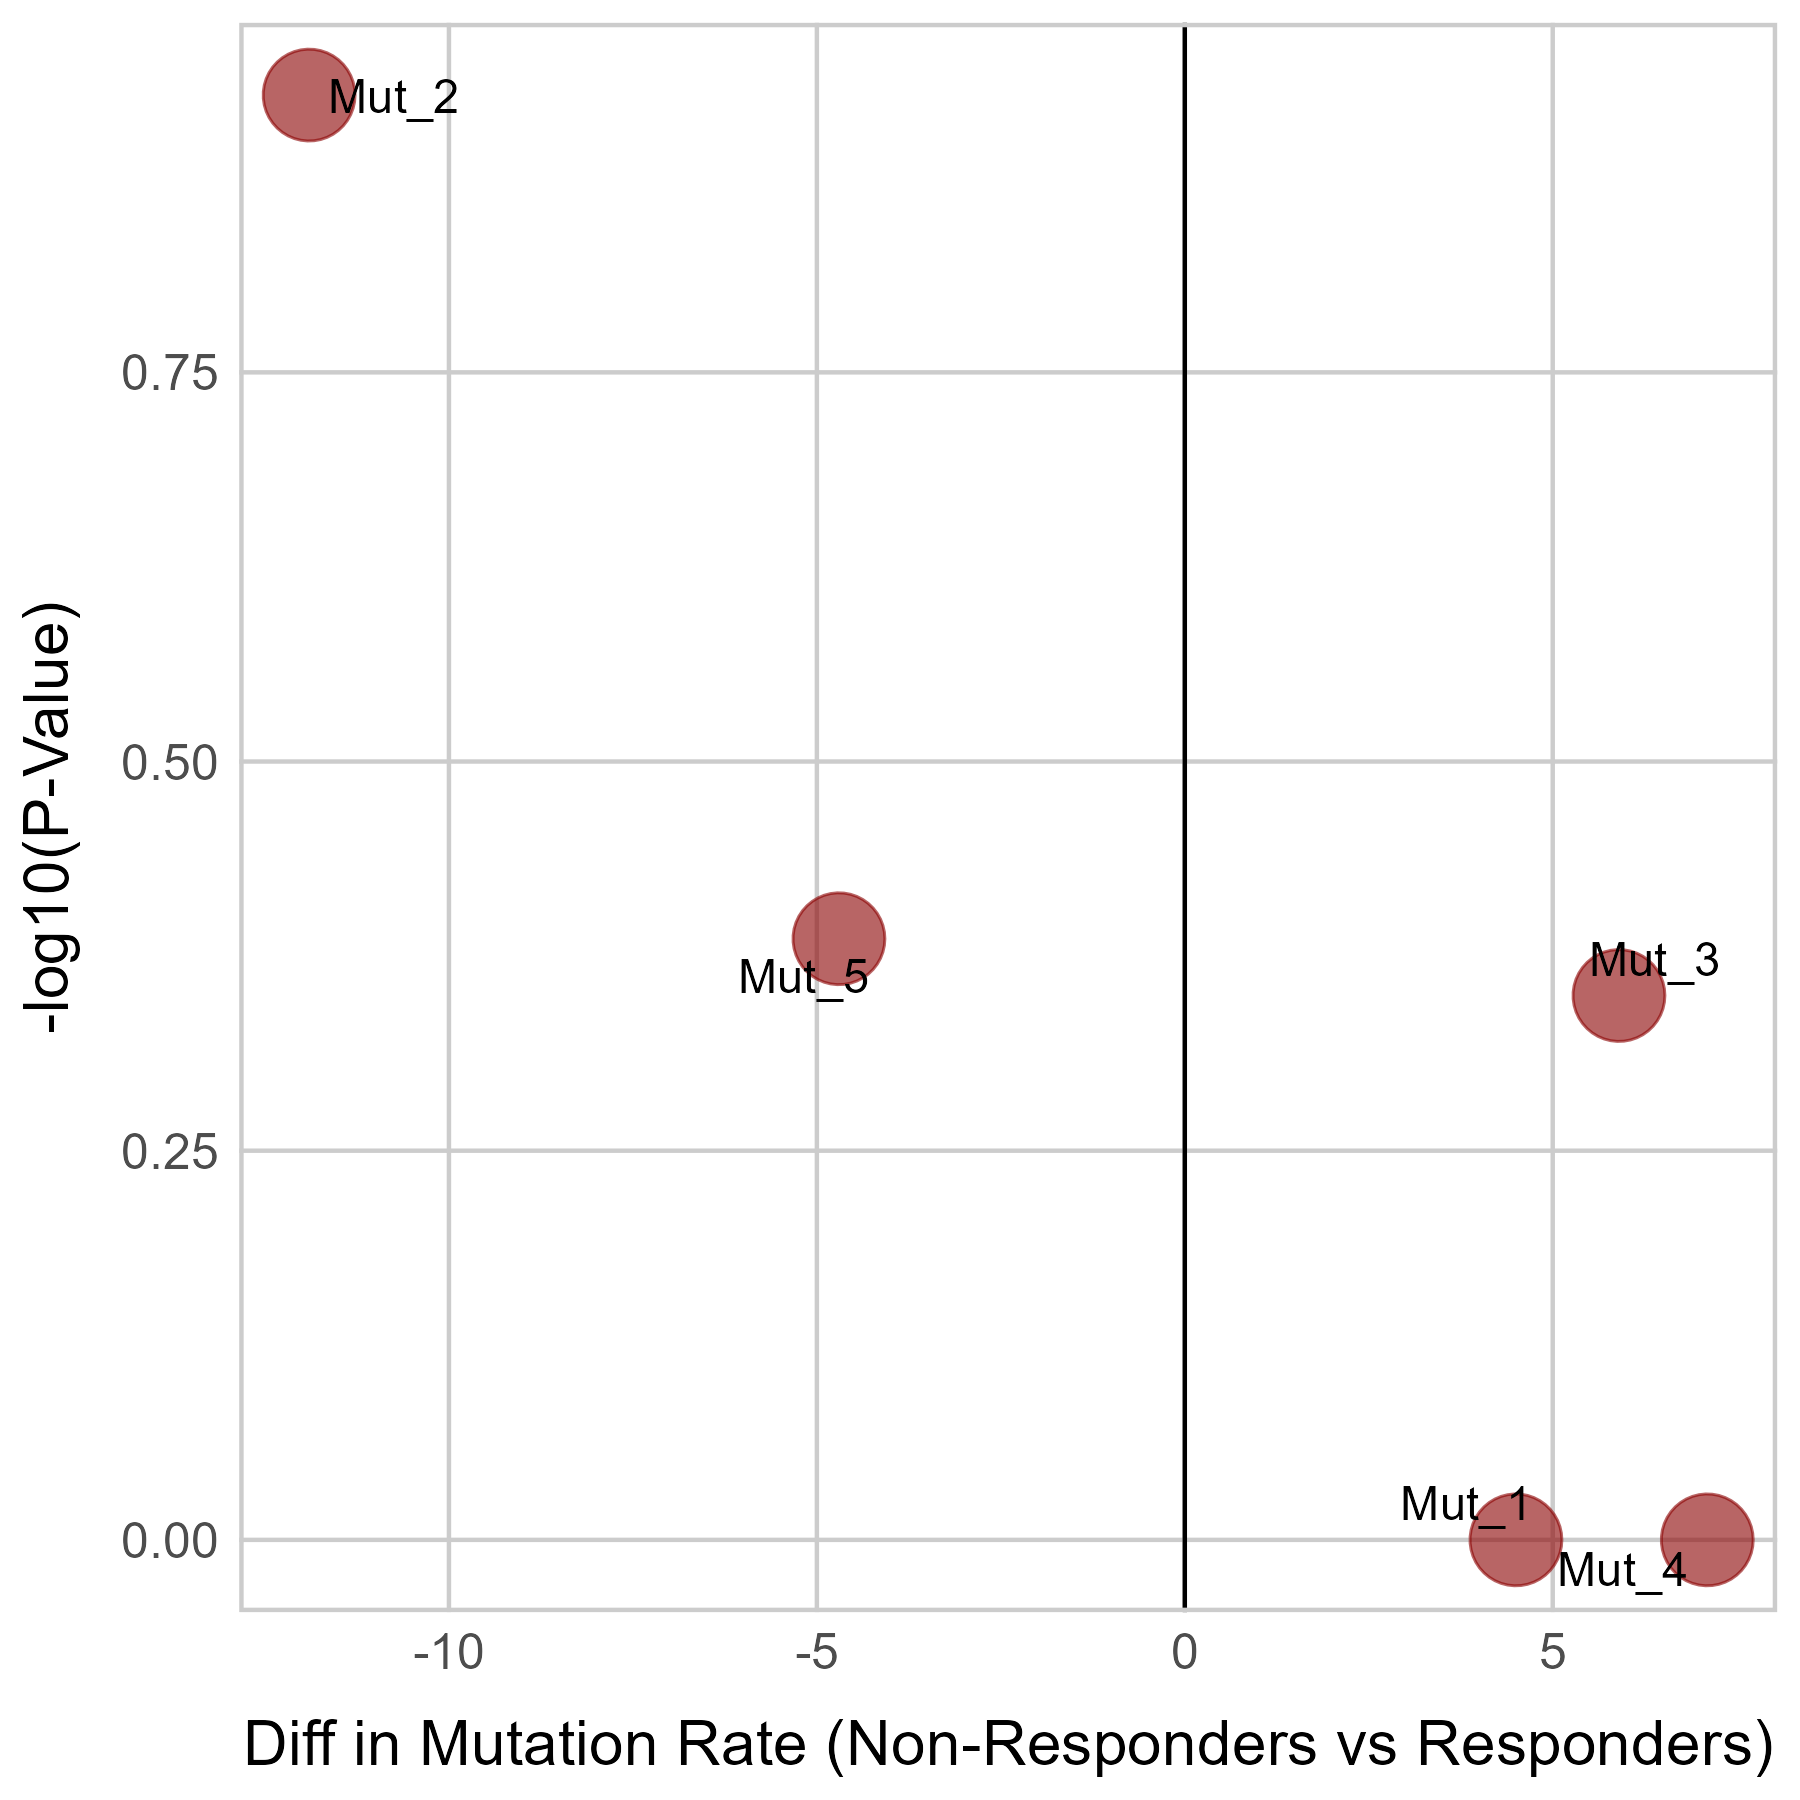 |
No significant differences were found in CTNNB1 expression.
No significant differences were found in CTNNB1 mutation.
Top |
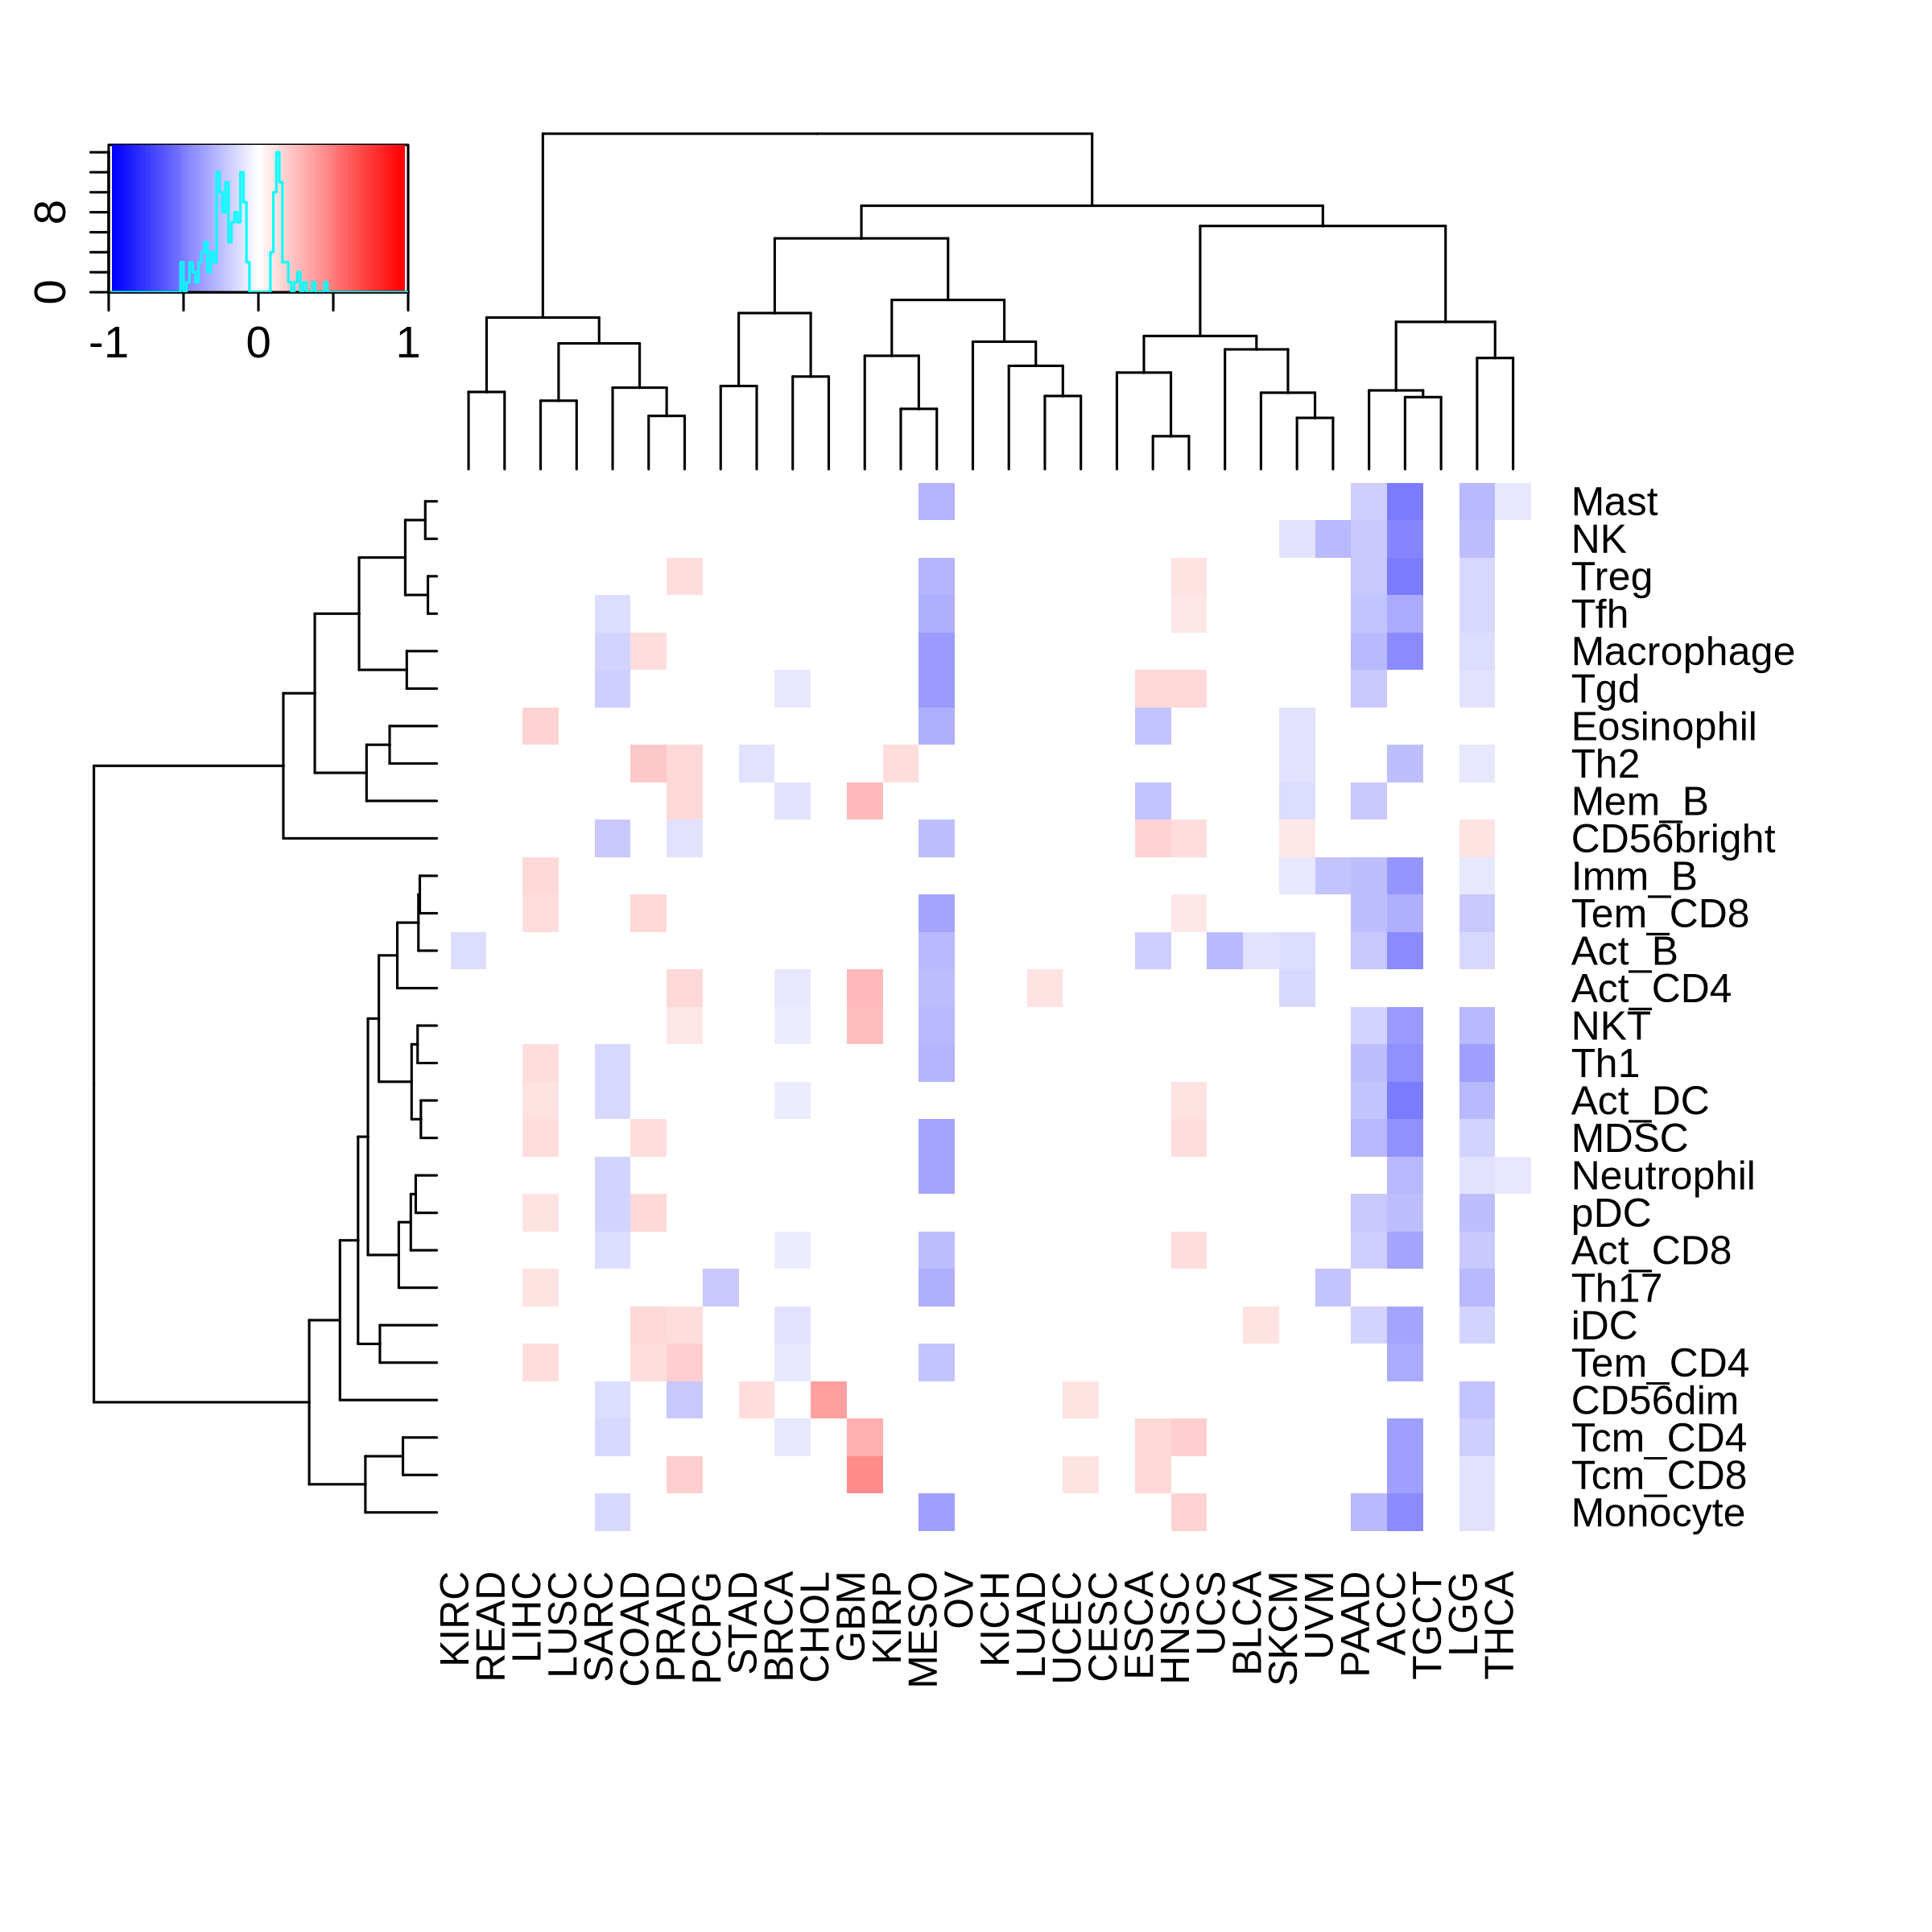
Correlation between the composition of TIL and gene expression, methylation and CNV |
| Expression | Copy number variation |
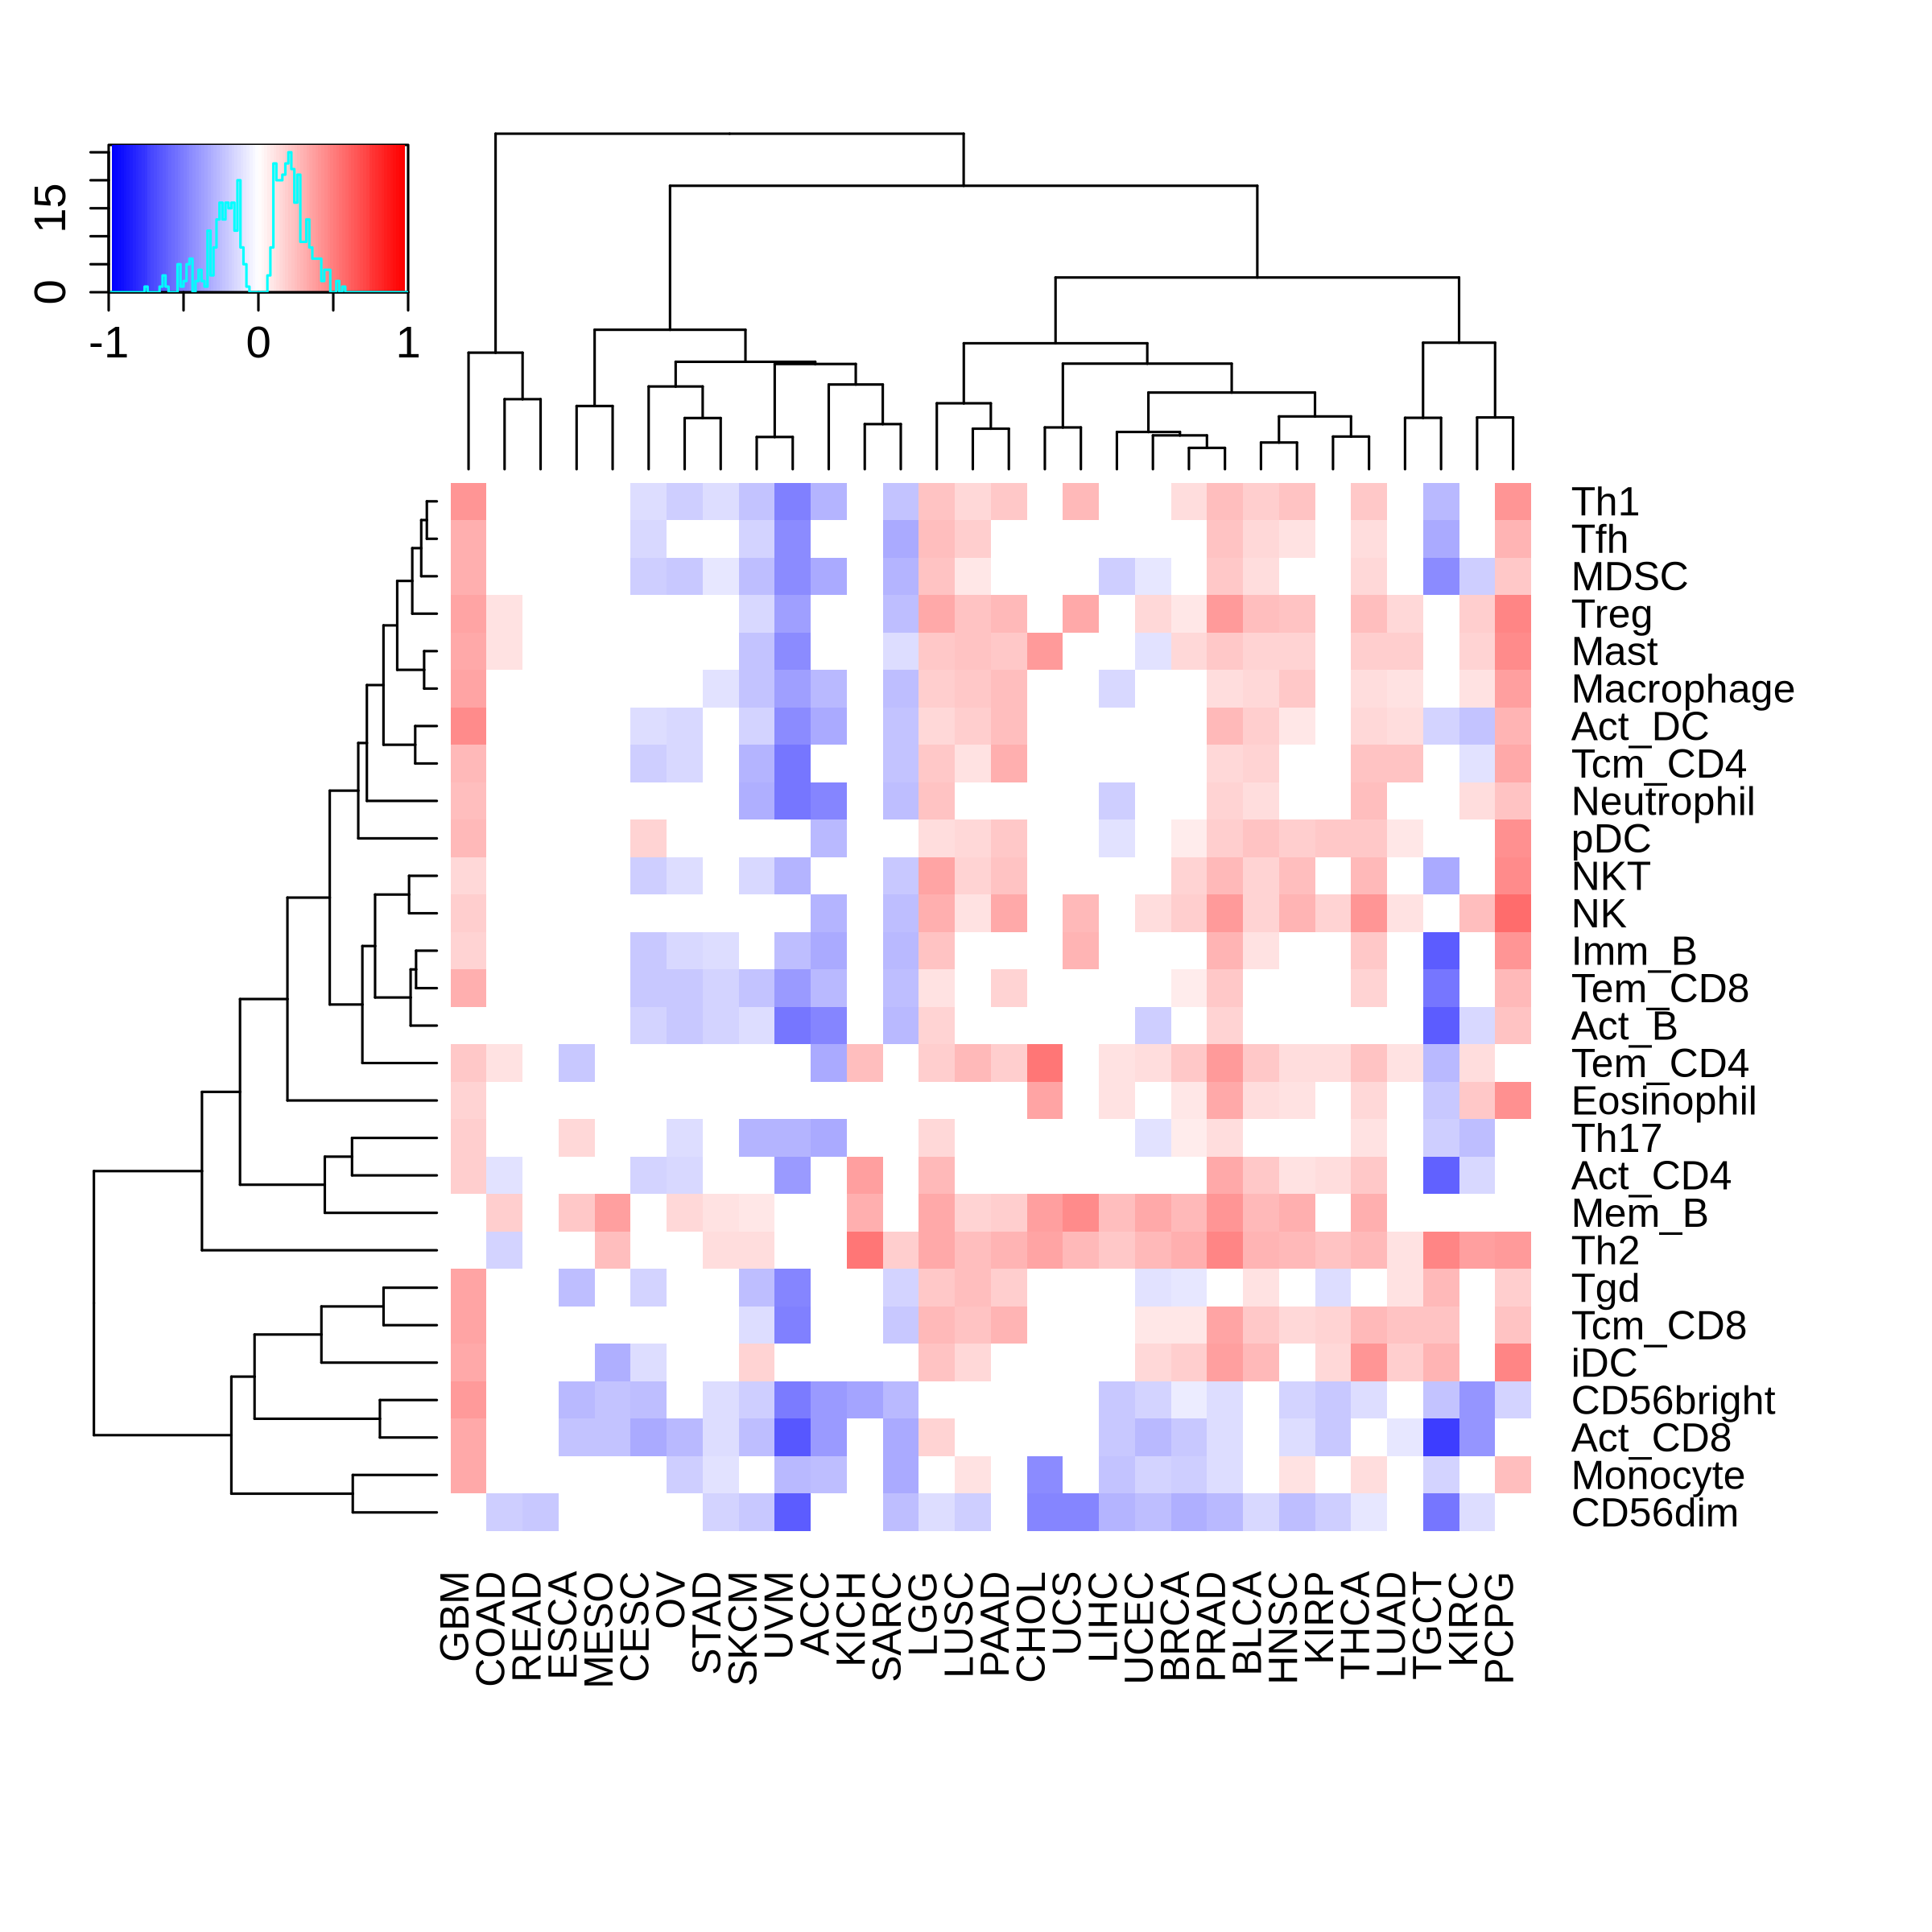 | 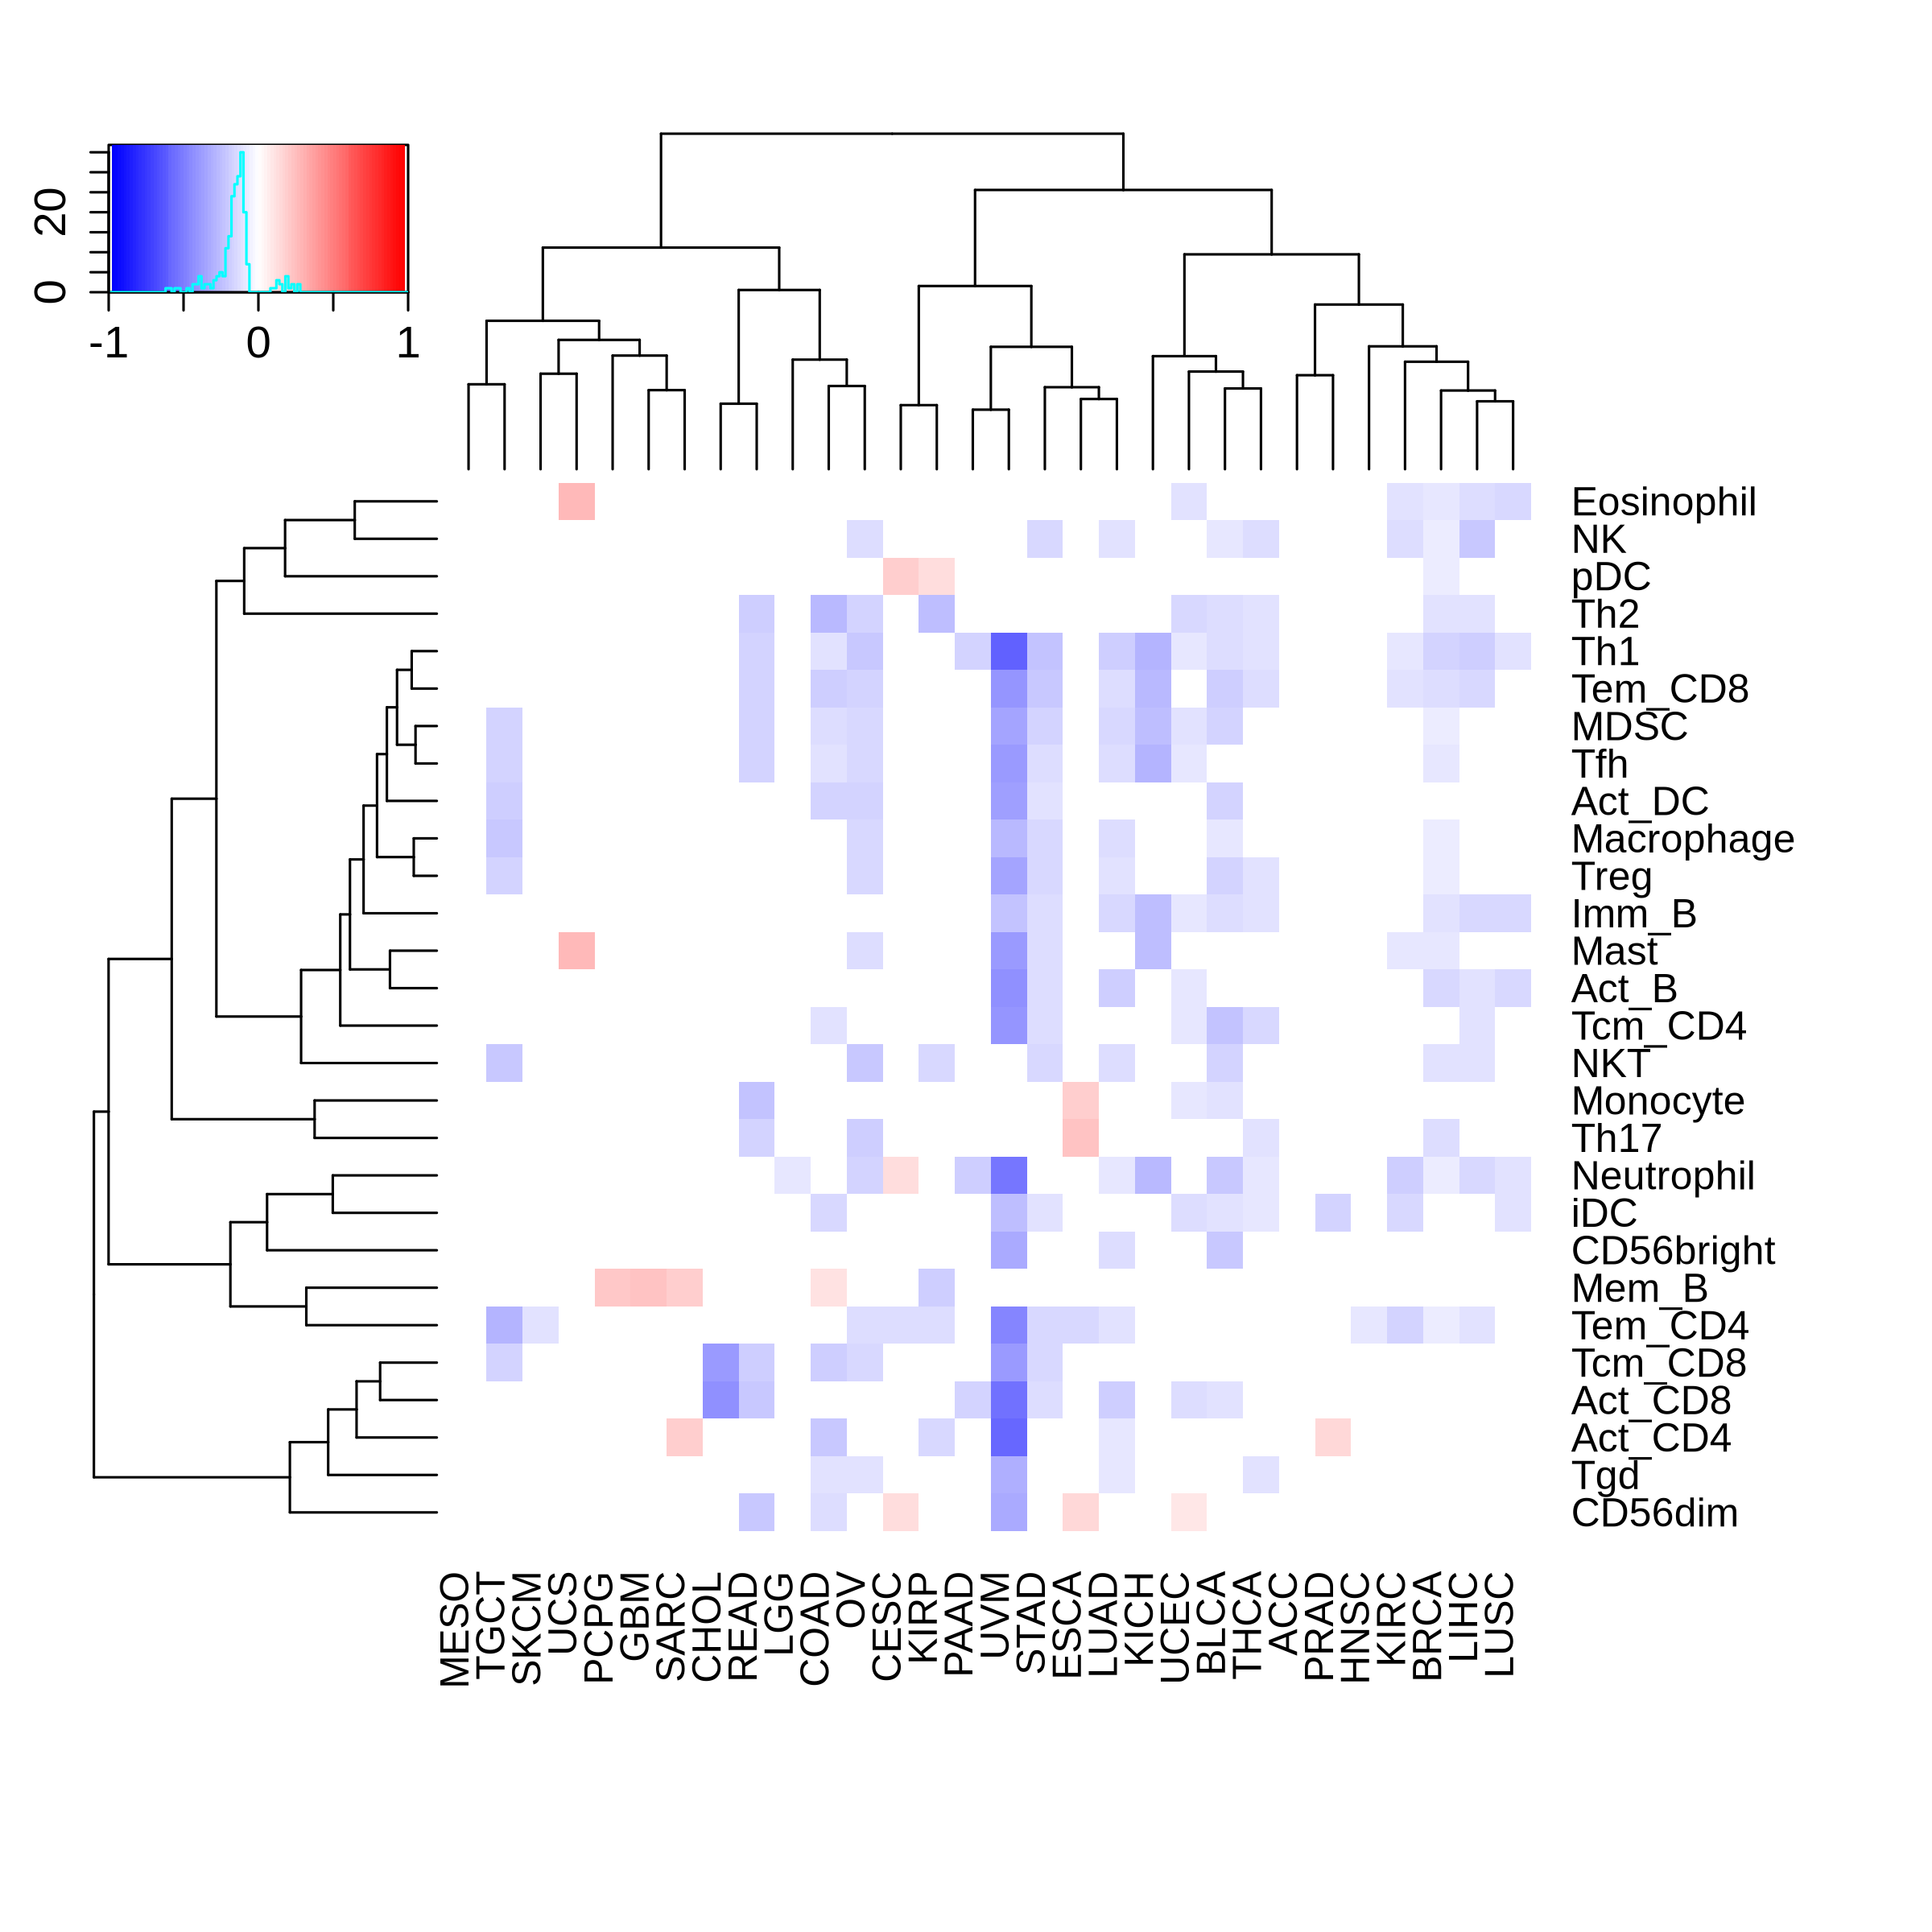 |
| Promoter methylation | Genebody methylation |
 | 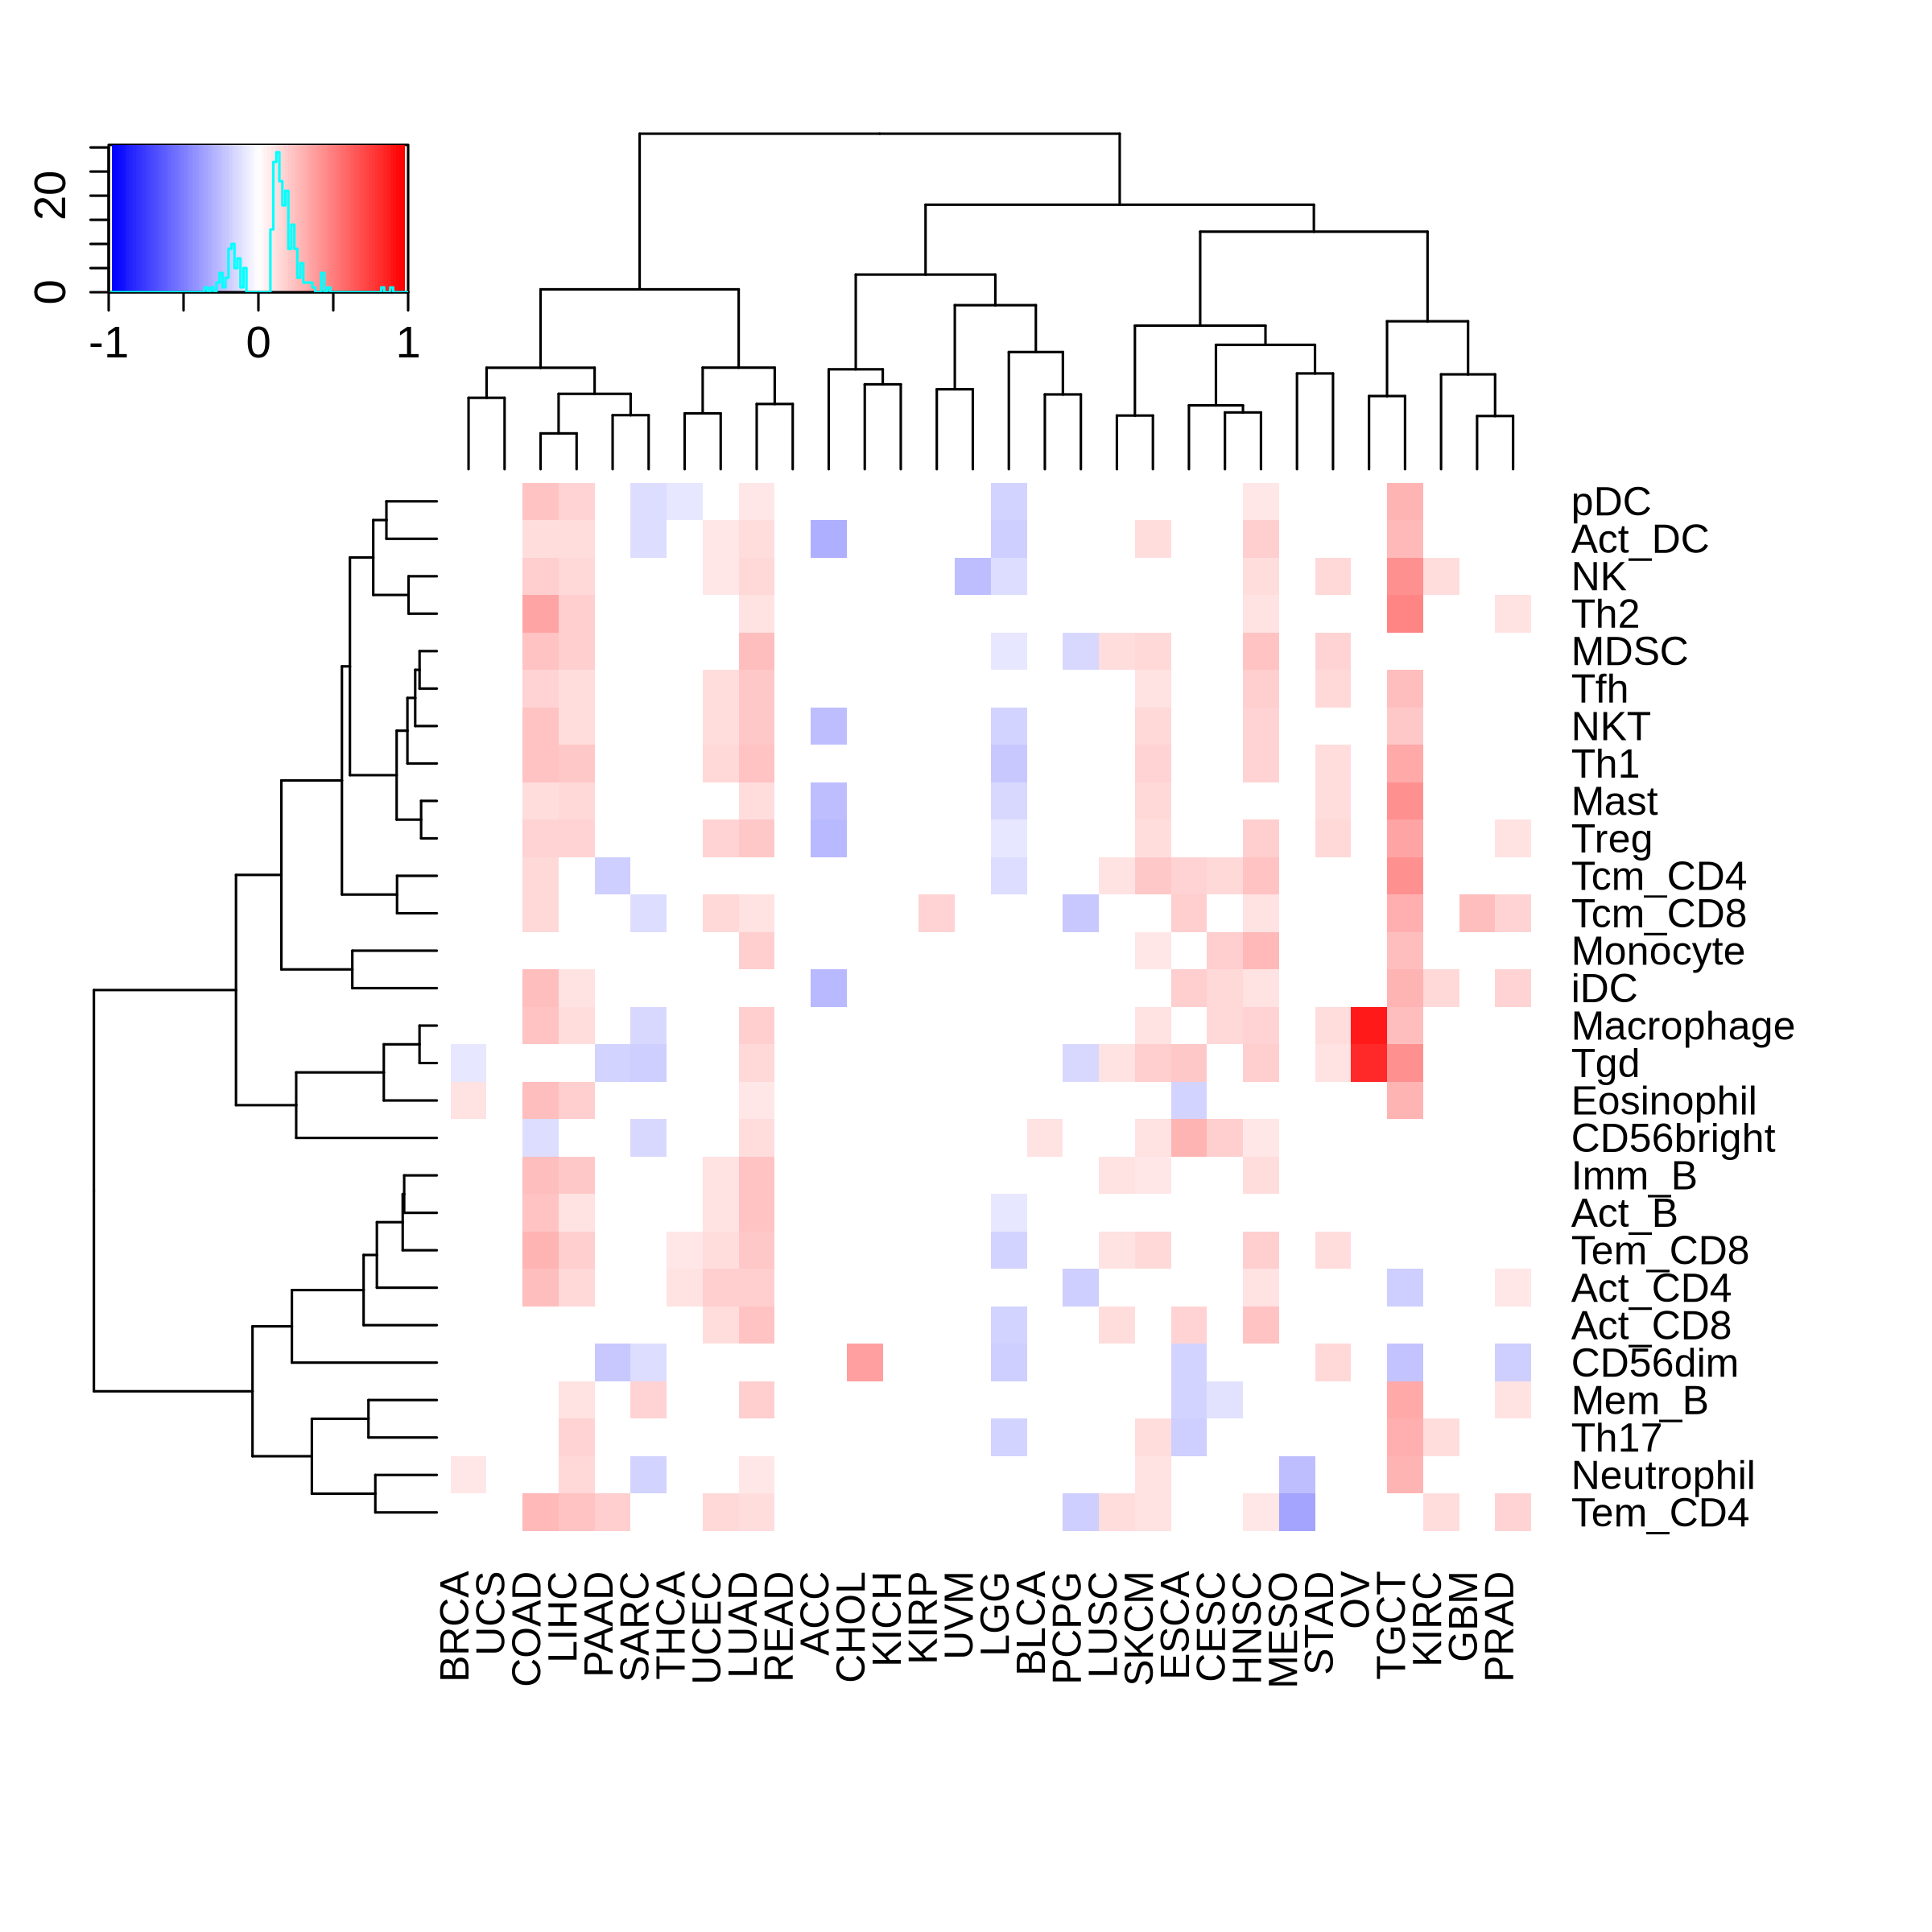 |
Top |
The association between CTNNB1 expression and immune subtypes/status |
Top |
Drugs targeting CTNNB1 and diseases related to CTNNB1. |
| Drug-gene interaction | Disease-gene association |
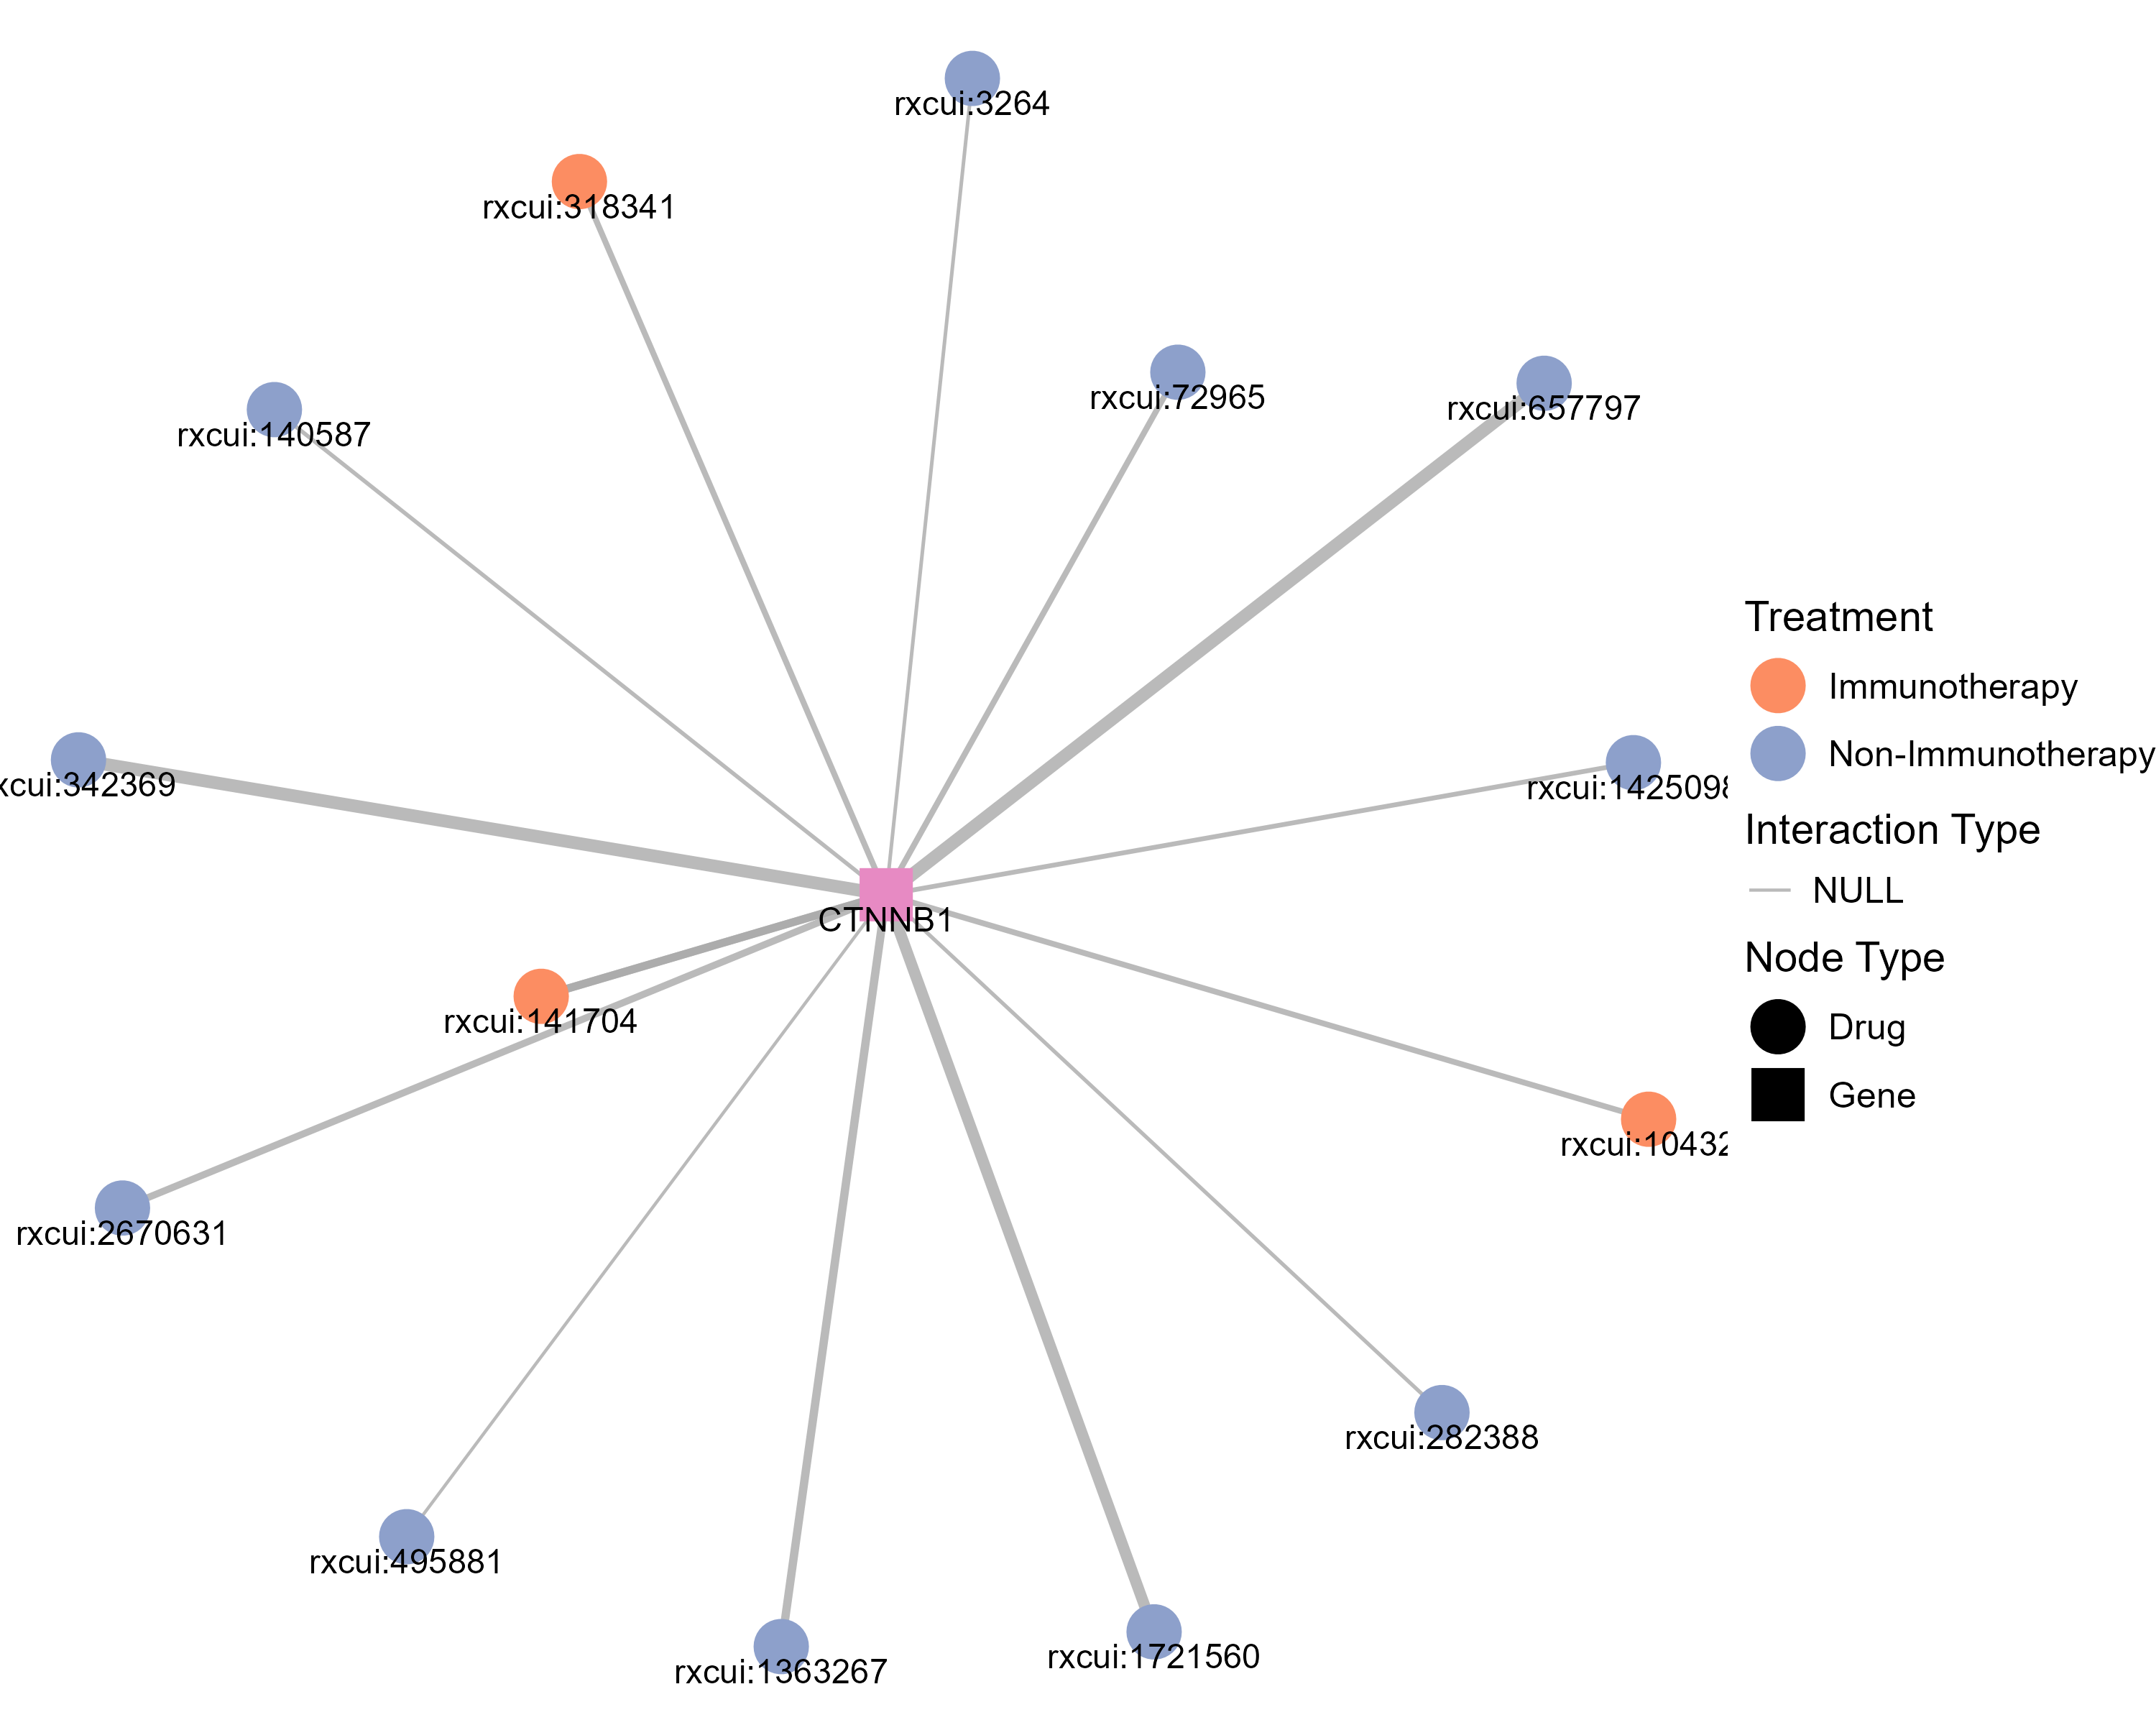 | 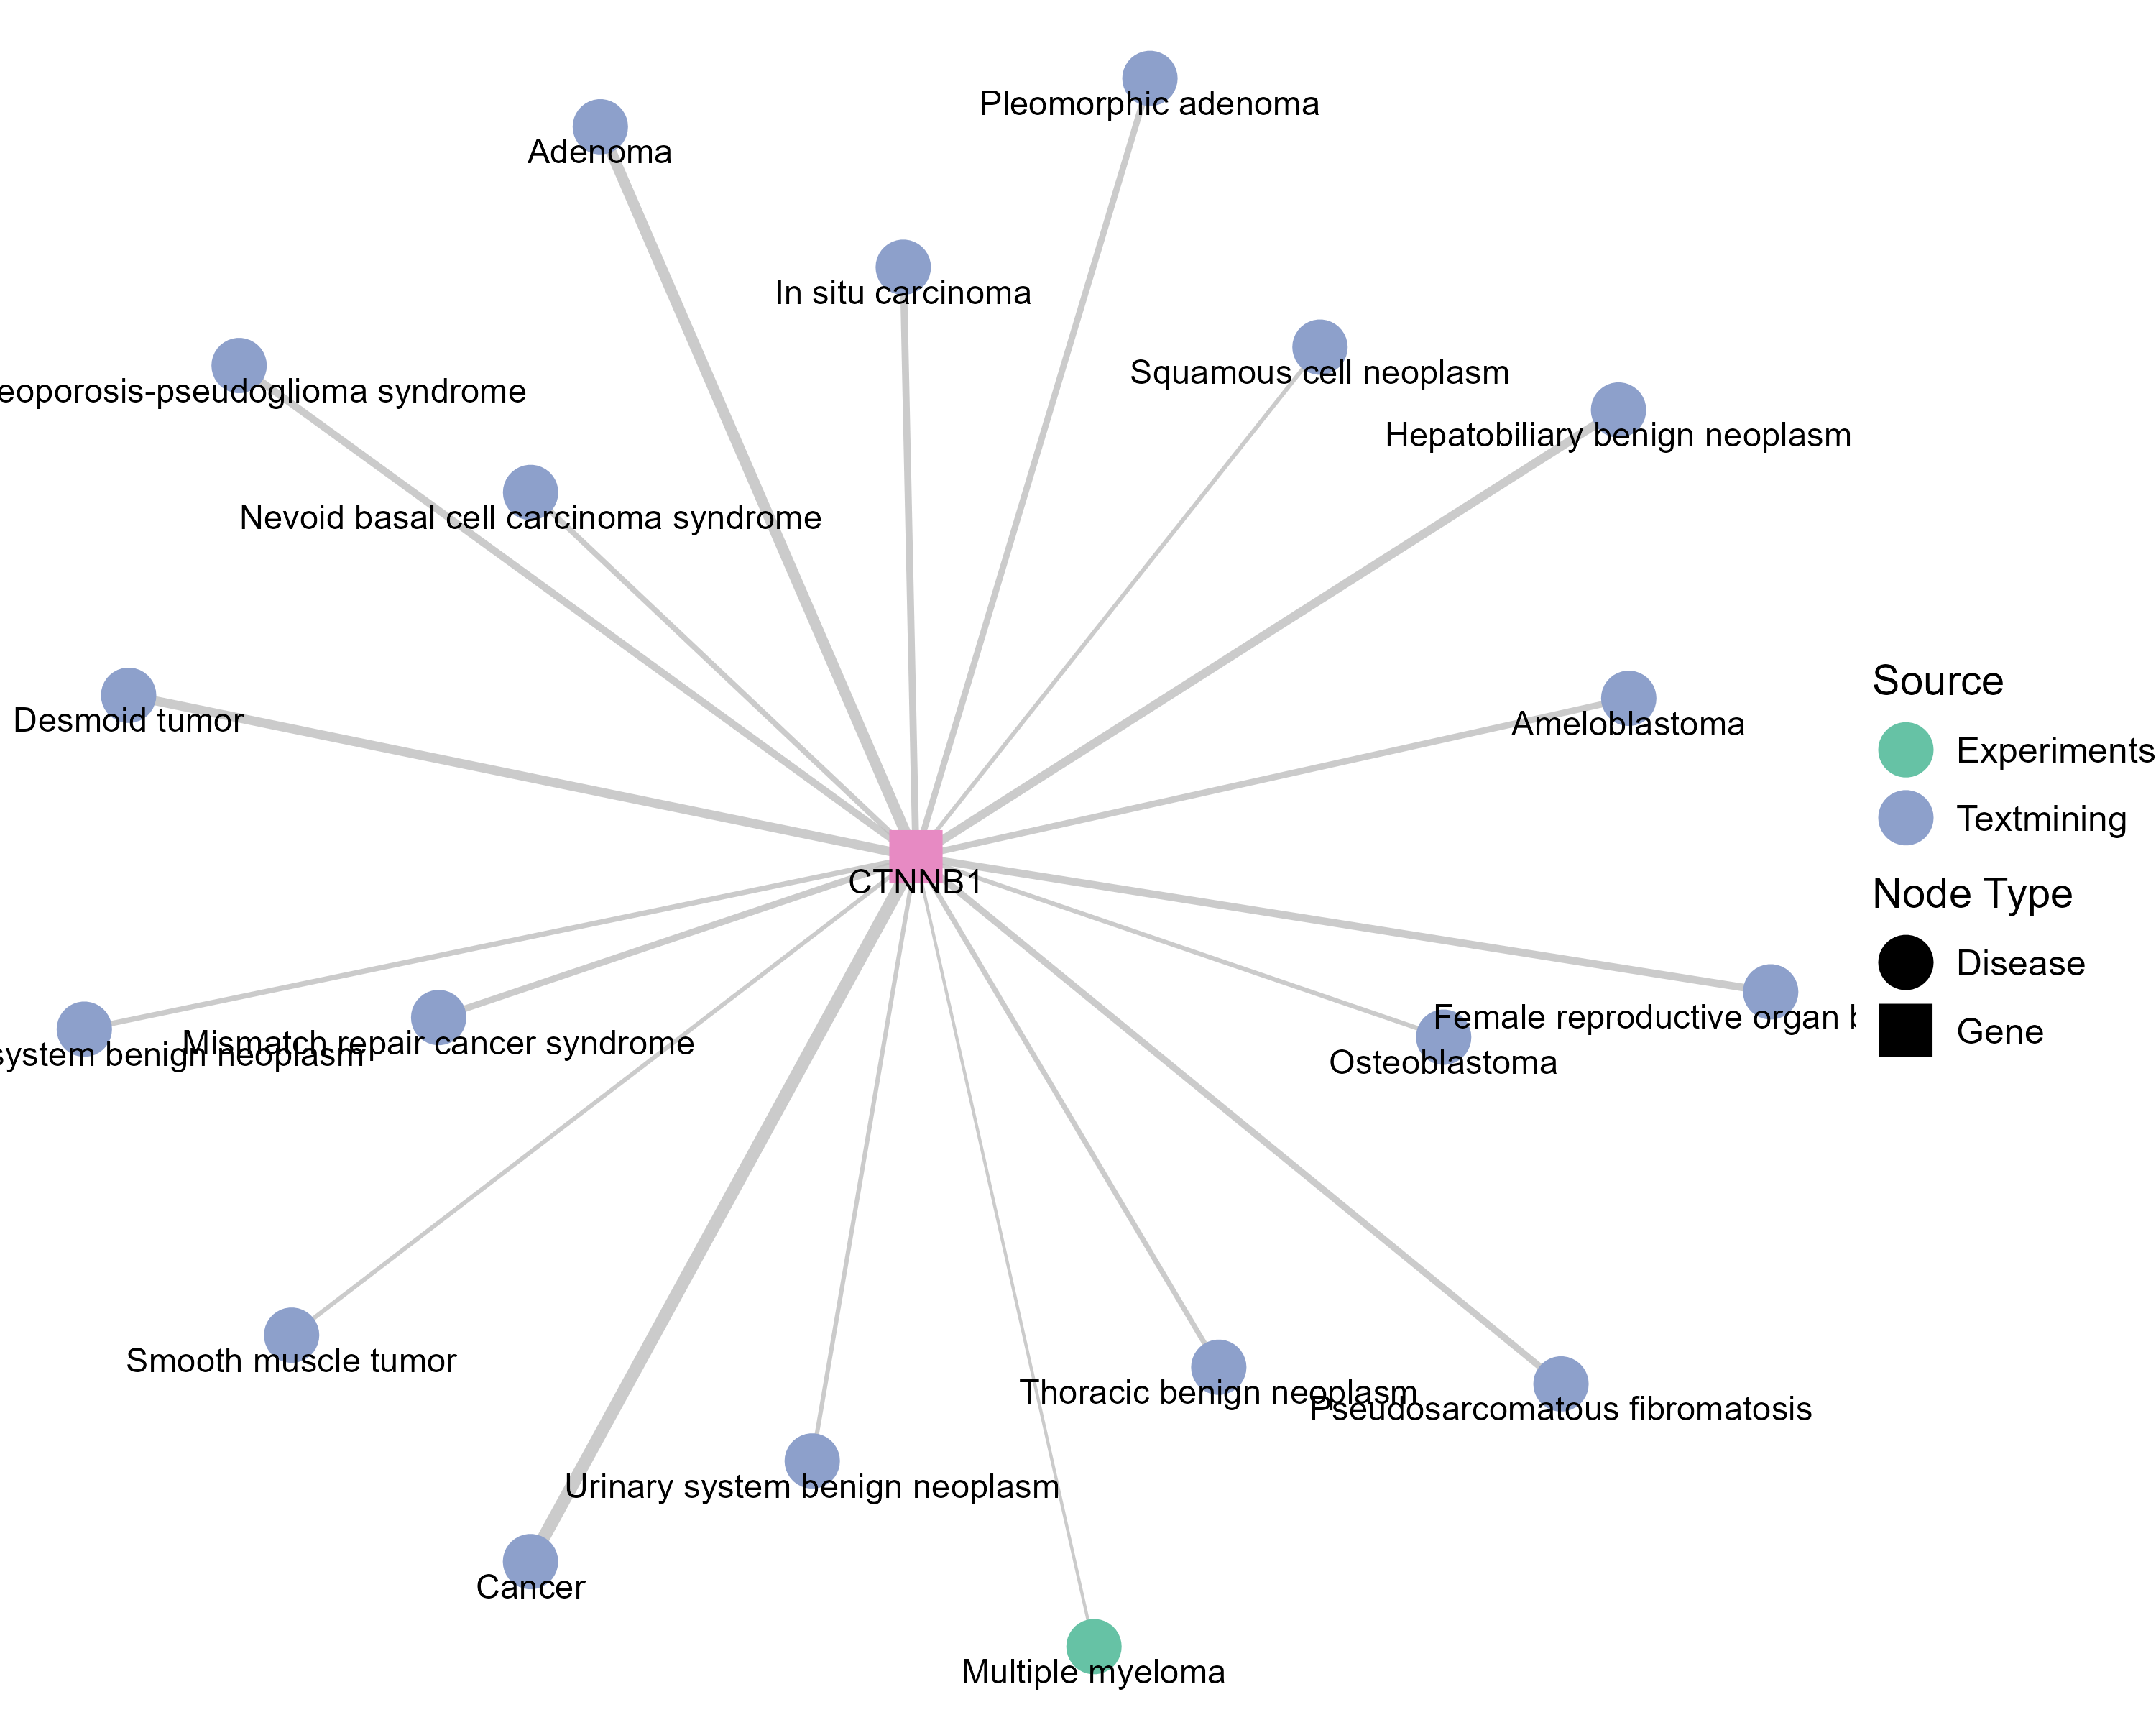 |
Top |
Survival analysis based on CTNNB1 expression |
Top |
| Reference |
| [1] Steele CD, Abbasi A, Islam SMA, et al. Signatures of copy number alterations in human cancer. Nature. 2022 Jun;606(7916):984-991. doi: 10.1038/s41586-022-04738-6. Epub 2022 Jun 15. PMID: 35705804; PMCID: PMC9242861. [2] Beibei Ru, Ching Ngar Wong, Yin Tong, et al. TISIDB: an integrated repository portal for tumor–immune system interactions, Bioinformatics, Volume 35, Issue 20, October 2019, Pages 4200–4202, https://doi.org/10.1093/bioinformatics/btz210. [3] Zhongyang Liu, Jiale Liu, Xinyue Liu, et al. CTR–DB, an omnibus for patient-derived gene expression signatures correlated with cancer drug response, Nucleic Acids Research, Volume 50, Issue D1, 7 January 2022, Pages D1184–D1199, https://doi.org/10.1093/nar/gkab860. [4] Charoentong P, Finotello F, Angelova M, et al. Pan-cancer Immunogenomic Analyses Reveal Genotype-Immunophenotype Relationships and Predictors of Response to Checkpoint Blockade. Cell Rep. 2017 Jan 3;18(1):248–262. doi: 10.1016/j.celrep.2016.12.019. PMID: 28052254. [5] Thorsson V, Gibbs DL, Brown SD, et al. The Immune Landscape of Cancer. Immunity. 2018 Apr 17;48(4):812-830.e14. doi: 10.1016/j.immuni.2018.03.023. Epub 2018 Apr 5. Erratum in: Immunity. 2019 Aug 20;51(2):411-412. doi: 10.1016/j.immuni.2019.08.004. PMID: 29628290; PMCID: PMC5982584. [6] Zapata L, Caravagna G, Williams MJ, et al. Immune selection determines tumor antigenicity and influences response to checkpoint inhibitors. Nat Genet. 2023 Mar;55(3):451-460. doi: 10.1038/s41588-023-01313-1. Epub 2023 Mar 9. PMID: 36894710; PMCID: PMC10011129. [7] Cortes-Ciriano I, Lee S, Park WY, et al. A molecular portrait of microsatellite instability across multiple cancers. Nat Commun. 2017 Jun 6;8:15180. doi: 10.1038/ncomms15180. PMID: 28585546; PMCID: PMC5467167. [8] Cannon M, Stevenson J, Stahl K, et al. DGIdb 5.0: rebuilding the drug-gene interaction database for precision medicine and drug discovery platforms. Nucleic Acids Res. 2024 Jan 5;52(D1):D1227-D1235. doi: 10.1093/nar/gkad1040. PMID: 37953380; PMCID: PMC10767982. [9] Grissa D, Junge A, Oprea TI, Jensen LJ. Diseases 2.0: a weekly updated database of disease-gene associations from text mining and data integration. Database (Oxford). 2022 Mar 28;2022:baac019. doi: 10.1093/database/baac019. PMID: 35348648; PMCID: PMC9216524. |

Copyright 2024-Present -The University of Texas Health Science Center at Houston |