|
|
||||||||
|
||||||||

Gene summary for FOS |
| Gene Symbol | FOS | Gene ID | 2353 |
| Gene name | Fos proto-oncogene, AP-1 transcription factor subunit |
| Synonyms | AP-1;C-FOS |
| Type of gene | protein_coding |
| UniProtAcc | P01100 |
| GO ID | GO term |
| GO:0006355 | regulation of DNA-templated transcription |
| GO:0006357 | regulation of transcription by RNA polymerase II |
| GO:0006954 | inflammatory response |
| GO:0045893 | positive regulation of DNA-templated transcription |
| GO:0006366 | transcription by RNA polymerase II |
| GO:1902895 | positive regulation of miRNA transcription |
| GO:0045944 | positive regulation of transcription by RNA polymerase II |
| GO:0034614 | cellular response to reactive oxygen species |
| GO:0071276 | cellular response to cadmium ion |
| GO:0060395 | SMAD protein signal transduction |
| GO:0140467 | integrated stress response signaling |
| GO:0007179 | transforming growth factor beta receptor signaling pathway |
| GO:0001661 | conditioned taste aversion |
| GO:0006306 | DNA methylation |
| GO:0007399 | nervous system development |
| GO:0007565 | female pregnancy |
| GO:0009410 | response to xenobiotic stimulus |
| GO:0009416 | response to light stimulus |
| GO:0009612 | response to mechanical stimulus |
| GO:0009629 | response to gravity |
| GO:0009636 | response to toxic substance |
| GO:0010468 | regulation of gene expression |
| GO:0014070 | response to organic cyclic compound |
| GO:0014823 | response to activity |
| GO:0014856 | skeletal muscle cell proliferation |
| GO:0030316 | osteoclast differentiation |
| GO:0031668 | cellular response to extracellular stimulus |
| GO:0032496 | response to lipopolysaccharide |
| GO:0032570 | response to progesterone |
| GO:0032868 | response to insulin |
| GO:0032870 | cellular response to hormone stimulus |
| GO:0034097 | response to cytokine |
| GO:0034224 | cellular response to zinc ion starvation |
| GO:0035902 | response to immobilization stress |
| GO:0035914 | skeletal muscle cell differentiation |
| GO:0035994 | response to muscle stretch |
| GO:0045471 | response to ethanol |
| GO:0045672 | positive regulation of osteoclast differentiation |
| GO:0048545 | response to steroid hormone |
| GO:0051412 | response to corticosterone |
| GO:0051450 | myoblast proliferation |
| GO:0051591 | response to cAMP |
| GO:0071277 | cellular response to calcium ion |
| GO:0071356 | cellular response to tumor necrosis factor |
| GO:0071364 | cellular response to epidermal growth factor stimulus |
| GO:0071374 | cellular response to parathyroid hormone stimulus |
| GO:0071456 | cellular response to hypoxia |
| GO:0071560 | cellular response to transforming growth factor beta stimulus |
| GO:1903131 | mononuclear cell differentiation |
| GO:1904628 | cellular response to phorbol 13-acetate 12-myristate |
| GO:1990646 | cellular response to prolactin |
Top |
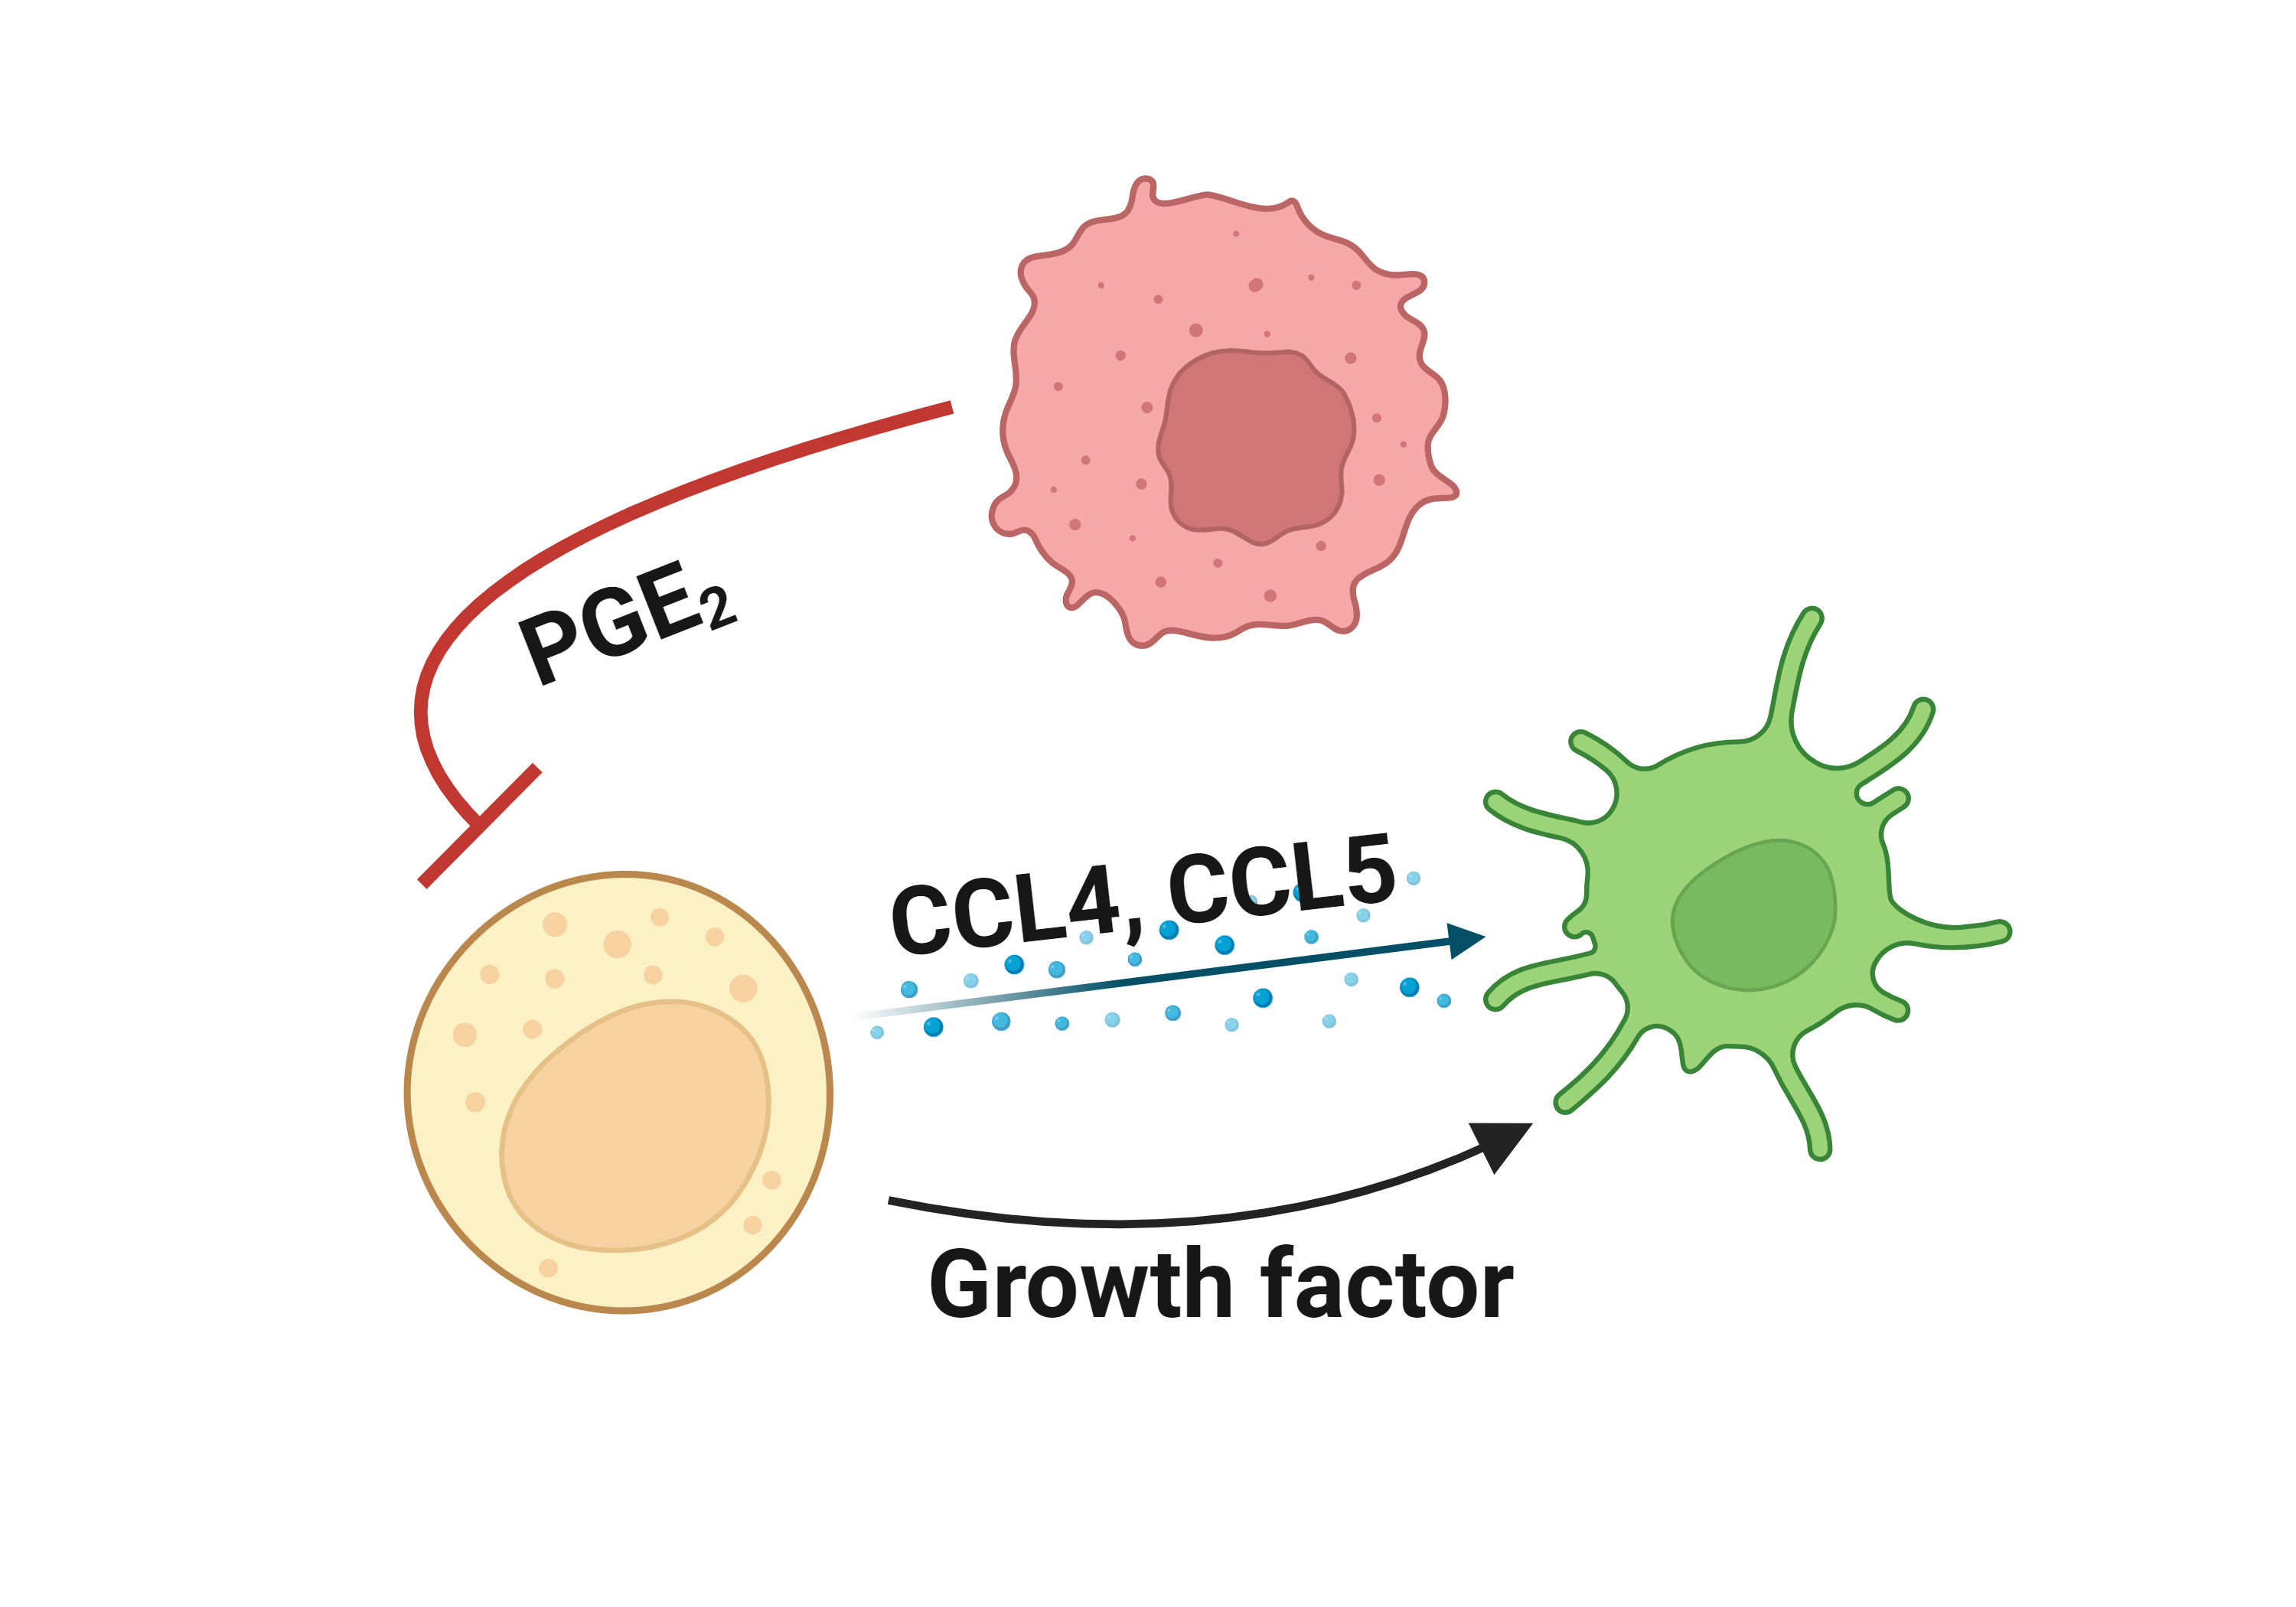
Literatures describing the association of FOS and immune escape mechanisms |
Top |
Comparison of the FOS expression level between tumor and normal groups |
Top |
Comparison of the FOS methylation level between tumor and normal groups |
No significant differences were found in FOS methylation in promoter region.
Top |
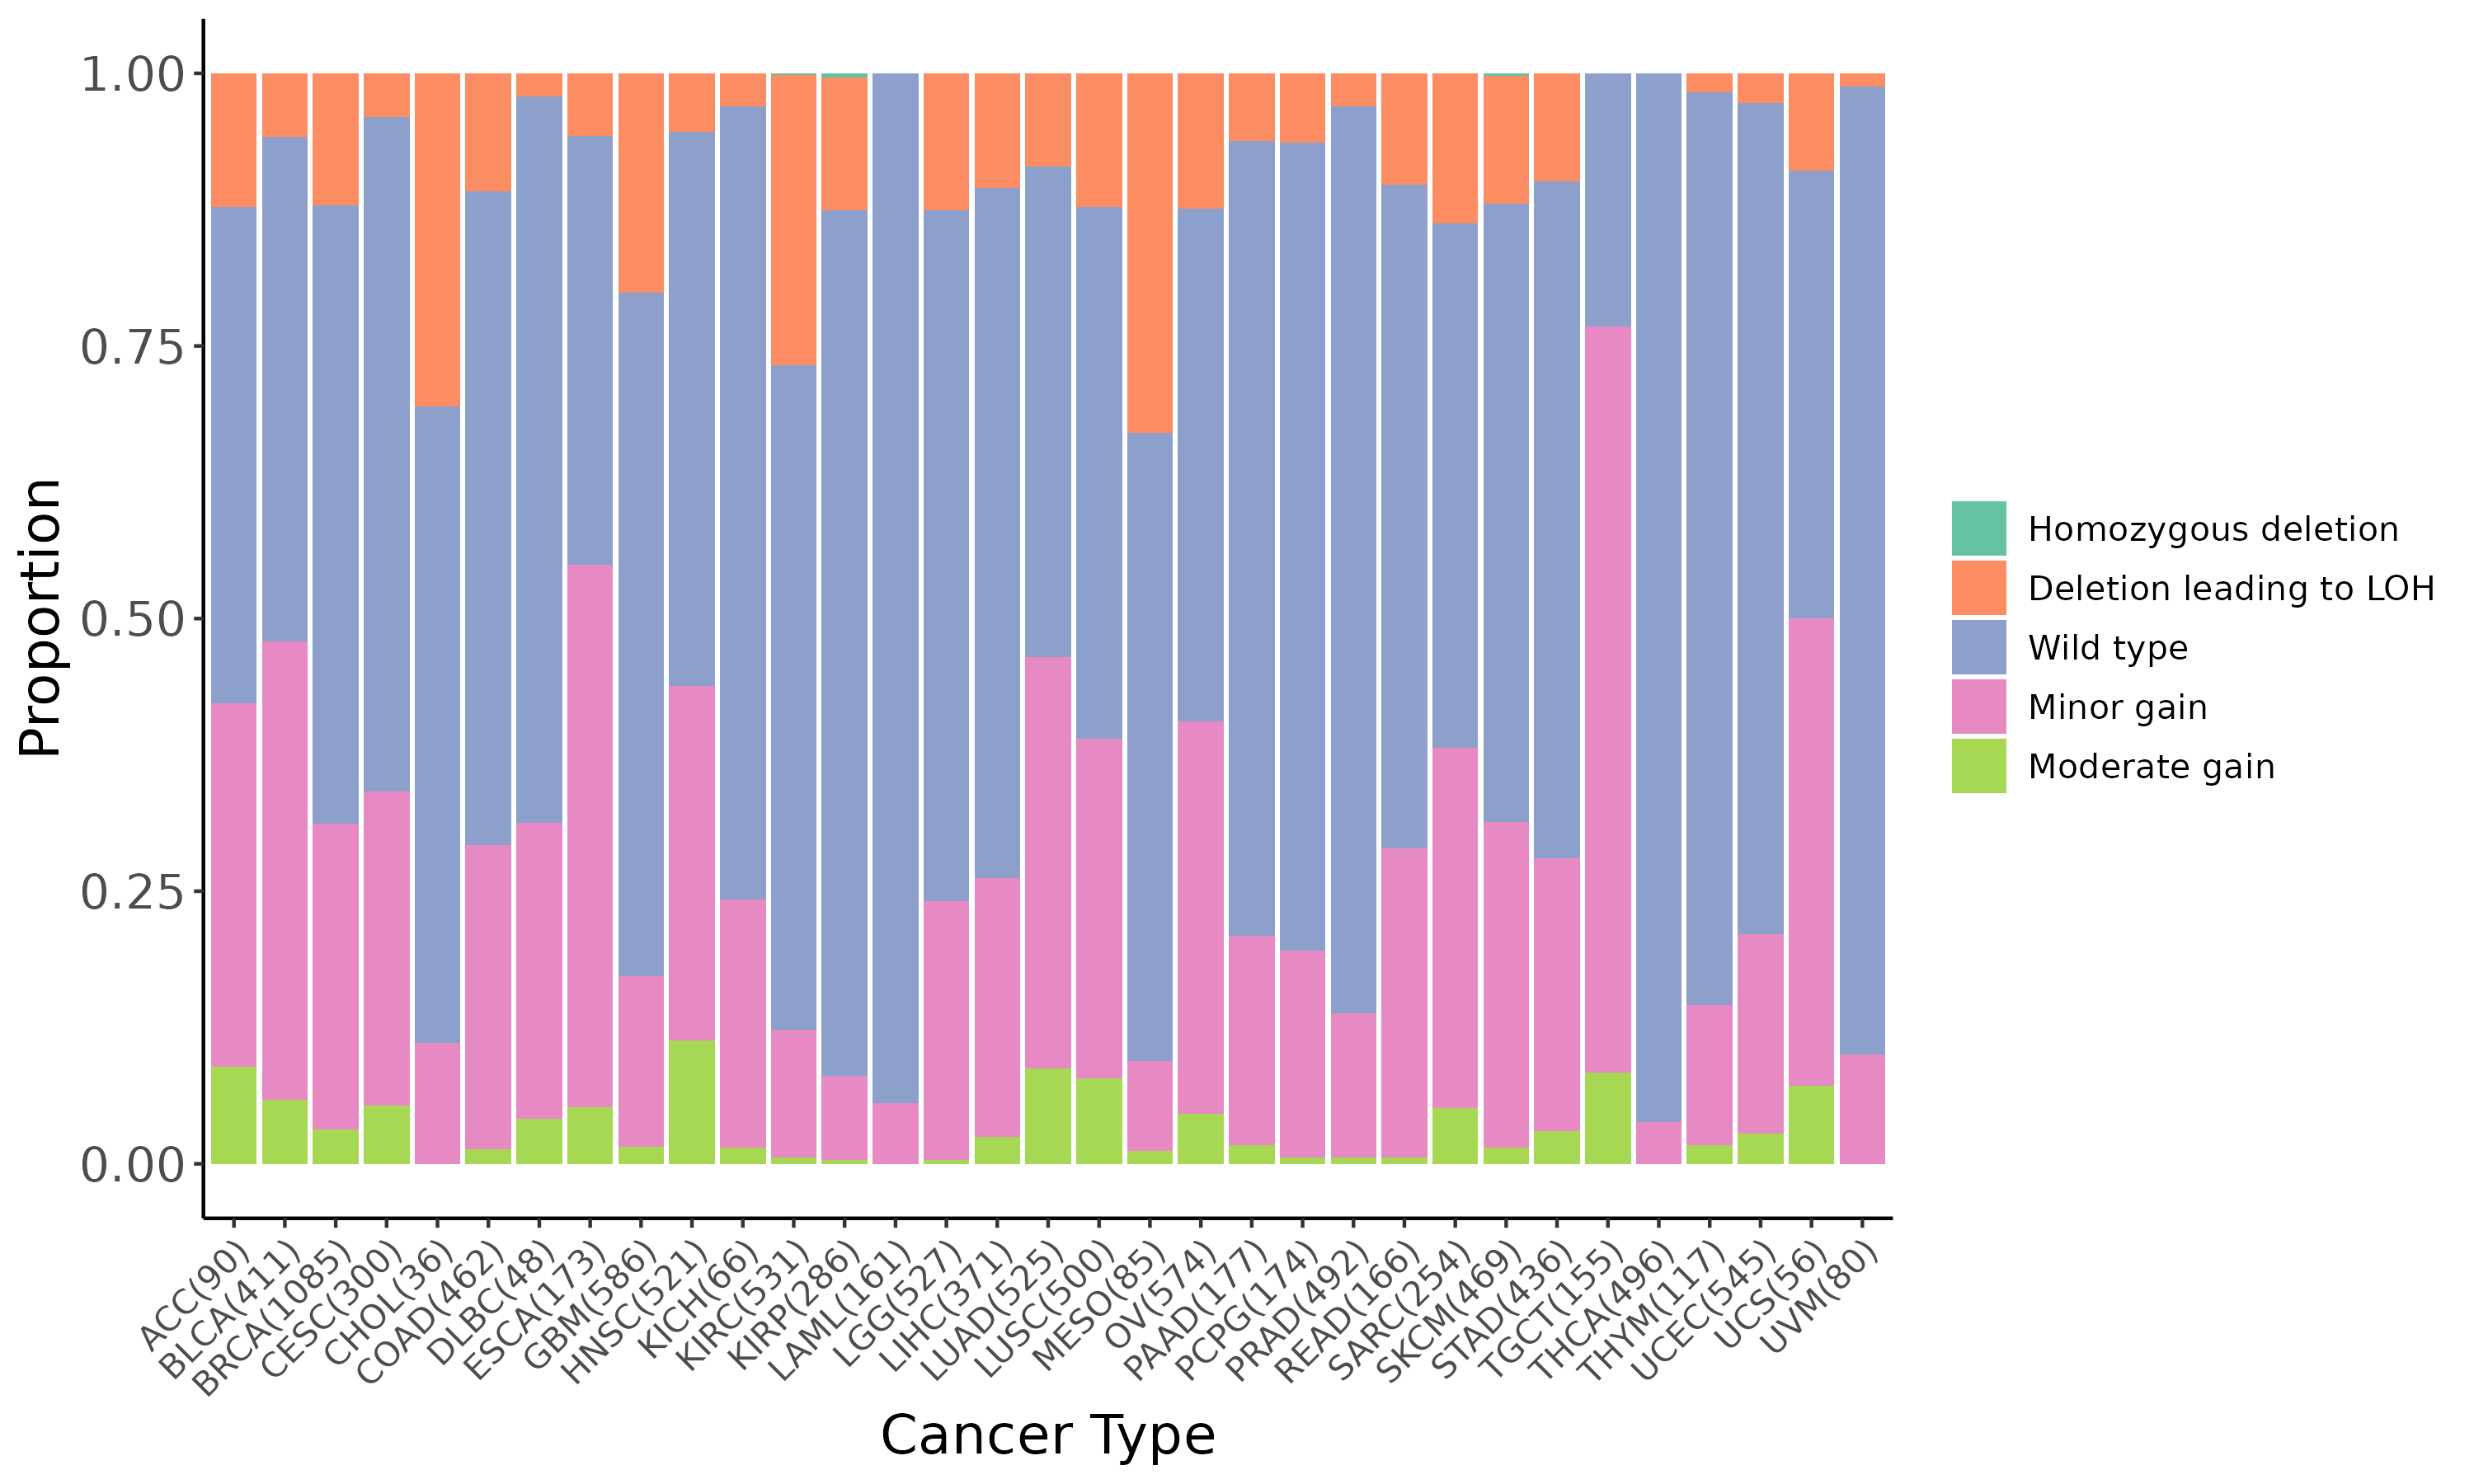
Summary of the copy number in TCGA tumor samples |
 |
Top |
DEGs and the enrichment analysis between the mutated and wild type groups |
| Gene ID | Symbol | Log2 Fold Change | P-value | Adjusted P-value |
|---|---|---|---|---|
| ENSG00000142408 | CACNG8 | 3.67e+00 | 1.79e-04 | 4.13e-03 |
| ENSG00000166387 | PPFIBP2 | -2.39e+00 | 1.80e-04 | 4.14e-03 |
| ENSG00000280096 | RP11-294N21.2 | 5.67e+00 | 1.80e-04 | 4.14e-03 |
| ENSG00000243766 | HOTTIP | -3.63e+00 | 1.80e-04 | 4.15e-03 |
| ENSG00000270390 | RP11-470B22.1 | 7.06e+00 | 1.82e-04 | 4.18e-03 |
| ENSG00000124875 | CXCL6 | -4.20e+00 | 1.83e-04 | 4.21e-03 |
| ENSG00000242876 | RN7SL812P | 2.83e+00 | 1.83e-04 | 4.21e-03 |
| ENSG00000104936 | DMPK | -1.32e+00 | 1.84e-04 | 4.21e-03 |
| ENSG00000096006 | CRISP3 | -5.08e+00 | 1.84e-04 | 4.21e-03 |
| ENSG00000136869 | TLR4 | 2.10e+00 | 1.84e-04 | 4.22e-03 |
| ENSG00000285658 | NA | 4.18e+00 | 1.84e-04 | 4.22e-03 |
| ENSG00000203804 | ADAMTSL4-AS1 | 2.62e+00 | 1.84e-04 | 4.22e-03 |
| ENSG00000248208 | RP11-153M7.1 | 2.42e+00 | 1.85e-04 | 4.23e-03 |
| ENSG00000211942 | IGHV3-13 | -5.21e+00 | 1.85e-04 | 4.24e-03 |
| ENSG00000105443 | CYTH2 | -1.04e+00 | 1.87e-04 | 4.27e-03 |
| ENSG00000236088 | COX10-AS1 | 1.12e+00 | 1.88e-04 | 4.29e-03 |
| ENSG00000271392 | RP1-161P9.5 | -4.98e+00 | 1.89e-04 | 4.30e-03 |
| ENSG00000207022 | SNORA51 | 3.75e+00 | 1.89e-04 | 4.31e-03 |
| ENSG00000130988 | RGN | -3.35e+00 | 1.90e-04 | 4.32e-03 |
| ENSG00000134317 | GRHL1 | -2.29e+00 | 1.90e-04 | 4.32e-03 |
| Page: 1 2 ... 59 60 61 62 63 ... 204 205 |
Down-regulated GOBP pathways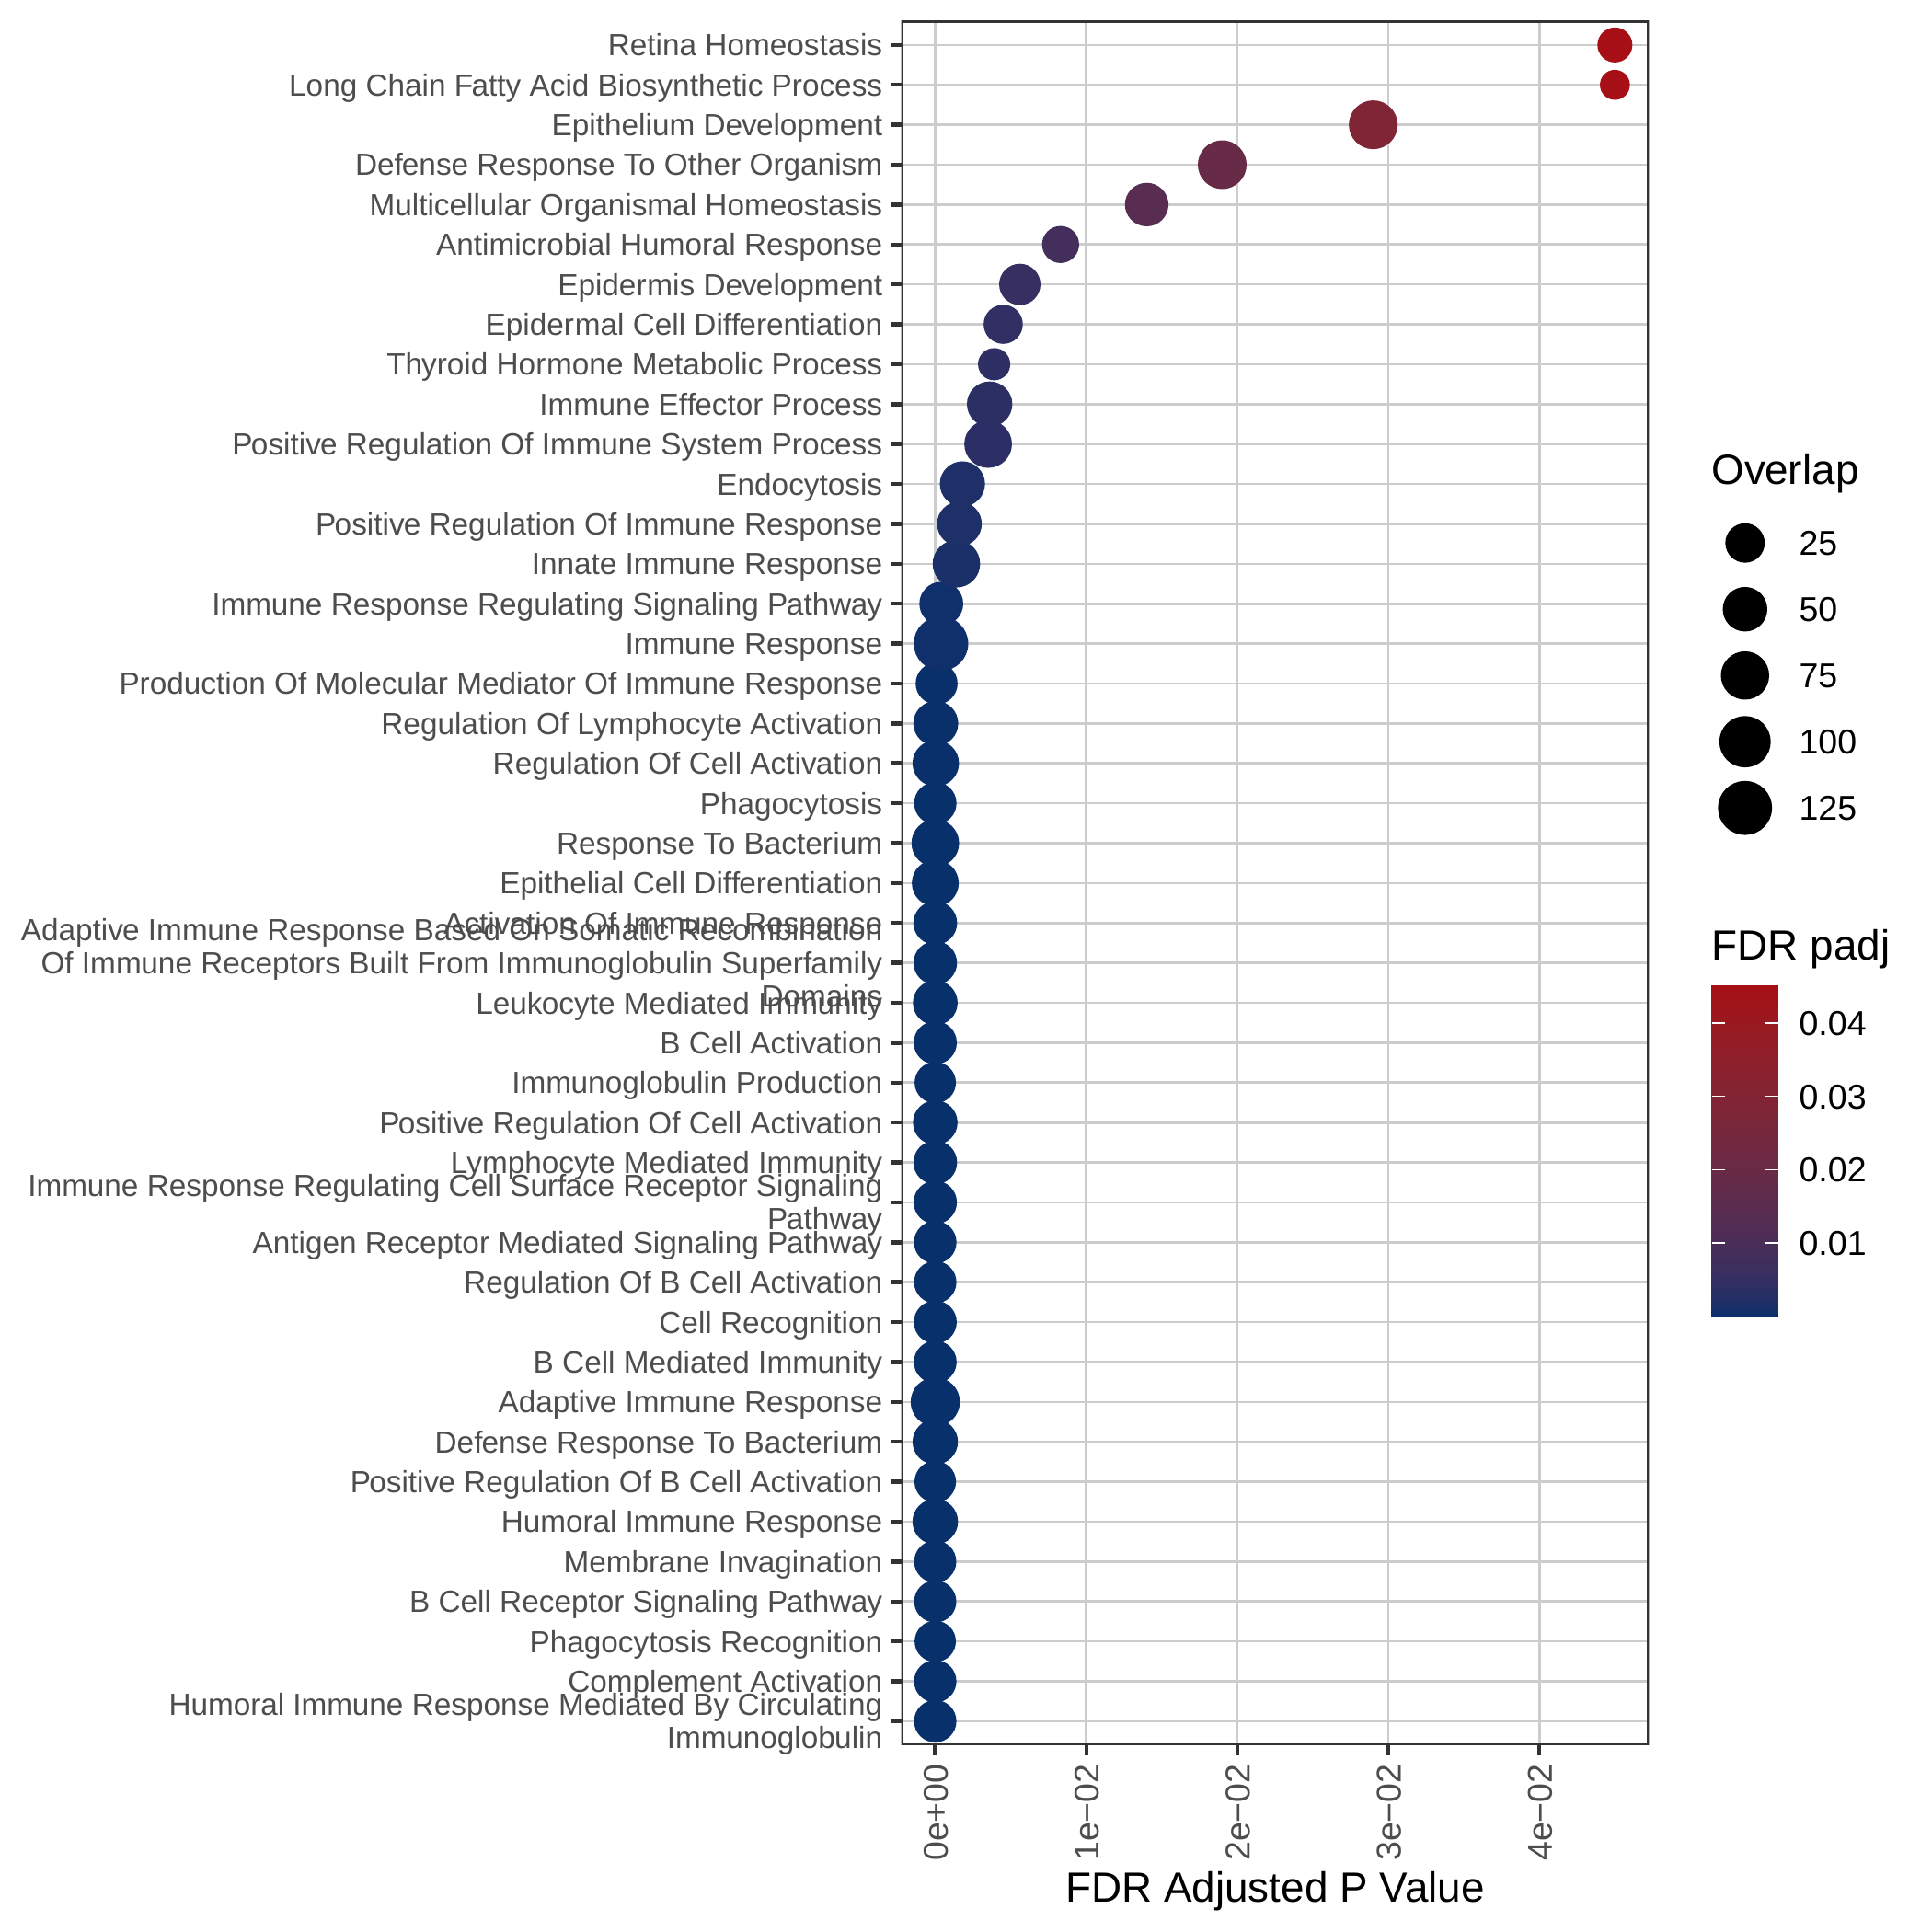 | Down-regulated Hallmark pathways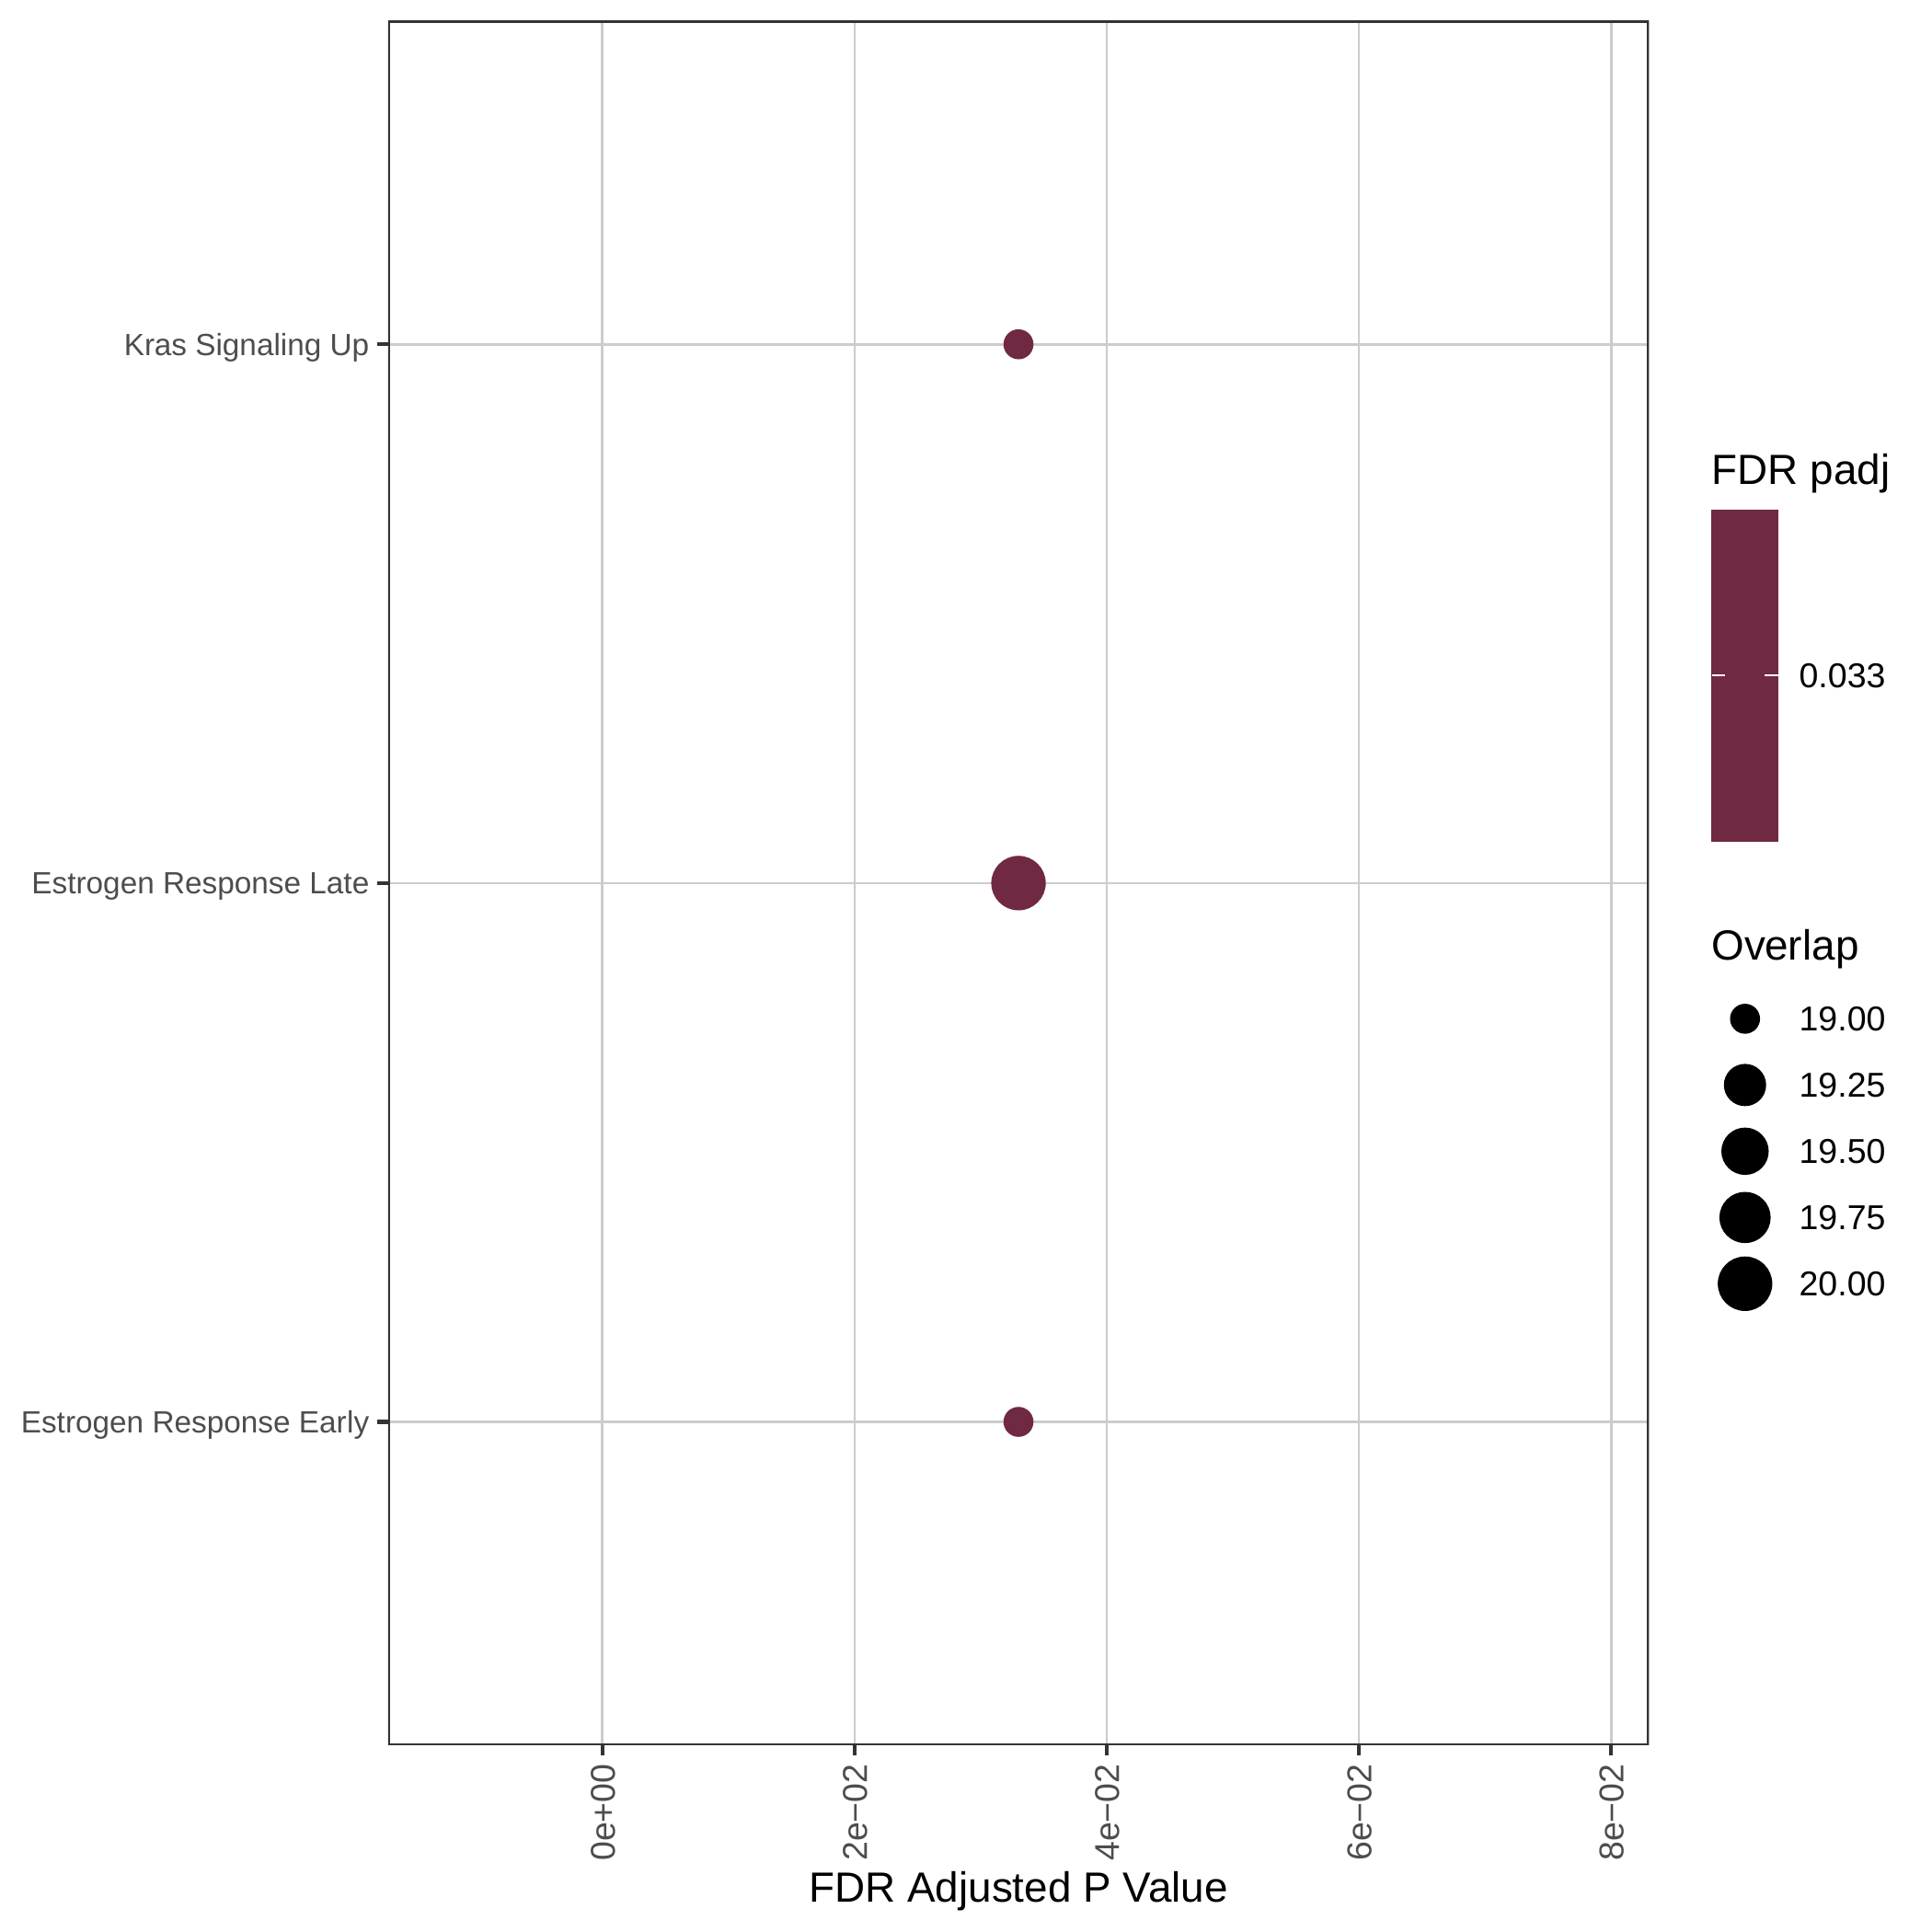 |
Gene expression and mutation differences between non-responders and responders after immunotherapy |
| Expression | Mutation |
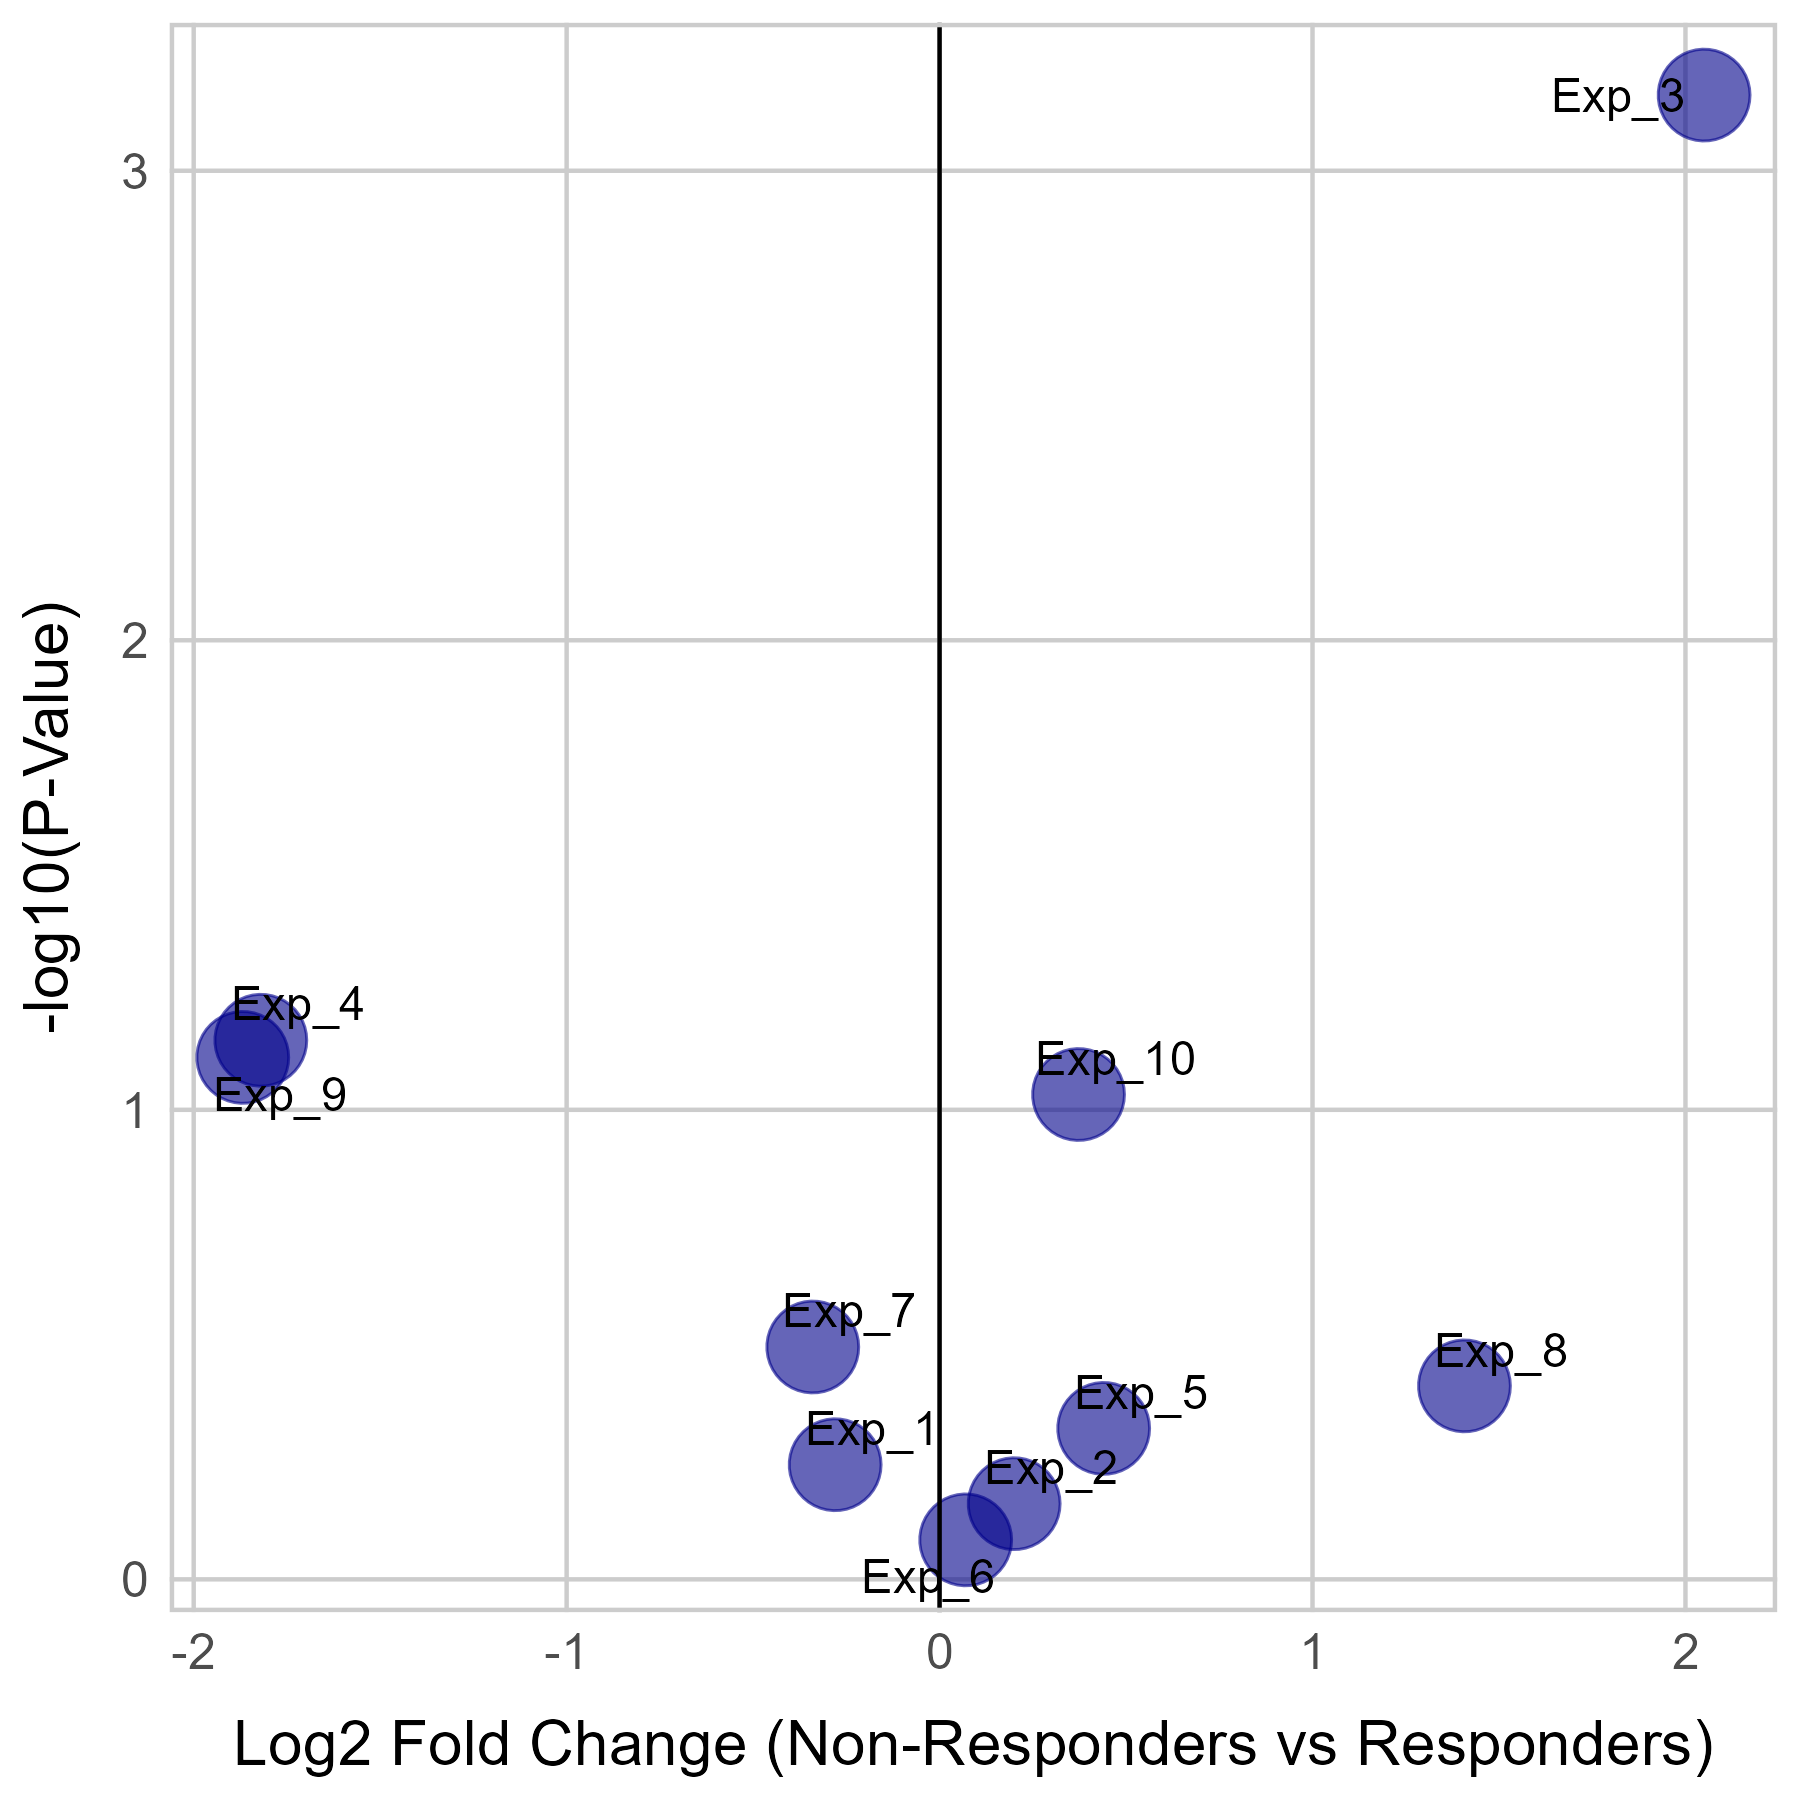 | 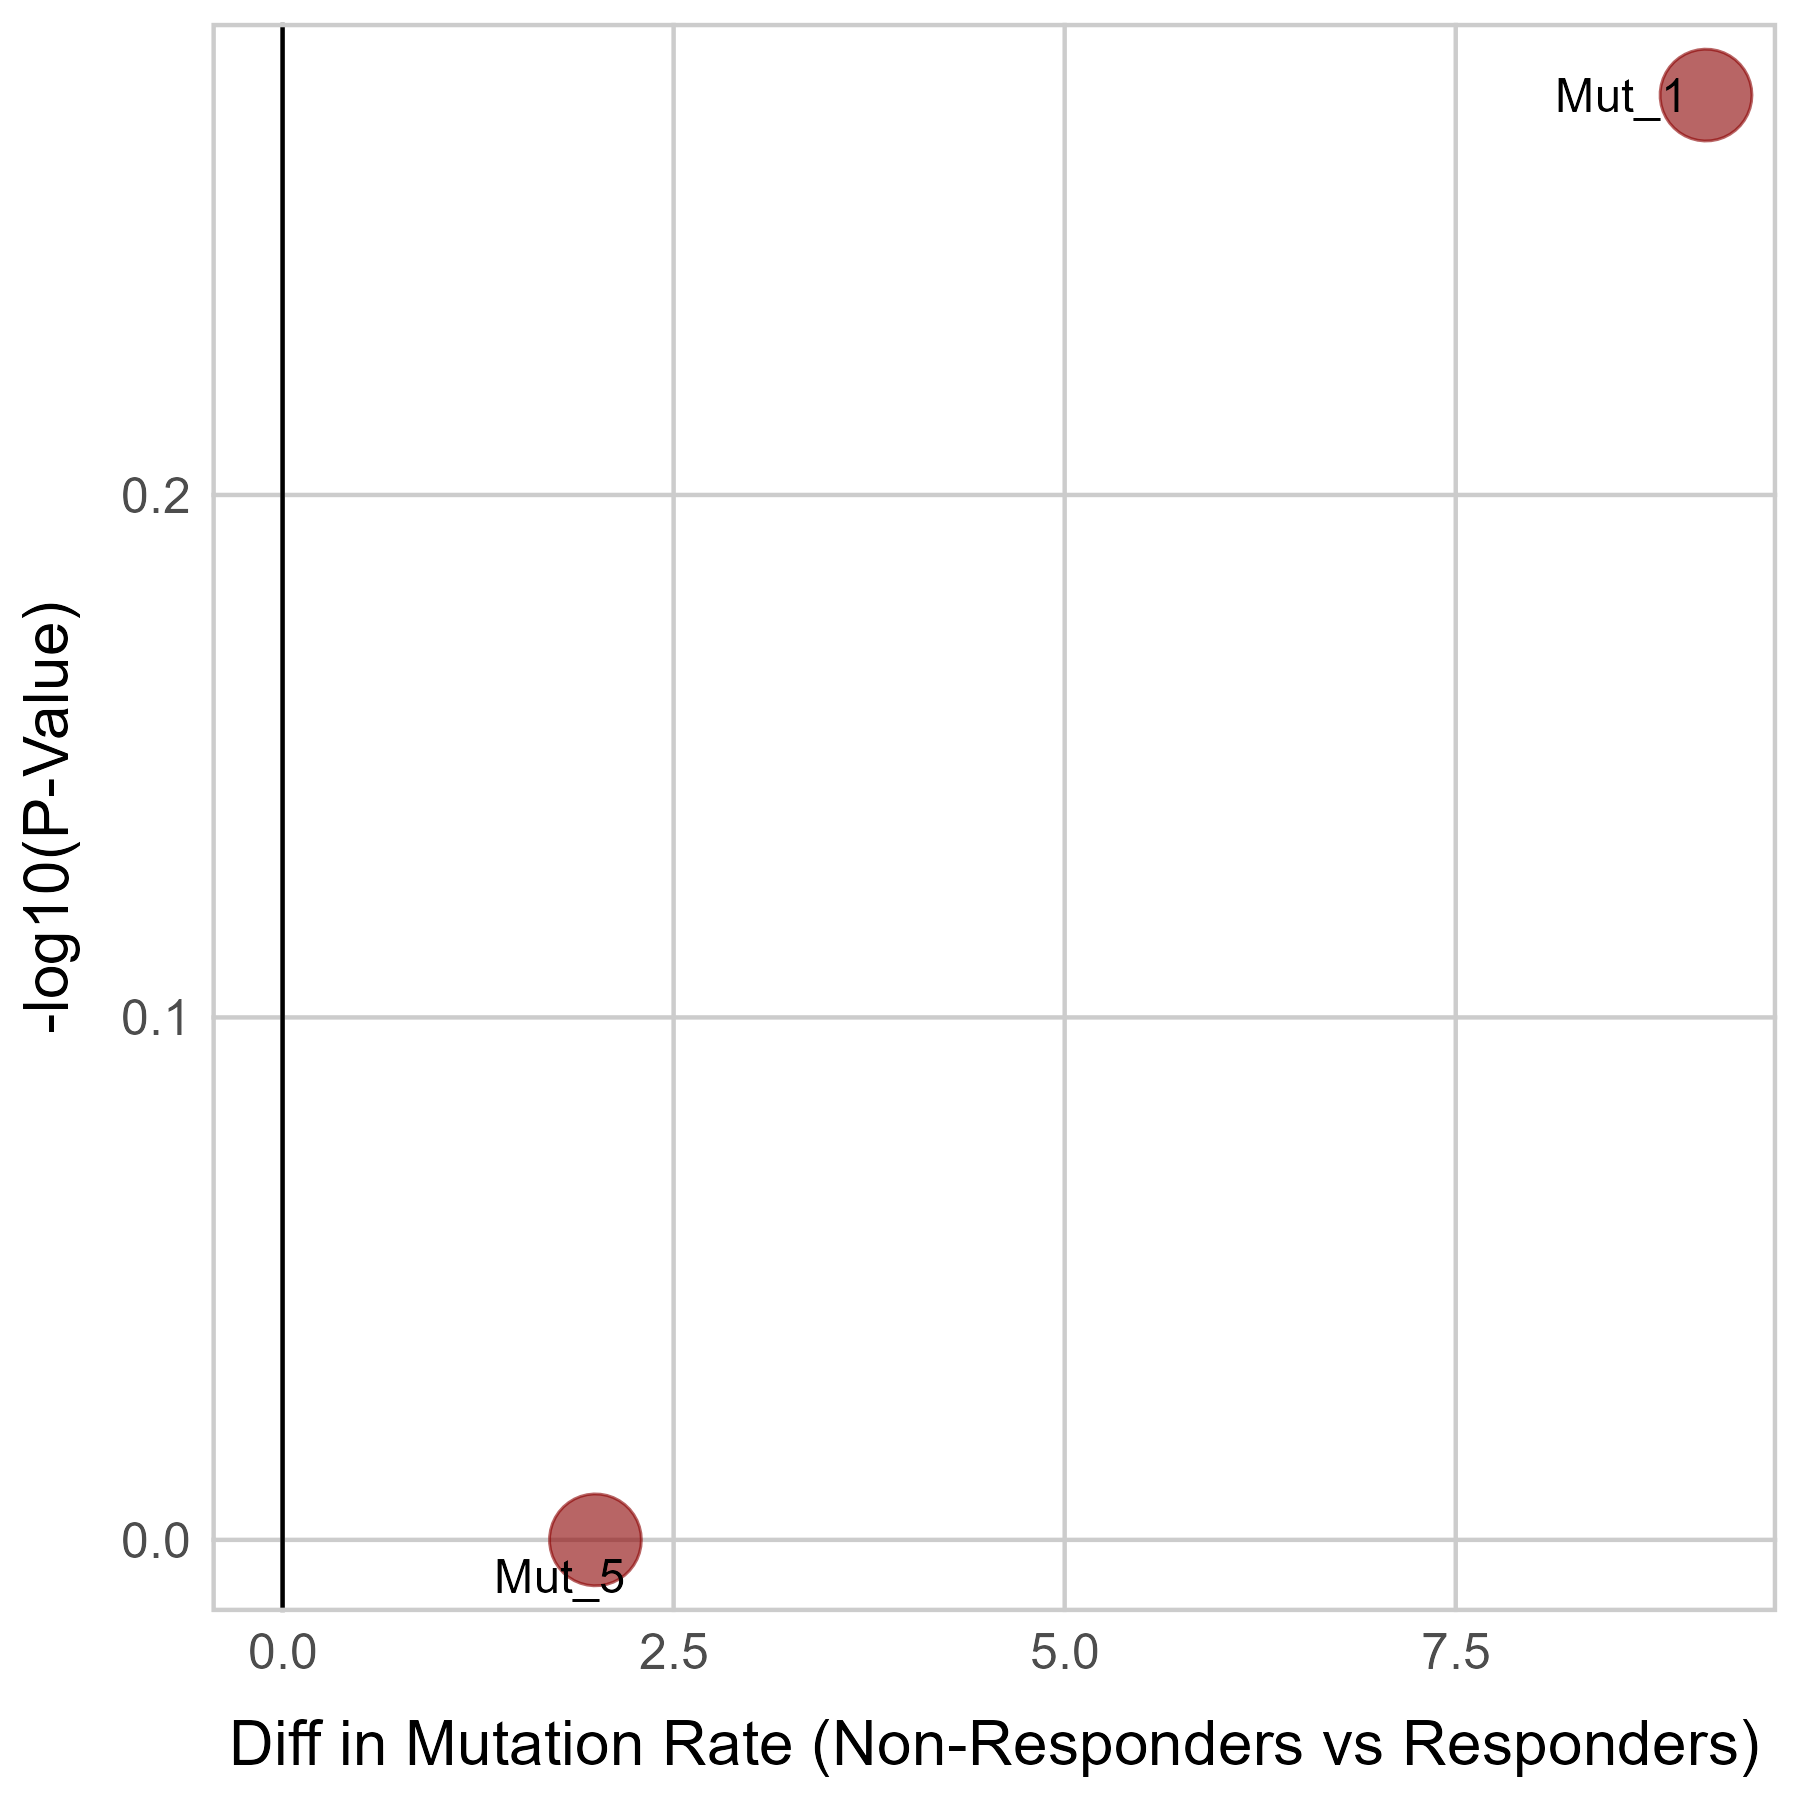 |
No significant differences were found in FOS mutation.
Top |
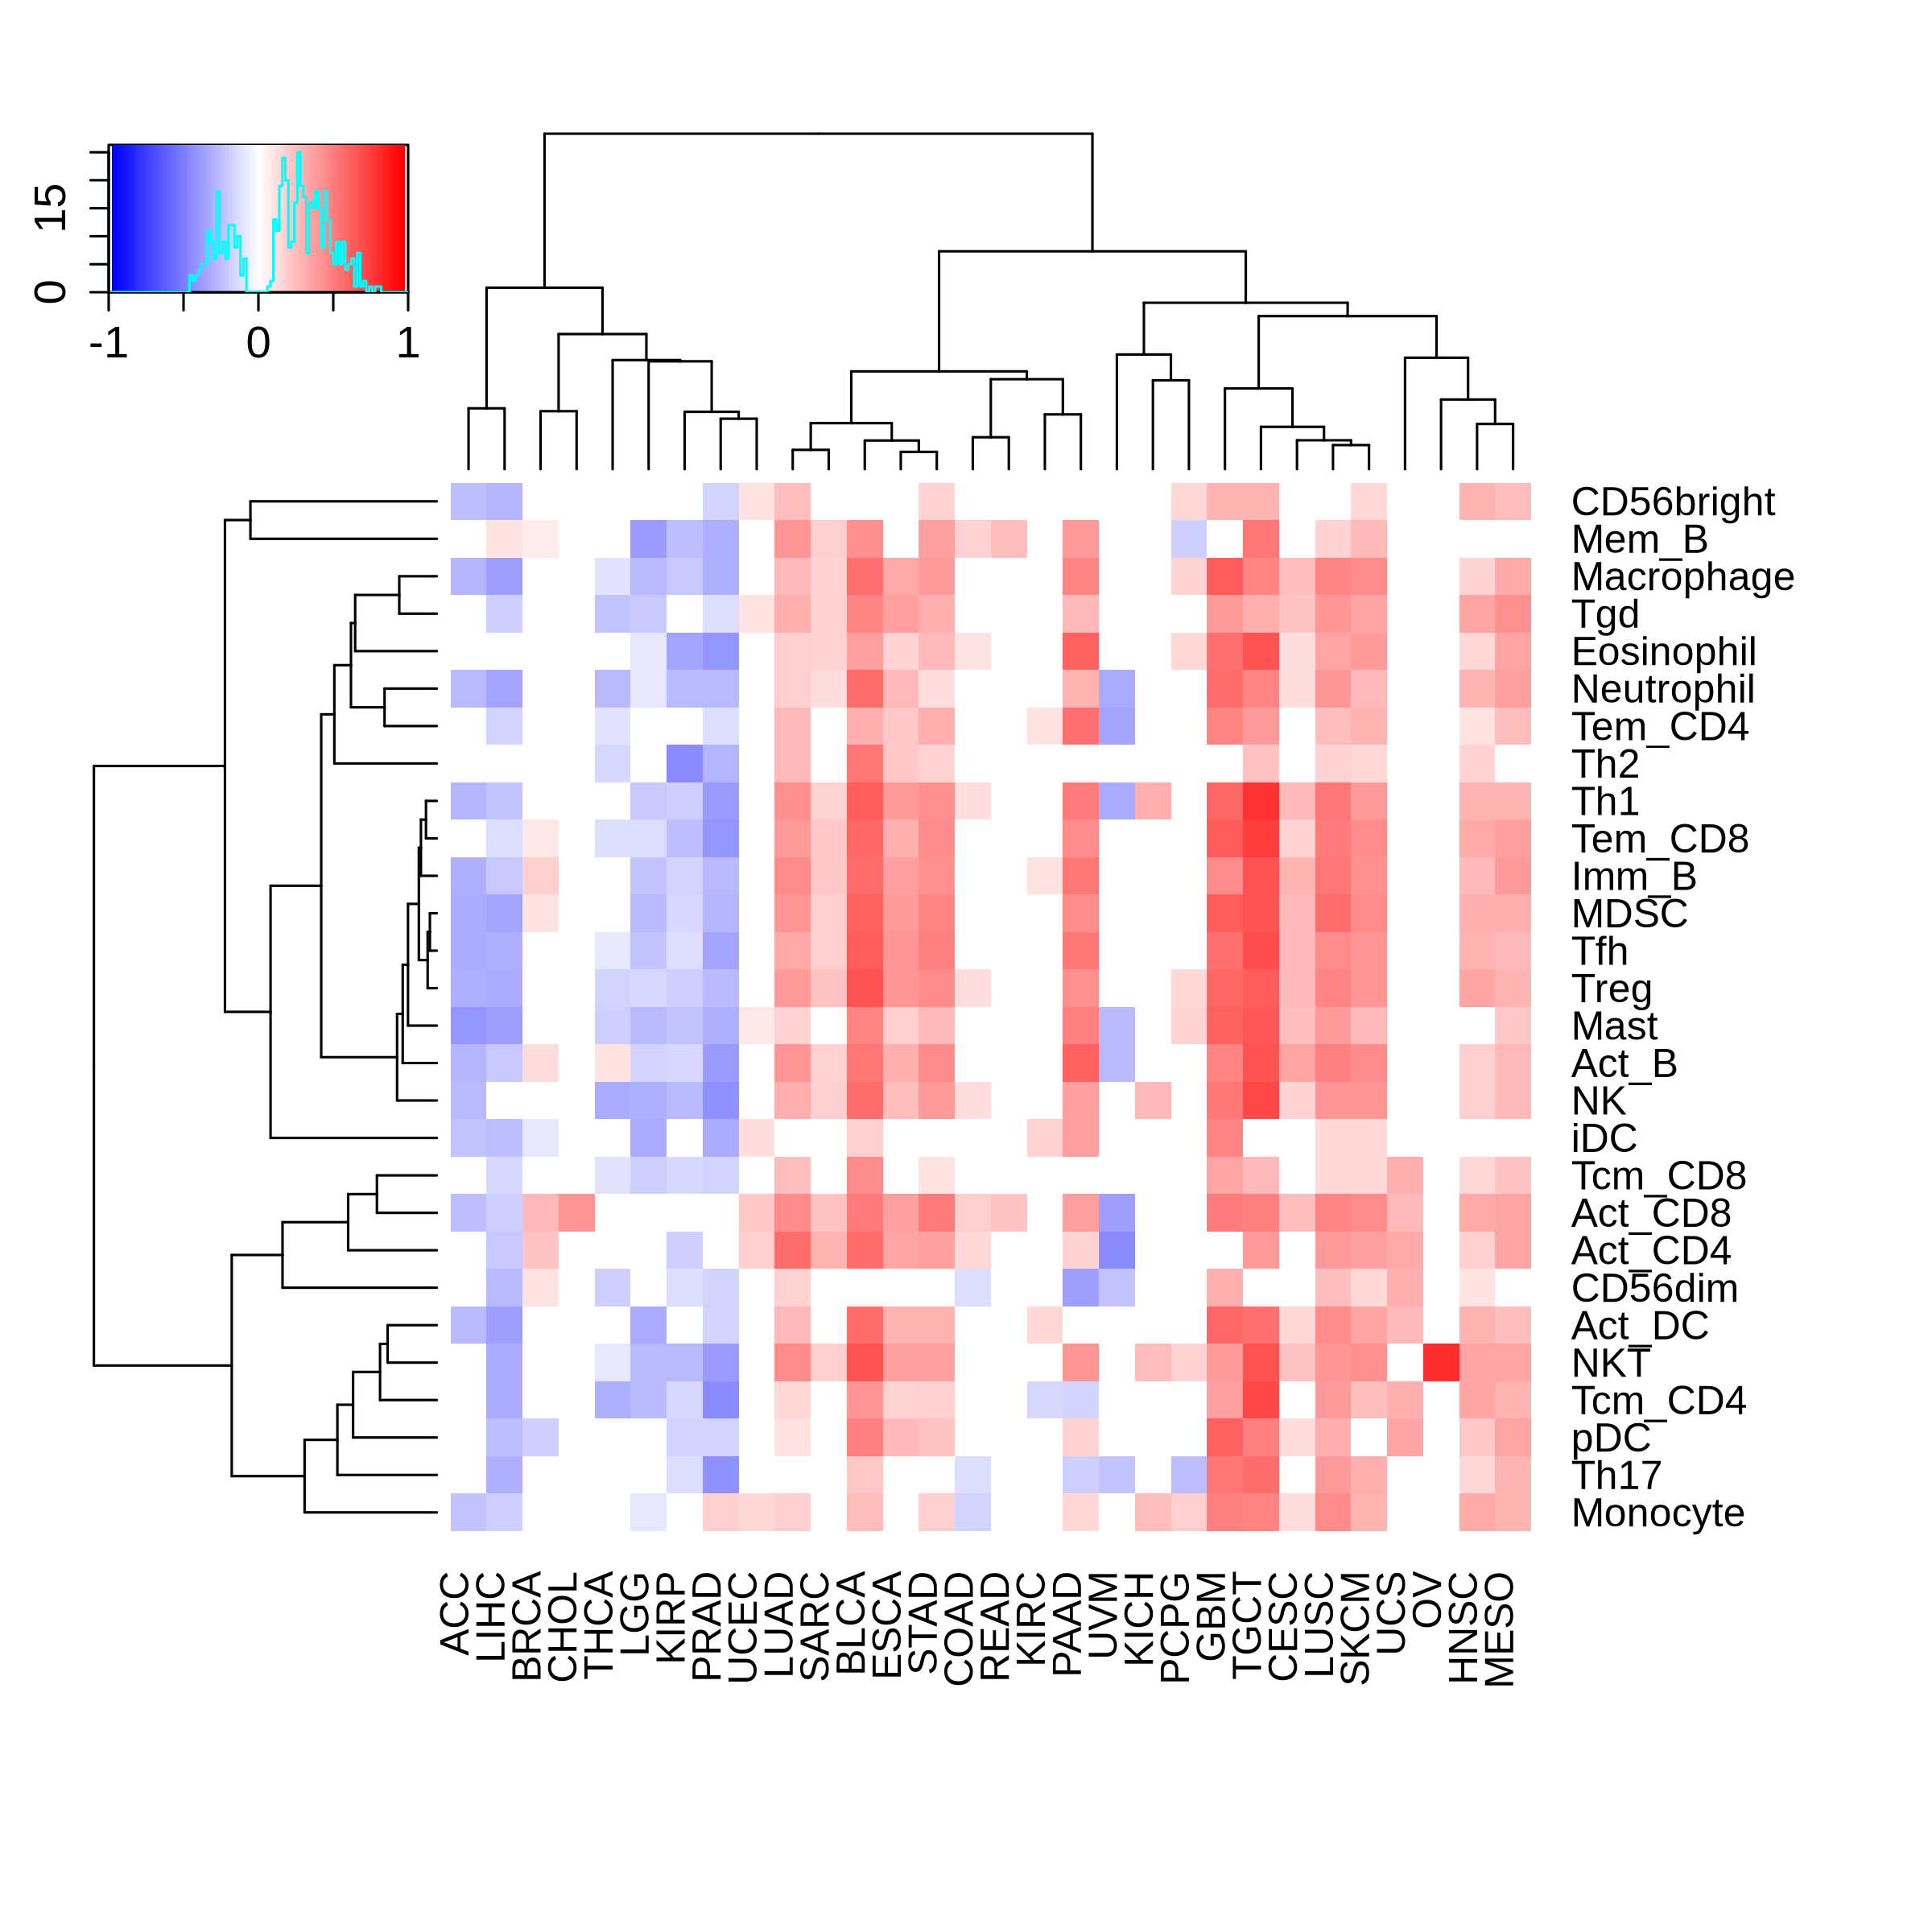
Correlation between the composition of TIL and gene expression, methylation and CNV |
| Expression | Copy number variation |
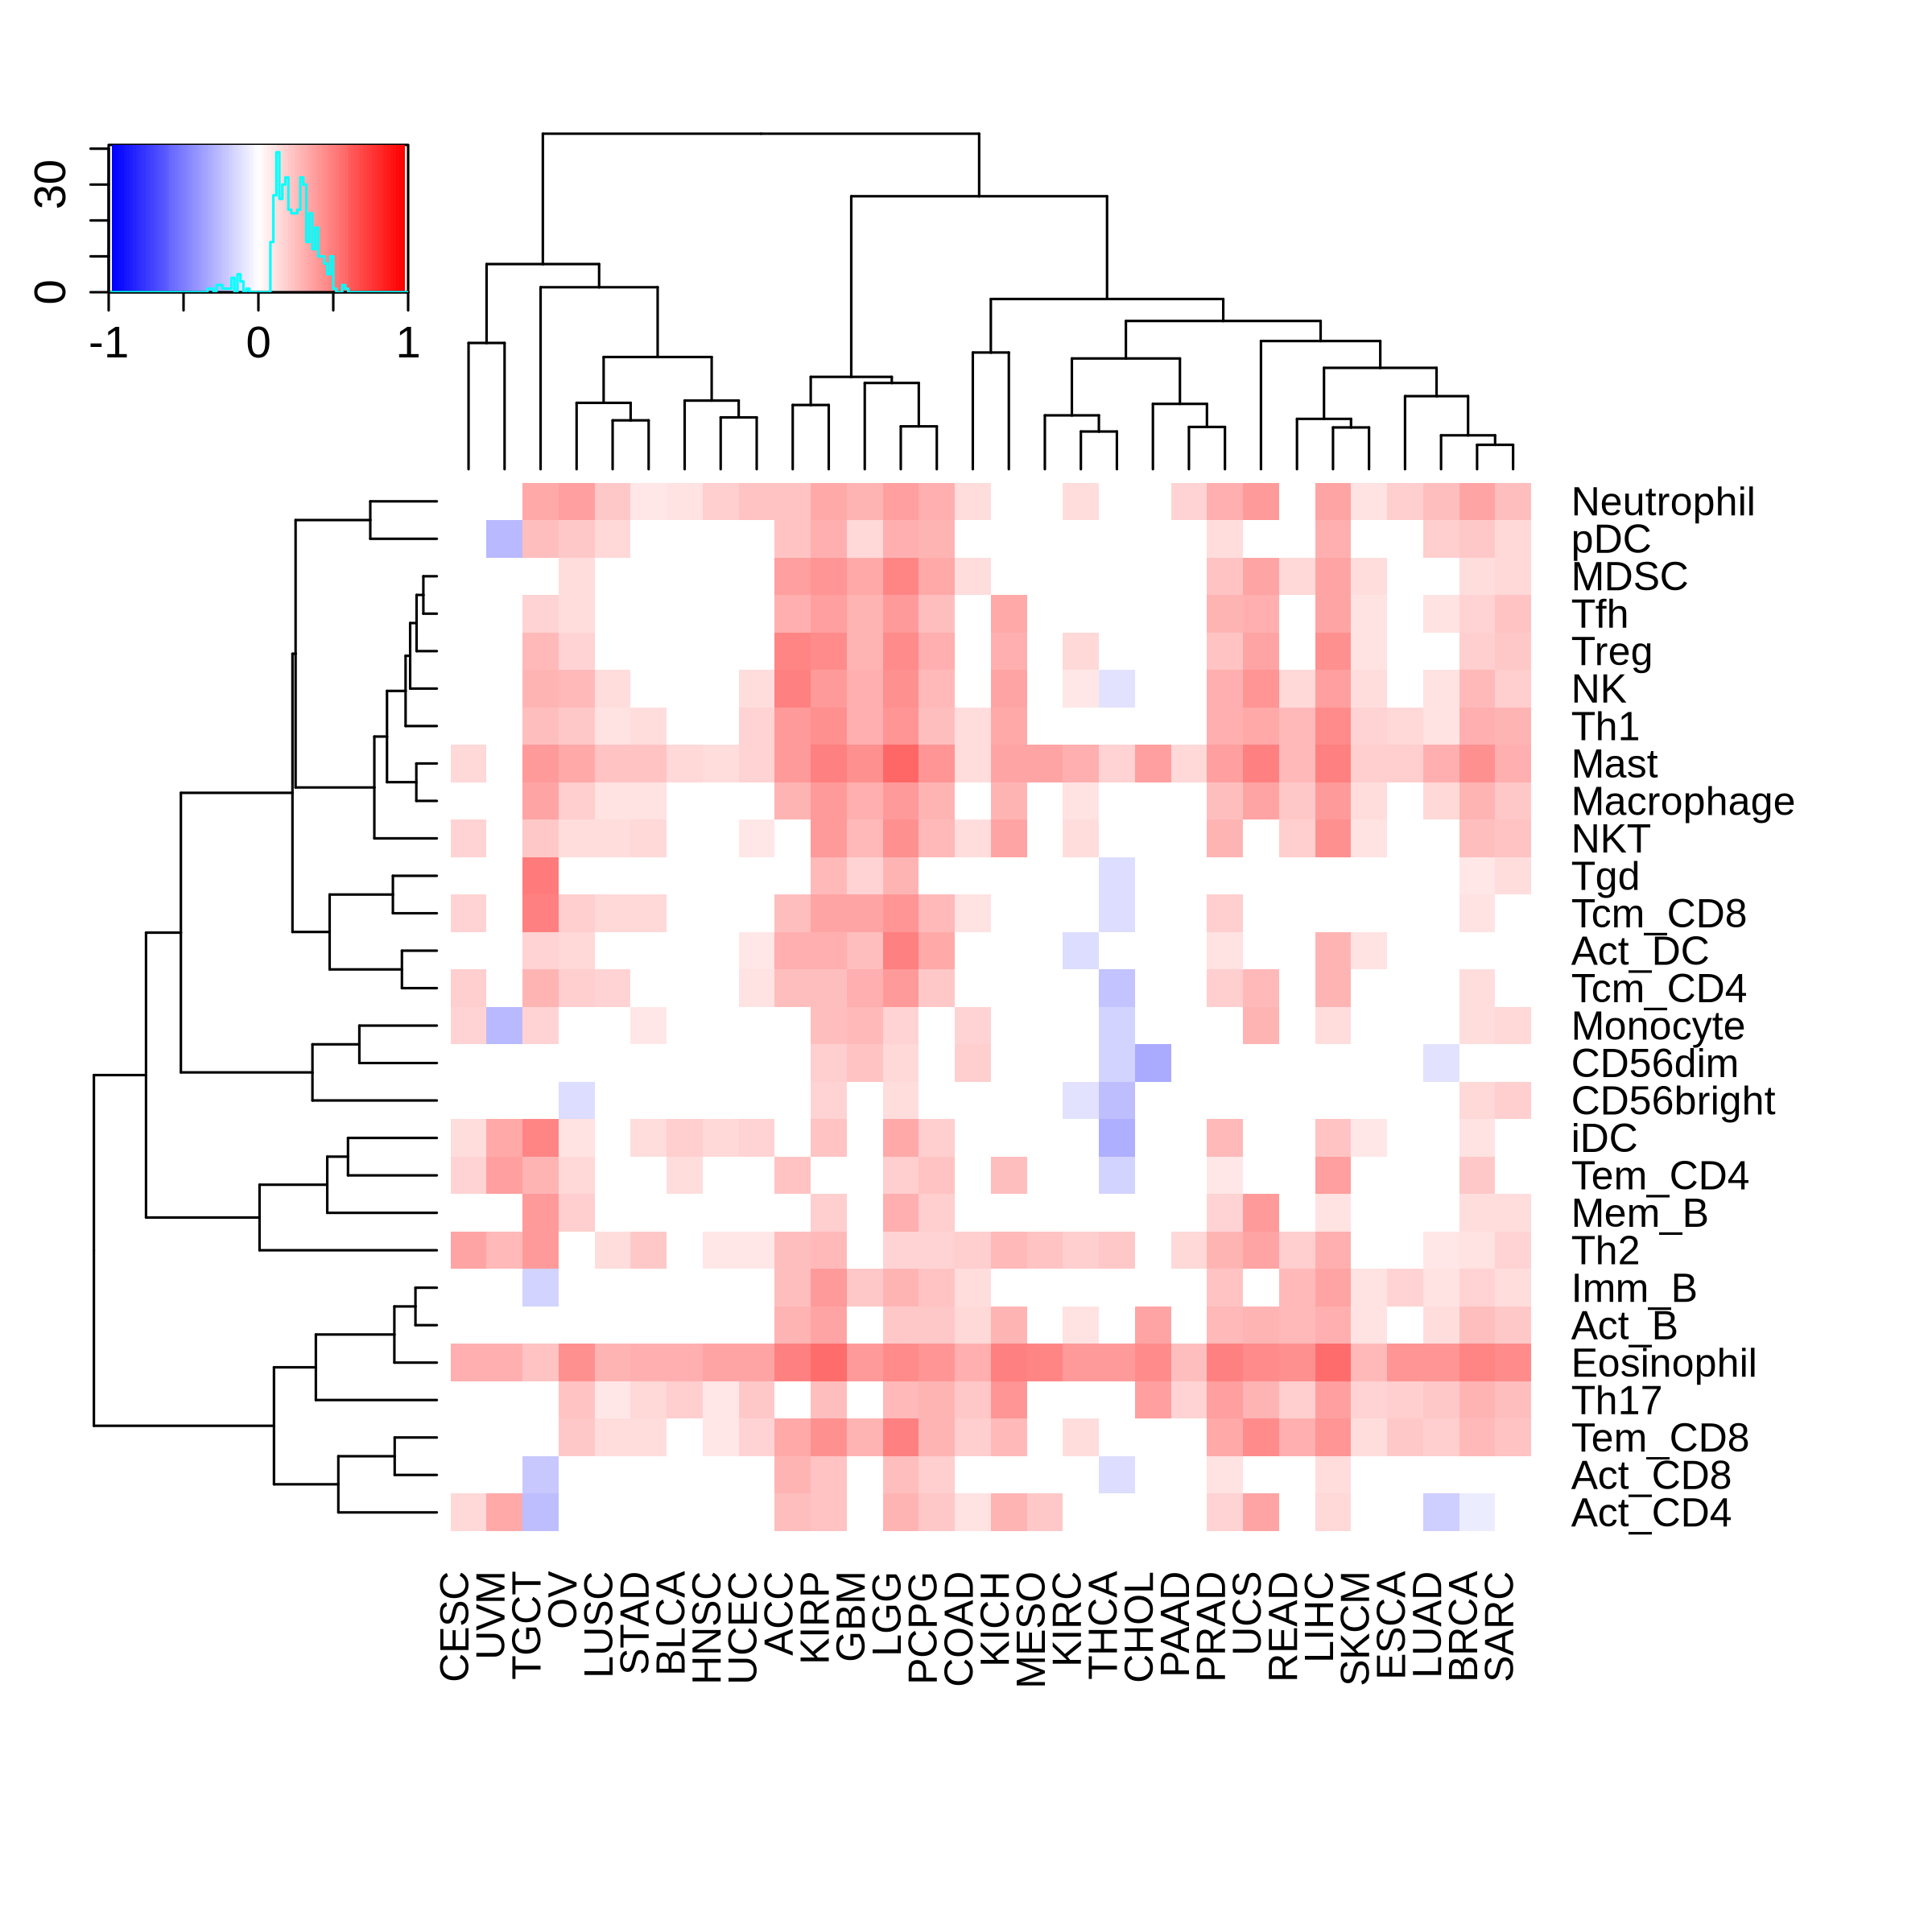 | 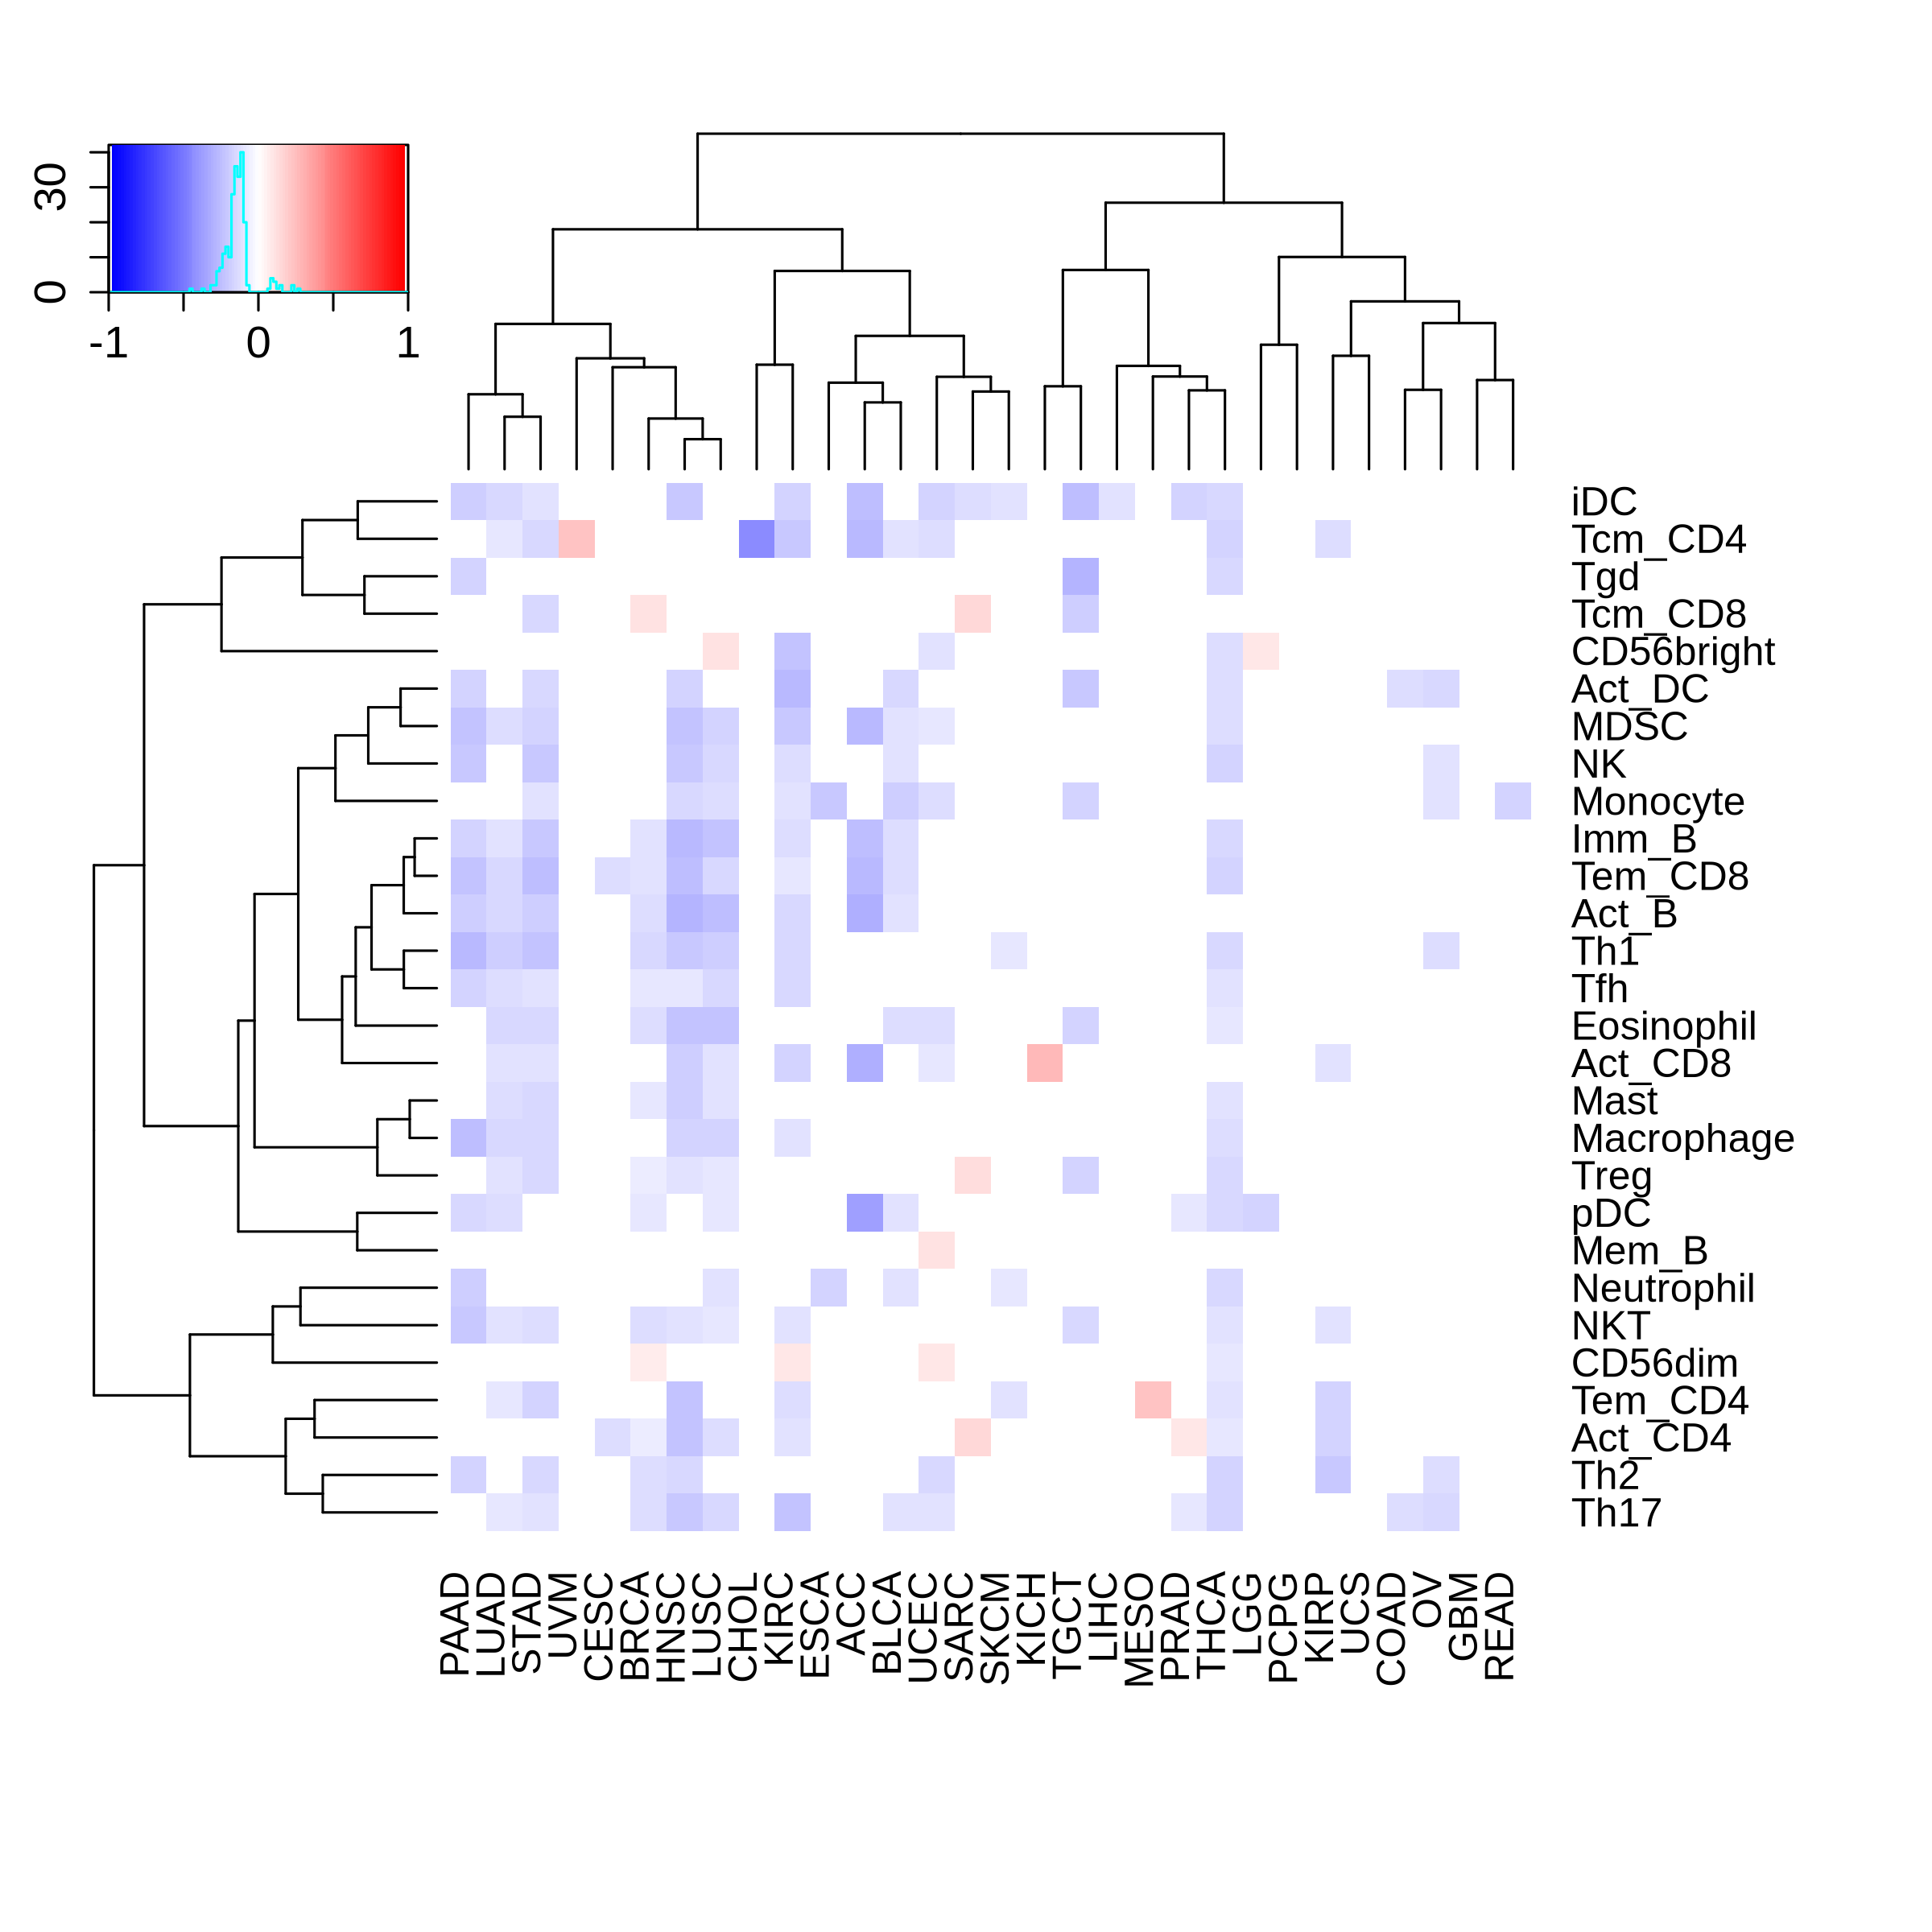 |
| Promoter methylation | Genebody methylation |
 | 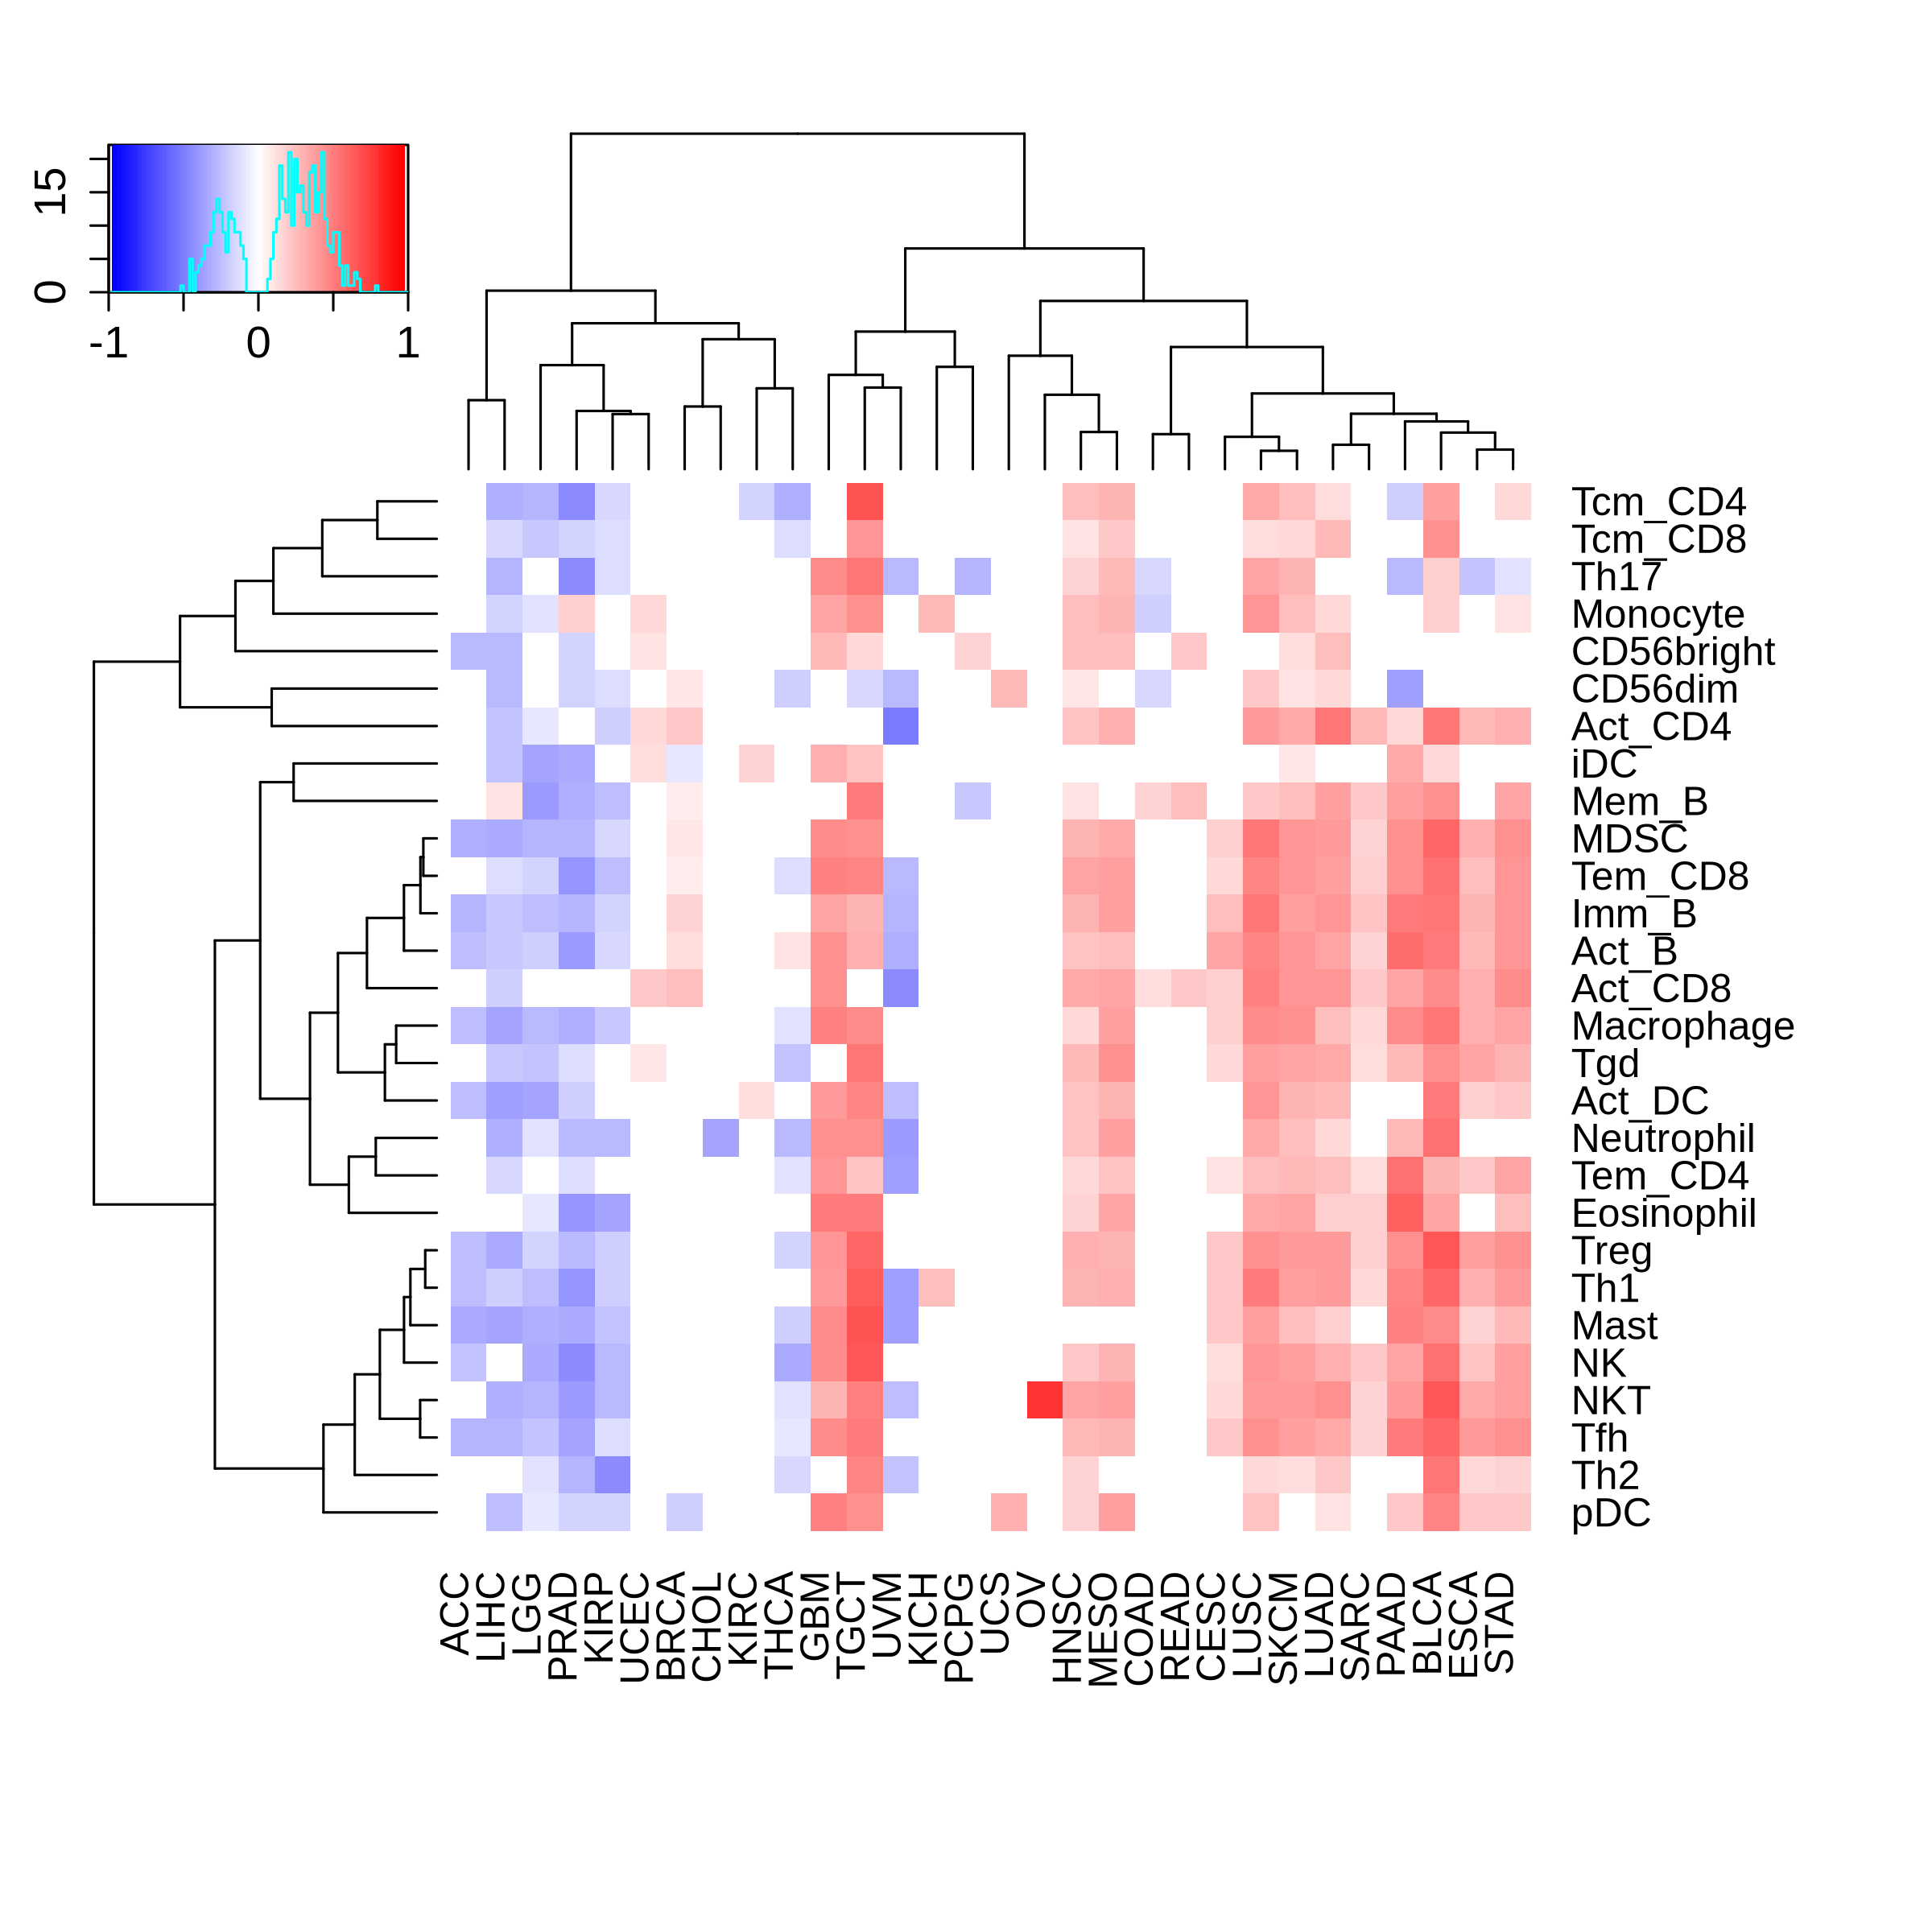 |
Top |
The association between FOS expression and immune subtypes/status |
Top |
Drugs targeting FOS and diseases related to FOS. |
| Drug-gene interaction | Disease-gene association |
 | 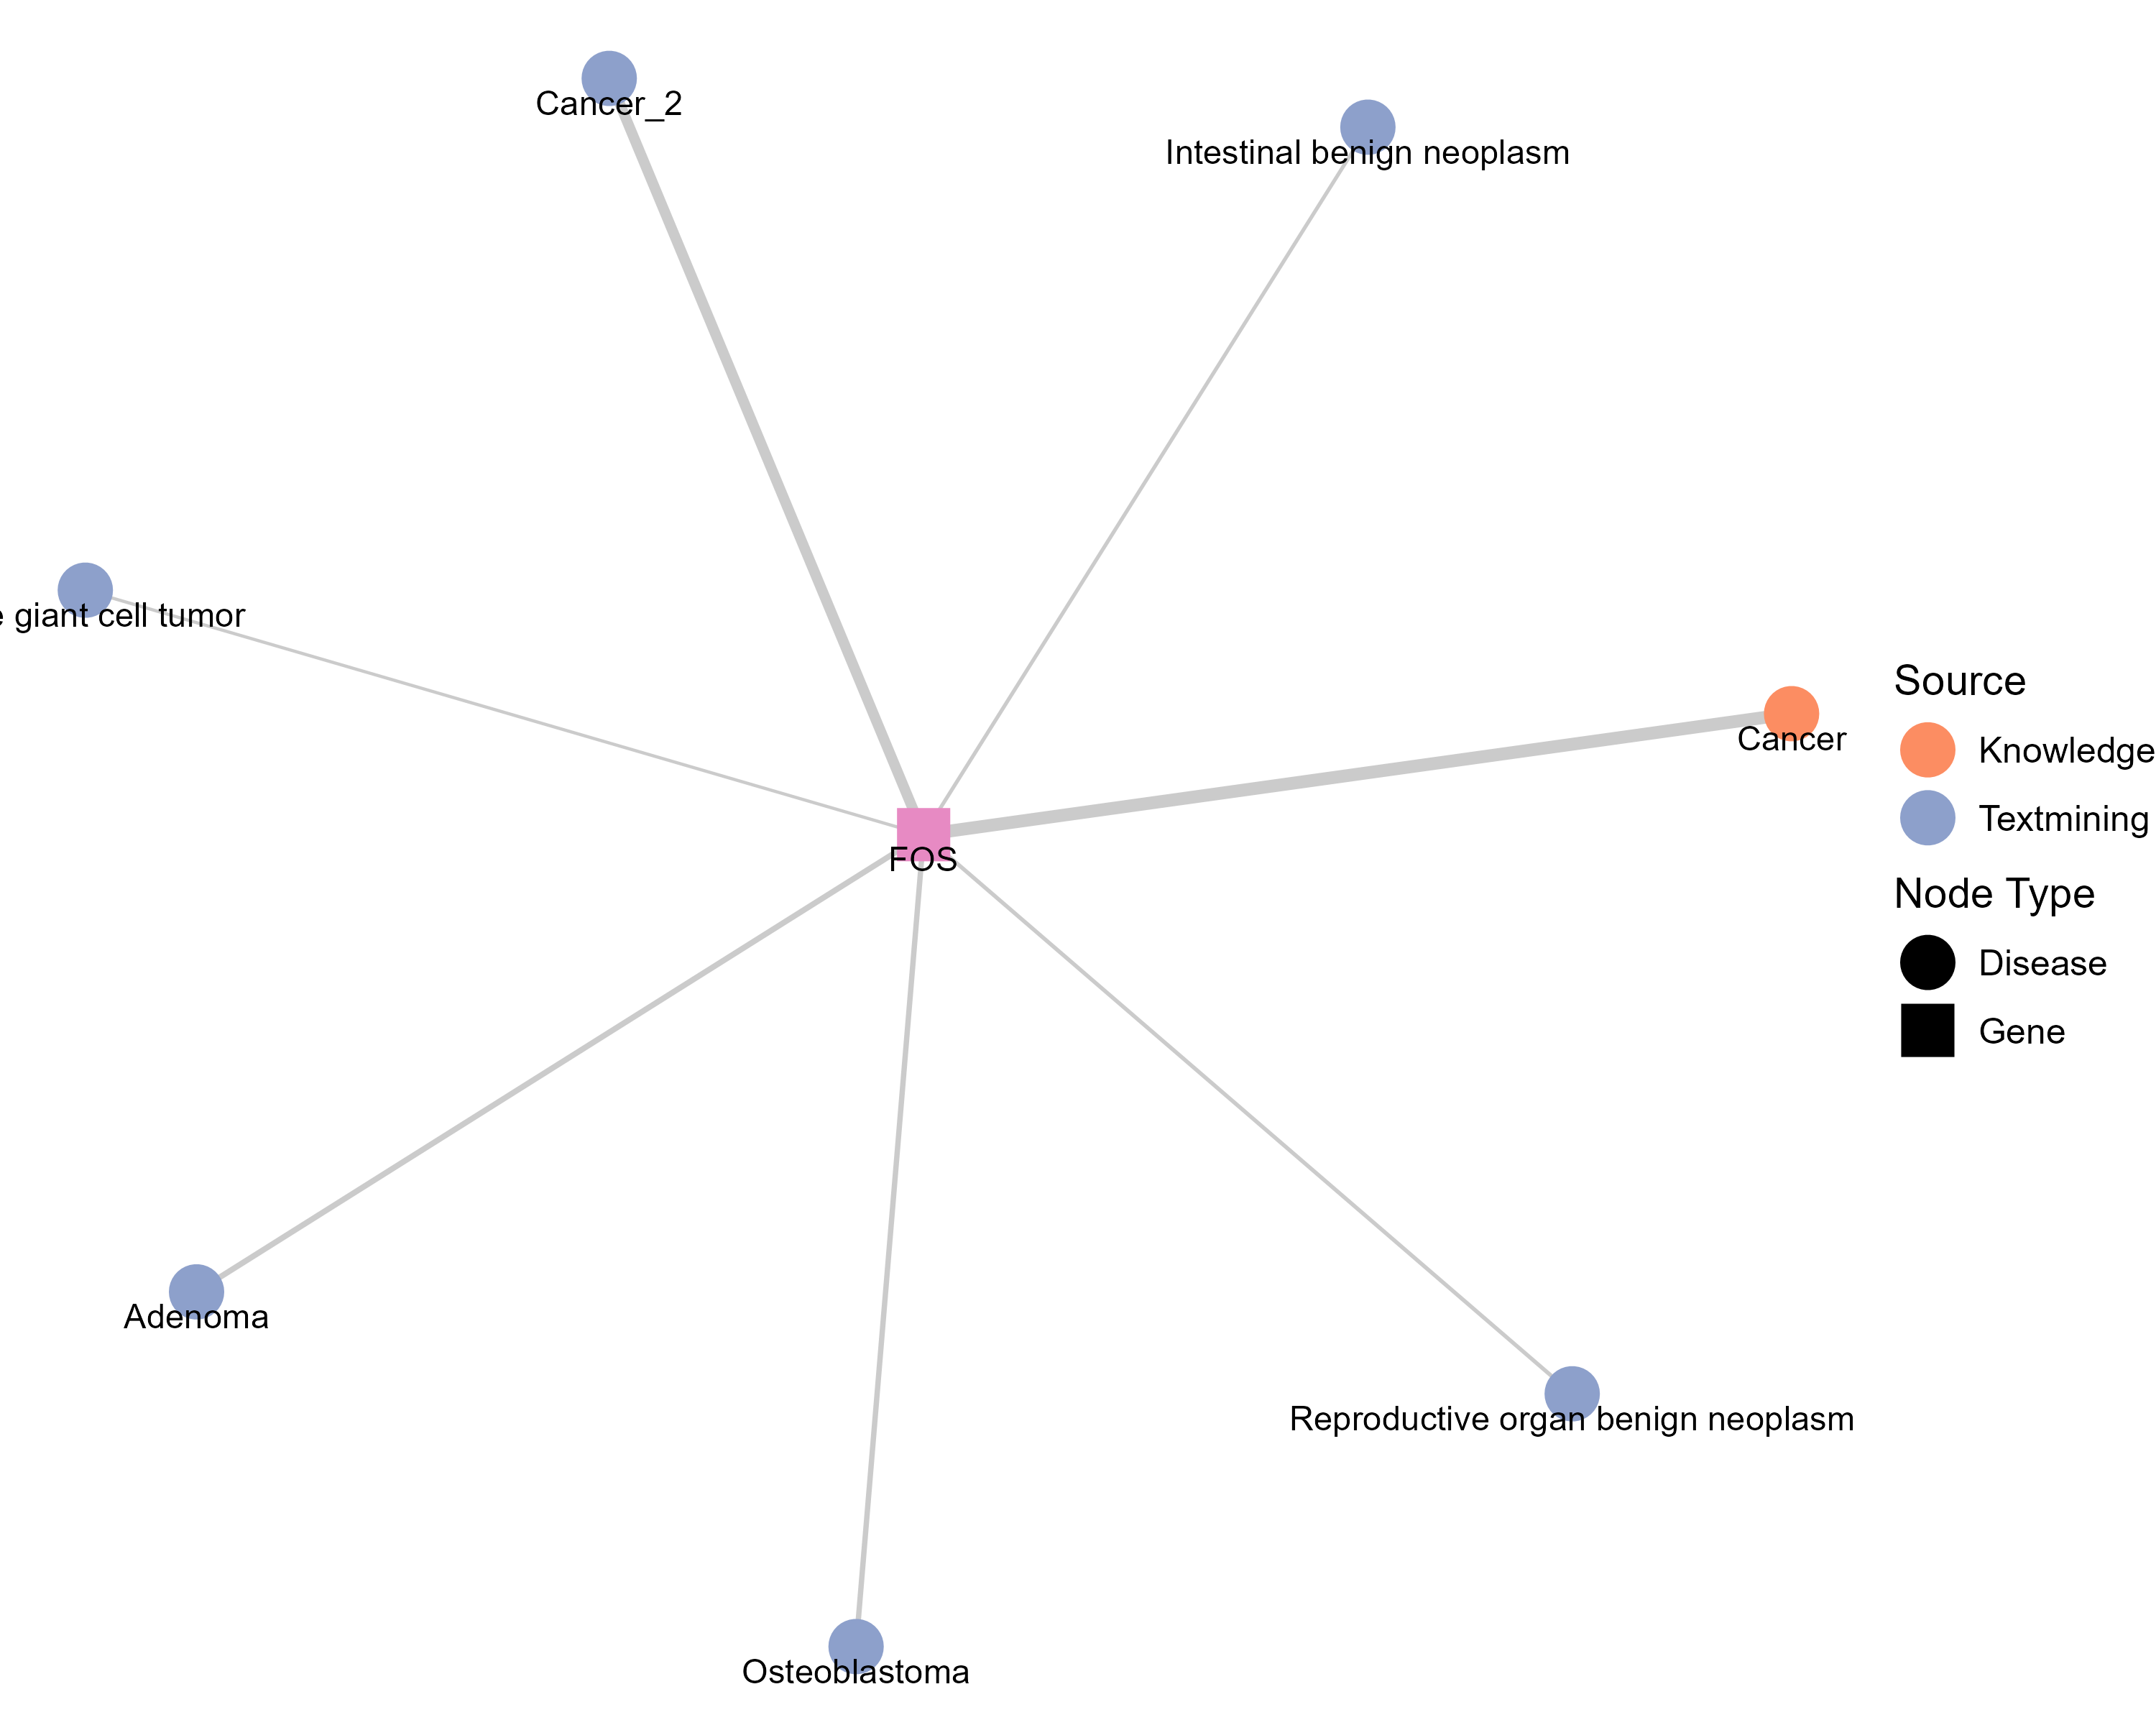 |
Top |
Survival analysis based on FOS expression |
Top |
| Reference |
| [1] Steele CD, Abbasi A, Islam SMA, et al. Signatures of copy number alterations in human cancer. Nature. 2022 Jun;606(7916):984-991. doi: 10.1038/s41586-022-04738-6. Epub 2022 Jun 15. PMID: 35705804; PMCID: PMC9242861. [2] Beibei Ru, Ching Ngar Wong, Yin Tong, et al. TISIDB: an integrated repository portal for tumor–immune system interactions, Bioinformatics, Volume 35, Issue 20, October 2019, Pages 4200–4202, https://doi.org/10.1093/bioinformatics/btz210. [3] Zhongyang Liu, Jiale Liu, Xinyue Liu, et al. CTR–DB, an omnibus for patient-derived gene expression signatures correlated with cancer drug response, Nucleic Acids Research, Volume 50, Issue D1, 7 January 2022, Pages D1184–D1199, https://doi.org/10.1093/nar/gkab860. [4] Charoentong P, Finotello F, Angelova M, et al. Pan-cancer Immunogenomic Analyses Reveal Genotype-Immunophenotype Relationships and Predictors of Response to Checkpoint Blockade. Cell Rep. 2017 Jan 3;18(1):248–262. doi: 10.1016/j.celrep.2016.12.019. PMID: 28052254. [5] Thorsson V, Gibbs DL, Brown SD, et al. The Immune Landscape of Cancer. Immunity. 2018 Apr 17;48(4):812-830.e14. doi: 10.1016/j.immuni.2018.03.023. Epub 2018 Apr 5. Erratum in: Immunity. 2019 Aug 20;51(2):411-412. doi: 10.1016/j.immuni.2019.08.004. PMID: 29628290; PMCID: PMC5982584. [6] Zapata L, Caravagna G, Williams MJ, et al. Immune selection determines tumor antigenicity and influences response to checkpoint inhibitors. Nat Genet. 2023 Mar;55(3):451-460. doi: 10.1038/s41588-023-01313-1. Epub 2023 Mar 9. PMID: 36894710; PMCID: PMC10011129. [7] Cortes-Ciriano I, Lee S, Park WY, et al. A molecular portrait of microsatellite instability across multiple cancers. Nat Commun. 2017 Jun 6;8:15180. doi: 10.1038/ncomms15180. PMID: 28585546; PMCID: PMC5467167. [8] Cannon M, Stevenson J, Stahl K, et al. DGIdb 5.0: rebuilding the drug-gene interaction database for precision medicine and drug discovery platforms. Nucleic Acids Res. 2024 Jan 5;52(D1):D1227-D1235. doi: 10.1093/nar/gkad1040. PMID: 37953380; PMCID: PMC10767982. [9] Grissa D, Junge A, Oprea TI, Jensen LJ. Diseases 2.0: a weekly updated database of disease-gene associations from text mining and data integration. Database (Oxford). 2022 Mar 28;2022:baac019. doi: 10.1093/database/baac019. PMID: 35348648; PMCID: PMC9216524. |

Copyright 2024-Present -The University of Texas Health Science Center at Houston |