|
|
||||||||
|
||||||||

Gene summary for MYBL2 |
| Gene Symbol | MYBL2 | Gene ID | 4605 |
| Gene name | MYB proto-oncogene like 2 |
| Synonyms | B-MYB;BMYB |
| Type of gene | protein_coding |
| UniProtAcc | P10244 |
| GO ID | GO term |
| GO:0045944 | positive regulation of transcription by RNA polymerase II |
| GO:0000278 | mitotic cell cycle |
| GO:0043525 | positive regulation of neuron apoptotic process |
| GO:0090307 | mitotic spindle assembly |
| GO:1990830 | cellular response to leukemia inhibitory factor |
Top |
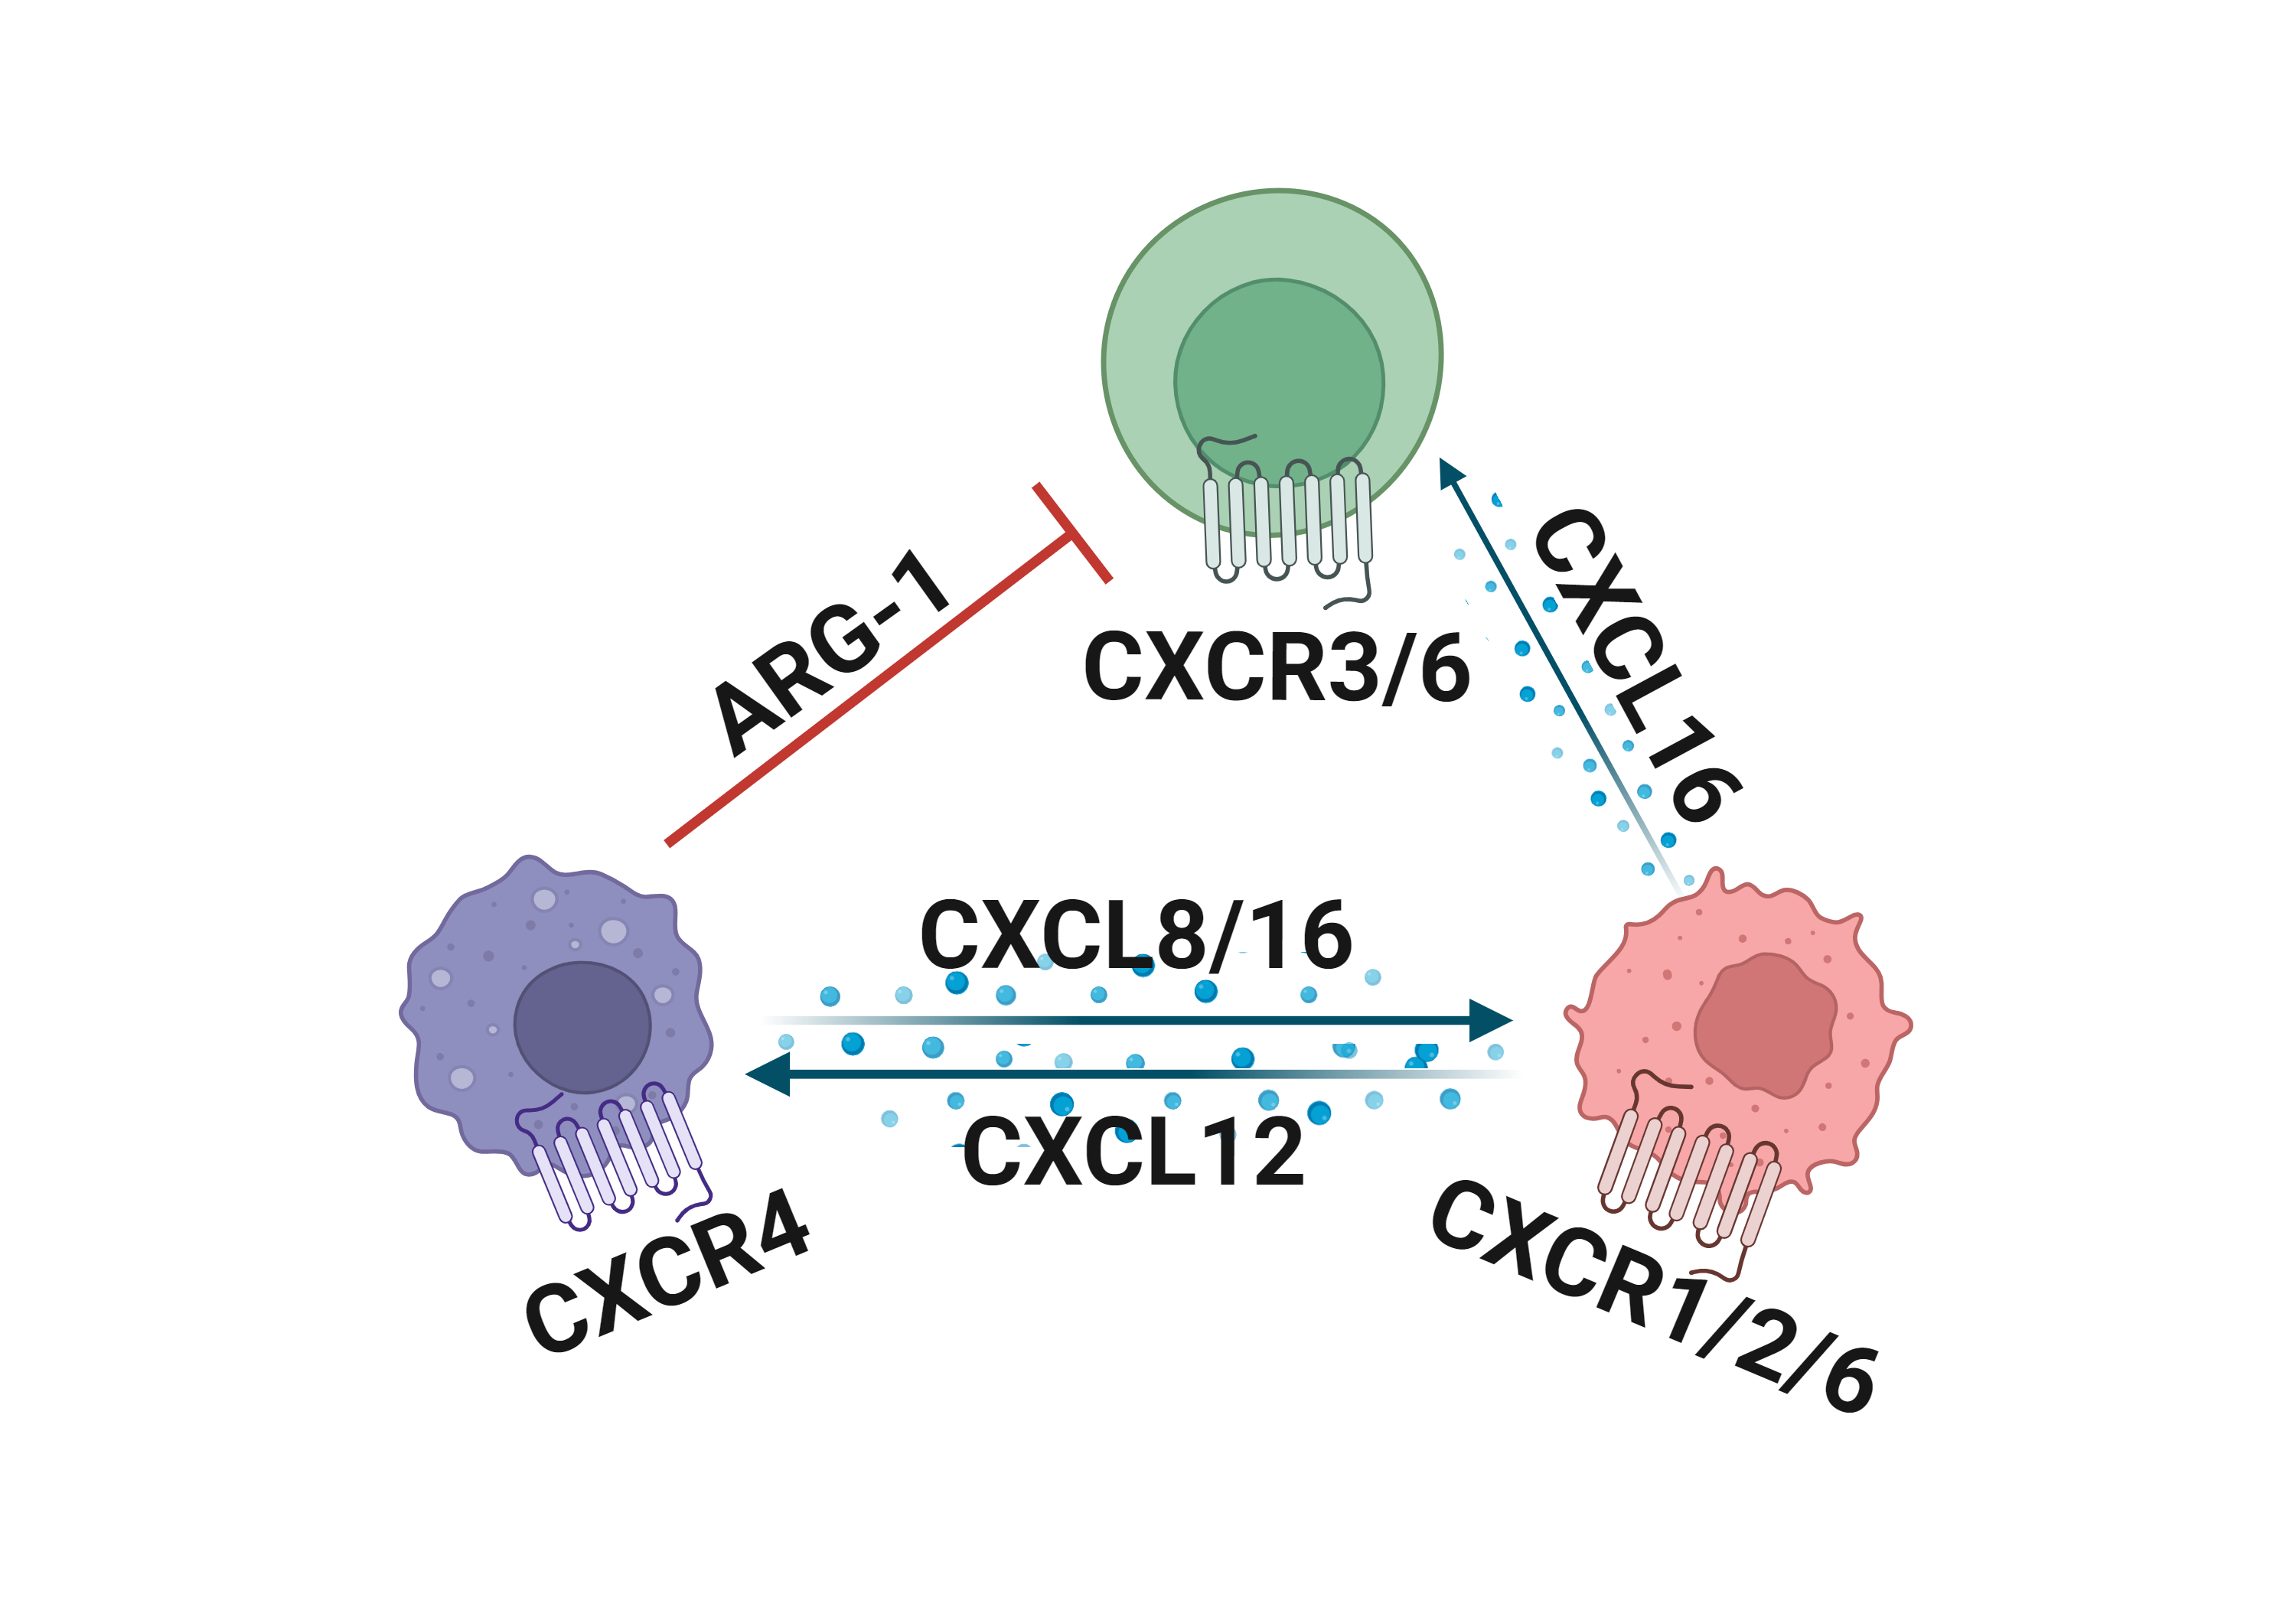
Literatures describing the association of MYBL2 and immune escape mechanisms |
Top |
Comparison of the MYBL2 expression level between tumor and normal groups |
Top |
Comparison of the MYBL2 methylation level between tumor and normal groups |
No significant differences were found in MYBL2 methylation in promoter region.
No significant differences were found in MYBL2 methylation in genebody region.
Top |
Summary of the copy number in TCGA tumor samples |
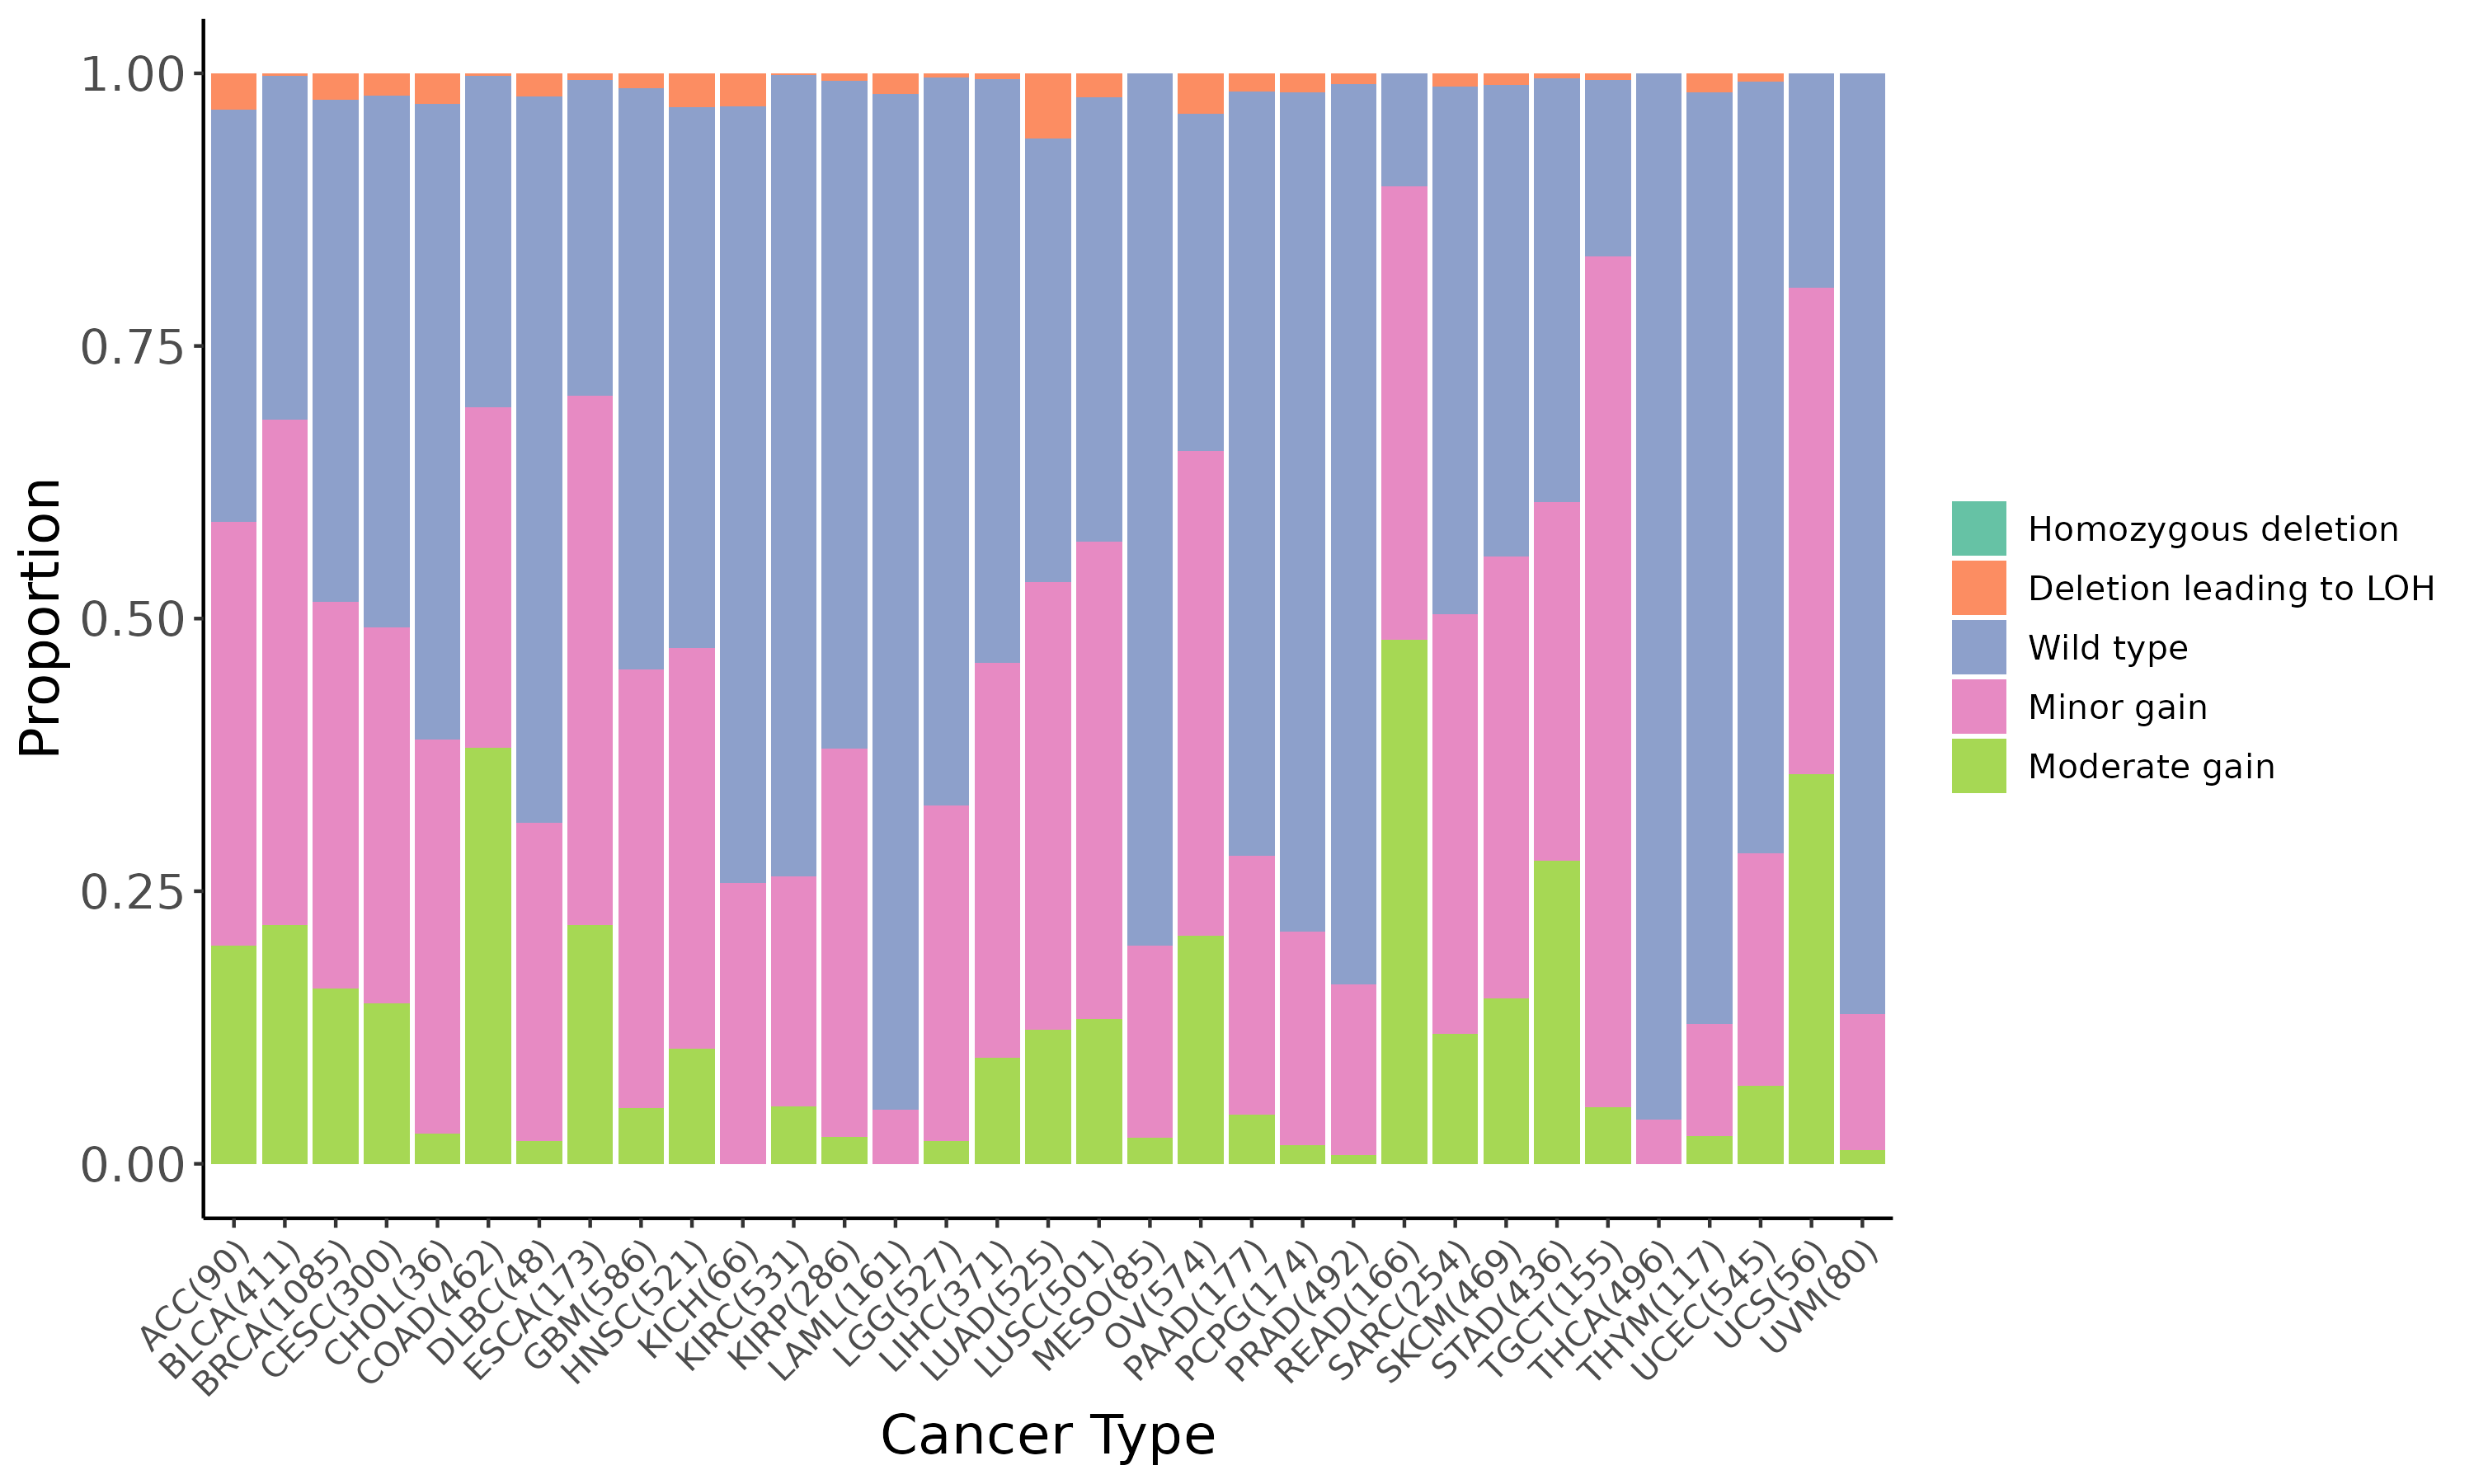 |
Top |
DEGs and the enrichment analysis between the mutated and wild type groups |
| Gene ID | Symbol | Log2 Fold Change | P-value | Adjusted P-value |
|---|---|---|---|---|
| ENSG00000214652 | ZNF727 | -3.92e+00 | 2.54e-05 | 6.54e-03 |
| ENSG00000184160 | ADRA2C | -3.88e+00 | 2.57e-05 | 6.58e-03 |
| ENSG00000188523 | CFAP77 | -5.32e+00 | 2.69e-05 | 6.76e-03 |
| ENSG00000274286 | ADRA2B | -3.11e+00 | 2.67e-05 | 6.76e-03 |
| ENSG00000100346 | CACNA1I | -4.04e+00 | 2.99e-05 | 7.34e-03 |
| ENSG00000171435 | KSR2 | -3.52e+00 | 3.00e-05 | 7.34e-03 |
| ENSG00000263429 | LINC00675 | -5.85e+00 | 3.00e-05 | 7.34e-03 |
| ENSG00000137766 | UNC13C | -7.06e+00 | 3.21e-05 | 7.79e-03 |
| ENSG00000127578 | WFIKKN1 | -2.94e+00 | 3.25e-05 | 7.81e-03 |
| ENSG00000129654 | FOXJ1 | -4.46e+00 | 3.28e-05 | 7.81e-03 |
| ENSG00000275155 | CTD-2595P9.4 | -4.30e+00 | 3.70e-05 | 8.75e-03 |
| ENSG00000258676 | RP11-386M24.3 | -5.31e+00 | 3.92e-05 | 9.18e-03 |
| ENSG00000234026 | RP11-310E22.4 | -5.45e+00 | 4.06e-05 | 9.44e-03 |
| ENSG00000095203 | EPB41L4B | -2.11e+00 | 4.20e-05 | 9.57e-03 |
| ENSG00000230699 | RP11-54O7.1 | -4.61e+00 | 4.21e-05 | 9.57e-03 |
| ENSG00000280435 | RP4-555D20.1 | -5.35e+00 | 4.22e-05 | 9.57e-03 |
| ENSG00000115590 | IL1R2 | 3.17e+00 | 4.44e-05 | 9.64e-03 |
| ENSG00000126353 | CCR7 | -3.70e+00 | 4.41e-05 | 9.64e-03 |
| ENSG00000131668 | BARX1 | -4.54e+00 | 4.33e-05 | 9.64e-03 |
| ENSG00000138115 | CYP2C8 | -3.58e+00 | 4.46e-05 | 9.64e-03 |
| Page: 1 2 ... 3 4 5 6 7 ... 19 20 |
Up-regulated KEGG pathways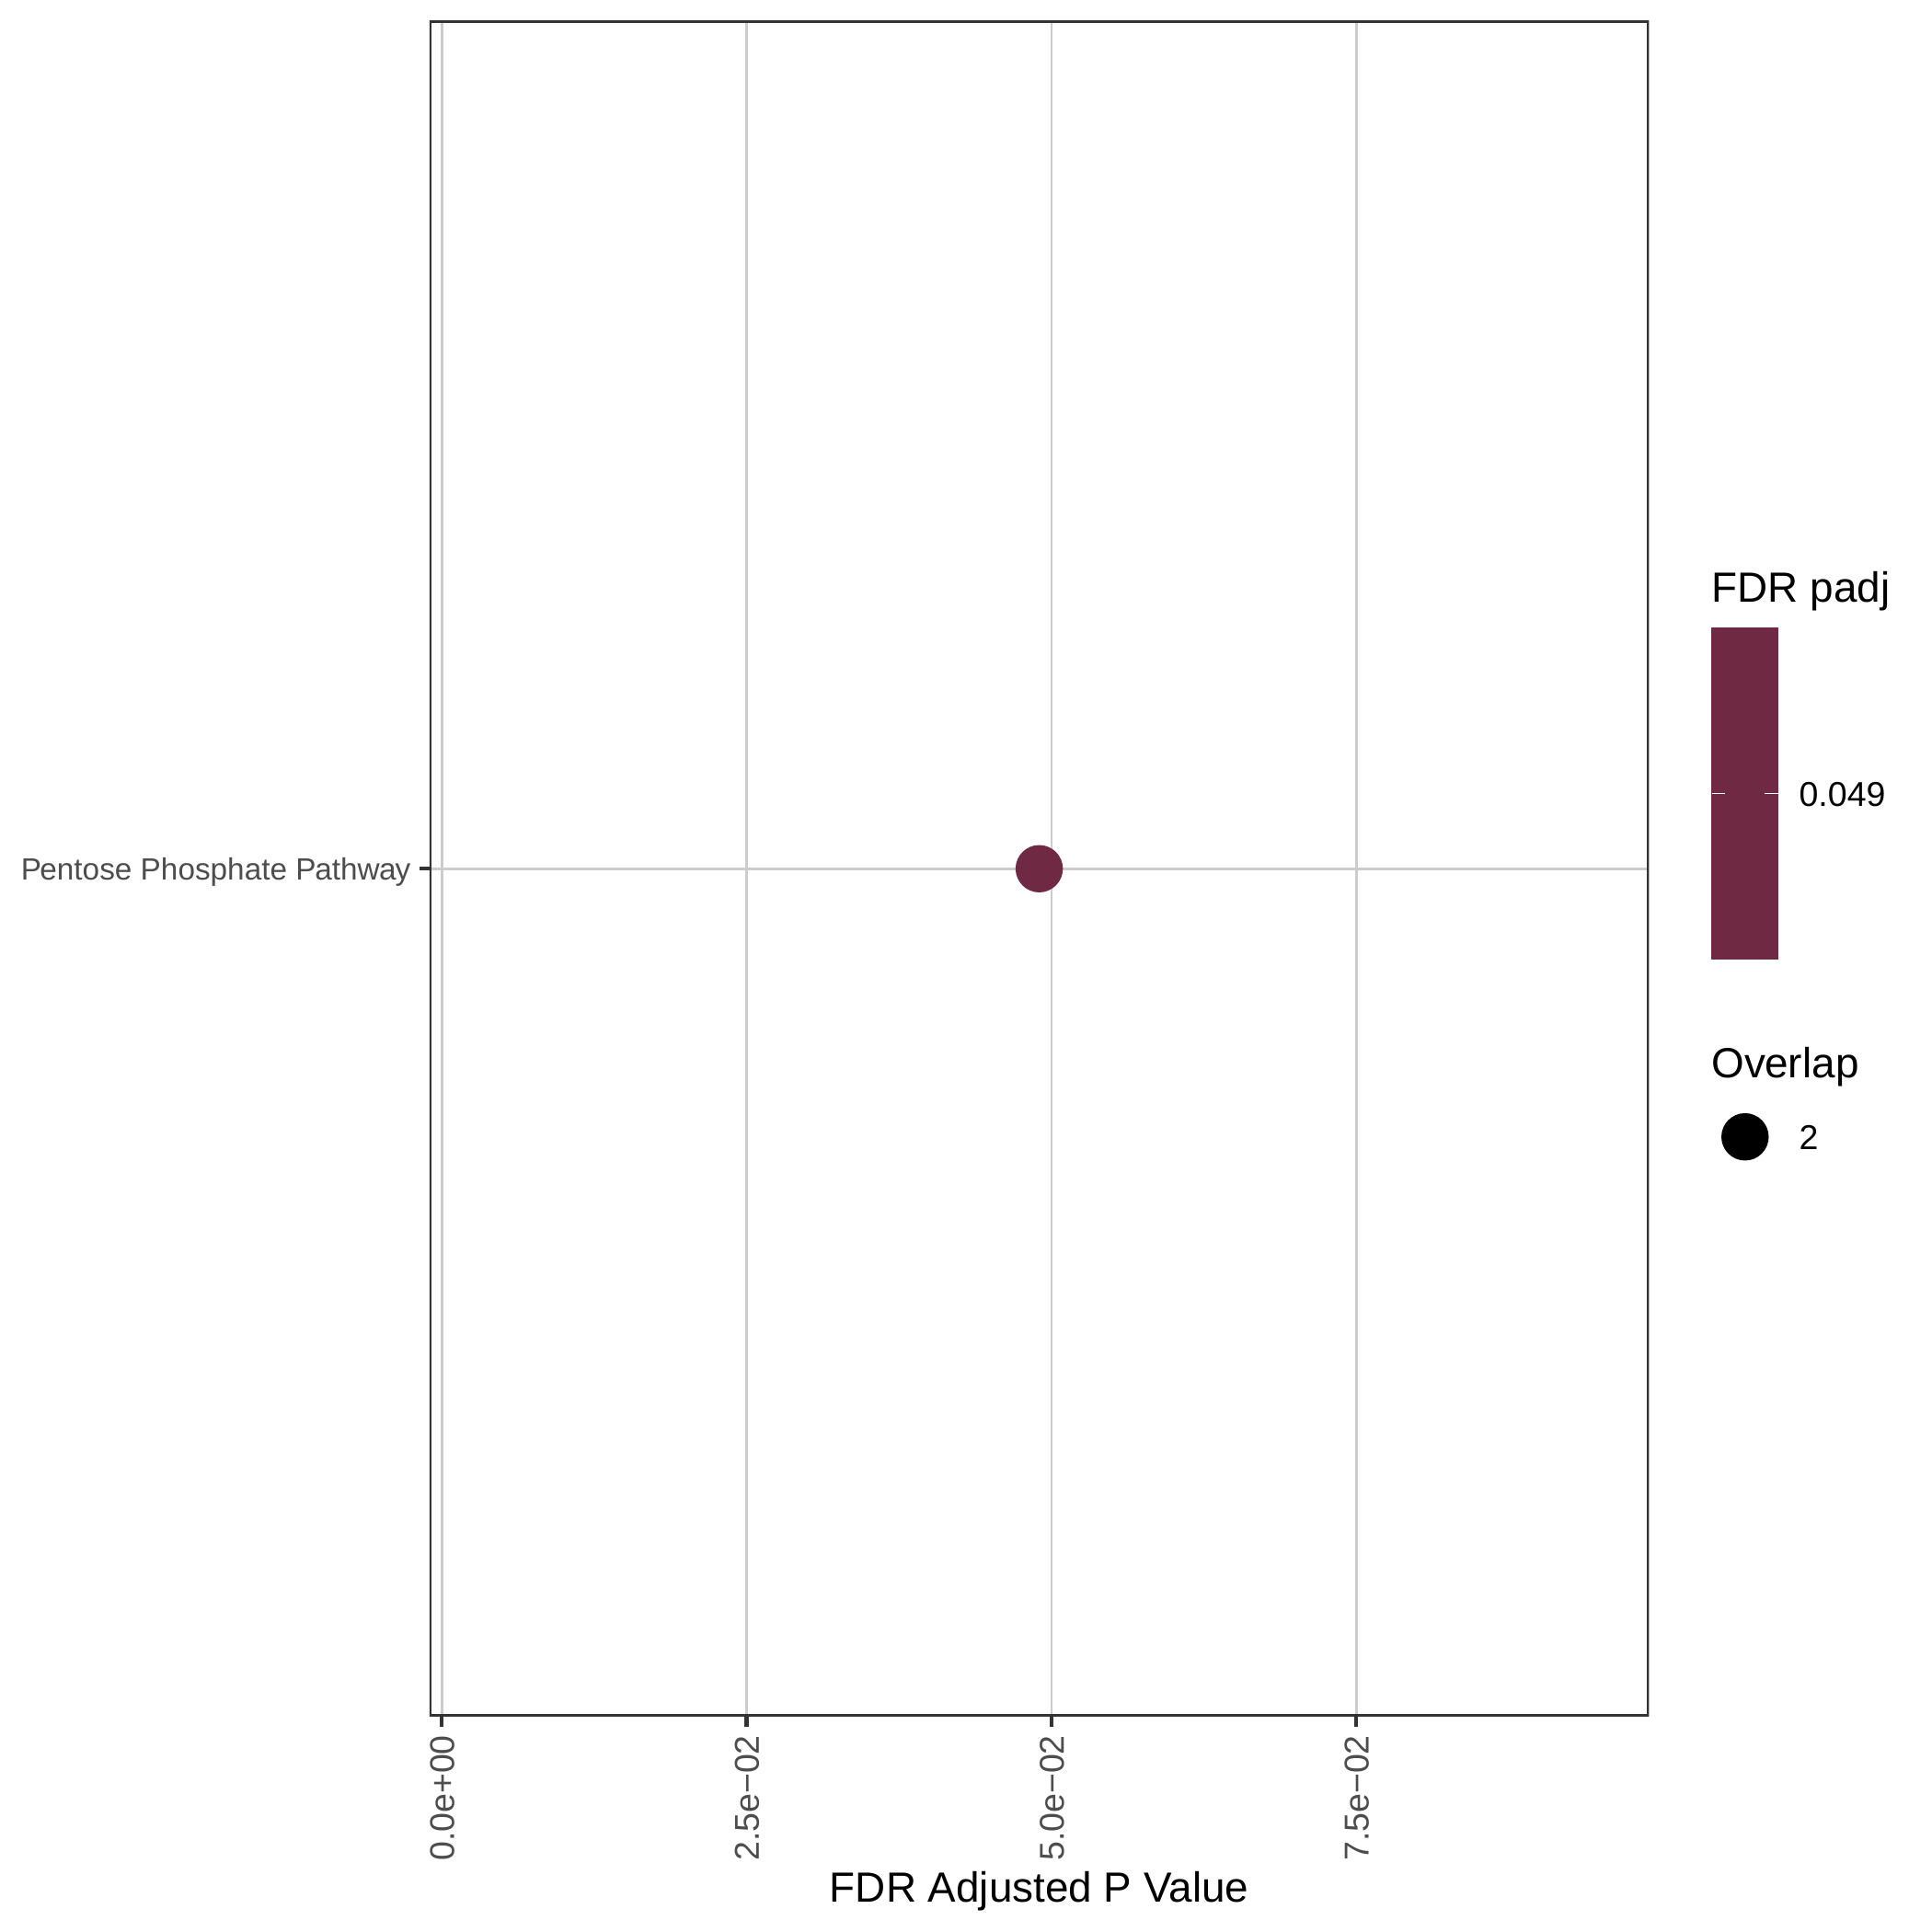 | Up-regulated Hallmark pathways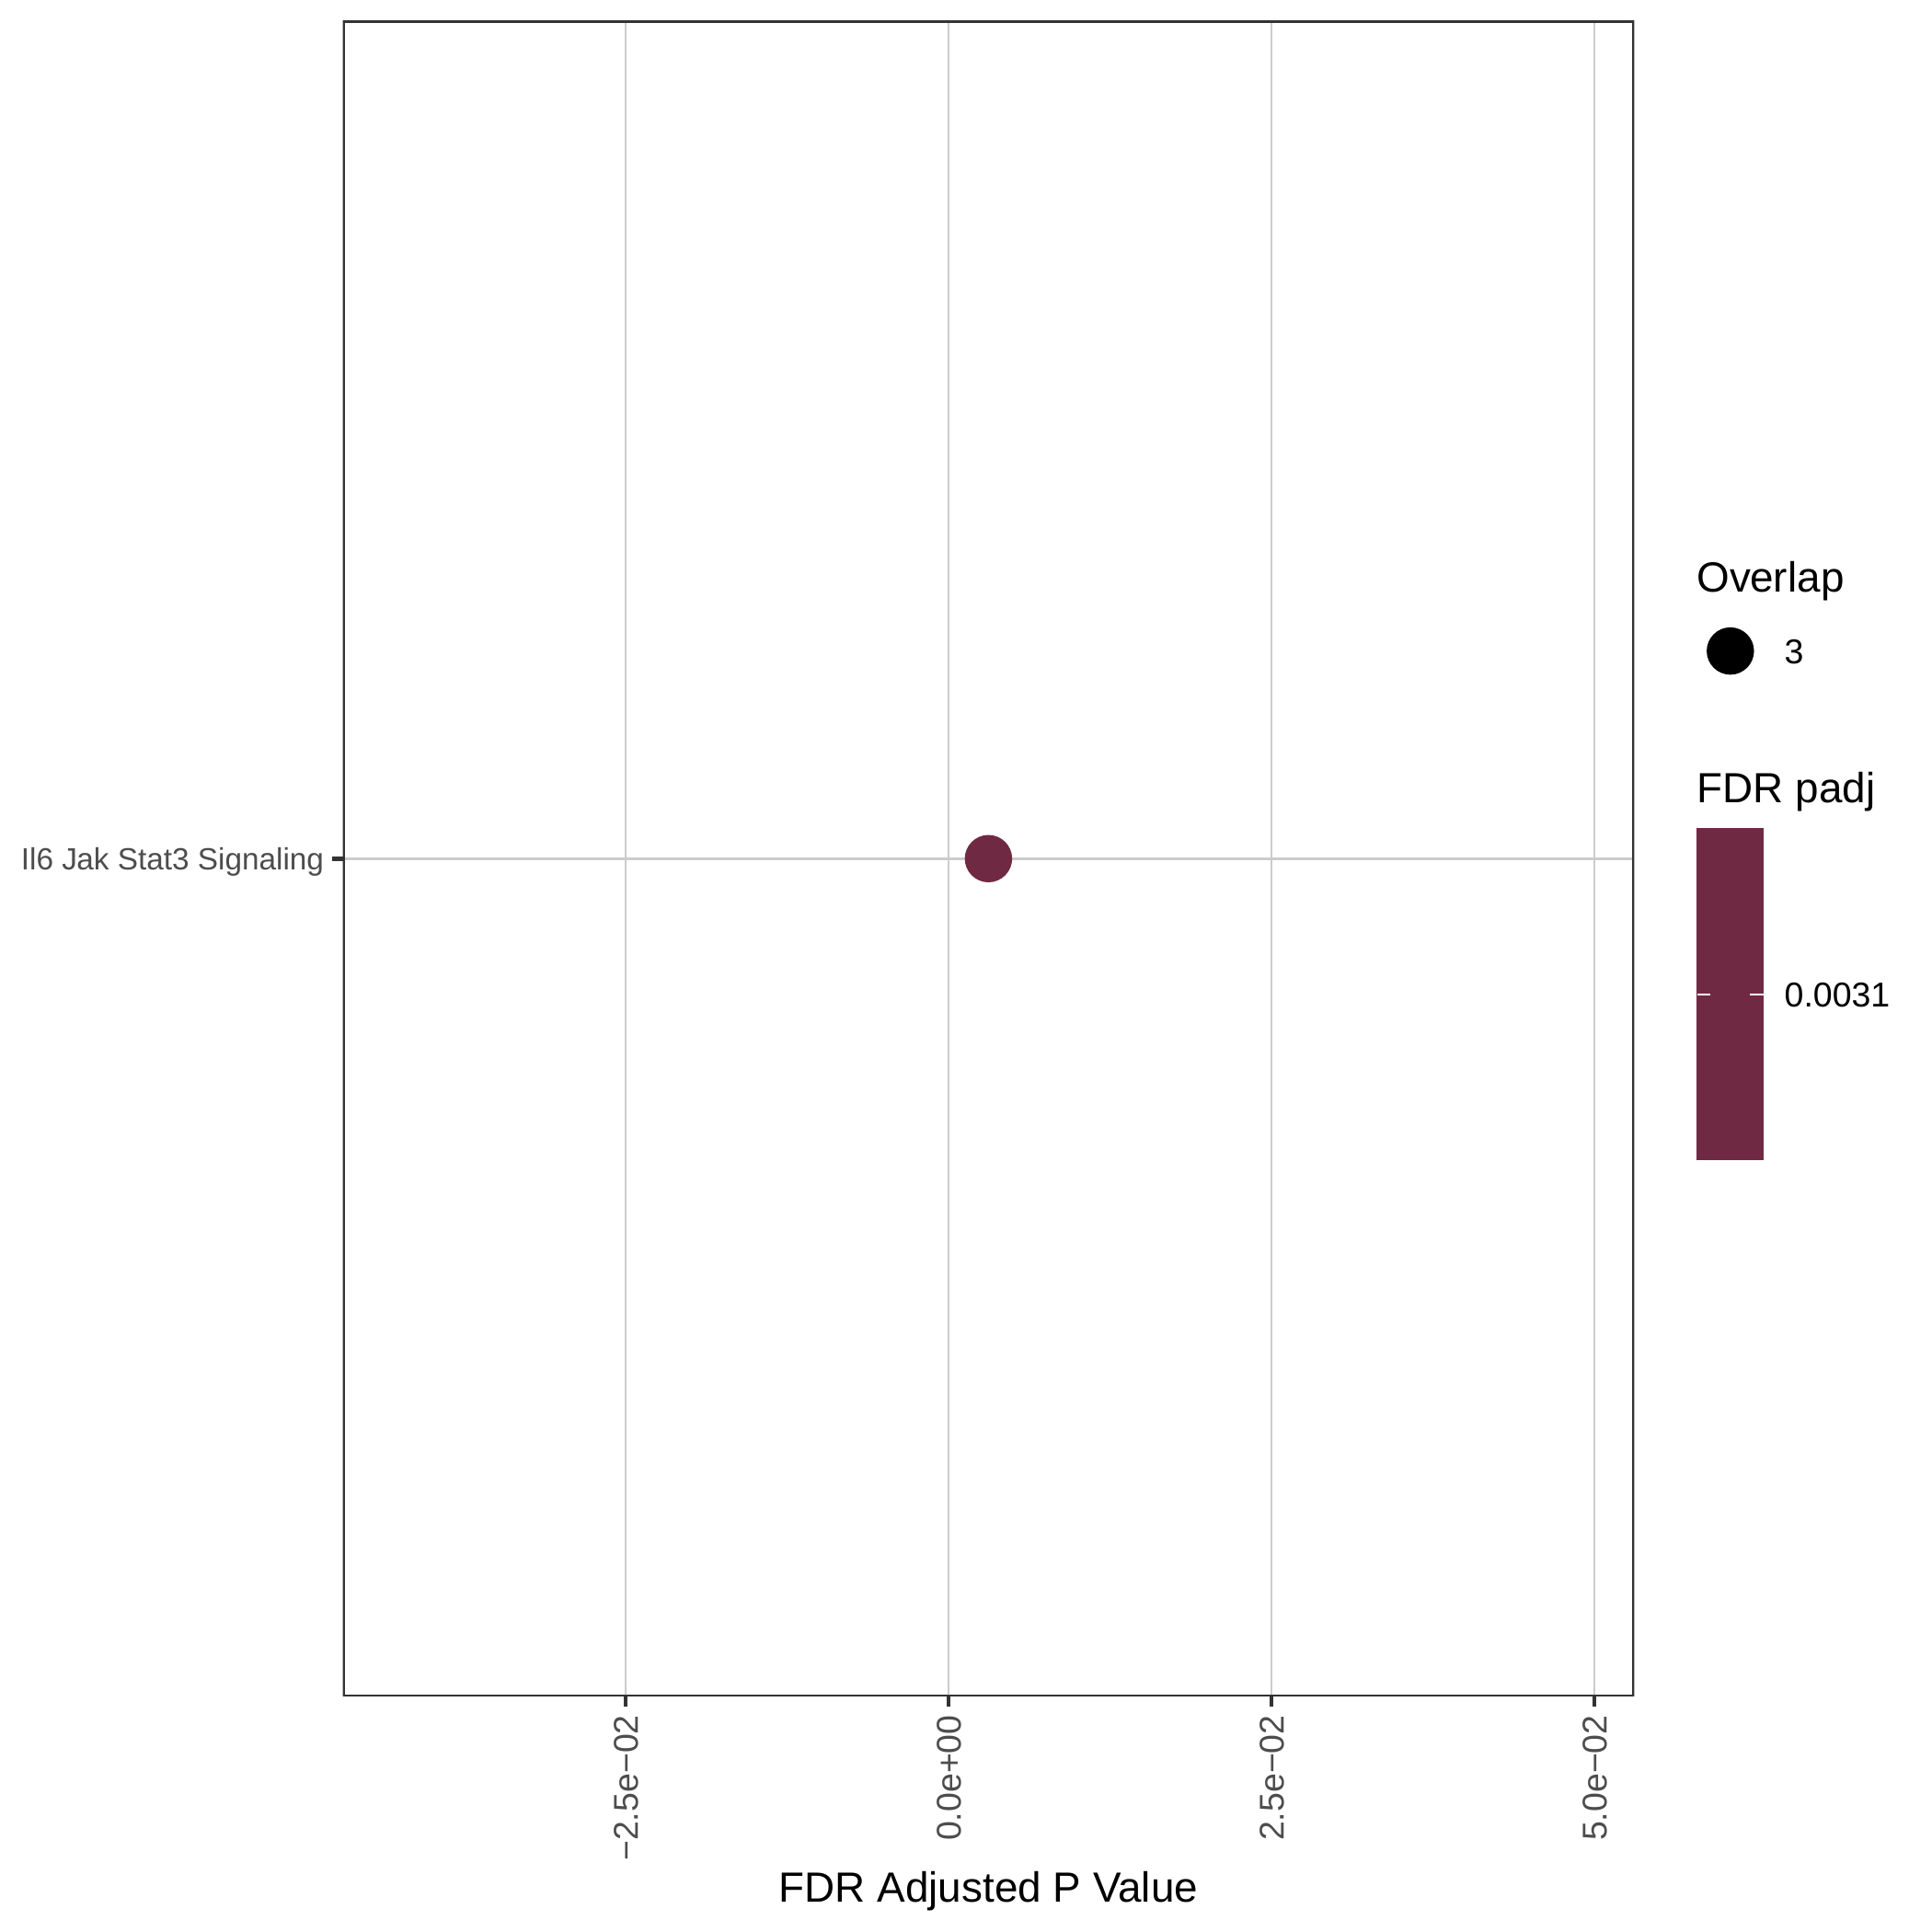 |
Gene expression and mutation differences between non-responders and responders after immunotherapy |
| Expression | Mutation |
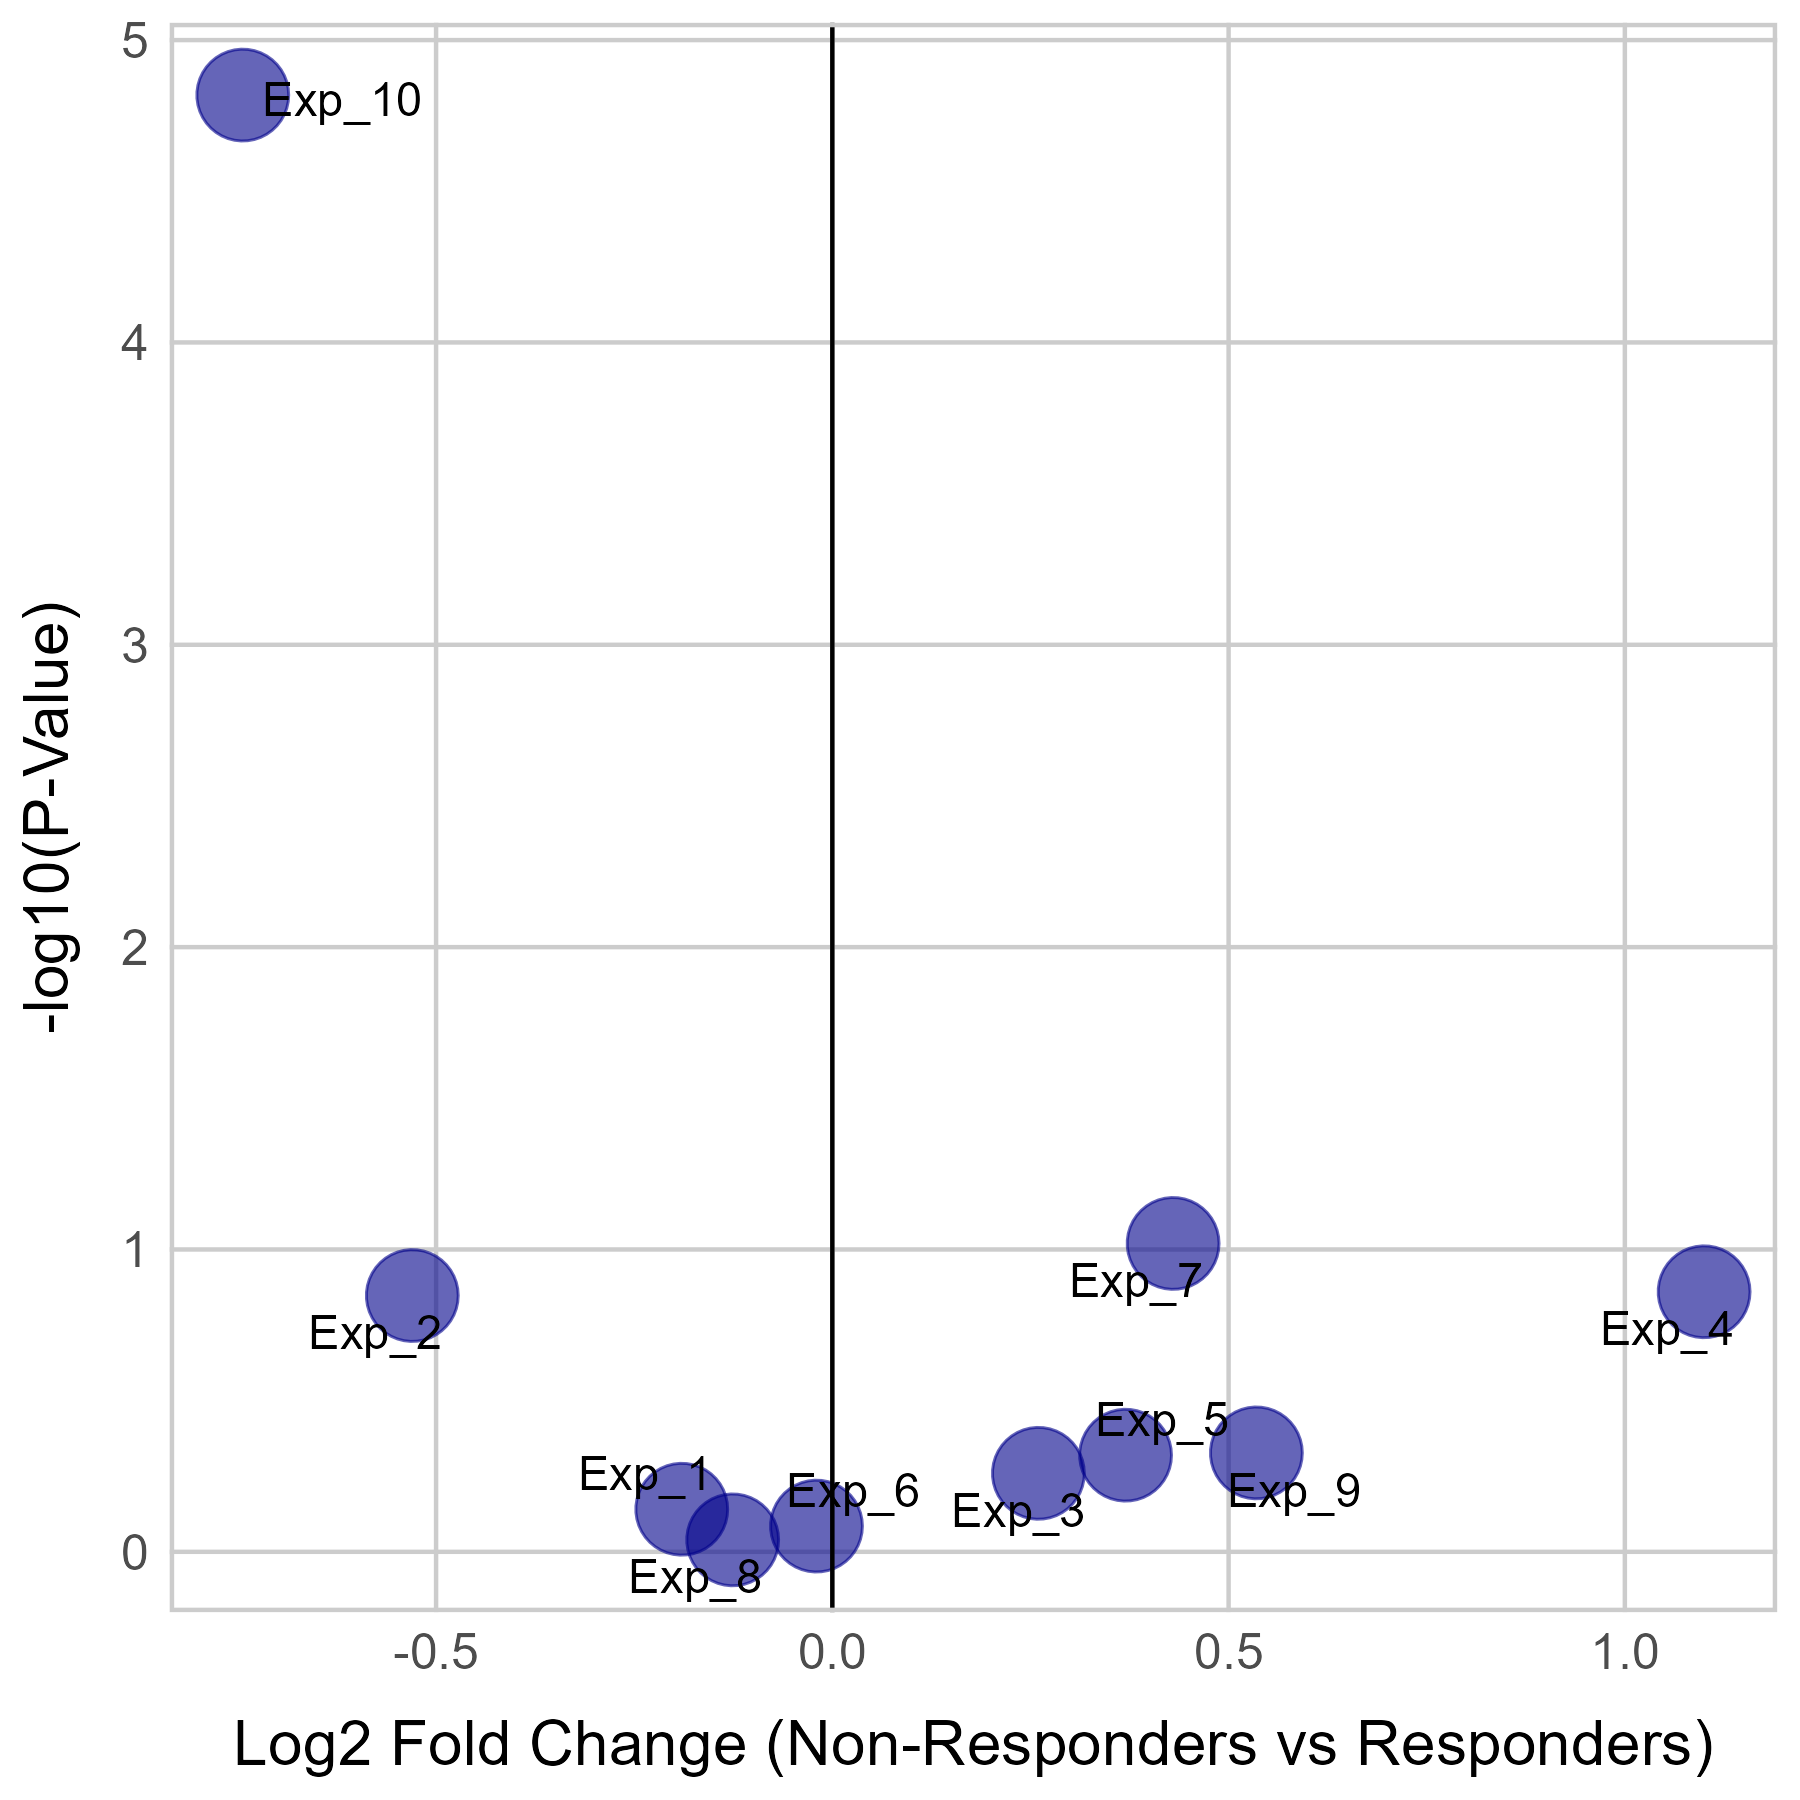 | 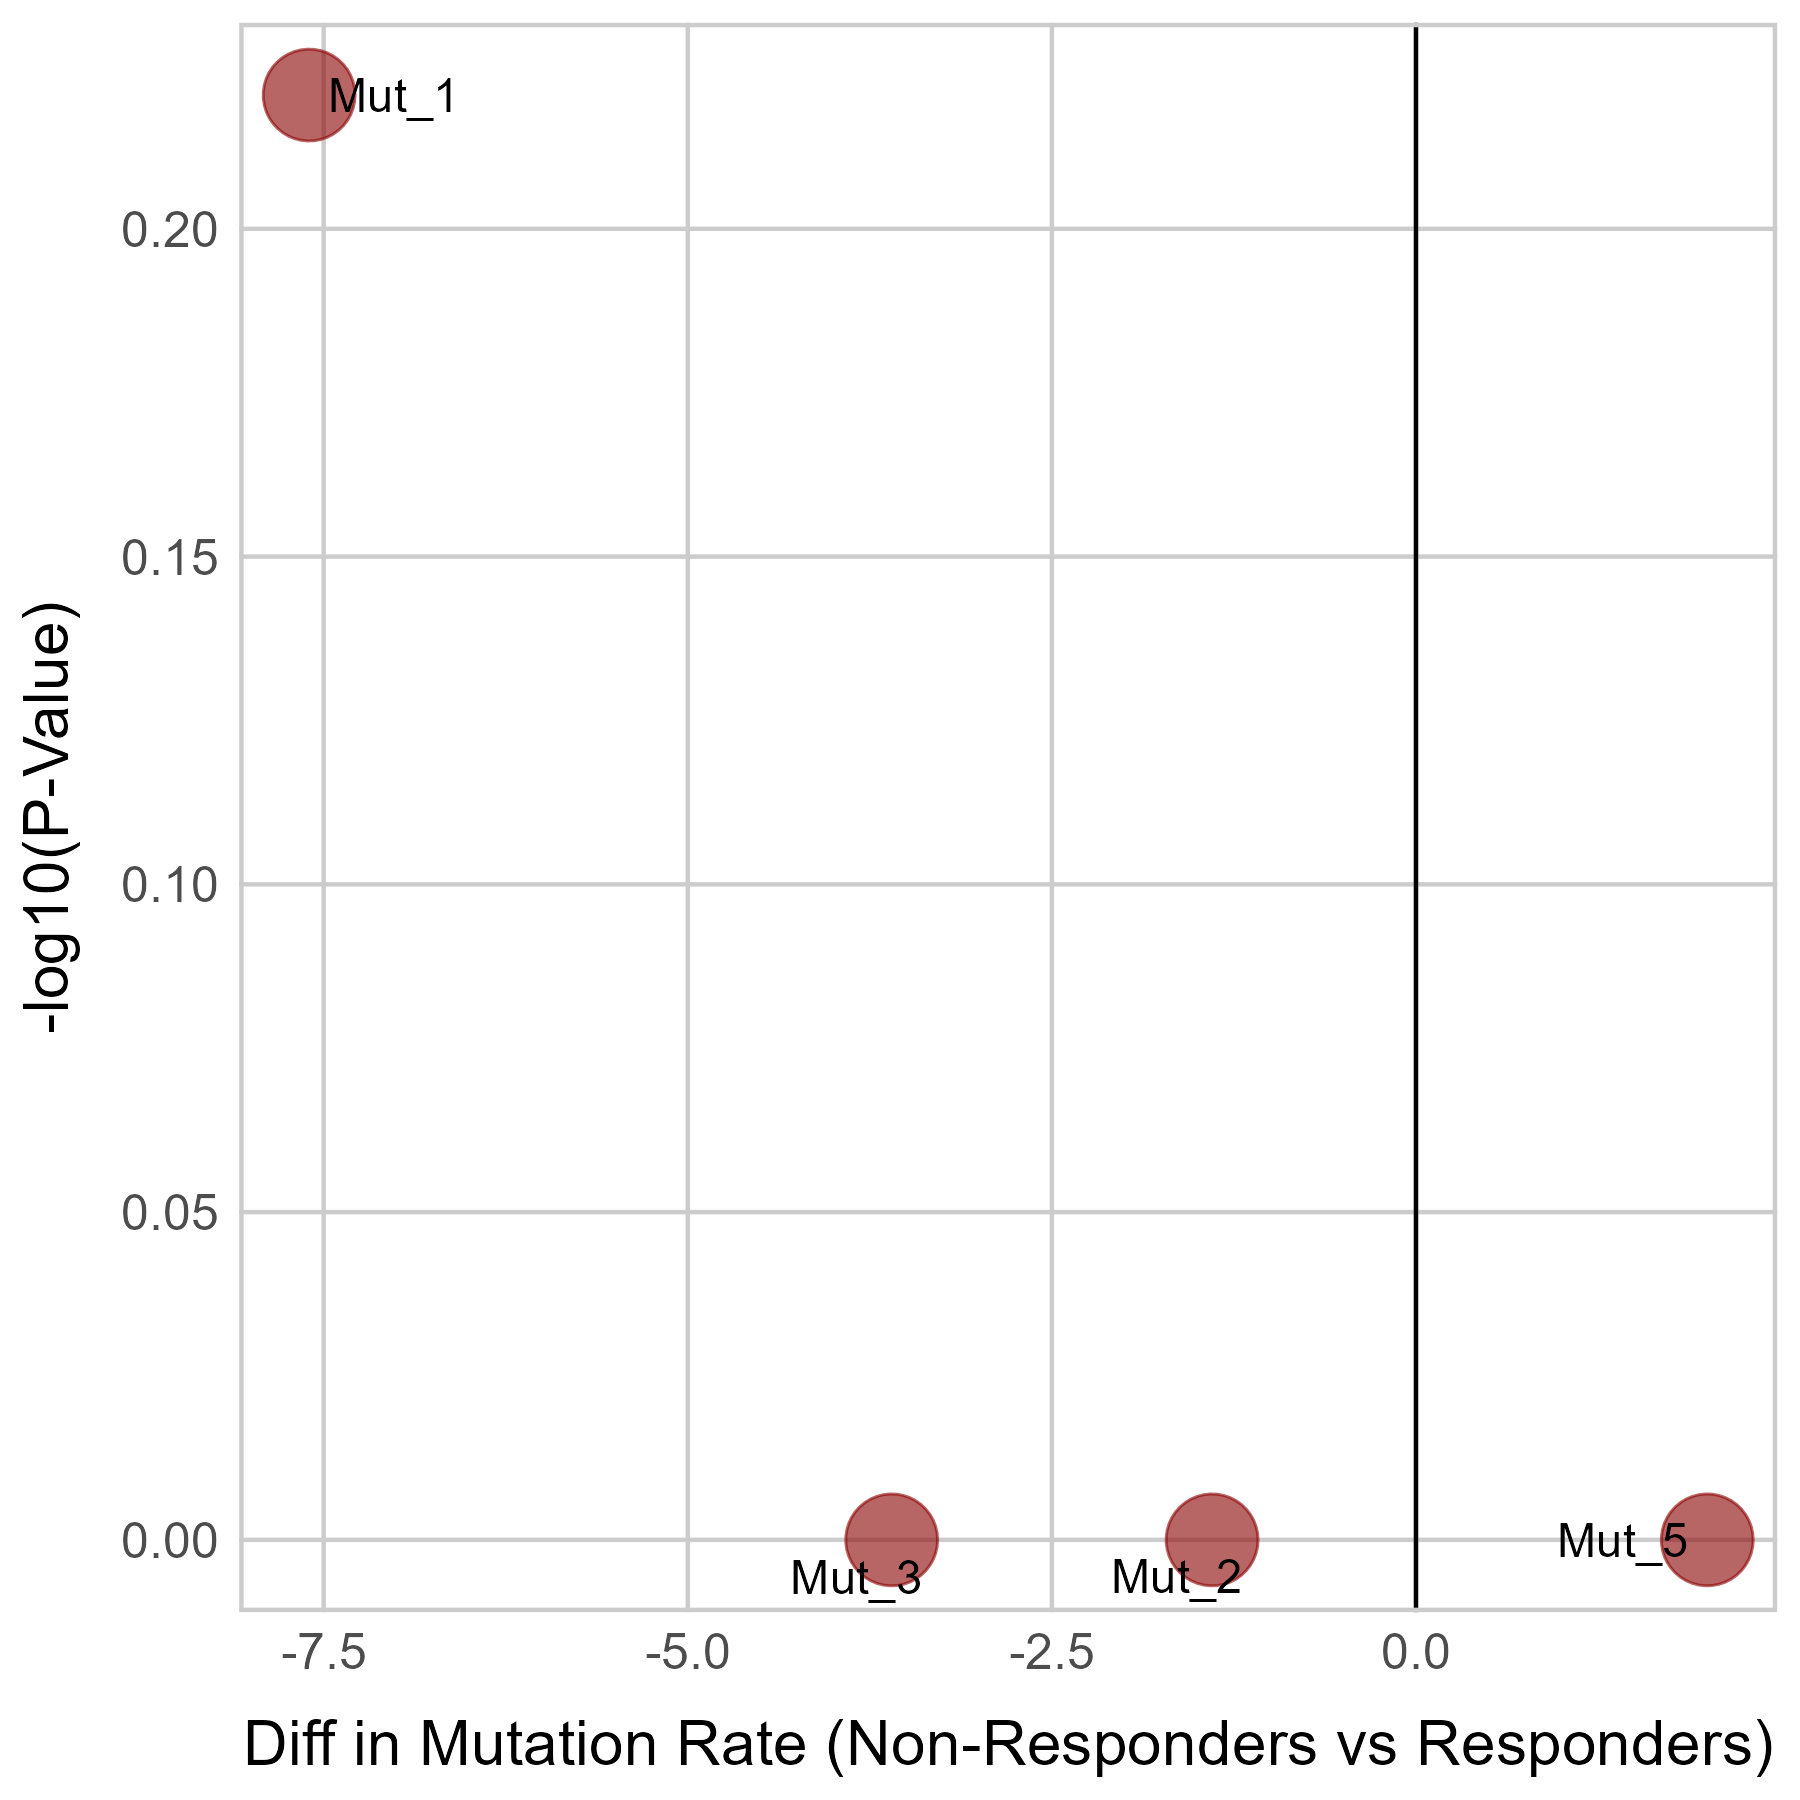 |
No significant differences were found in MYBL2 expression.
No significant differences were found in MYBL2 mutation.
Top |
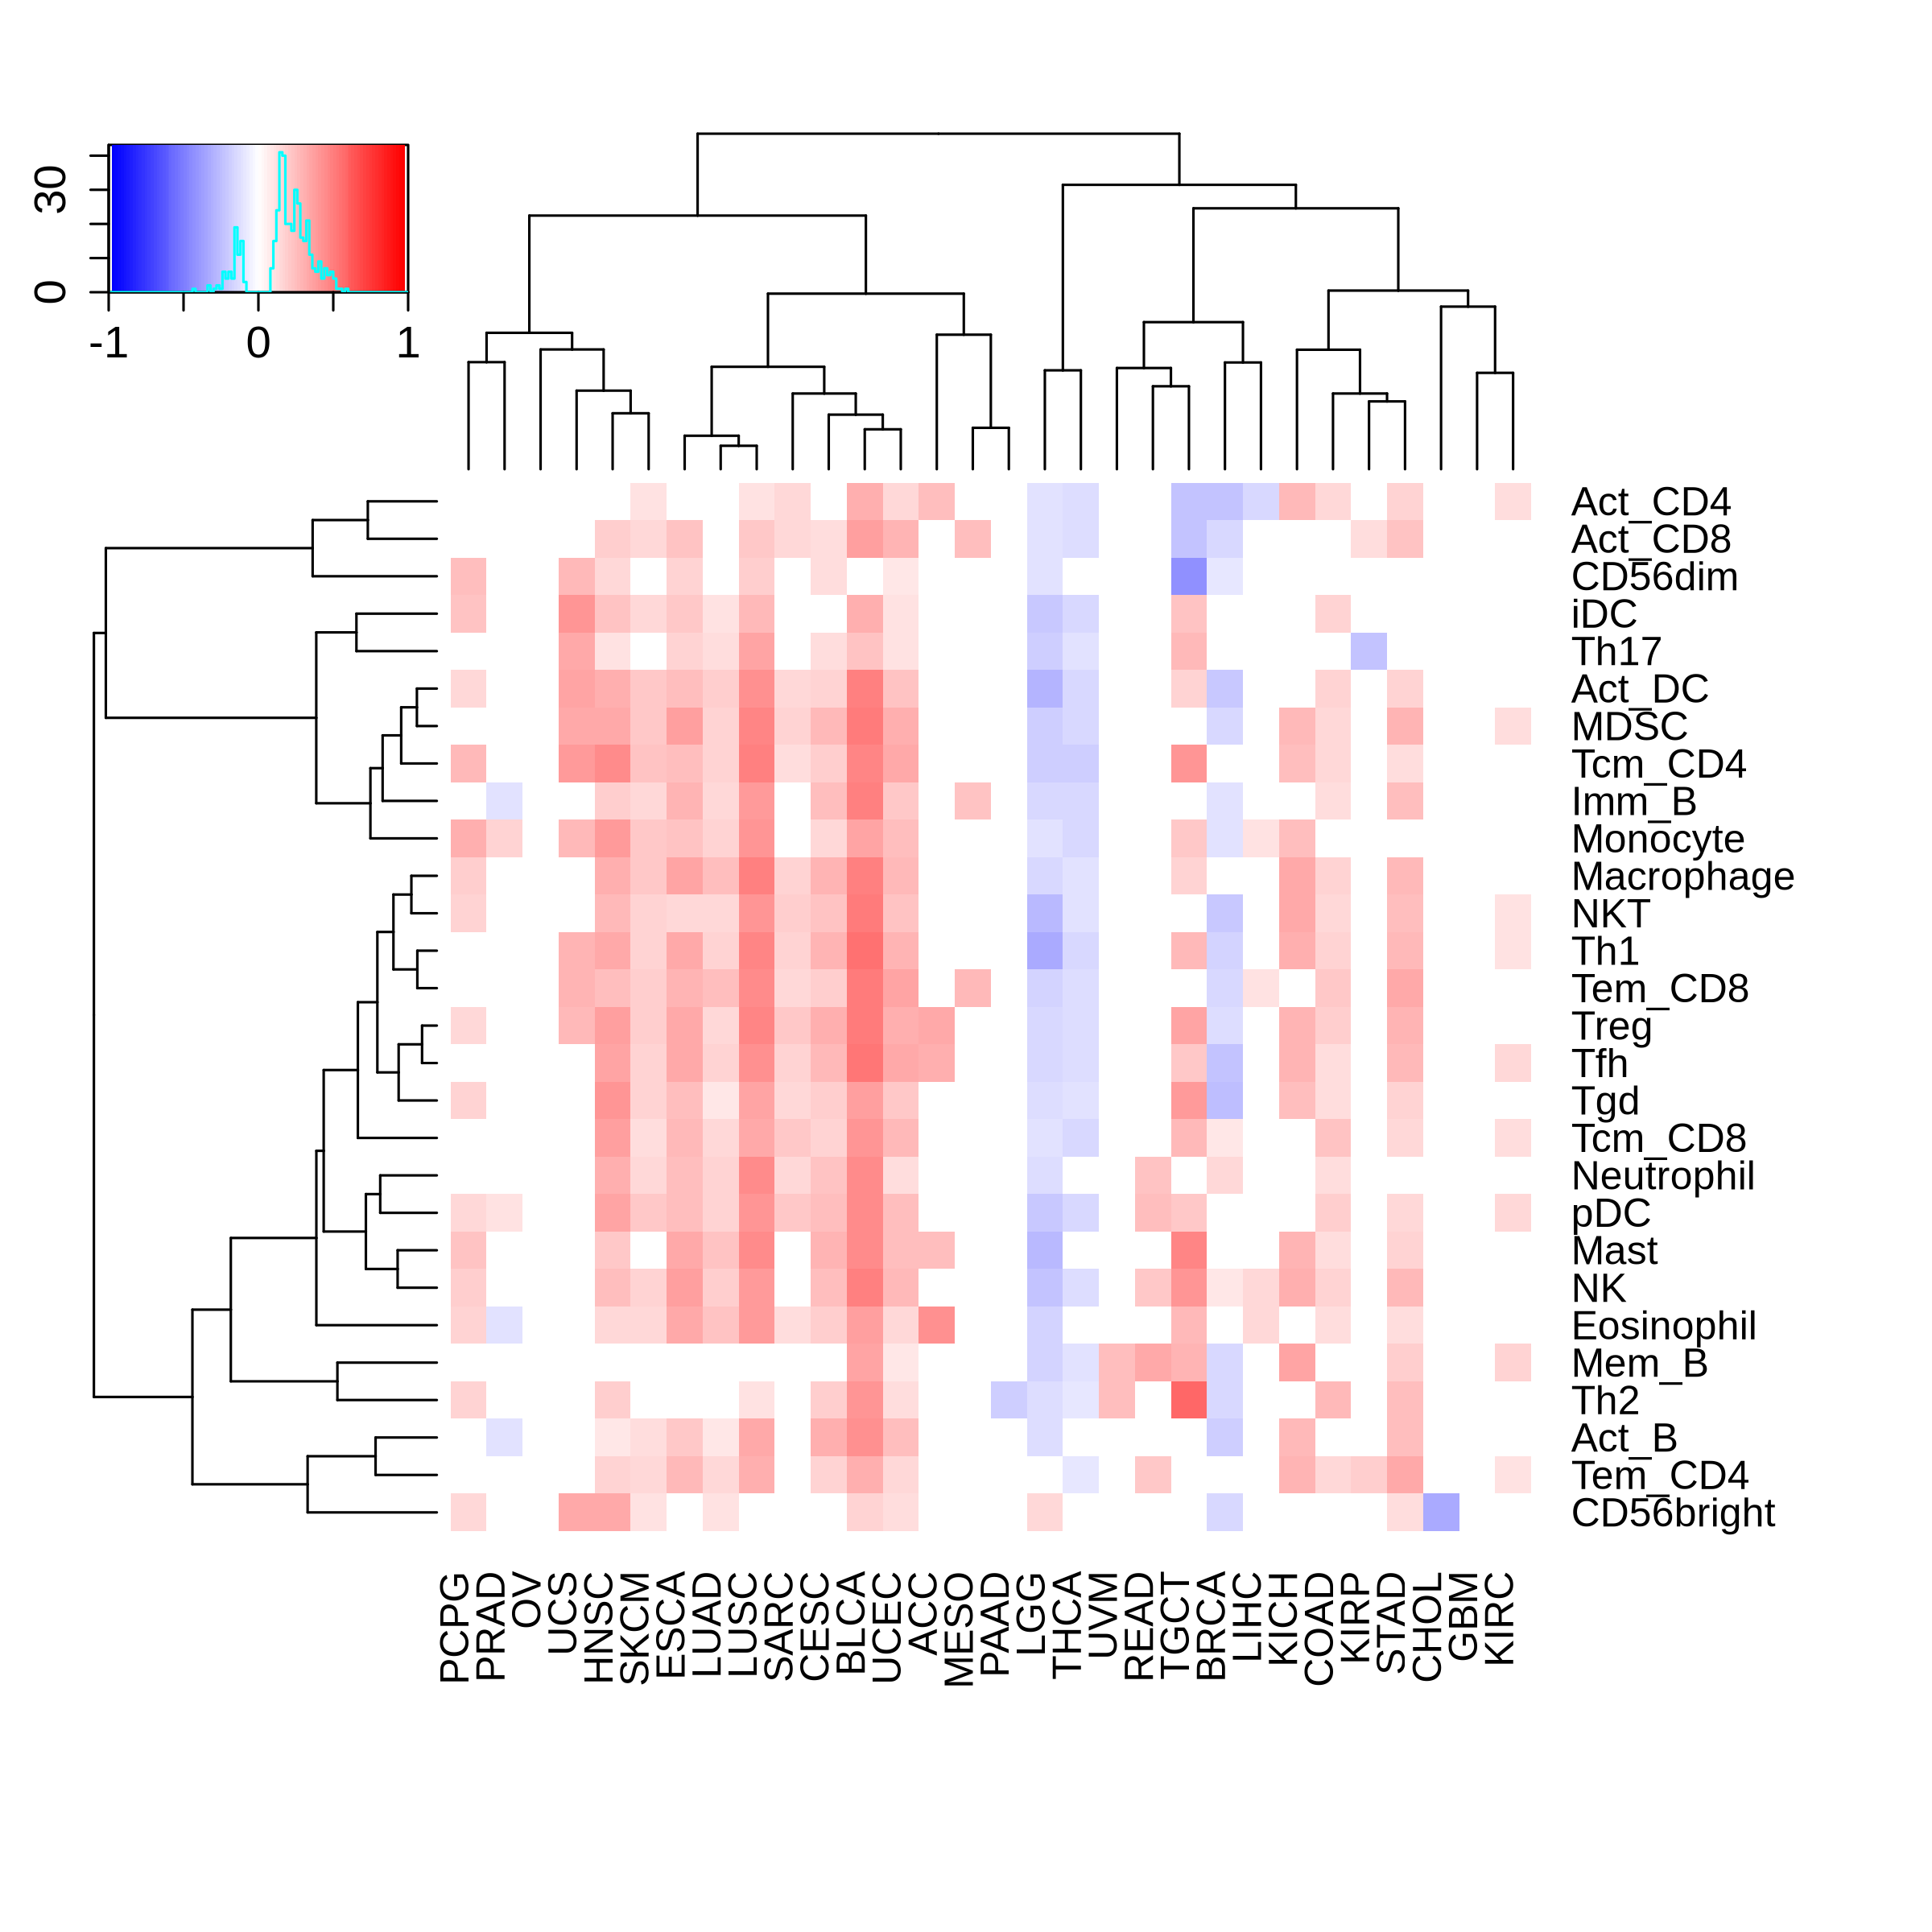
Correlation between the composition of TIL and gene expression, methylation and CNV |
| Expression | Copy number variation |
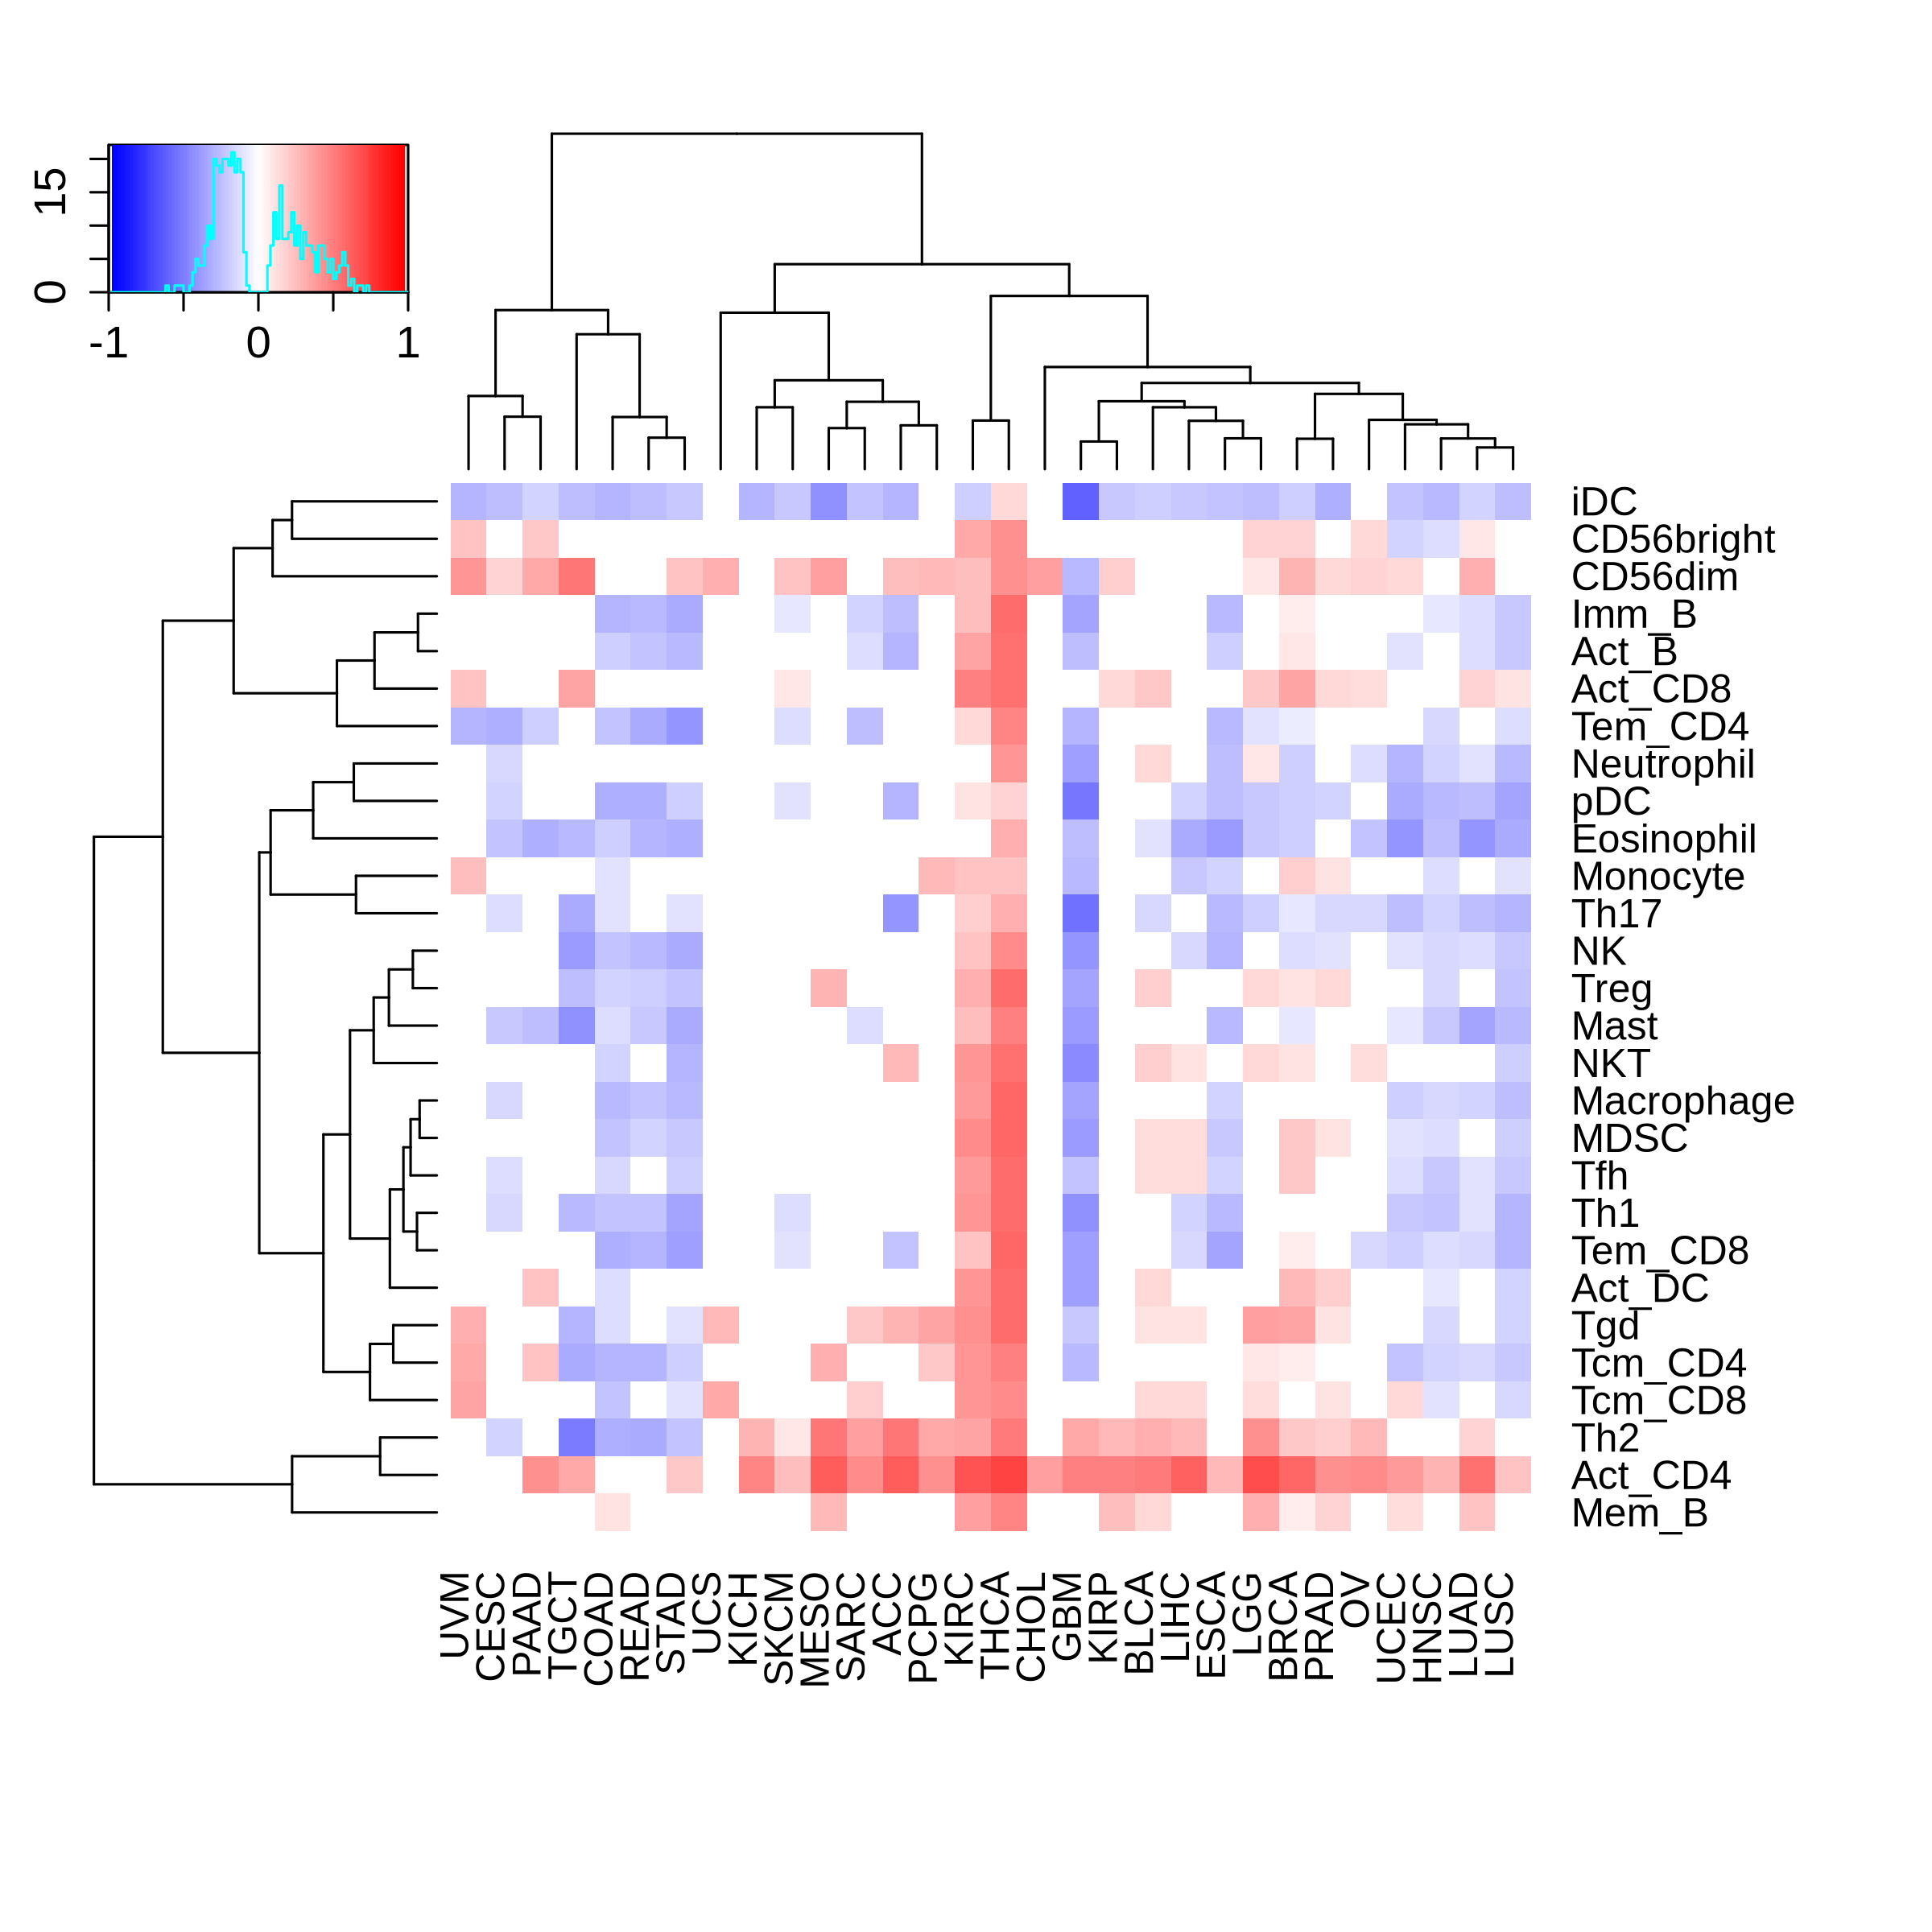 | 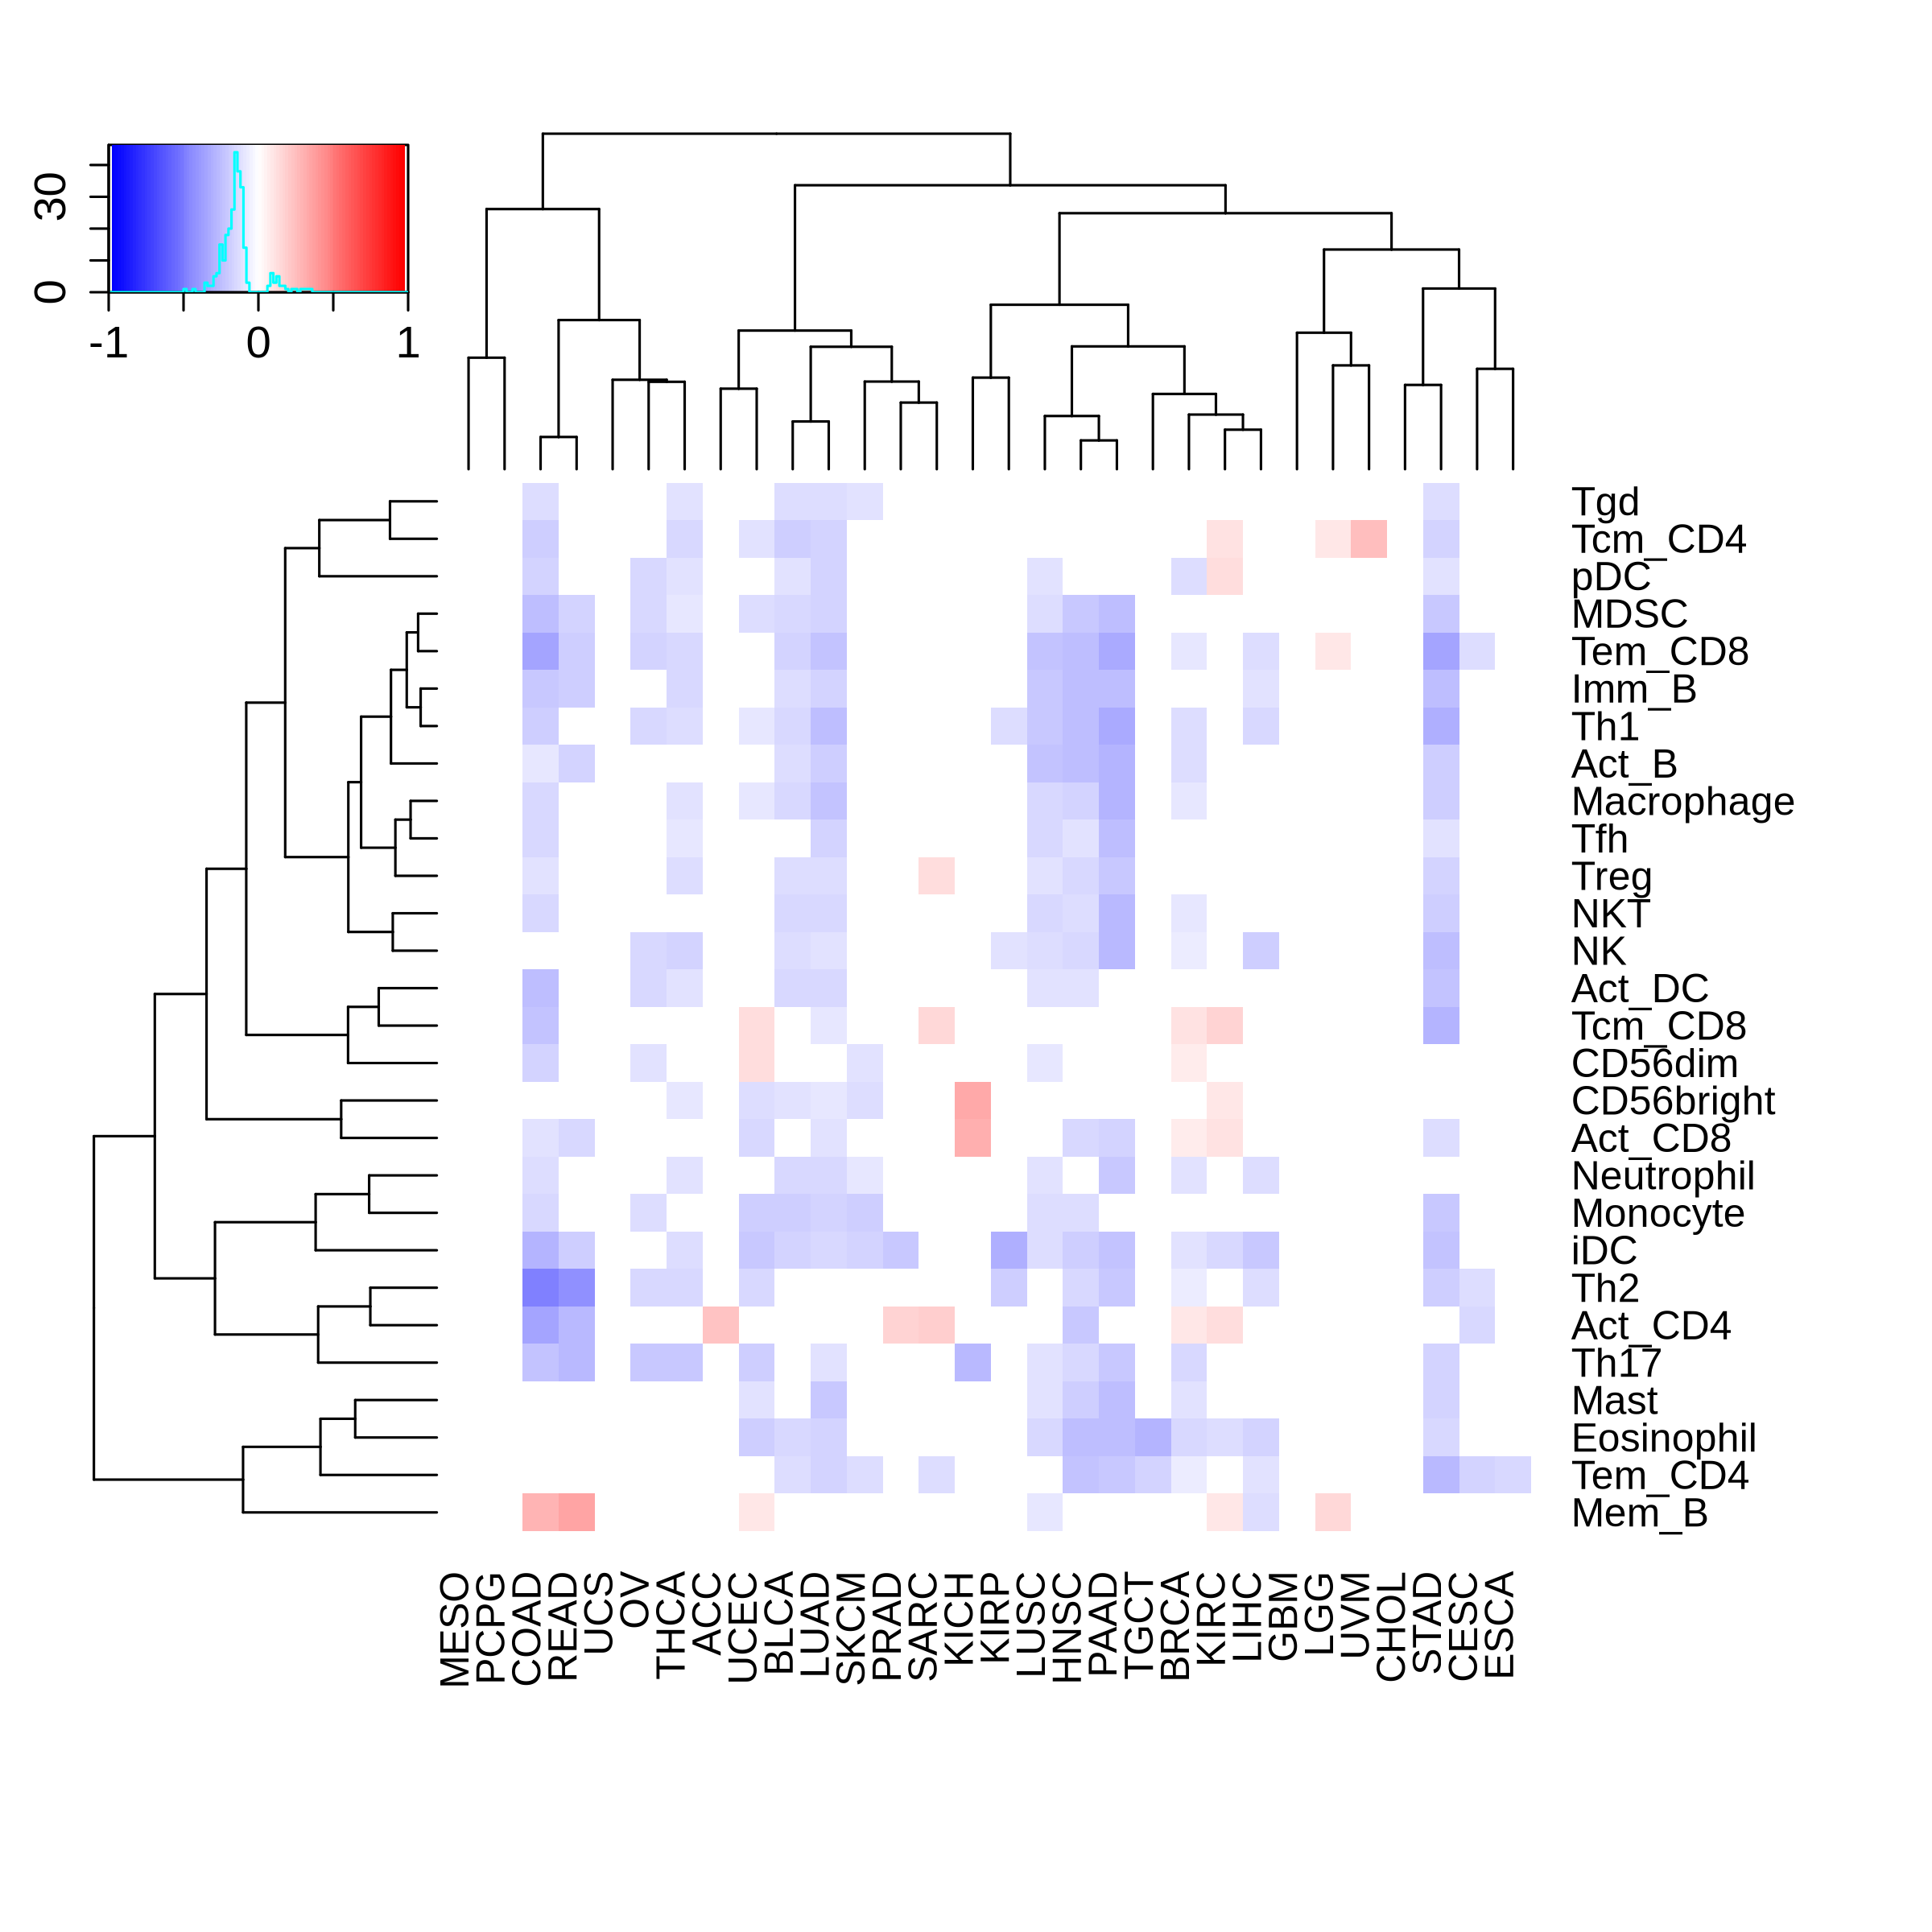 |
| Promoter methylation | Genebody methylation |
 | 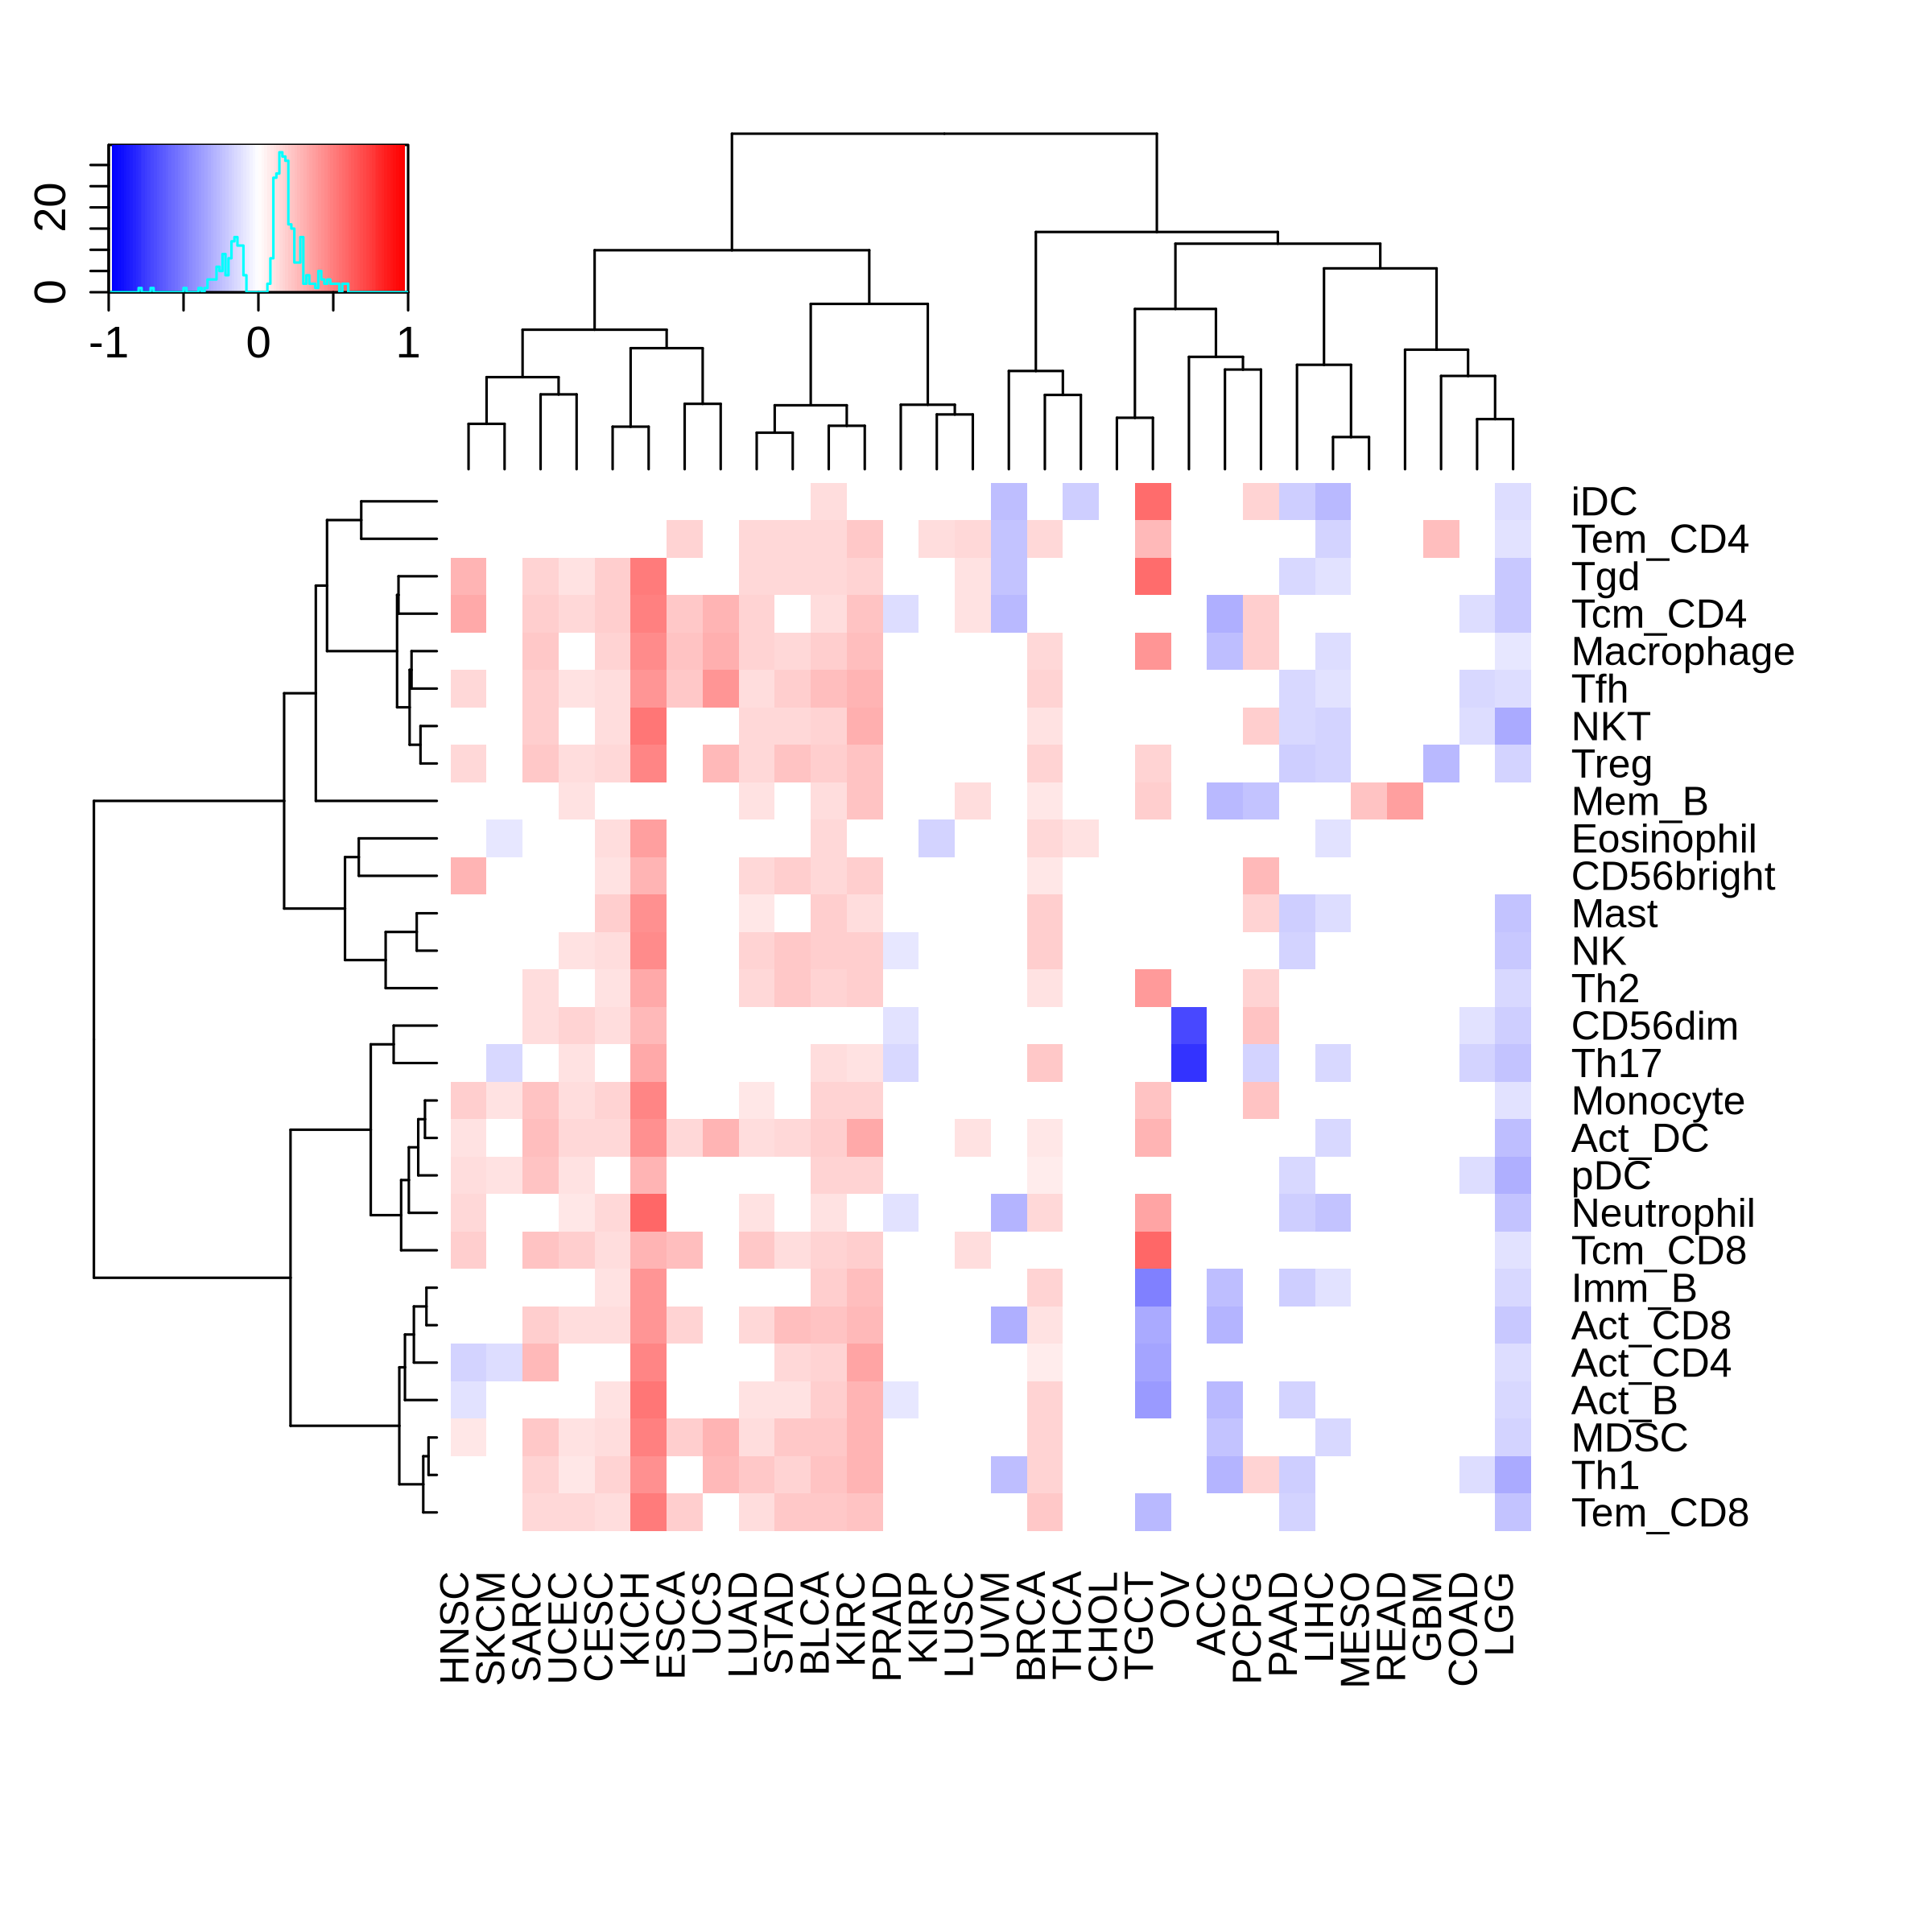 |
Top |
The association between MYBL2 expression and immune subtypes/status |
Top |
Drugs targeting MYBL2 and diseases related to MYBL2. |
| Drug-gene interaction | Disease-gene association |
No drugs targeting MYBL2. |  |
Top |
Survival analysis based on MYBL2 expression |
Top |
| Reference |
| [1] Steele CD, Abbasi A, Islam SMA, et al. Signatures of copy number alterations in human cancer. Nature. 2022 Jun;606(7916):984-991. doi: 10.1038/s41586-022-04738-6. Epub 2022 Jun 15. PMID: 35705804; PMCID: PMC9242861. [2] Beibei Ru, Ching Ngar Wong, Yin Tong, et al. TISIDB: an integrated repository portal for tumor–immune system interactions, Bioinformatics, Volume 35, Issue 20, October 2019, Pages 4200–4202, https://doi.org/10.1093/bioinformatics/btz210. [3] Zhongyang Liu, Jiale Liu, Xinyue Liu, et al. CTR–DB, an omnibus for patient-derived gene expression signatures correlated with cancer drug response, Nucleic Acids Research, Volume 50, Issue D1, 7 January 2022, Pages D1184–D1199, https://doi.org/10.1093/nar/gkab860. [4] Charoentong P, Finotello F, Angelova M, et al. Pan-cancer Immunogenomic Analyses Reveal Genotype-Immunophenotype Relationships and Predictors of Response to Checkpoint Blockade. Cell Rep. 2017 Jan 3;18(1):248–262. doi: 10.1016/j.celrep.2016.12.019. PMID: 28052254. [5] Thorsson V, Gibbs DL, Brown SD, et al. The Immune Landscape of Cancer. Immunity. 2018 Apr 17;48(4):812-830.e14. doi: 10.1016/j.immuni.2018.03.023. Epub 2018 Apr 5. Erratum in: Immunity. 2019 Aug 20;51(2):411-412. doi: 10.1016/j.immuni.2019.08.004. PMID: 29628290; PMCID: PMC5982584. [6] Zapata L, Caravagna G, Williams MJ, et al. Immune selection determines tumor antigenicity and influences response to checkpoint inhibitors. Nat Genet. 2023 Mar;55(3):451-460. doi: 10.1038/s41588-023-01313-1. Epub 2023 Mar 9. PMID: 36894710; PMCID: PMC10011129. [7] Cortes-Ciriano I, Lee S, Park WY, et al. A molecular portrait of microsatellite instability across multiple cancers. Nat Commun. 2017 Jun 6;8:15180. doi: 10.1038/ncomms15180. PMID: 28585546; PMCID: PMC5467167. [8] Cannon M, Stevenson J, Stahl K, et al. DGIdb 5.0: rebuilding the drug-gene interaction database for precision medicine and drug discovery platforms. Nucleic Acids Res. 2024 Jan 5;52(D1):D1227-D1235. doi: 10.1093/nar/gkad1040. PMID: 37953380; PMCID: PMC10767982. [9] Grissa D, Junge A, Oprea TI, Jensen LJ. Diseases 2.0: a weekly updated database of disease-gene associations from text mining and data integration. Database (Oxford). 2022 Mar 28;2022:baac019. doi: 10.1093/database/baac019. PMID: 35348648; PMCID: PMC9216524. |

Copyright 2024-Present -The University of Texas Health Science Center at Houston |