|
|
||||||||
|
||||||||

Gene summary for IL7 |
| Gene Symbol | IL7 | Gene ID | 3574 |
| Gene name | interleukin 7 |
| Synonyms | IL-7 |
| Type of gene | protein_coding |
| UniProtAcc | P13232 |
| GO ID | GO term |
| GO:0006955 | immune response |
| GO:0043066 | negative regulation of apoptotic process |
| GO:0050896 | response to stimulus |
| GO:0019221 | cytokine-mediated signaling pathway |
| GO:0007267 | cell-cell signaling |
| GO:0009887 | animal organ morphogenesis |
| GO:0045453 | bone resorption |
| GO:0032722 | positive regulation of chemokine production |
| GO:0008284 | positive regulation of cell population proliferation |
| GO:0030890 | positive regulation of B cell proliferation |
| GO:0006959 | humoral immune response |
| GO:0045582 | positive regulation of T cell differentiation |
| GO:0001961 | positive regulation of cytokine-mediated signaling pathway |
| GO:0002360 | T cell lineage commitment |
| GO:0010468 | regulation of gene expression |
| GO:0010628 | positive regulation of gene expression |
| GO:0035265 | organ growth |
| GO:0042100 | B cell proliferation |
| GO:0045579 | positive regulation of B cell differentiation |
| GO:0046622 | positive regulation of organ growth |
| GO:0048873 | homeostasis of number of cells within a tissue |
| GO:0050730 | regulation of peptidyl-tyrosine phosphorylation |
| GO:0097191 | extrinsic apoptotic signaling pathway |
| GO:2001237 | negative regulation of extrinsic apoptotic signaling pathway |
| GO:2001240 | negative regulation of extrinsic apoptotic signaling pathway in absence of ligand |
| GO:0007165 | signal transduction |
Top |
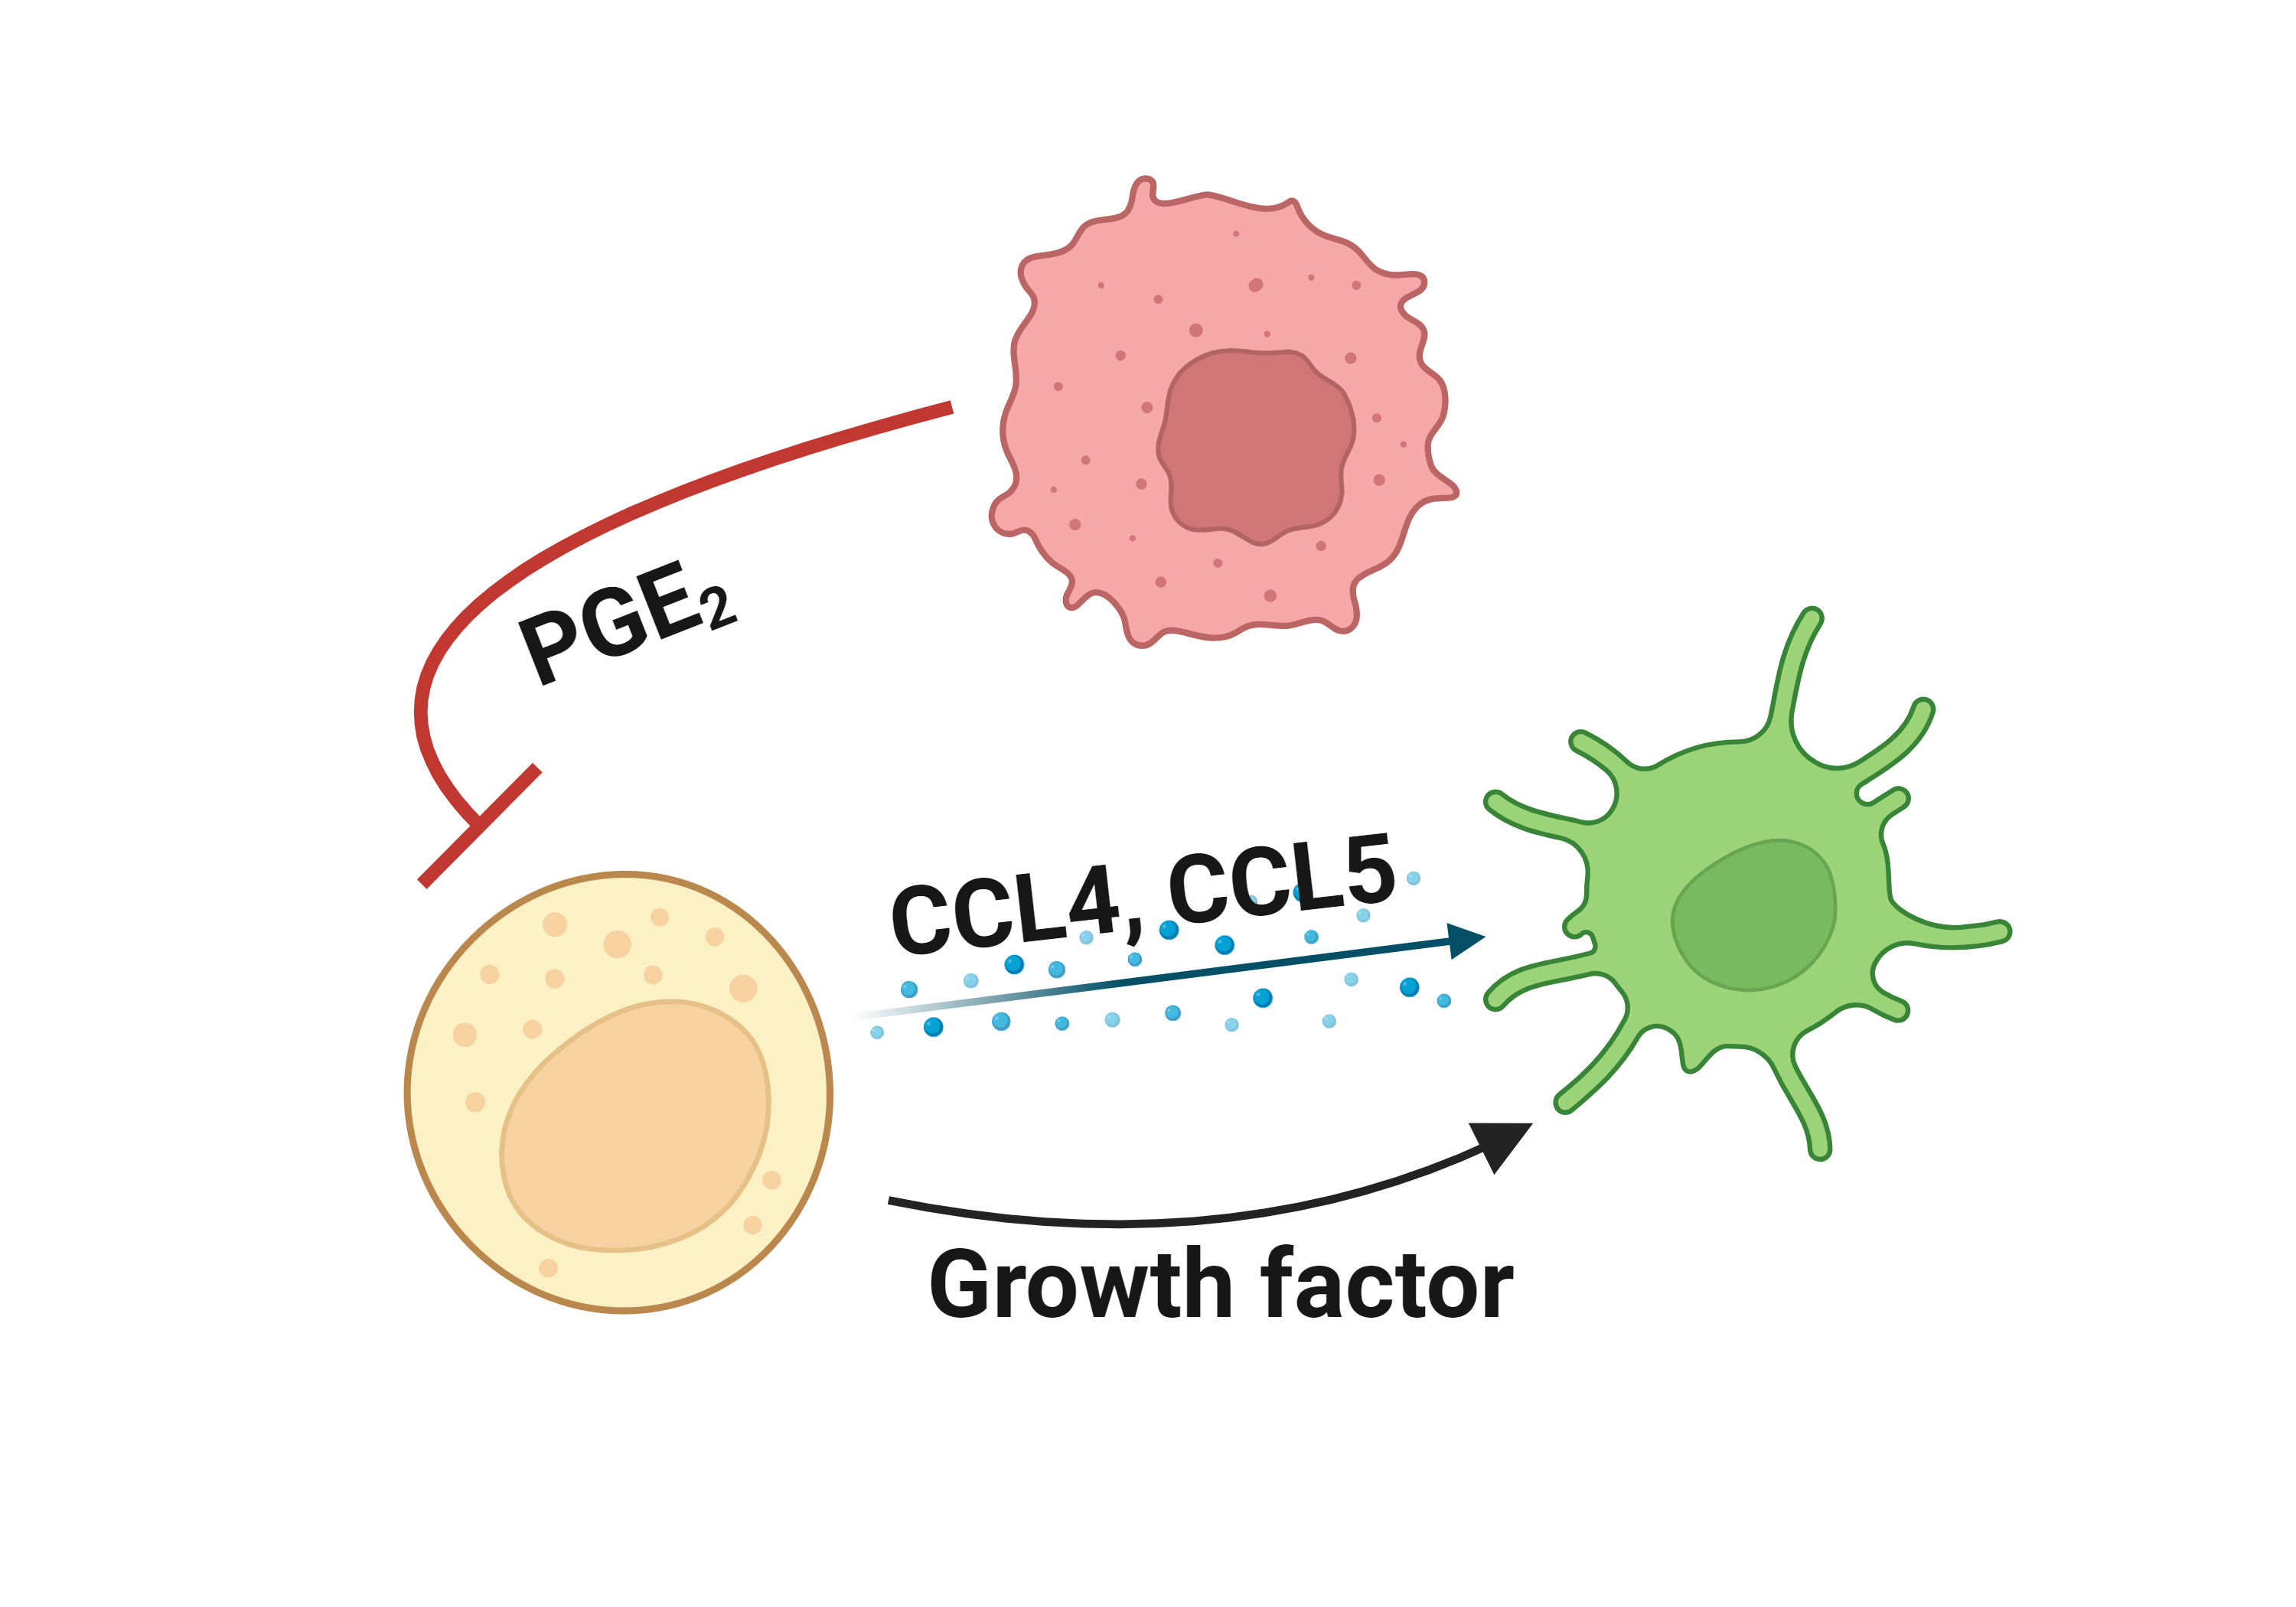
Literatures describing the association of IL7 and immune escape mechanisms |
Top |
Comparison of the IL7 expression level between tumor and normal groups |
Top |
Comparison of the IL7 methylation level between tumor and normal groups |
No significant differences were found in IL7 methylation in promoter region.
No significant differences were found in IL7 methylation in genebody region.
Top |
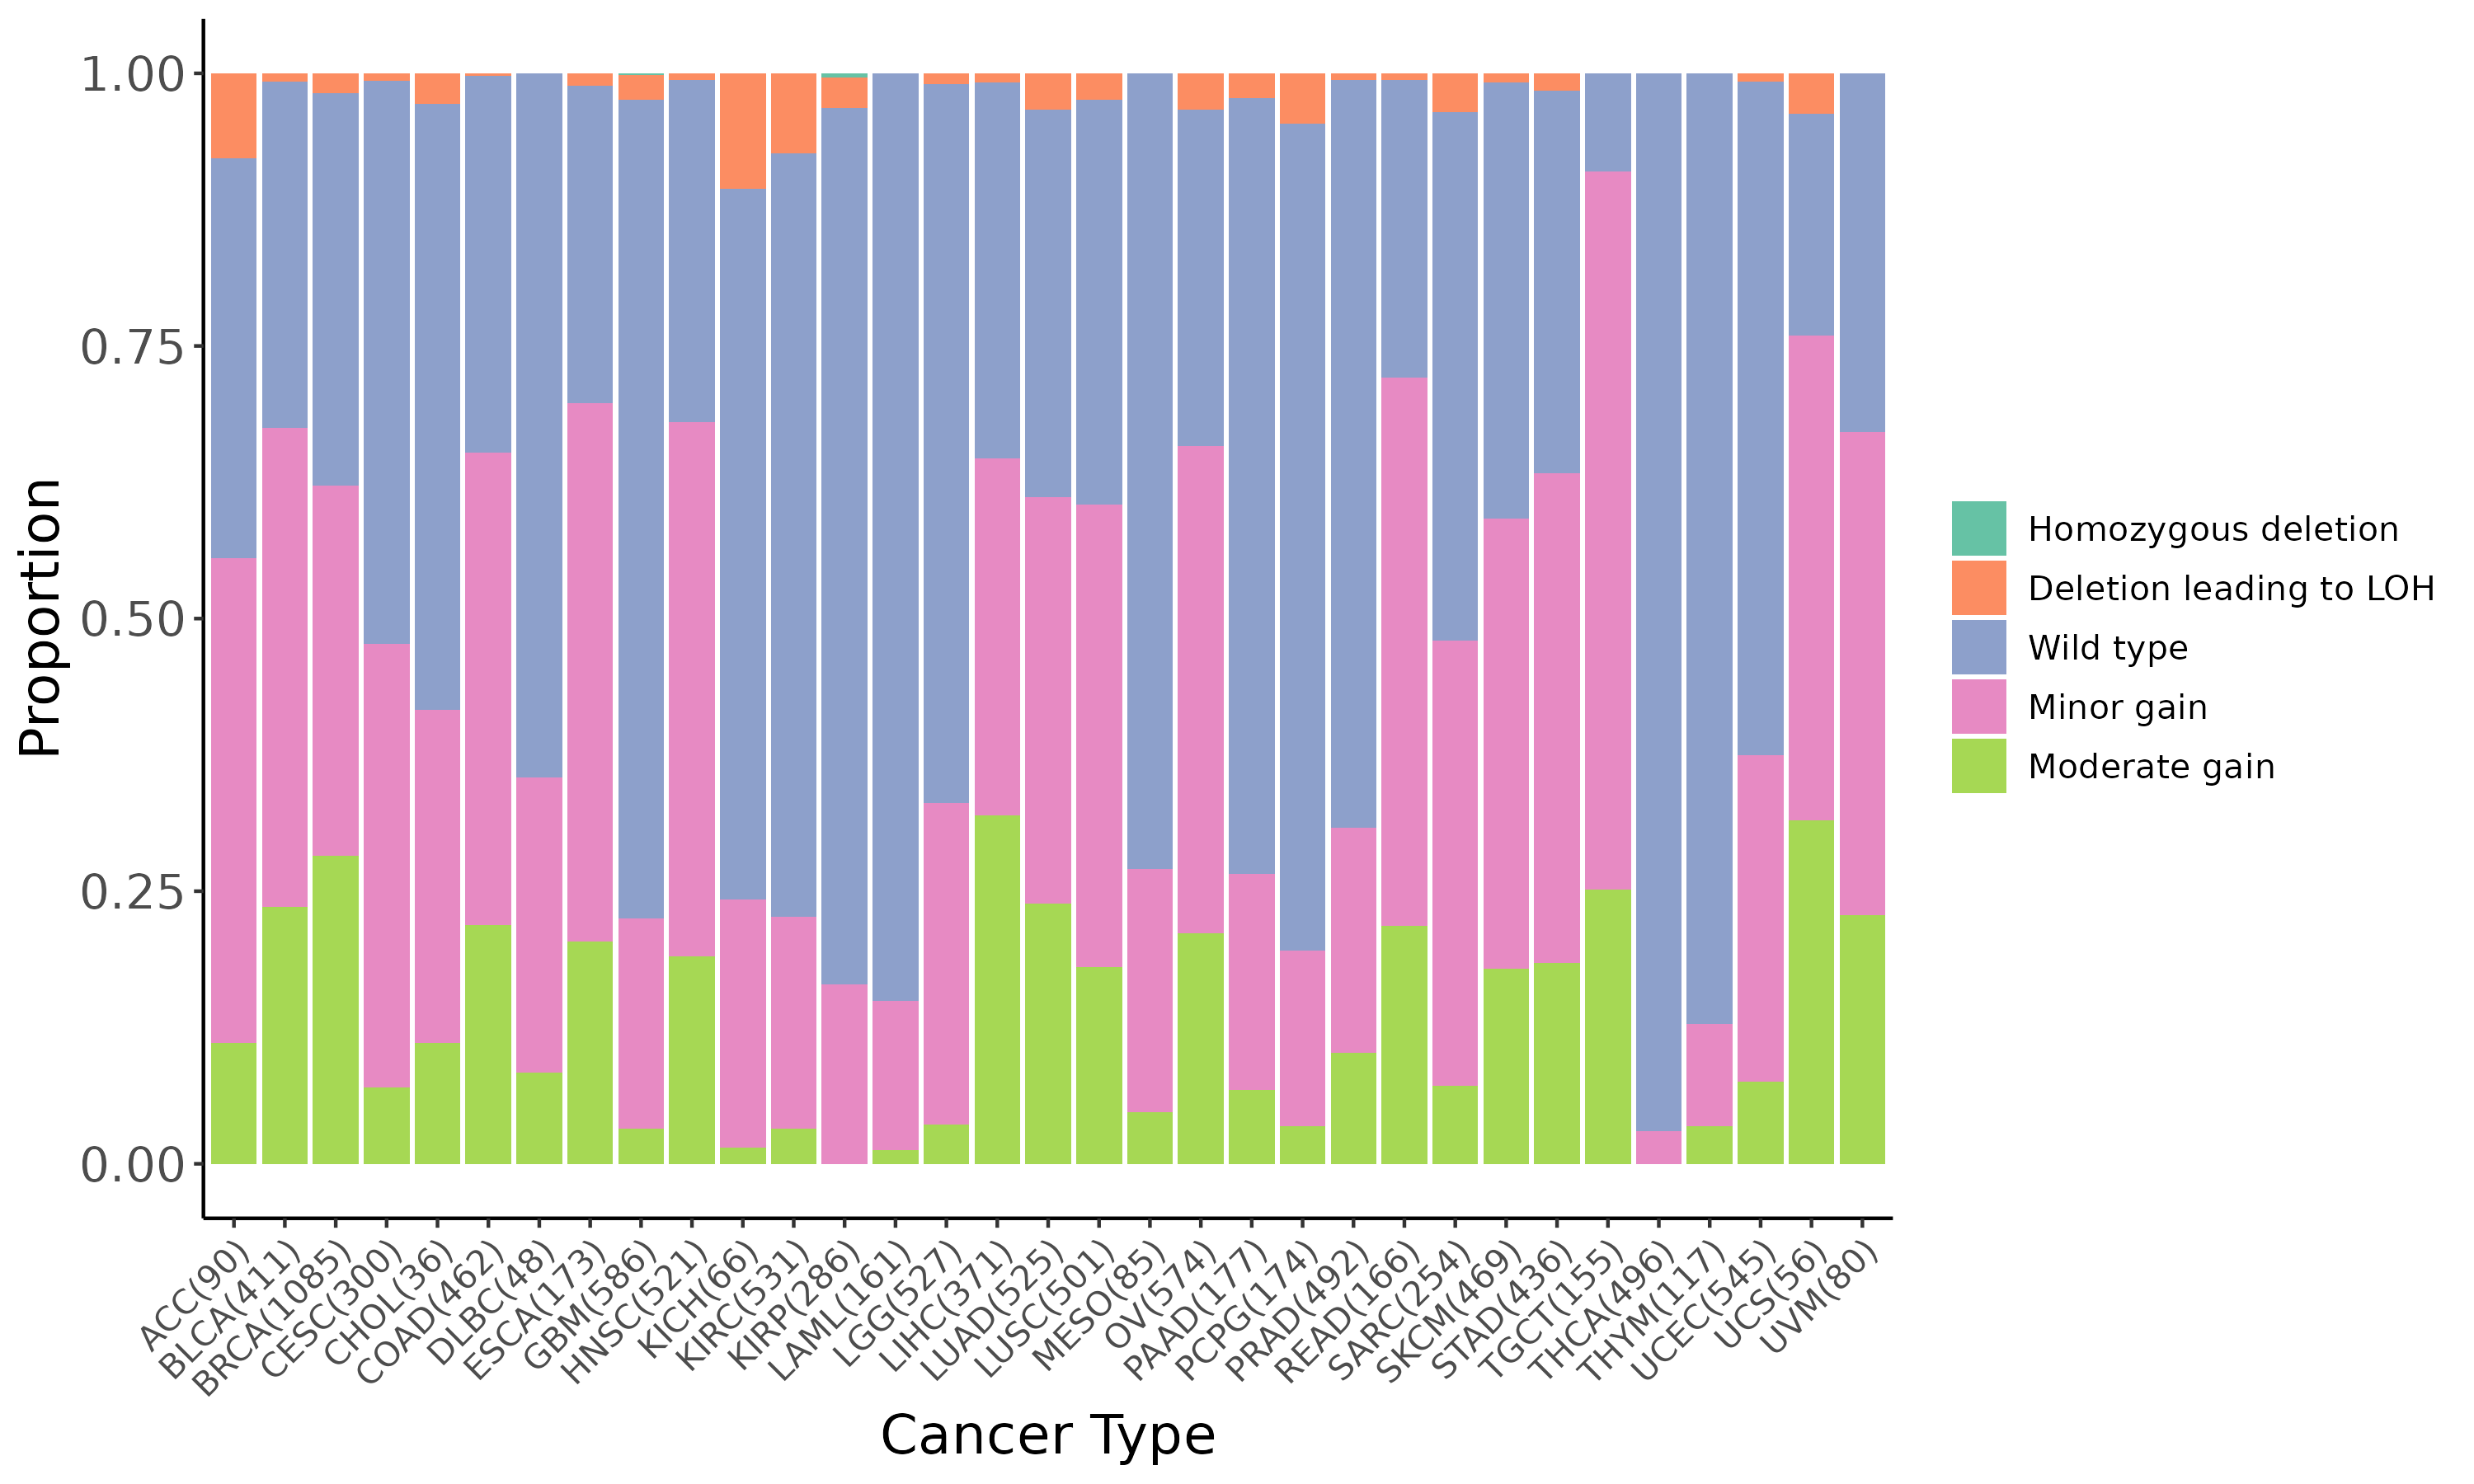
Summary of the copy number in TCGA tumor samples |
 |
Top |
DEGs and the enrichment analysis between the mutated and wild type groups |
| Gene ID | Symbol | Log2 Fold Change | P-value | Adjusted P-value |
|---|---|---|---|---|
| ENSG00000276916 | RP11-230F18.6 | 2.44e+00 | 1.88e-06 | 3.66e-04 |
| ENSG00000213204 | RP3-382I10.7 | 2.60e+00 | 1.90e-06 | 3.69e-04 |
| ENSG00000254463 | RP11-484D2.3 | 3.55e+00 | 1.91e-06 | 3.69e-04 |
| ENSG00000280916 | FOXCUT | -4.82e+00 | 1.93e-06 | 3.70e-04 |
| ENSG00000261546 | CTD-2555A7.3 | 2.91e+00 | 1.98e-06 | 3.79e-04 |
| ENSG00000203724 | C1orf53 | -1.78e+00 | 2.13e-06 | 4.05e-04 |
| ENSG00000231831 | MTHFD1P1 | 2.78e+00 | 2.22e-06 | 4.19e-04 |
| ENSG00000287945 | NA | 4.60e+00 | 2.21e-06 | 4.19e-04 |
| ENSG00000177989 | ODF3B | -2.80e+00 | 2.26e-06 | 4.24e-04 |
| ENSG00000219395 | HSPA8P15 | 2.37e+00 | 2.29e-06 | 4.28e-04 |
| ENSG00000259314 | CTD-3065B20.3 | 2.68e+00 | 2.34e-06 | 4.36e-04 |
| ENSG00000100626 | GALNT16 | -3.51e+00 | 2.36e-06 | 4.37e-04 |
| ENSG00000244052 | RPL5P24 | 1.84e+00 | 2.38e-06 | 4.39e-04 |
| ENSG00000232648 | RP11-367N14.2 | 1.53e+00 | 2.48e-06 | 4.55e-04 |
| ENSG00000200090 | Y_RNA | 2.60e+00 | 2.52e-06 | 4.60e-04 |
| ENSG00000207445 | SNORD15B | 4.18e+00 | 2.56e-06 | 4.65e-04 |
| ENSG00000253915 | MAPRE1P1 | 3.79e+00 | 2.60e-06 | 4.71e-04 |
| ENSG00000232027 | RP11-275F13.3 | 3.02e+00 | 2.63e-06 | 4.75e-04 |
| ENSG00000223928 | RP11-183E9.2 | 6.26e+00 | 2.69e-06 | 4.79e-04 |
| ENSG00000228808 | HMGB3P4 | 3.45e+00 | 2.70e-06 | 4.79e-04 |
| Page: 1 2 ... 3 4 5 6 7 ... 165 166 |
Down-regulated KEGG pathways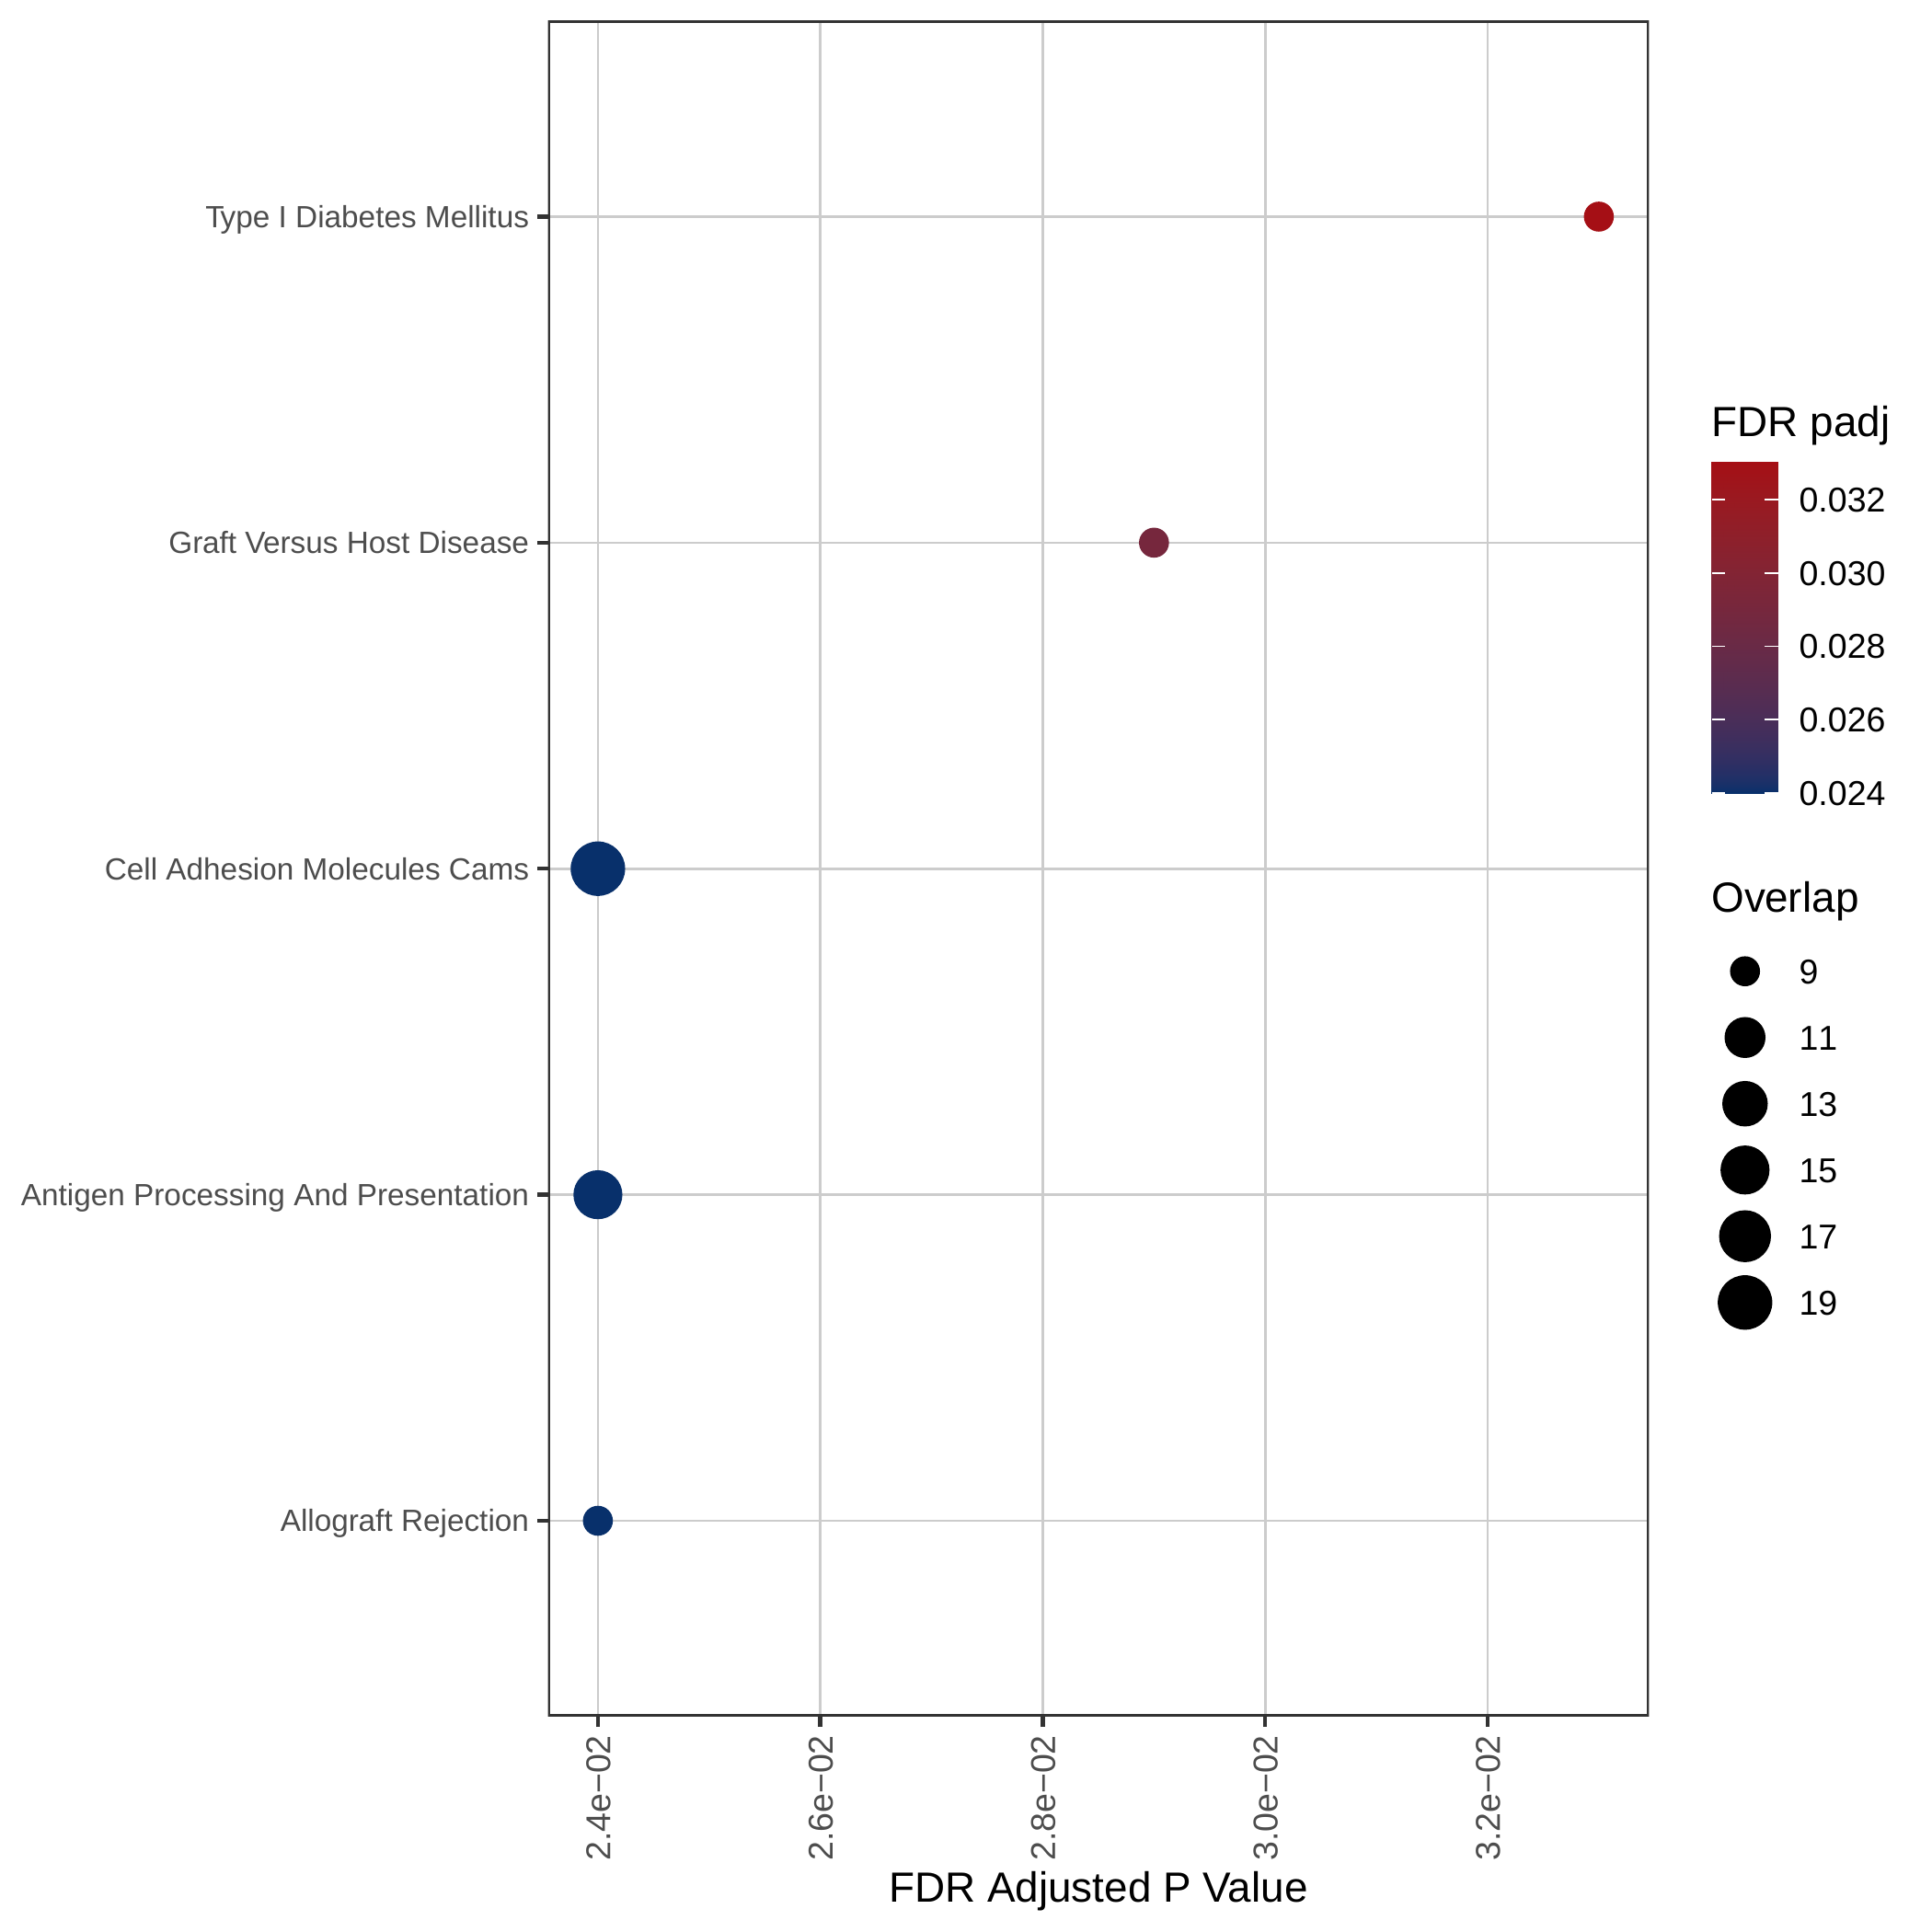 | Down-regulated GOBP pathways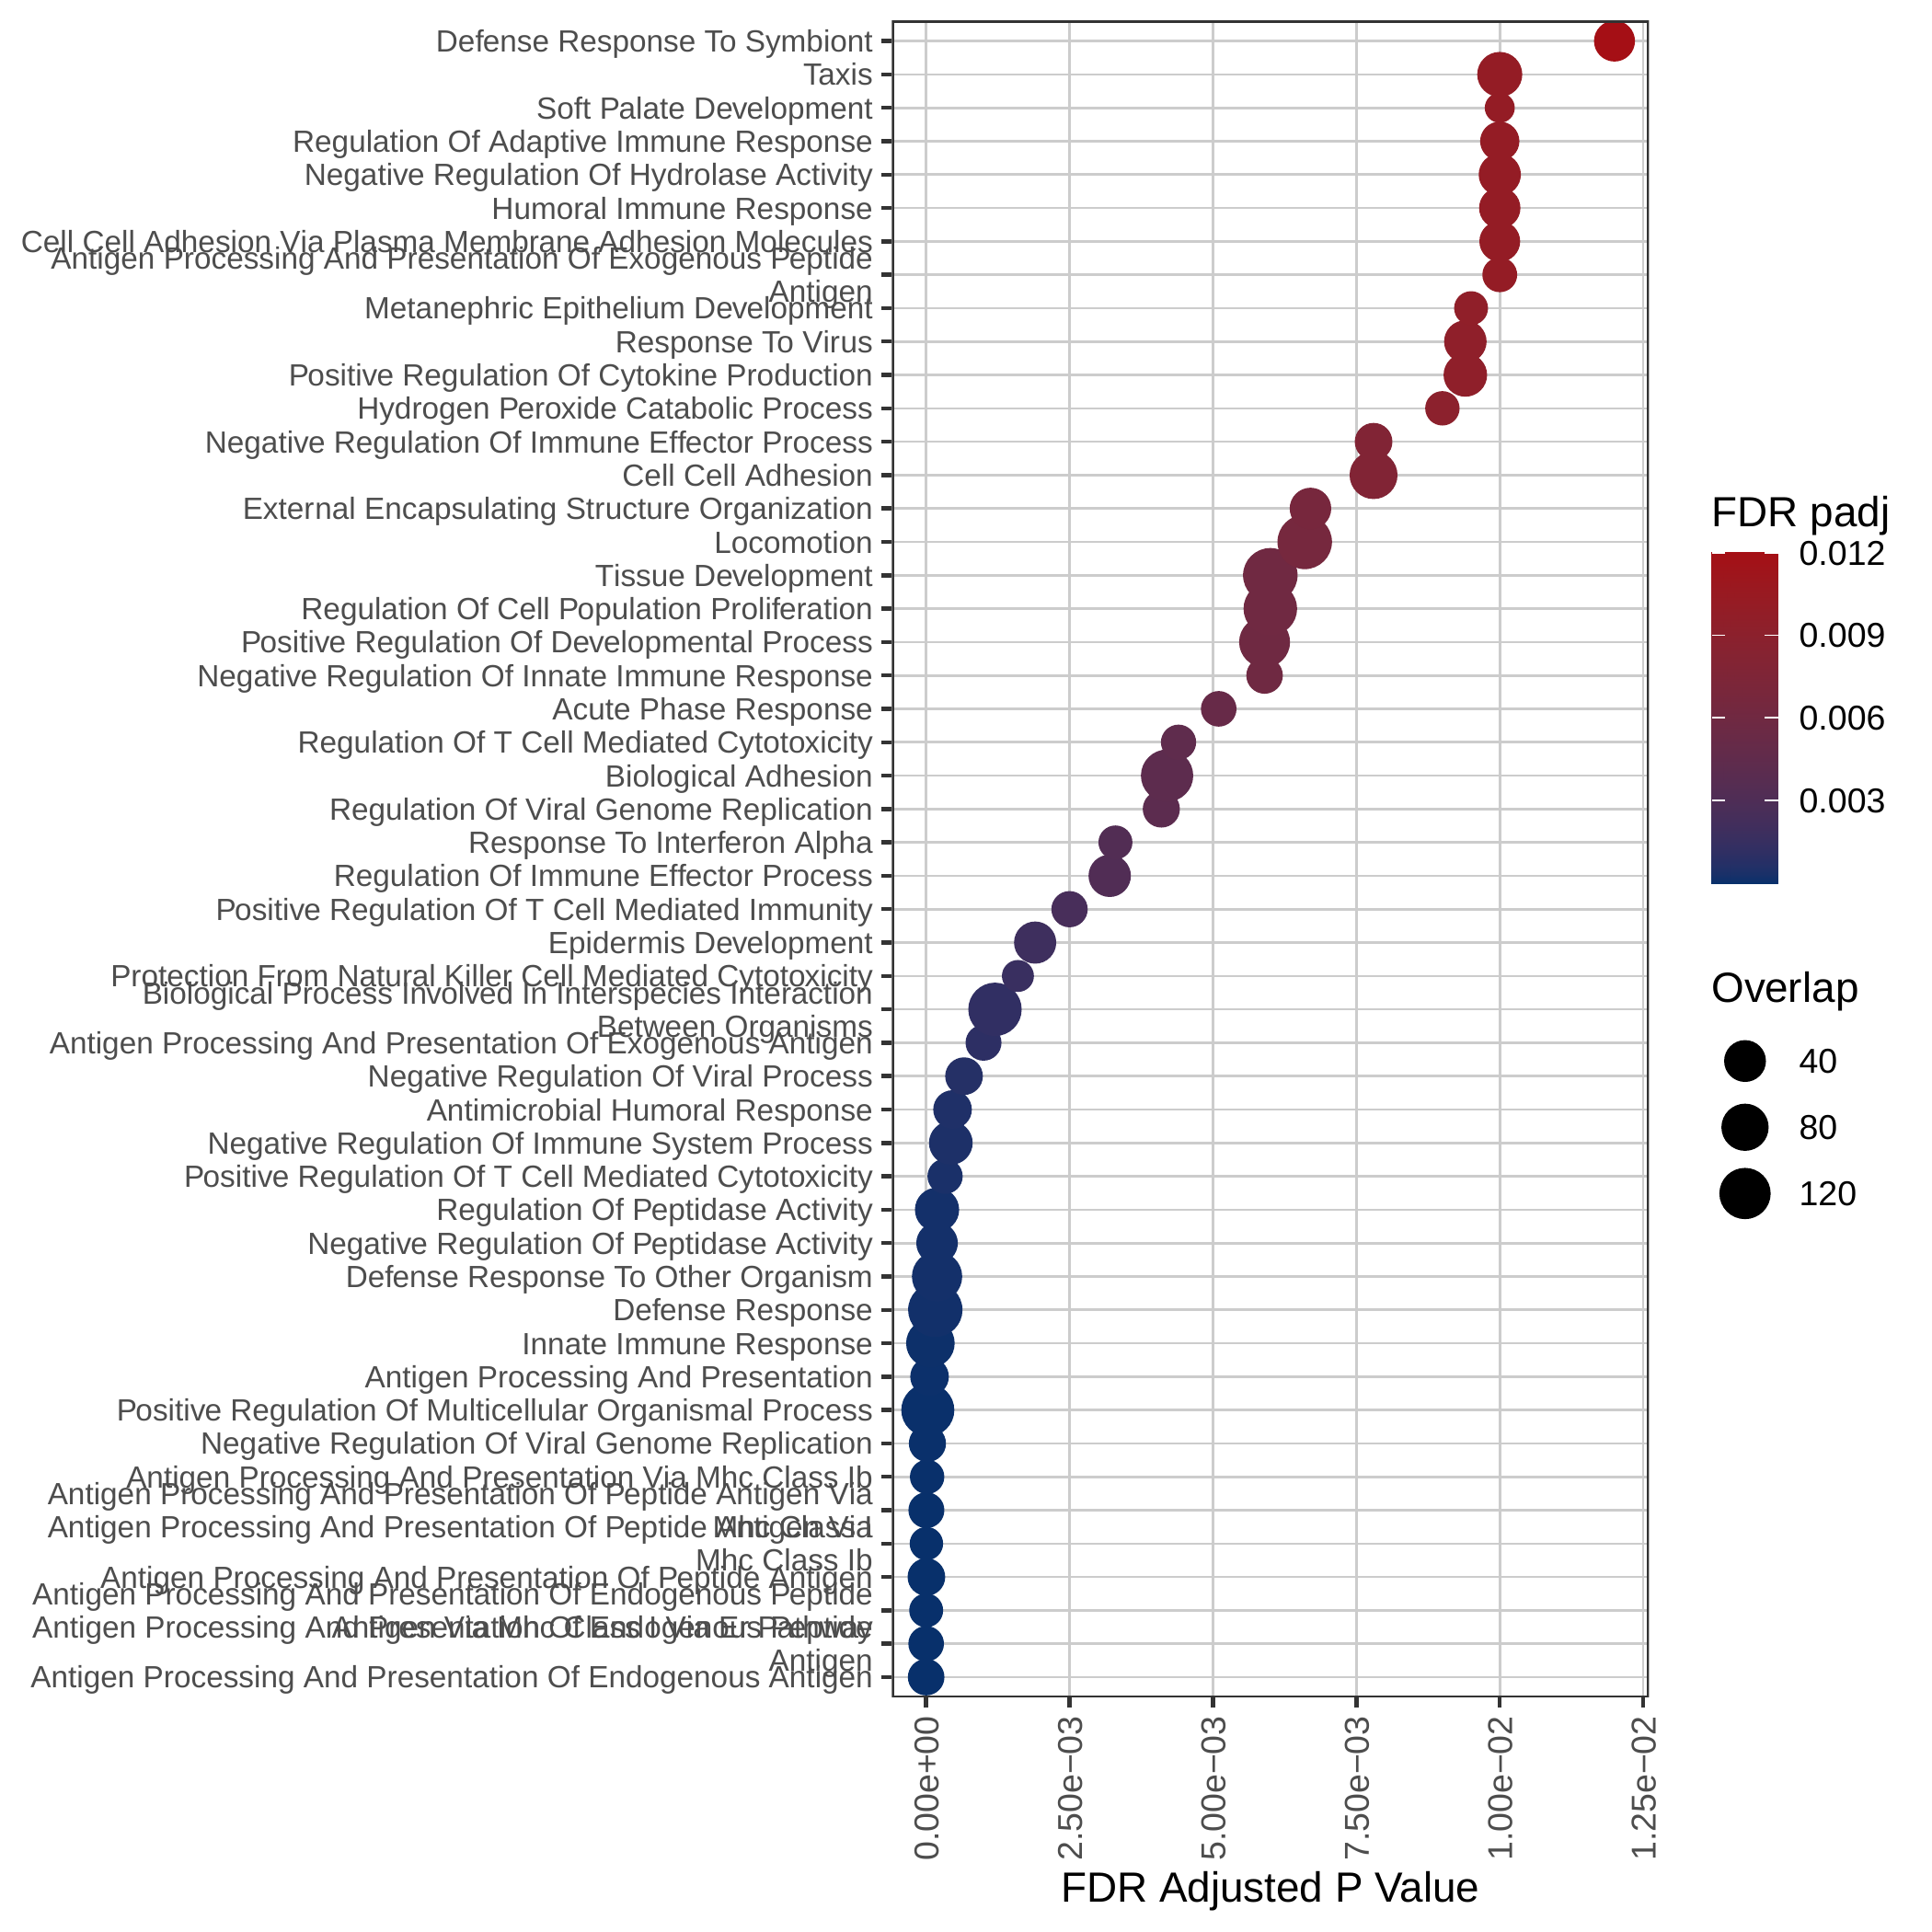 | Down-regulated Hallmark pathways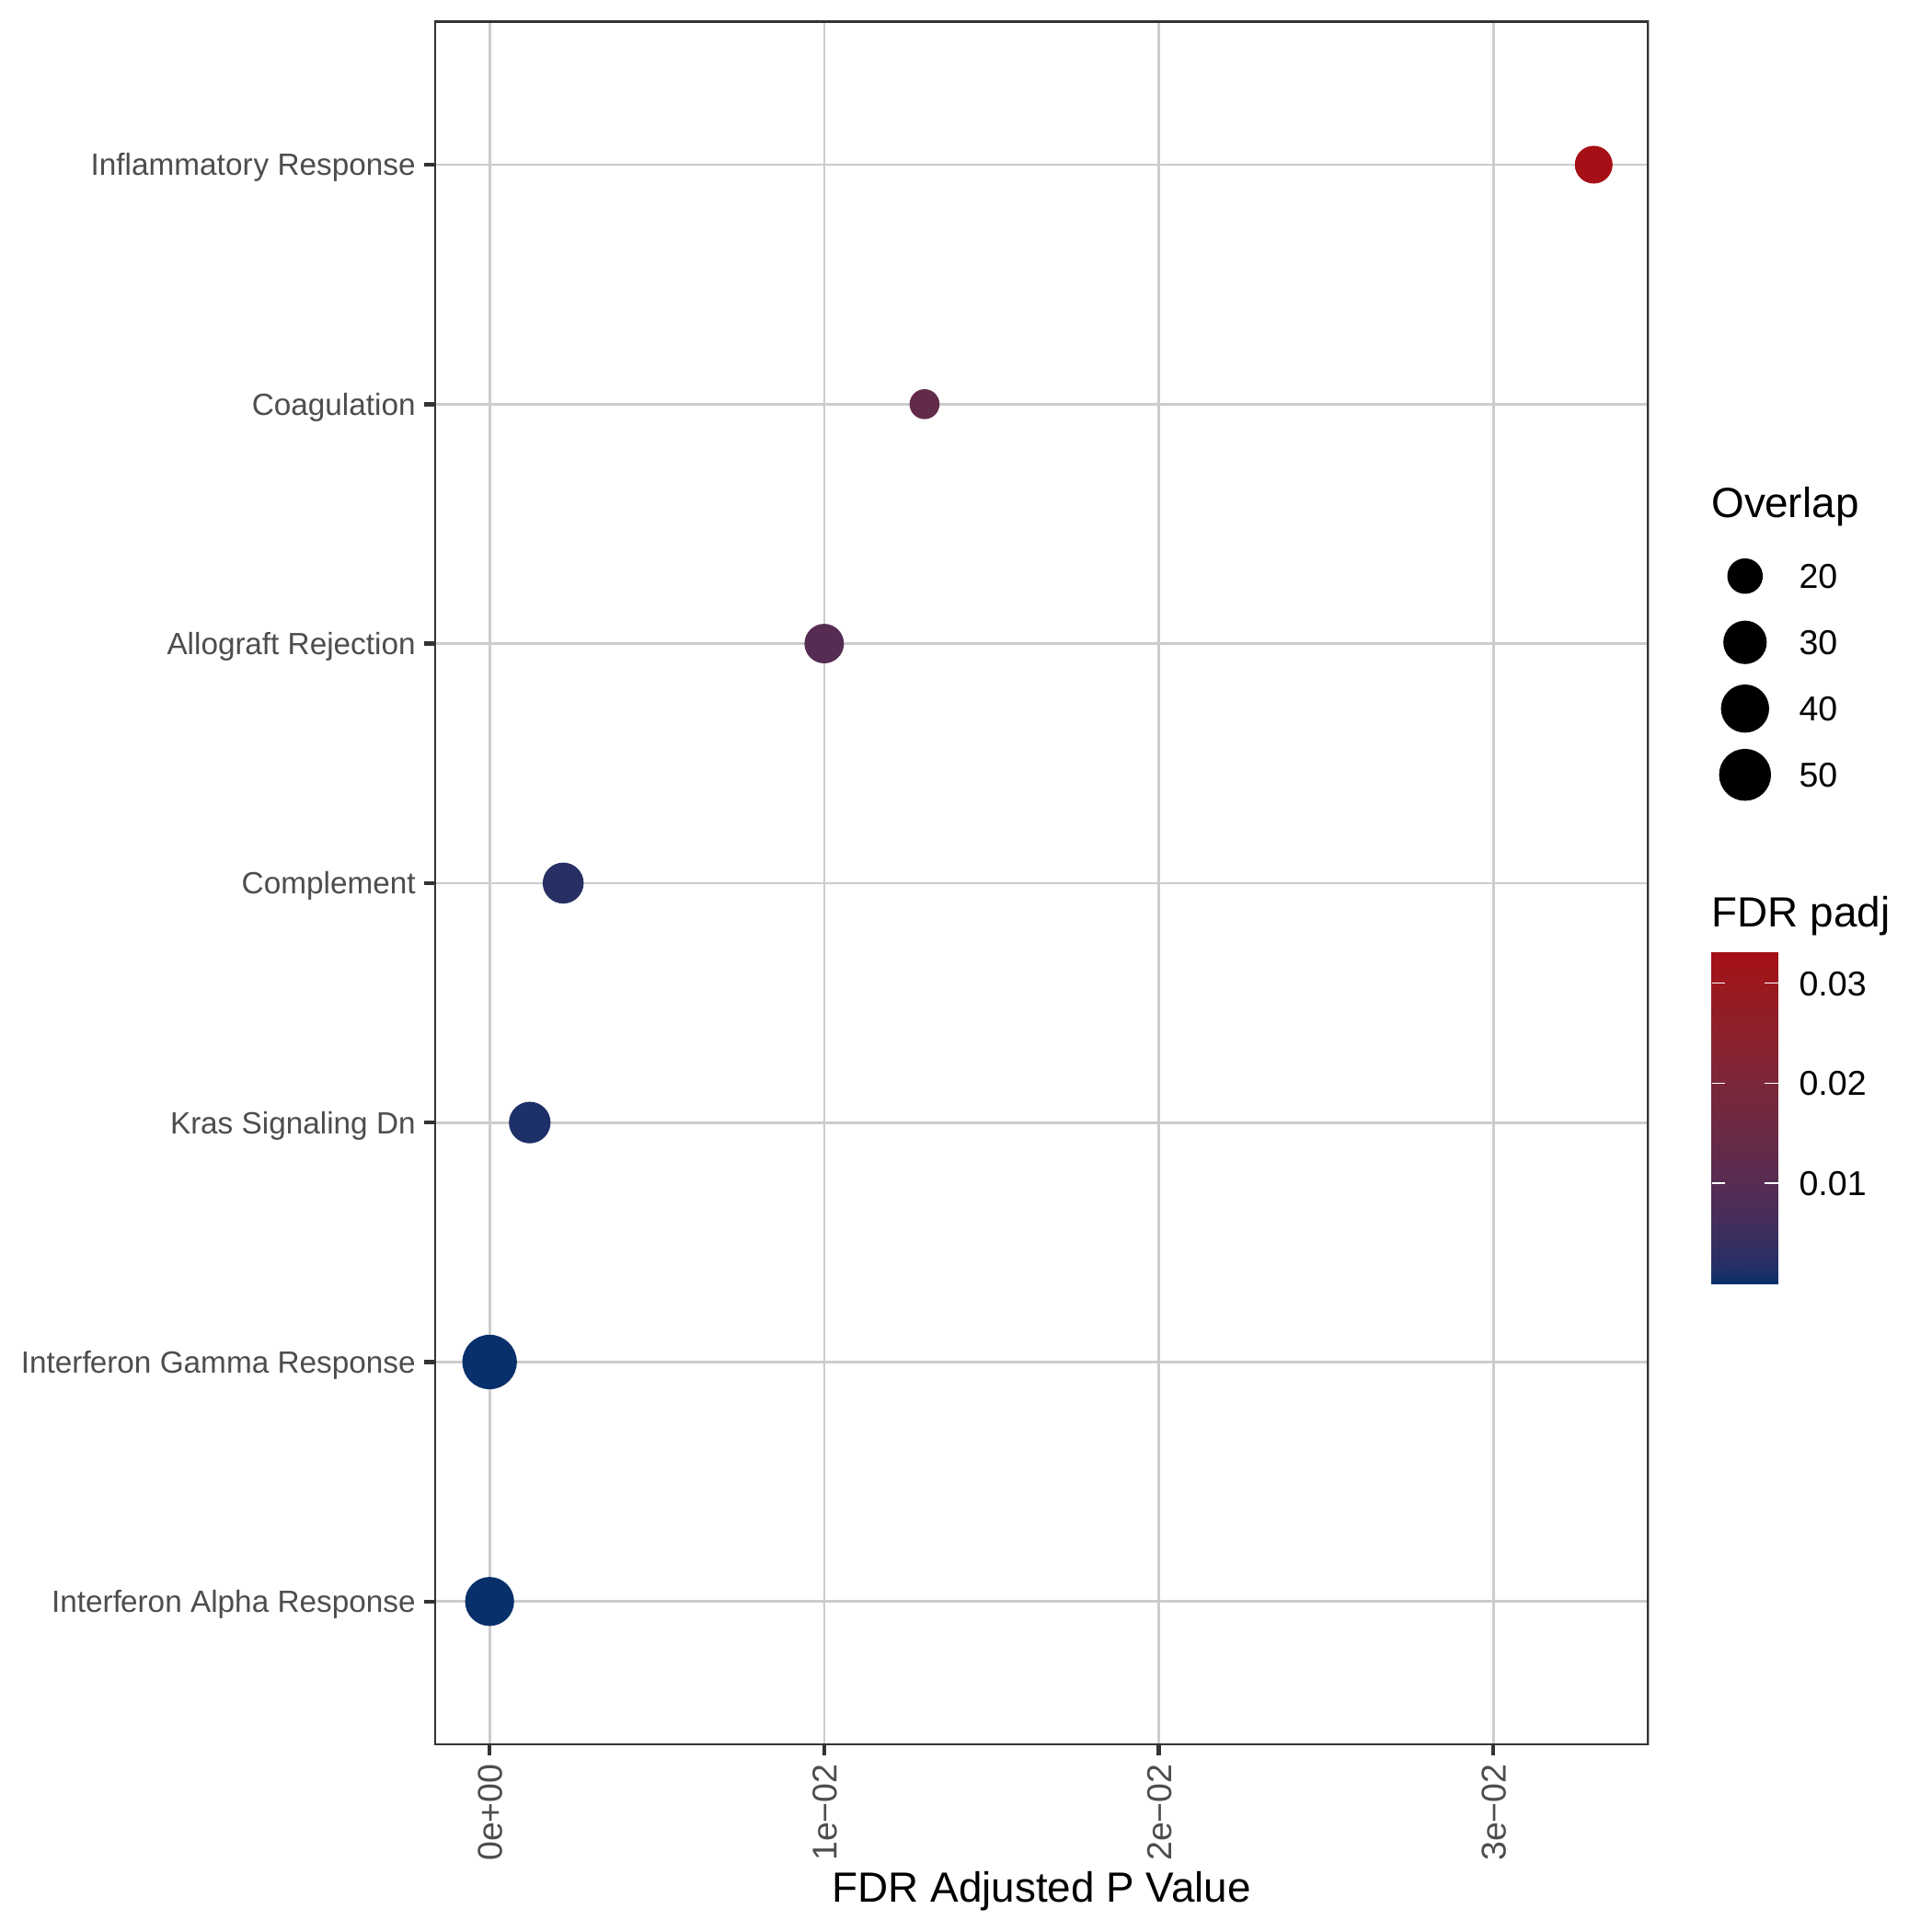 |
Gene expression and mutation differences between non-responders and responders after immunotherapy |
| Expression | Mutation |
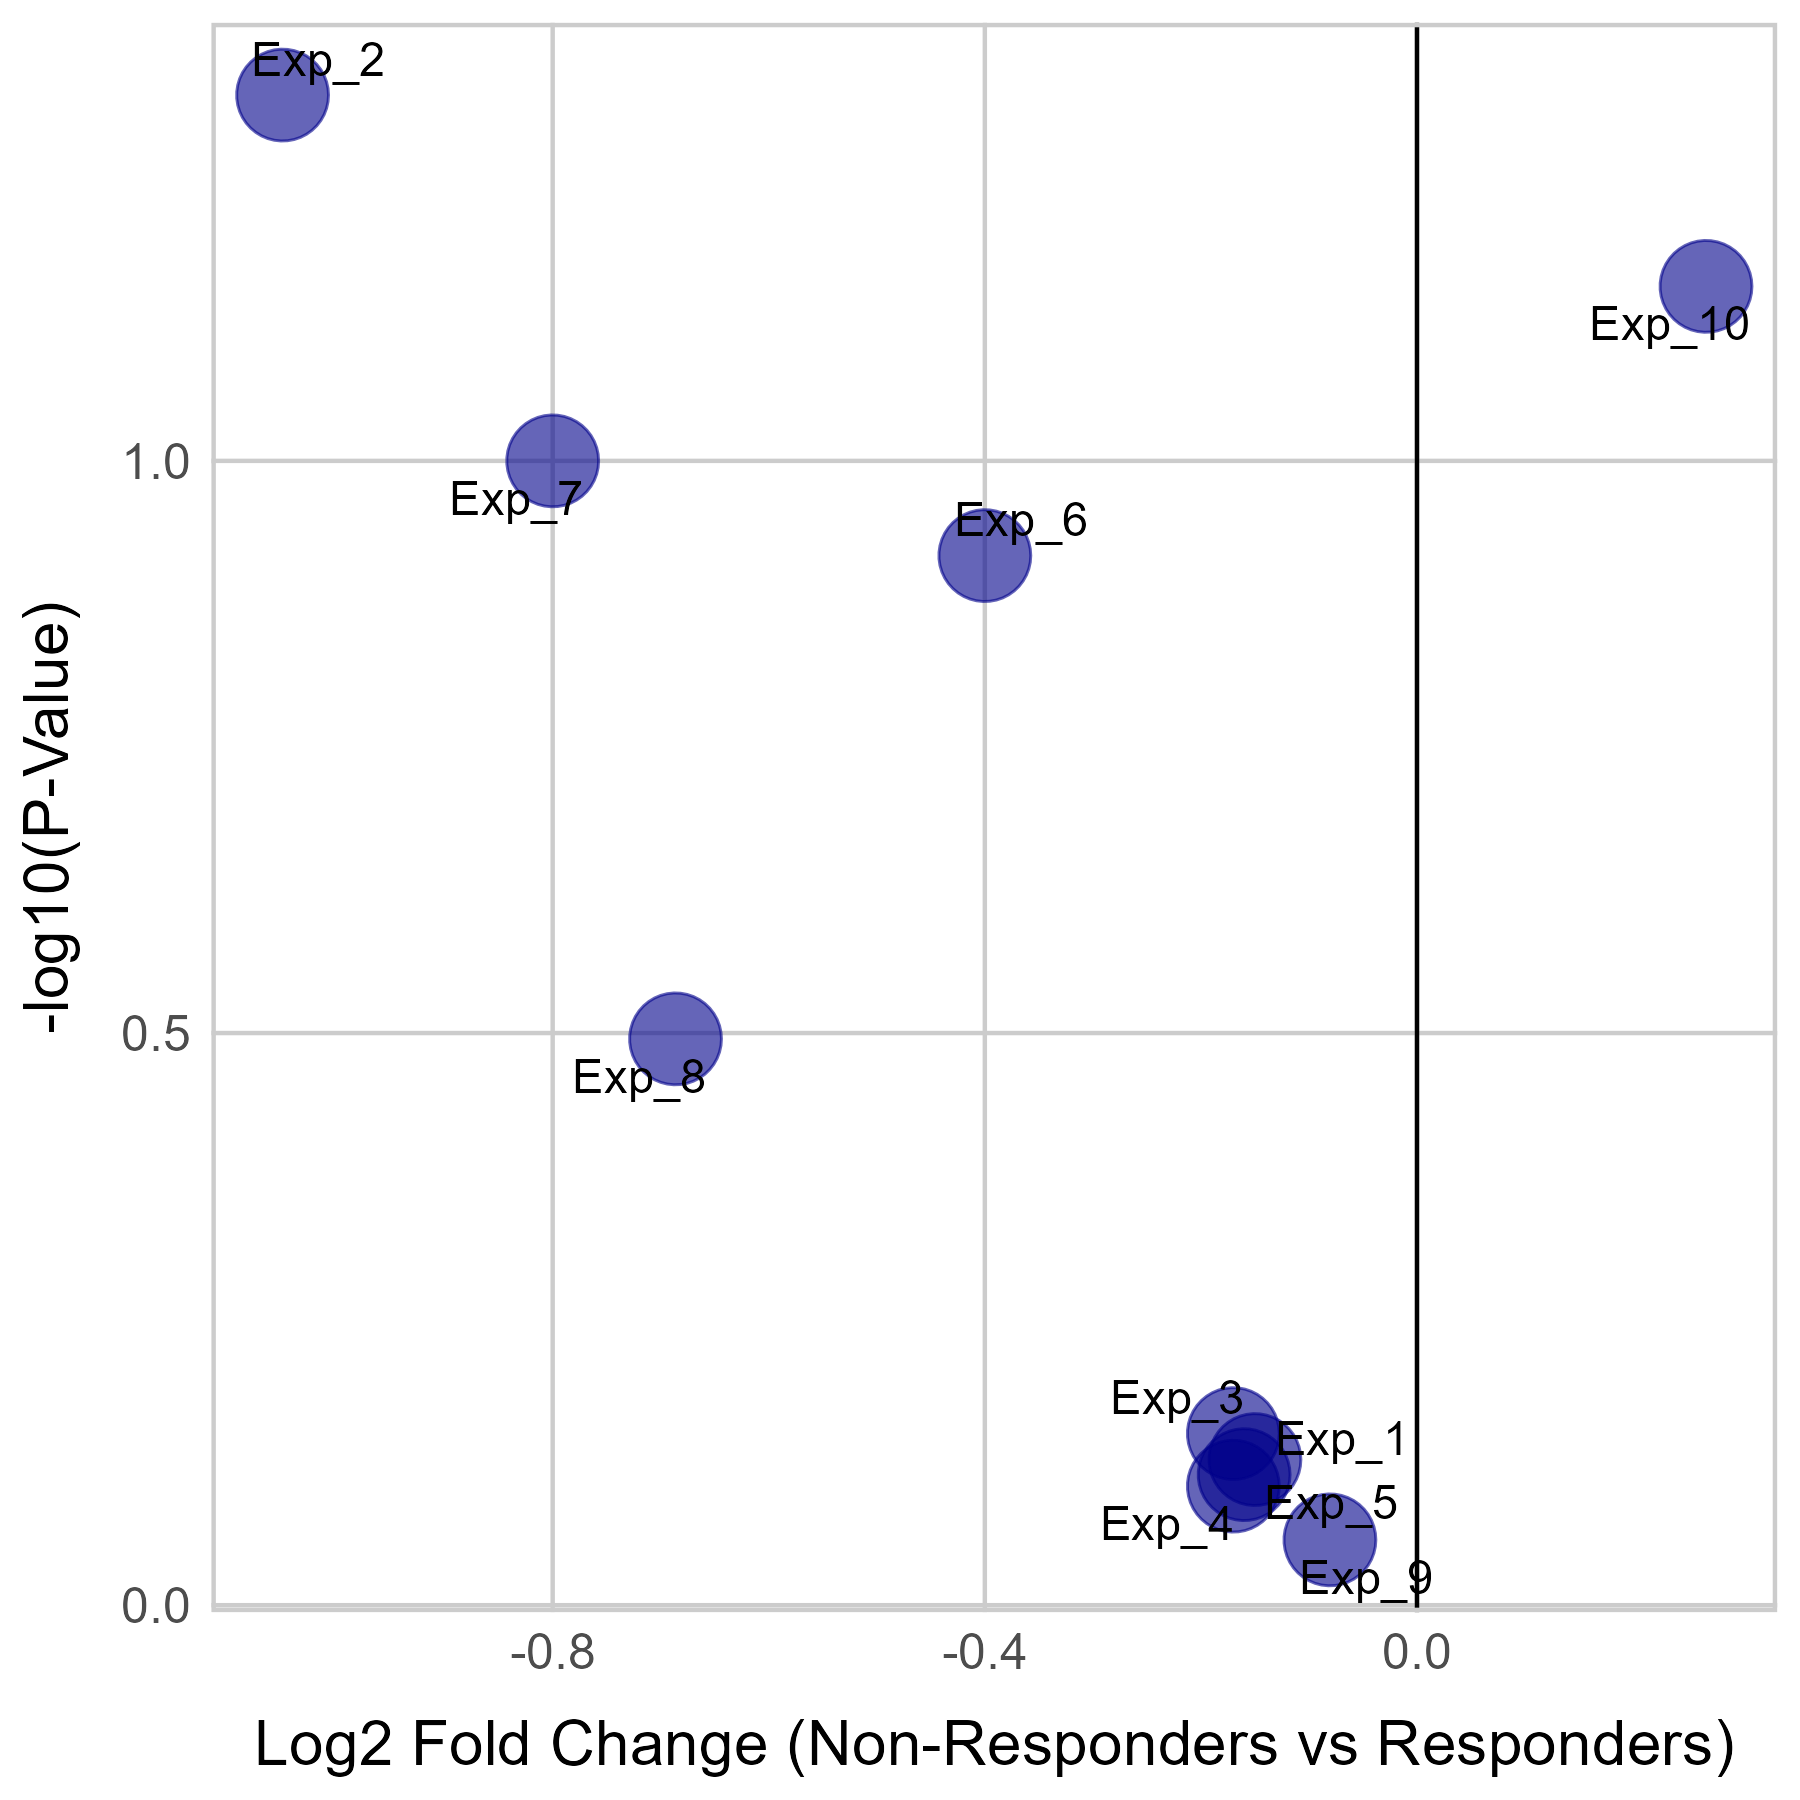 | 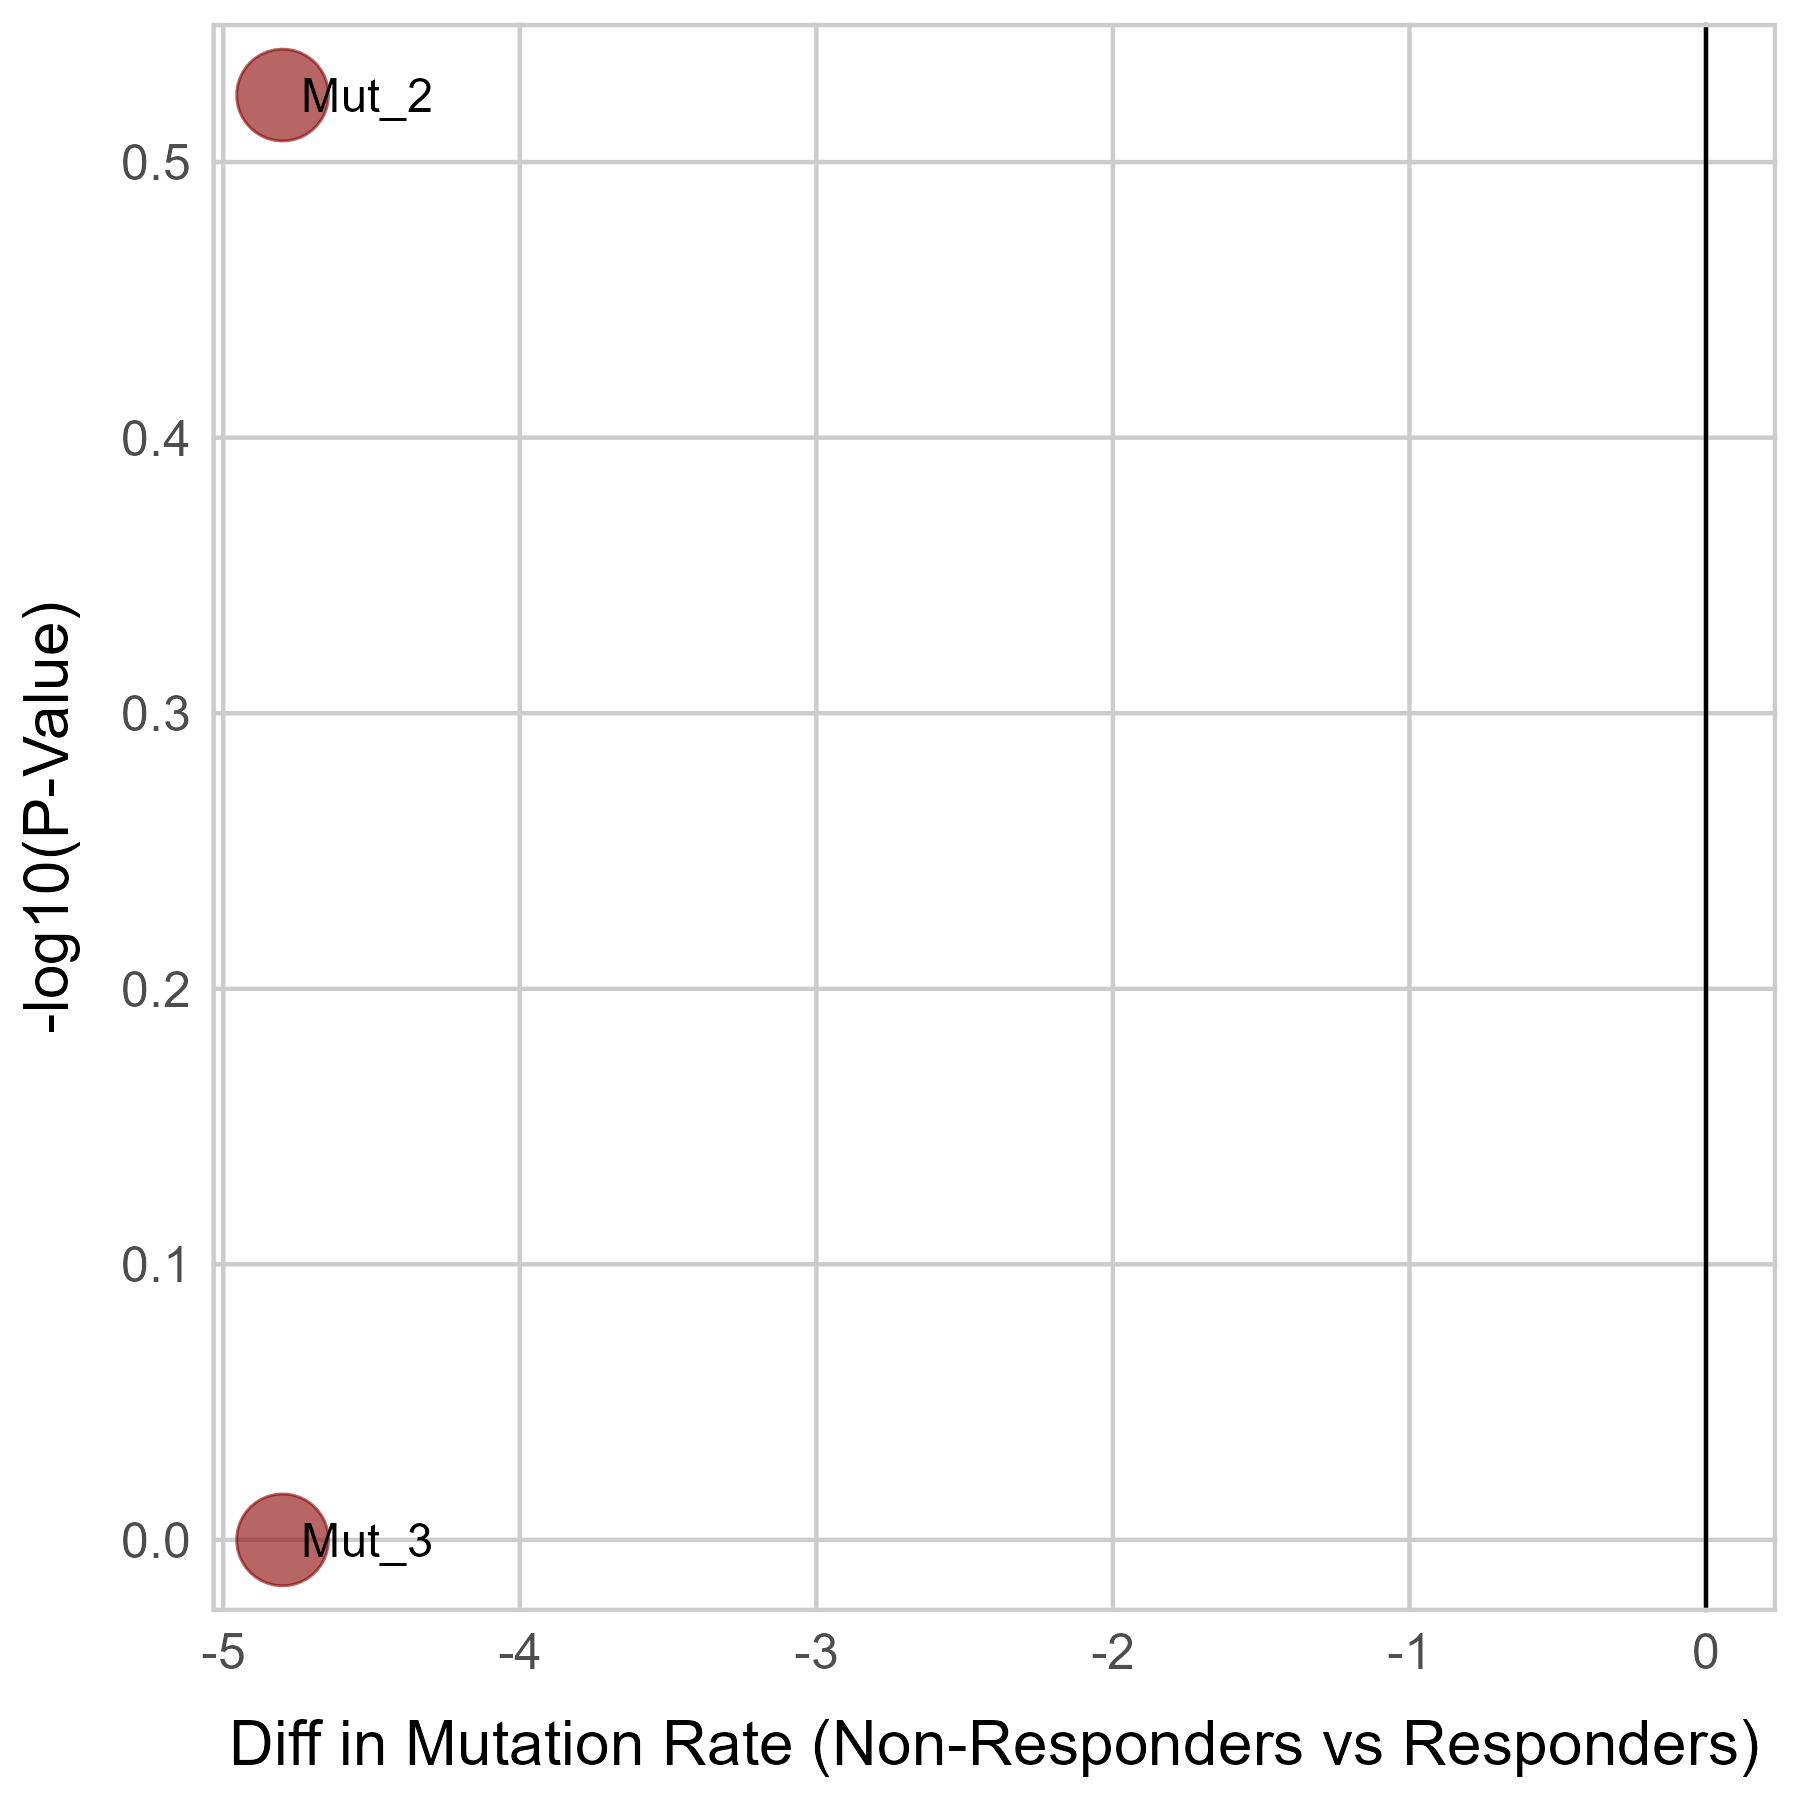 |
No significant differences were found in IL7 mutation.
Top |
Correlation between the composition of TIL and gene expression, methylation and CNV |
| Expression | Copy number variation |
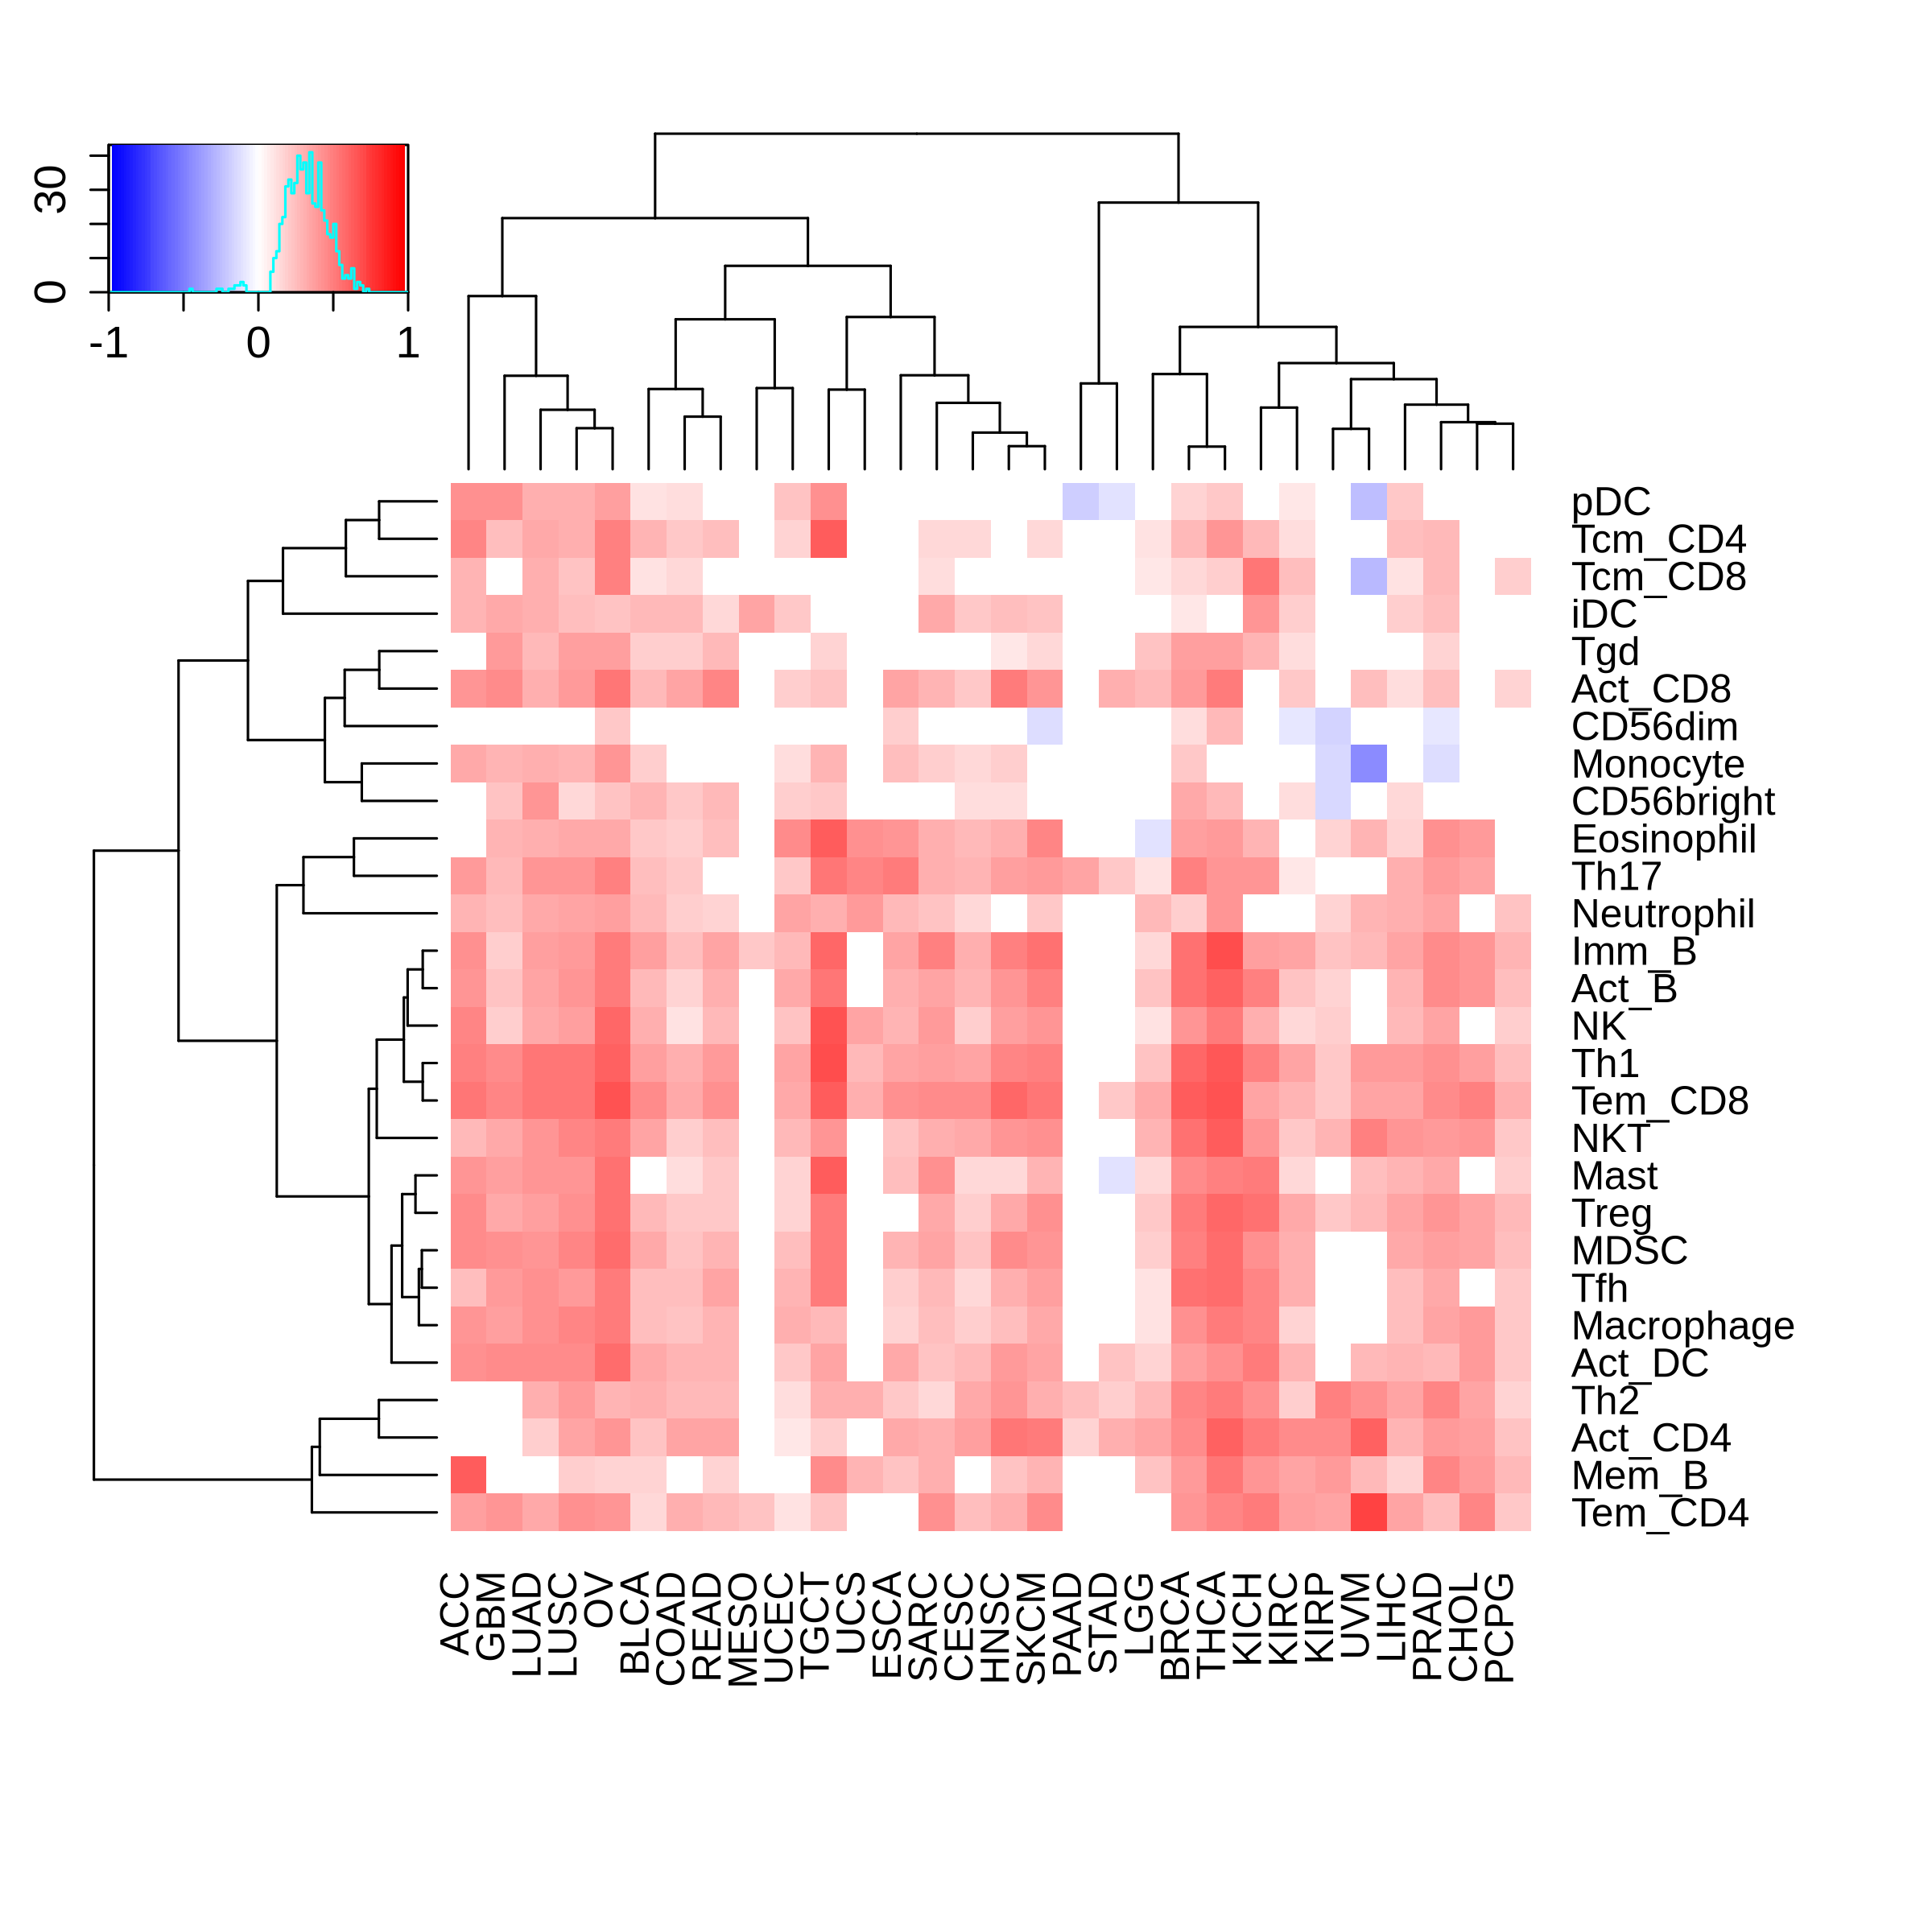 | 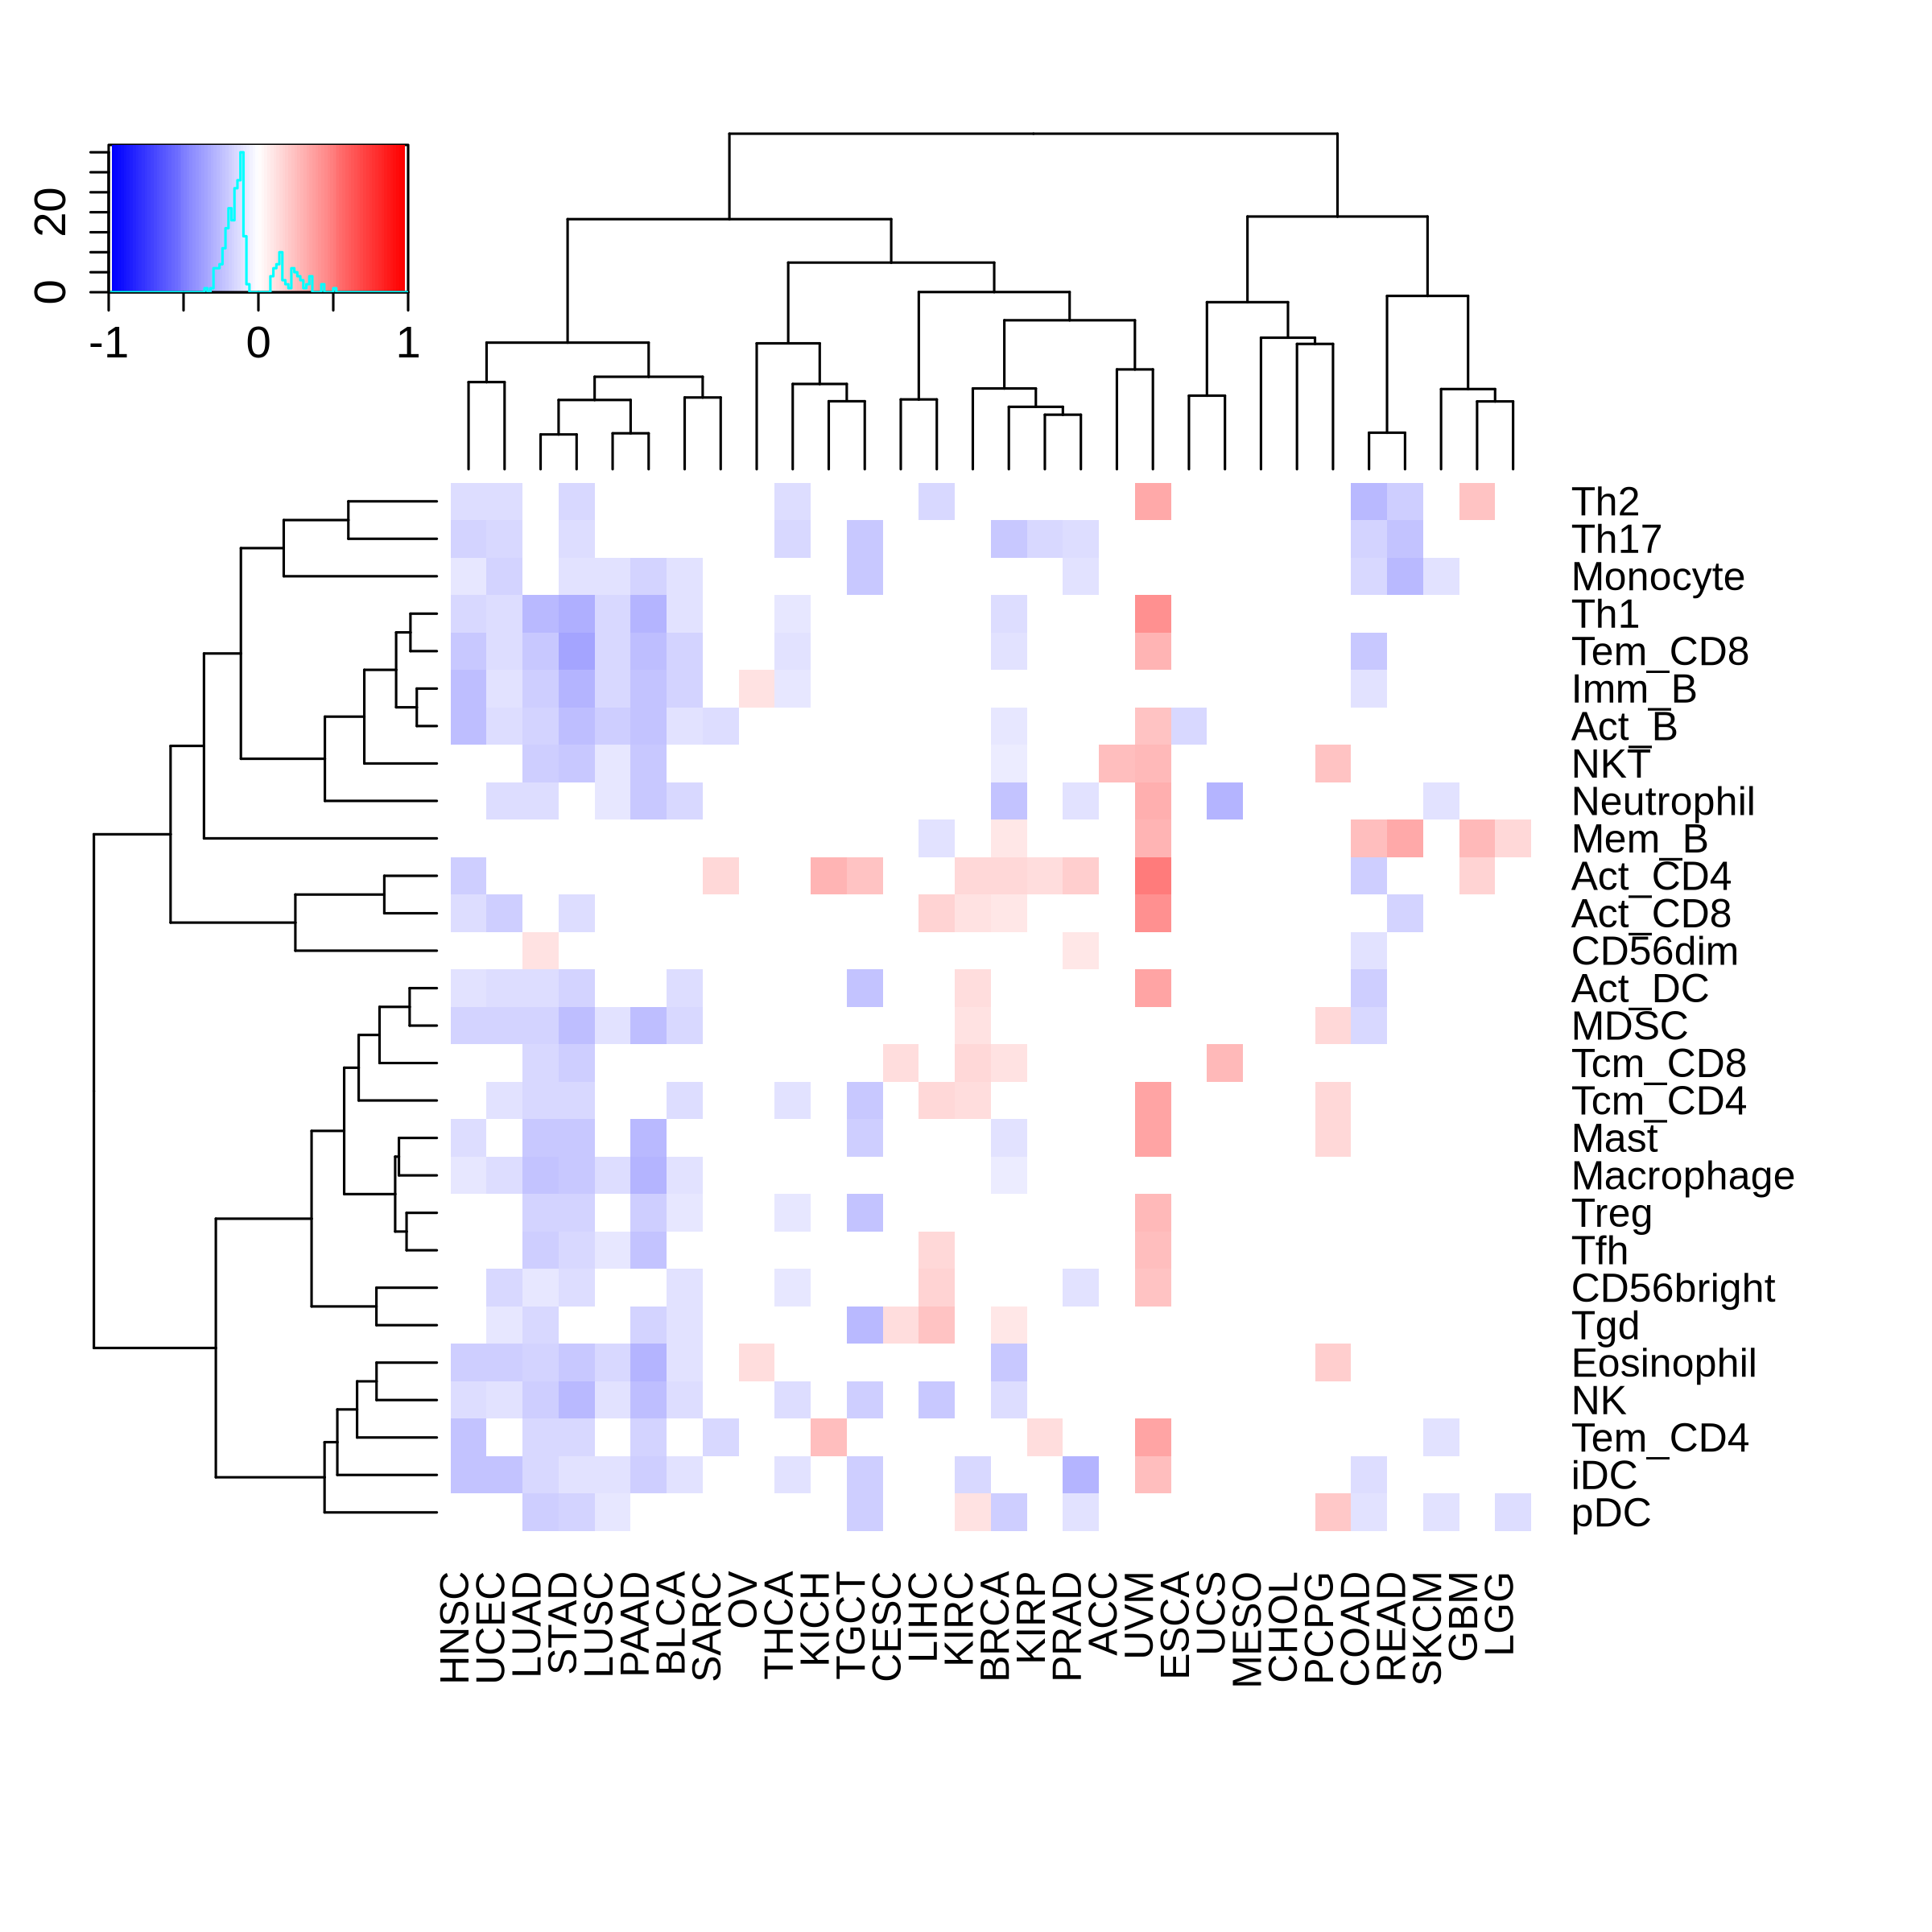 |
| Promoter methylation | Genebody methylation |
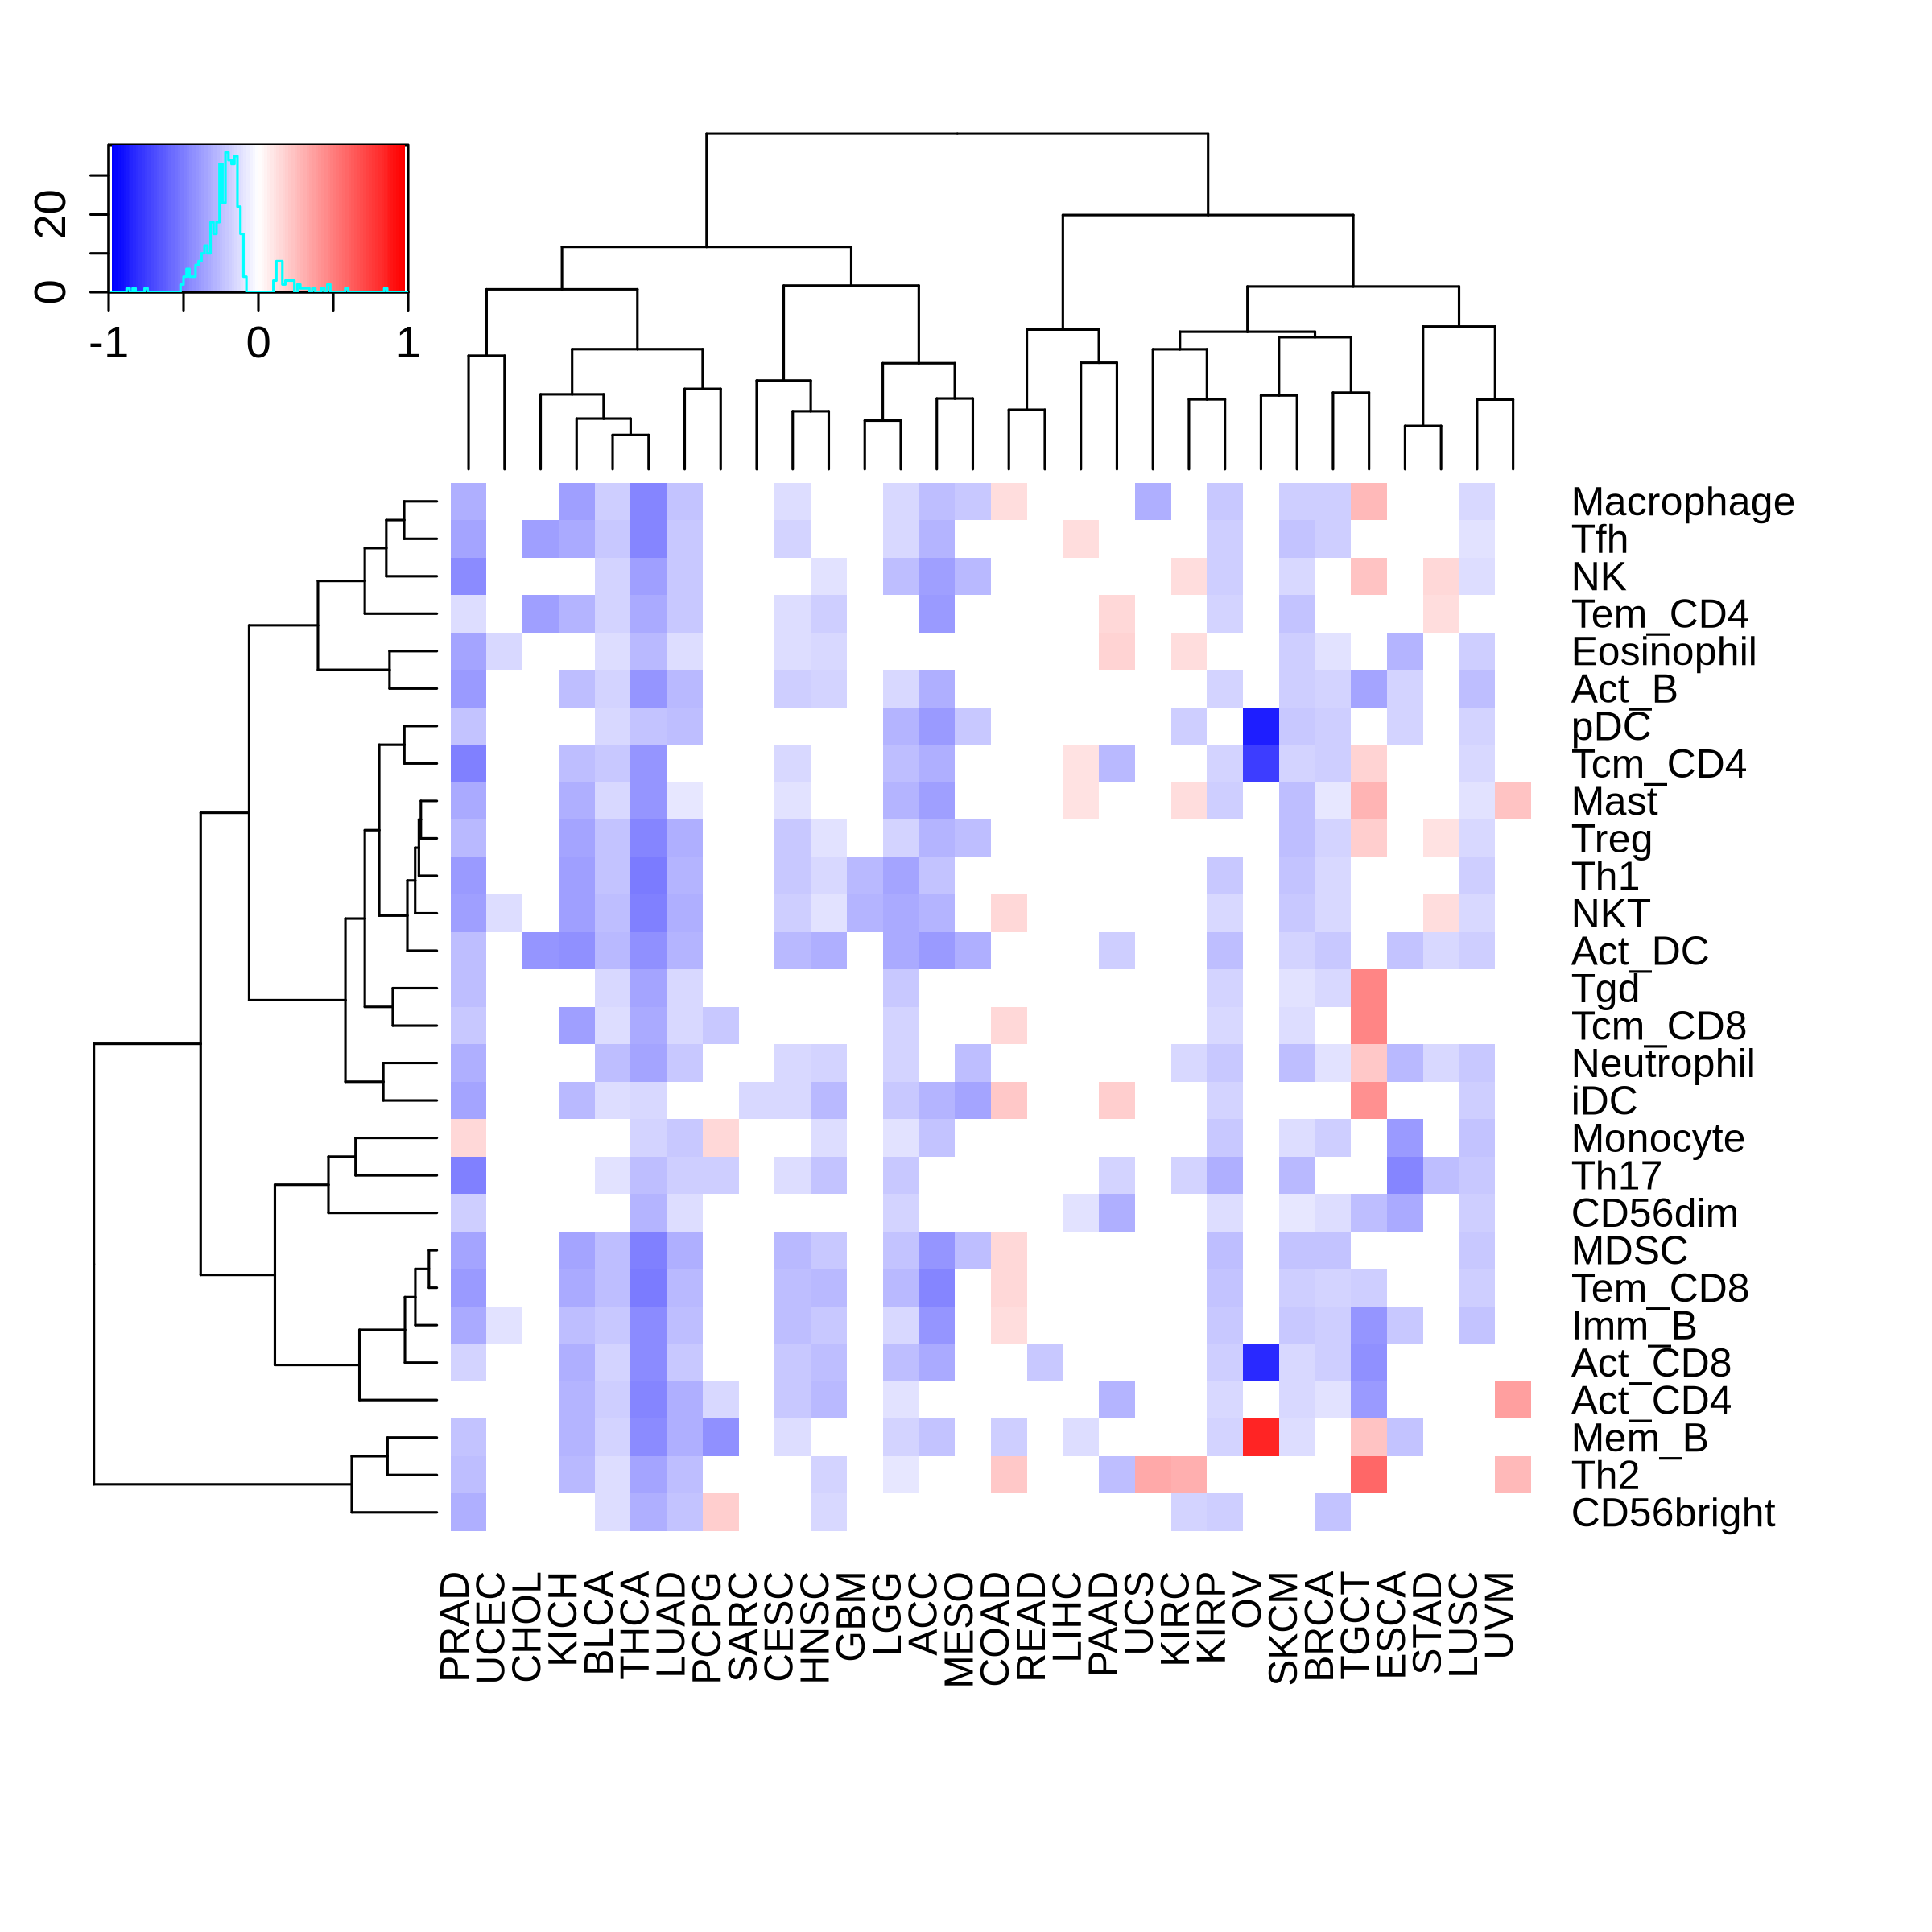 | 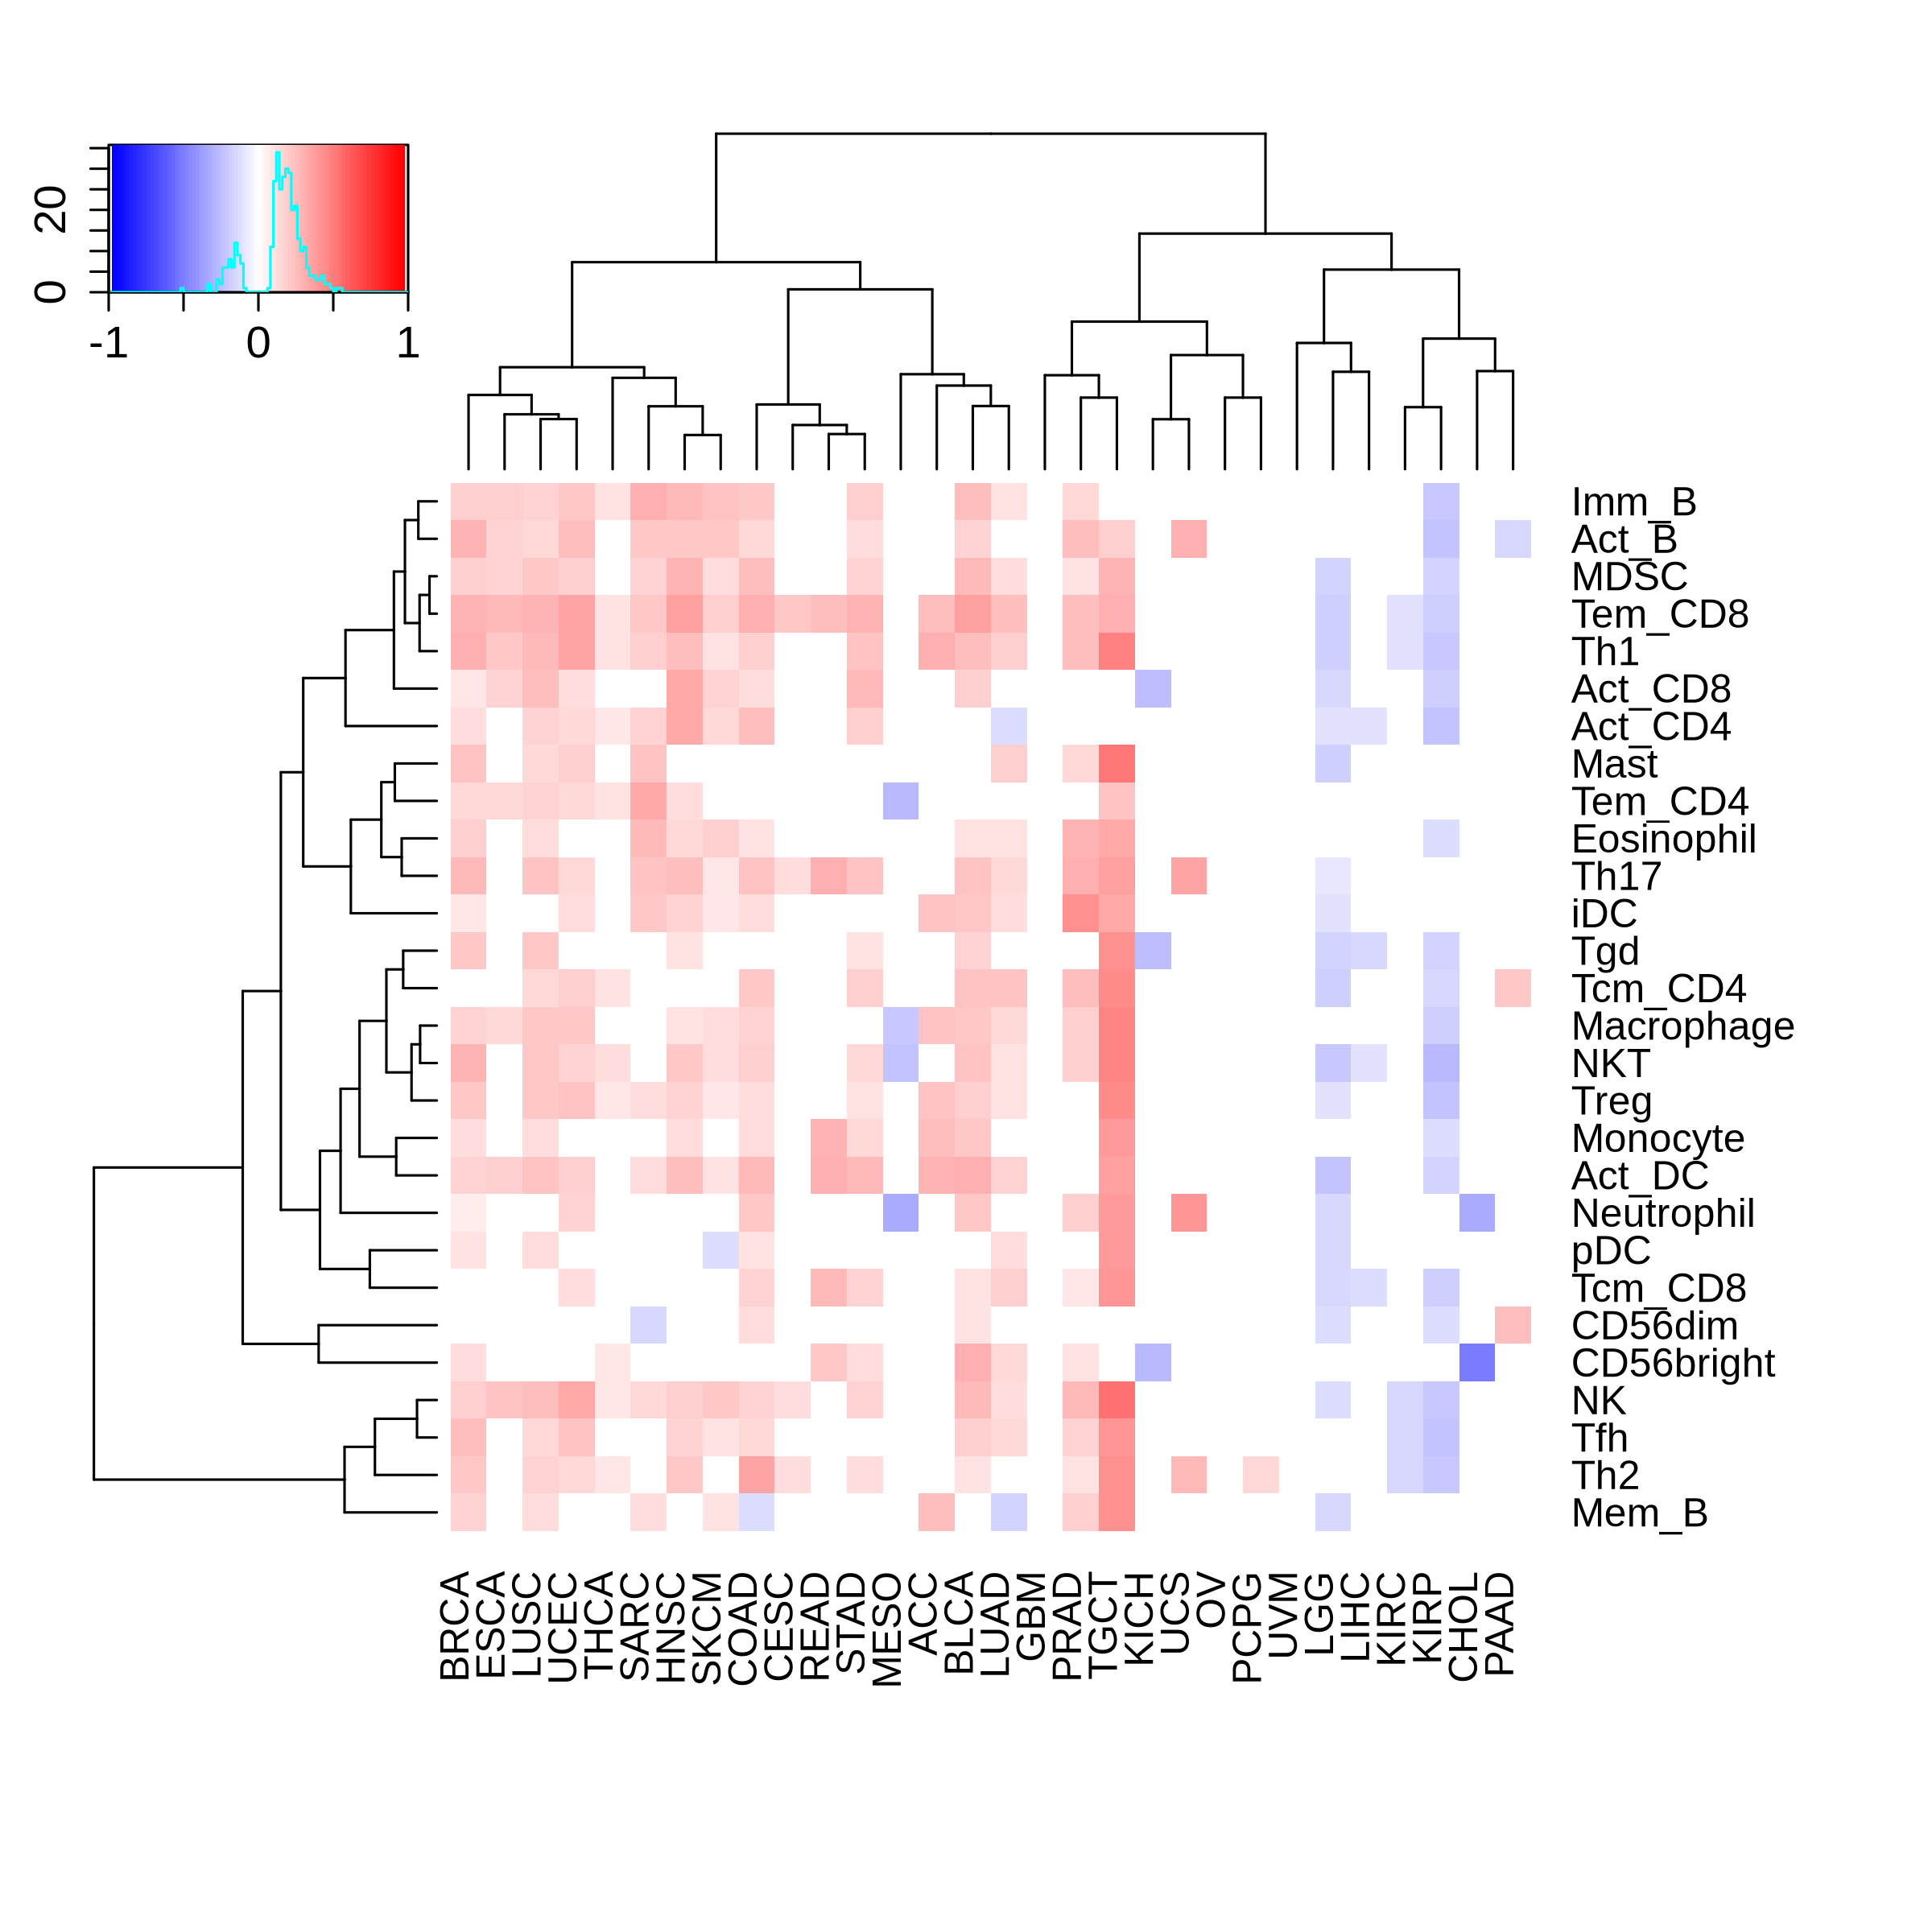 |
Top |
The association between IL7 expression and immune subtypes/status |
Top |
Drugs targeting IL7 and diseases related to IL7. |
| Drug-gene interaction | Disease-gene association |
 |  |
Top |
Survival analysis based on IL7 expression |
Top |
| Reference |
| [1] Steele CD, Abbasi A, Islam SMA, et al. Signatures of copy number alterations in human cancer. Nature. 2022 Jun;606(7916):984-991. doi: 10.1038/s41586-022-04738-6. Epub 2022 Jun 15. PMID: 35705804; PMCID: PMC9242861. [2] Beibei Ru, Ching Ngar Wong, Yin Tong, et al. TISIDB: an integrated repository portal for tumor–immune system interactions, Bioinformatics, Volume 35, Issue 20, October 2019, Pages 4200–4202, https://doi.org/10.1093/bioinformatics/btz210. [3] Zhongyang Liu, Jiale Liu, Xinyue Liu, et al. CTR–DB, an omnibus for patient-derived gene expression signatures correlated with cancer drug response, Nucleic Acids Research, Volume 50, Issue D1, 7 January 2022, Pages D1184–D1199, https://doi.org/10.1093/nar/gkab860. [4] Charoentong P, Finotello F, Angelova M, et al. Pan-cancer Immunogenomic Analyses Reveal Genotype-Immunophenotype Relationships and Predictors of Response to Checkpoint Blockade. Cell Rep. 2017 Jan 3;18(1):248–262. doi: 10.1016/j.celrep.2016.12.019. PMID: 28052254. [5] Thorsson V, Gibbs DL, Brown SD, et al. The Immune Landscape of Cancer. Immunity. 2018 Apr 17;48(4):812-830.e14. doi: 10.1016/j.immuni.2018.03.023. Epub 2018 Apr 5. Erratum in: Immunity. 2019 Aug 20;51(2):411-412. doi: 10.1016/j.immuni.2019.08.004. PMID: 29628290; PMCID: PMC5982584. [6] Zapata L, Caravagna G, Williams MJ, et al. Immune selection determines tumor antigenicity and influences response to checkpoint inhibitors. Nat Genet. 2023 Mar;55(3):451-460. doi: 10.1038/s41588-023-01313-1. Epub 2023 Mar 9. PMID: 36894710; PMCID: PMC10011129. [7] Cortes-Ciriano I, Lee S, Park WY, et al. A molecular portrait of microsatellite instability across multiple cancers. Nat Commun. 2017 Jun 6;8:15180. doi: 10.1038/ncomms15180. PMID: 28585546; PMCID: PMC5467167. [8] Cannon M, Stevenson J, Stahl K, et al. DGIdb 5.0: rebuilding the drug-gene interaction database for precision medicine and drug discovery platforms. Nucleic Acids Res. 2024 Jan 5;52(D1):D1227-D1235. doi: 10.1093/nar/gkad1040. PMID: 37953380; PMCID: PMC10767982. [9] Grissa D, Junge A, Oprea TI, Jensen LJ. Diseases 2.0: a weekly updated database of disease-gene associations from text mining and data integration. Database (Oxford). 2022 Mar 28;2022:baac019. doi: 10.1093/database/baac019. PMID: 35348648; PMCID: PMC9216524. |

Copyright 2024-Present -The University of Texas Health Science Center at Houston |