|
|
||||||||
|
||||||||

Gene summary for C1QBP |
| Gene Symbol | C1QBP | Gene ID | 708 |
| Gene name | complement C1q binding protein |
| Synonyms | HABP1;GC1QR;P32;SF2P32;GC1Q-R |
| Type of gene | protein_coding |
| UniProtAcc | Q07021 |
| GO ID | GO term |
| GO:0006397 | mRNA processing |
| GO:0008380 | RNA splicing |
| GO:0006915 | apoptotic process |
| GO:0002376 | immune system process |
| GO:0045087 | innate immune response |
| GO:0002250 | adaptive immune response |
| GO:0042254 | ribosome biogenesis |
| GO:0006958 | complement activation, classical pathway |
| GO:0043065 | positive regulation of apoptotic process |
| GO:0000122 | negative regulation of transcription by RNA polymerase II |
| GO:0032689 | negative regulation of type II interferon production |
| GO:0050687 | negative regulation of defense response to virus |
| GO:0032695 | negative regulation of interleukin-12 production |
| GO:0070131 | positive regulation of mitochondrial translation |
| GO:0006955 | immune response |
| GO:2000510 | positive regulation of dendritic cell chemotaxis |
| GO:0045785 | positive regulation of cell adhesion |
| GO:0043491 | protein kinase B signaling |
| GO:0048025 | negative regulation of mRNA splicing, via spliceosome |
| GO:0042256 | cytosolic ribosome assembly |
| GO:0051897 | positive regulation of protein kinase B signaling |
| GO:0039534 | negative regulation of MDA-5 signaling pathway |
| GO:1900026 | positive regulation of substrate adhesion-dependent cell spreading |
| GO:1901165 | positive regulation of trophoblast cell migration |
| GO:0090023 | positive regulation of neutrophil chemotaxis |
| GO:0030449 | regulation of complement activation |
| GO:0039536 | negative regulation of RIG-I signaling pathway |
Top |
Literatures describing the association of C1QBP and immune escape mechanisms |
Top |
Comparison of the C1QBP expression level between tumor and normal groups |
Top |
Comparison of the C1QBP methylation level between tumor and normal groups |
No significant differences were found in C1QBP methylation in promoter region.
No significant differences were found in C1QBP methylation in genebody region.
Top |
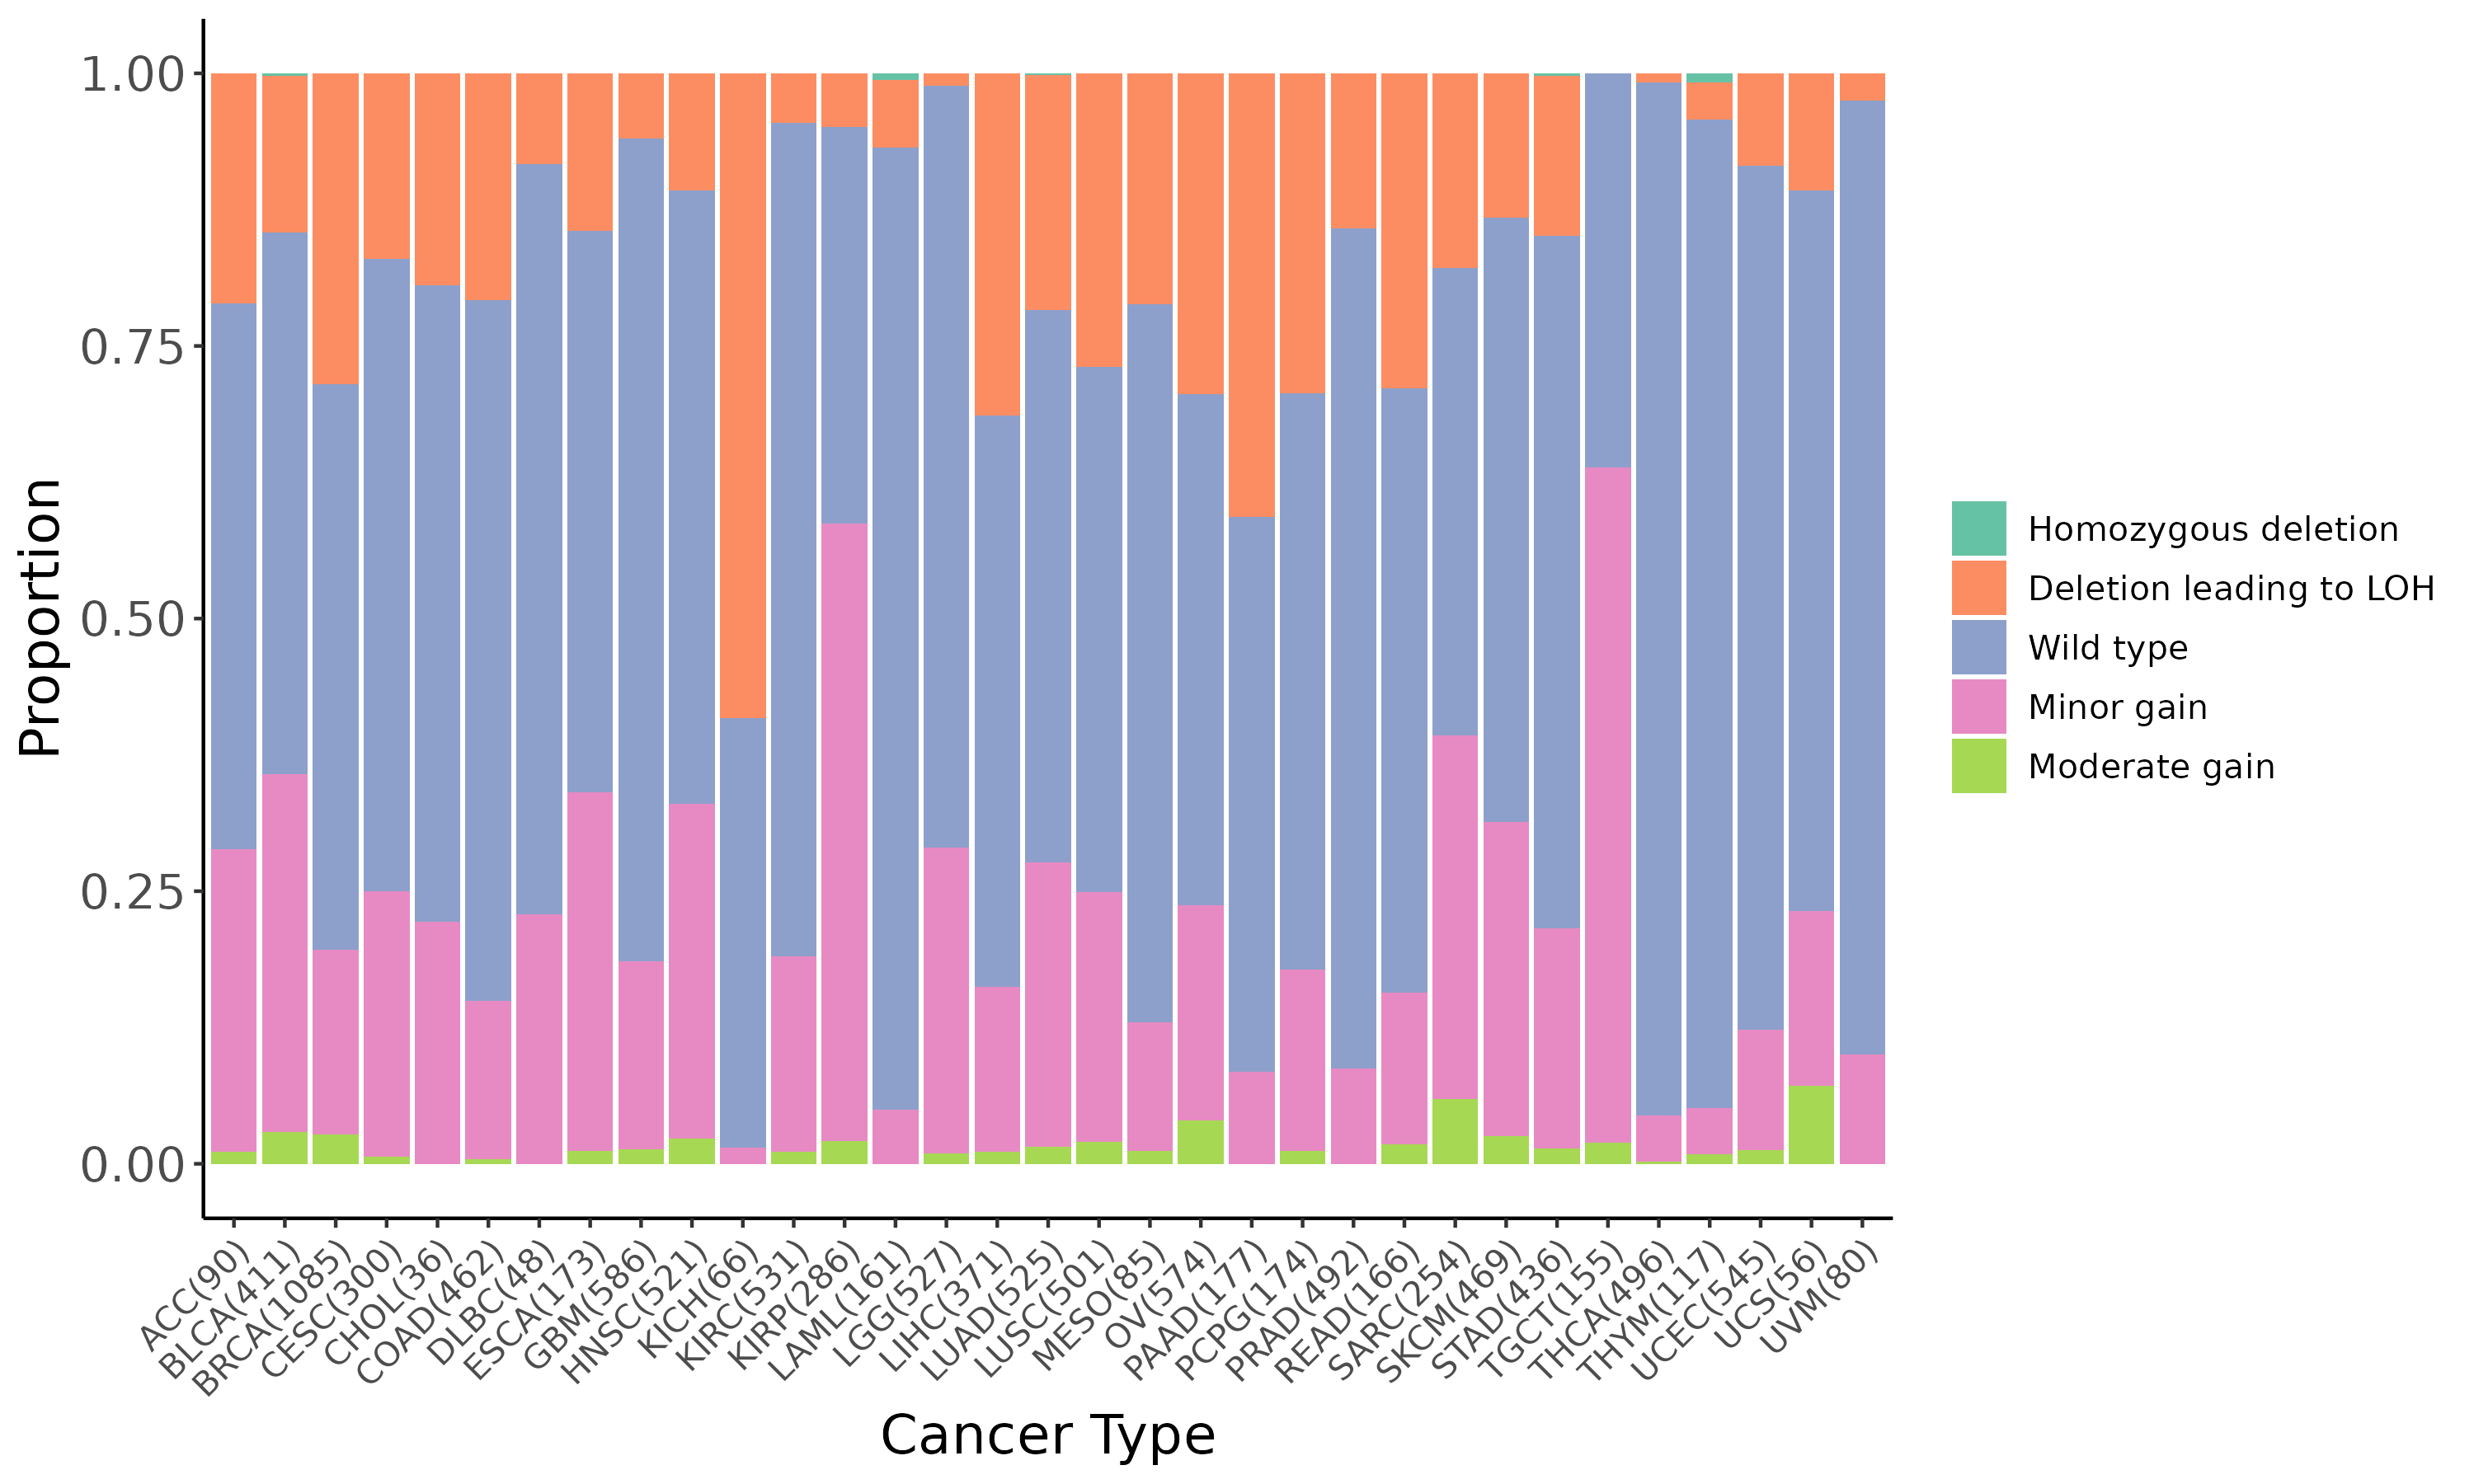
Summary of the copy number in TCGA tumor samples |
 |
Top |
DEGs and the enrichment analysis between the mutated and wild type groups |
| Gene ID | Symbol | Log2 Fold Change | P-value | Adjusted P-value |
|---|---|---|---|---|
| ENSG00000073756 | PTGS2 | -3.32e+00 | 2.87e-04 | 2.76e-02 |
| ENSG00000101443 | WFDC2 | -2.33e+00 | 2.89e-04 | 2.76e-02 |
| ENSG00000225580 | RP1-159M24.1 | 1.68e+00 | 2.91e-04 | 2.76e-02 |
| ENSG00000286659 | NA | 1.66e+00 | 2.90e-04 | 2.76e-02 |
| ENSG00000287059 | NA | -2.68e+00 | 2.89e-04 | 2.76e-02 |
| ENSG00000180638 | SLC47A2 | -3.27e+00 | 2.93e-04 | 2.77e-02 |
| ENSG00000140557 | ST8SIA2 | -3.23e+00 | 2.97e-04 | 2.80e-02 |
| ENSG00000182732 | RGS6 | -2.53e+00 | 3.00e-04 | 2.82e-02 |
| ENSG00000270000 | RP3-449M8.9 | -3.53e+00 | 3.07e-04 | 2.88e-02 |
| ENSG00000113389 | NPR3 | -2.31e+00 | 3.10e-04 | 2.90e-02 |
| ENSG00000228278 | ORM2 | -3.48e+00 | 3.11e-04 | 2.90e-02 |
| ENSG00000255652 | RP11-313F23.4 | -3.33e+00 | 3.16e-04 | 2.94e-02 |
| ENSG00000114948 | ADAM23 | -3.49e+00 | 3.19e-04 | 2.95e-02 |
| ENSG00000142619 | PADI3 | -3.88e+00 | 3.21e-04 | 2.96e-02 |
| ENSG00000251400 | ALDH7A1P1 | 1.98e+00 | 3.24e-04 | 2.98e-02 |
| ENSG00000173530 | TNFRSF10D | -1.85e+00 | 3.28e-04 | 3.00e-02 |
| ENSG00000105642 | KCNN1 | -2.85e+00 | 3.32e-04 | 3.00e-02 |
| ENSG00000224014 | RP11-488L18.6 | -2.44e+00 | 3.30e-04 | 3.00e-02 |
| ENSG00000248485 | PCP4L1 | -3.30e+00 | 3.32e-04 | 3.00e-02 |
| ENSG00000188825 | LINC00910 | 1.22e+00 | 3.36e-04 | 3.03e-02 |
| Page: 1 2 ... 13 14 15 16 17 ... 22 23 |
Down-regulated GOBP pathways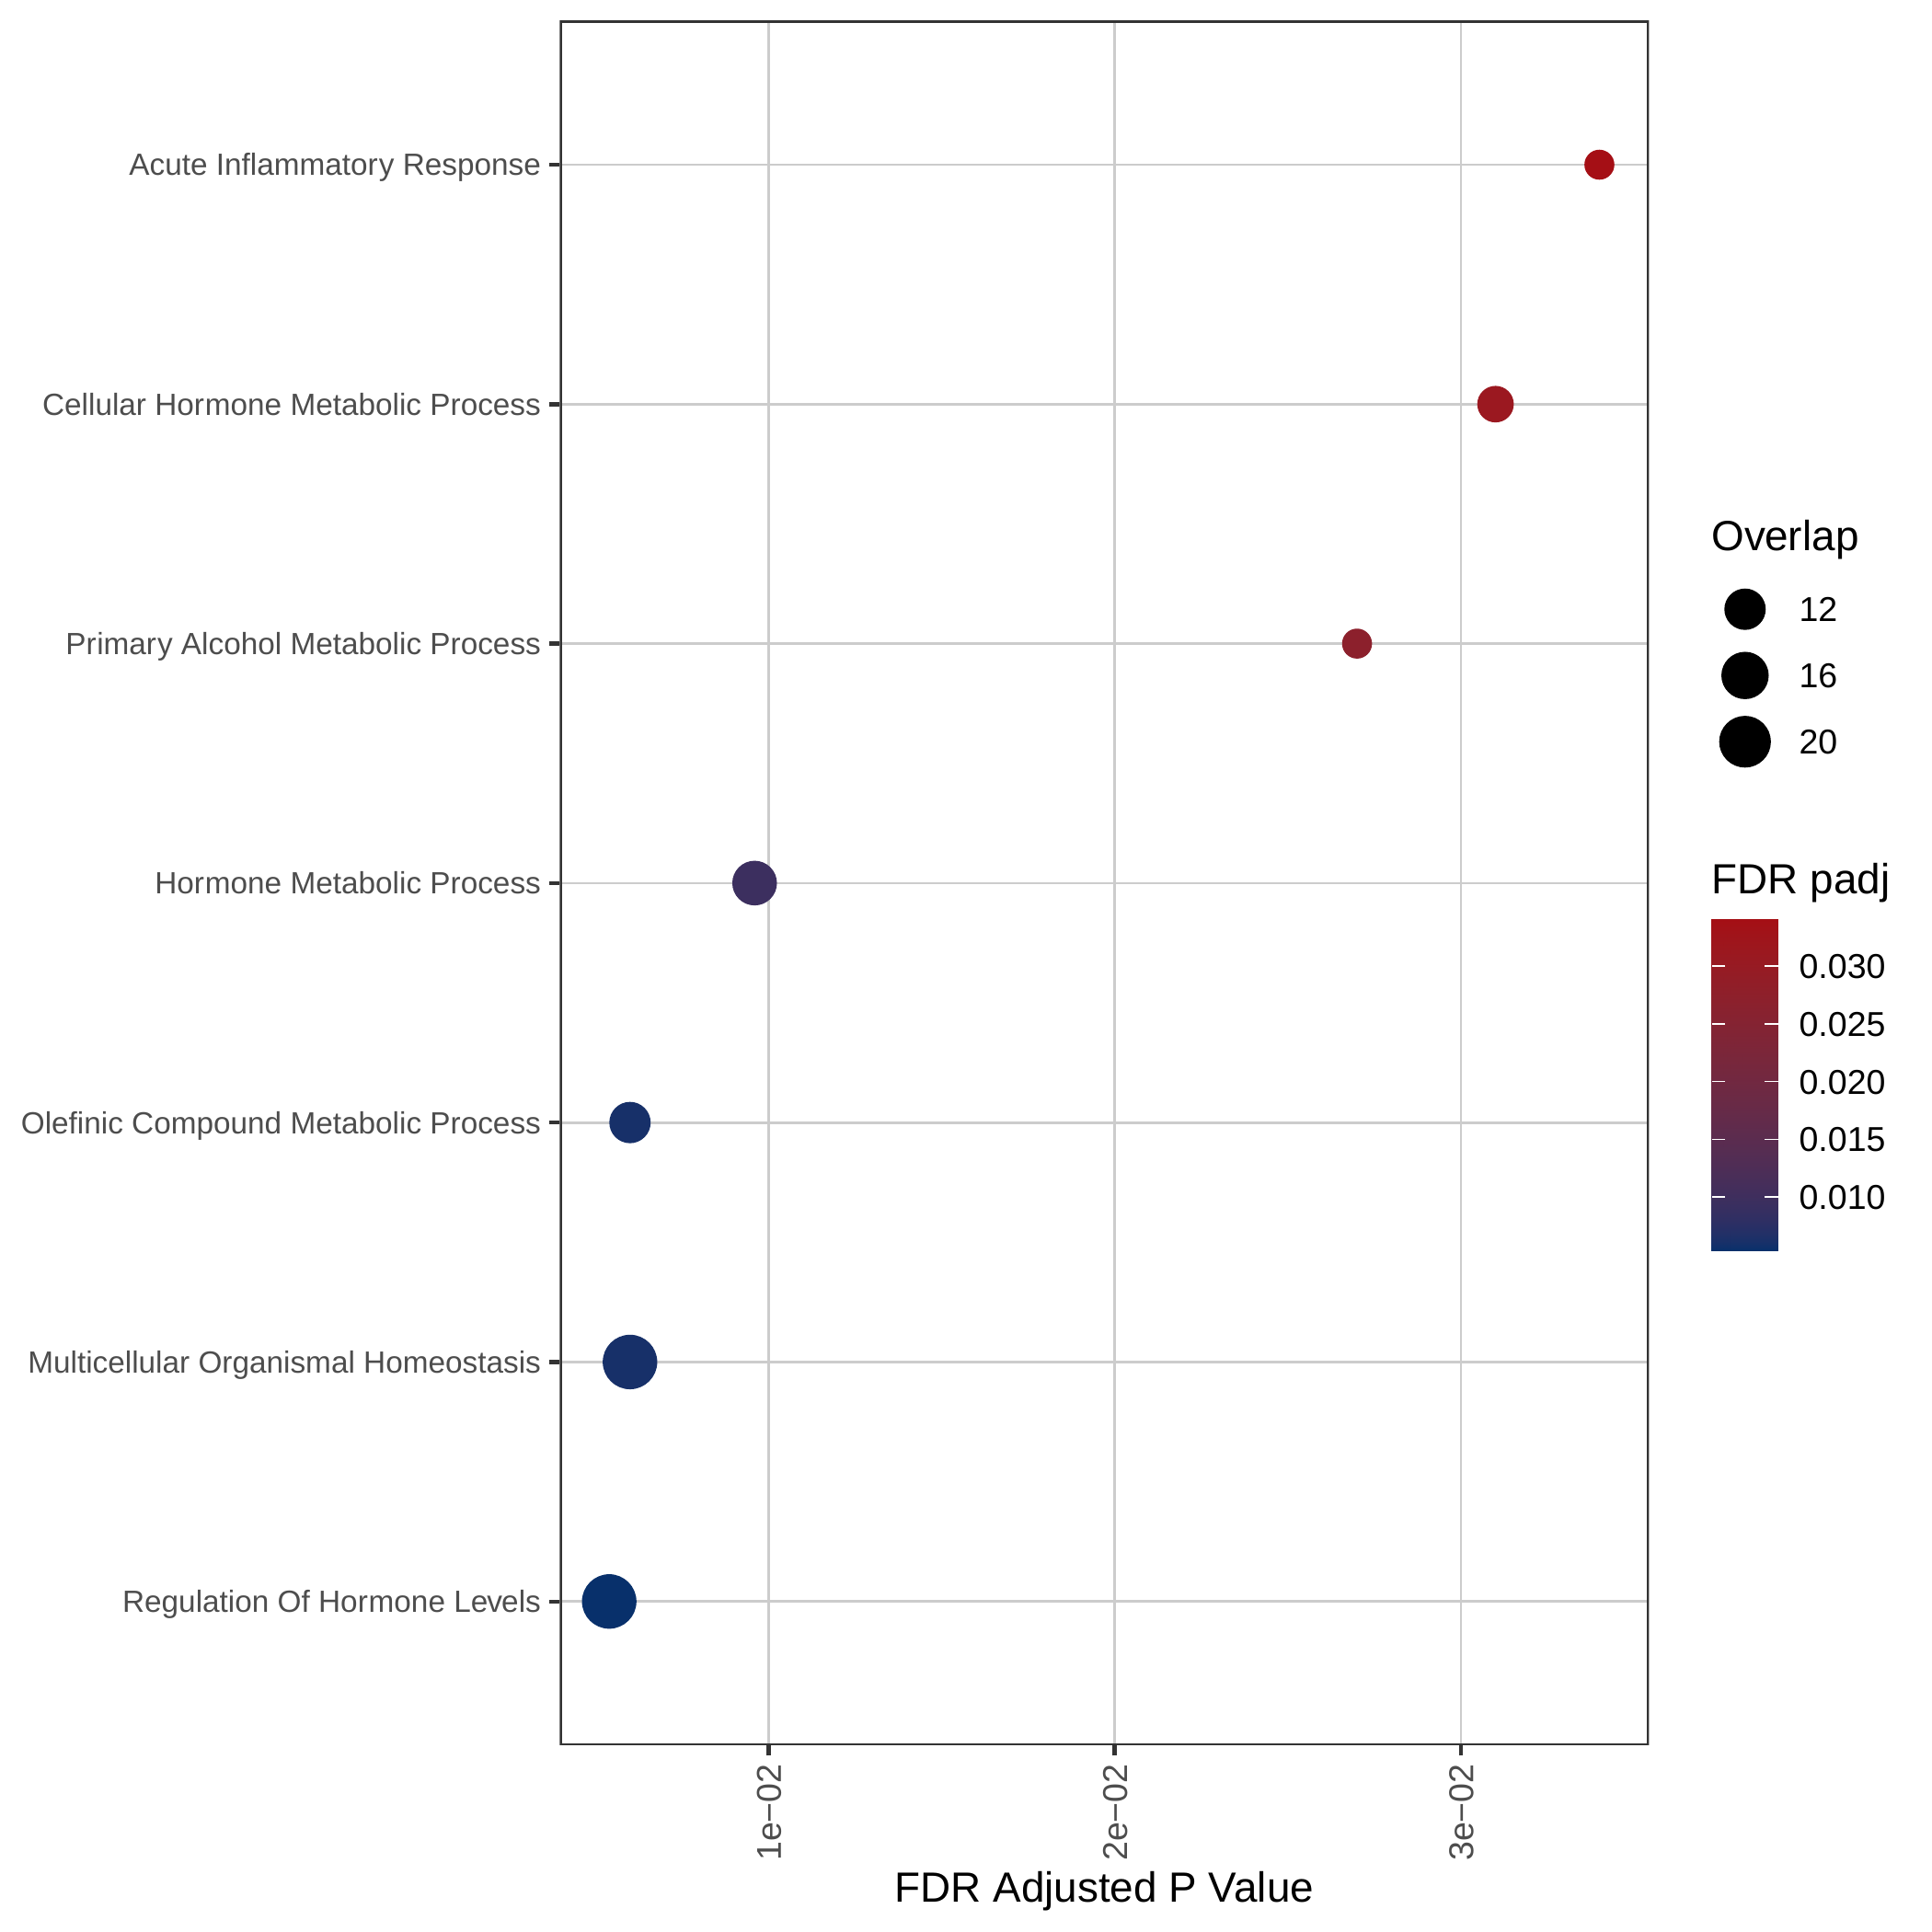 |
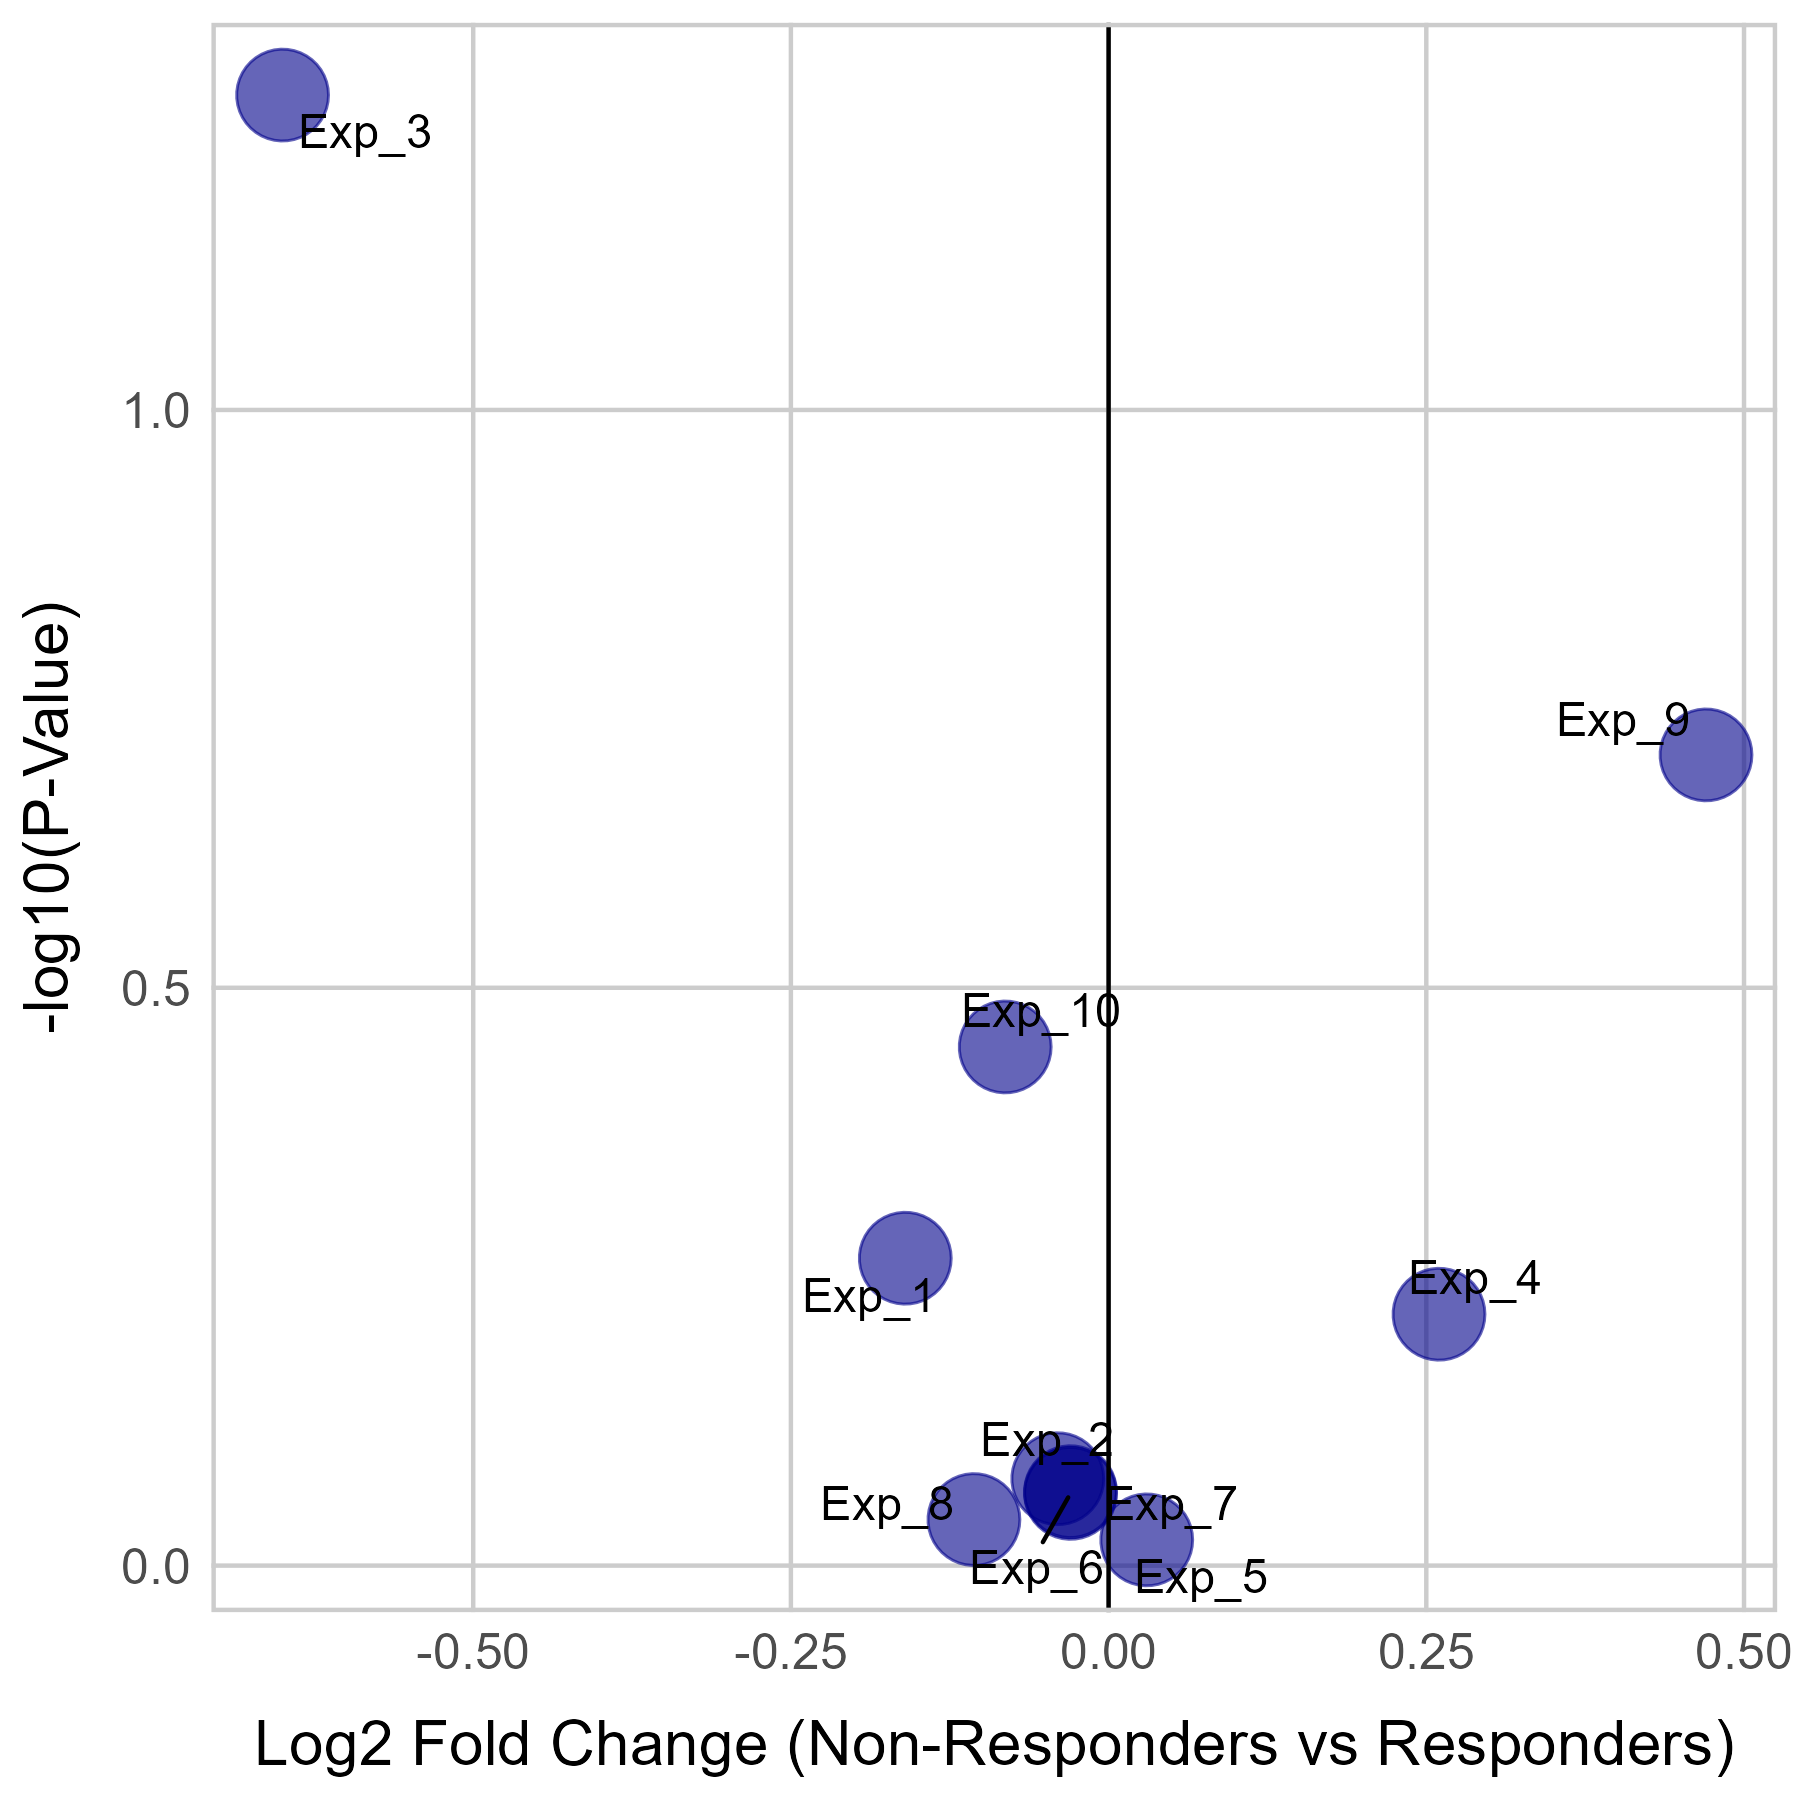
Gene expression and mutation differences between non-responders and responders after immunotherapy |
| Expression | Mutation |
 | The comparison is not available for C1QBP. |
No significant differences were found in C1QBP expression.
No significant differences were found in C1QBP mutation.
Top |
Correlation between the composition of TIL and gene expression, methylation and CNV |
| Expression | Copy number variation |
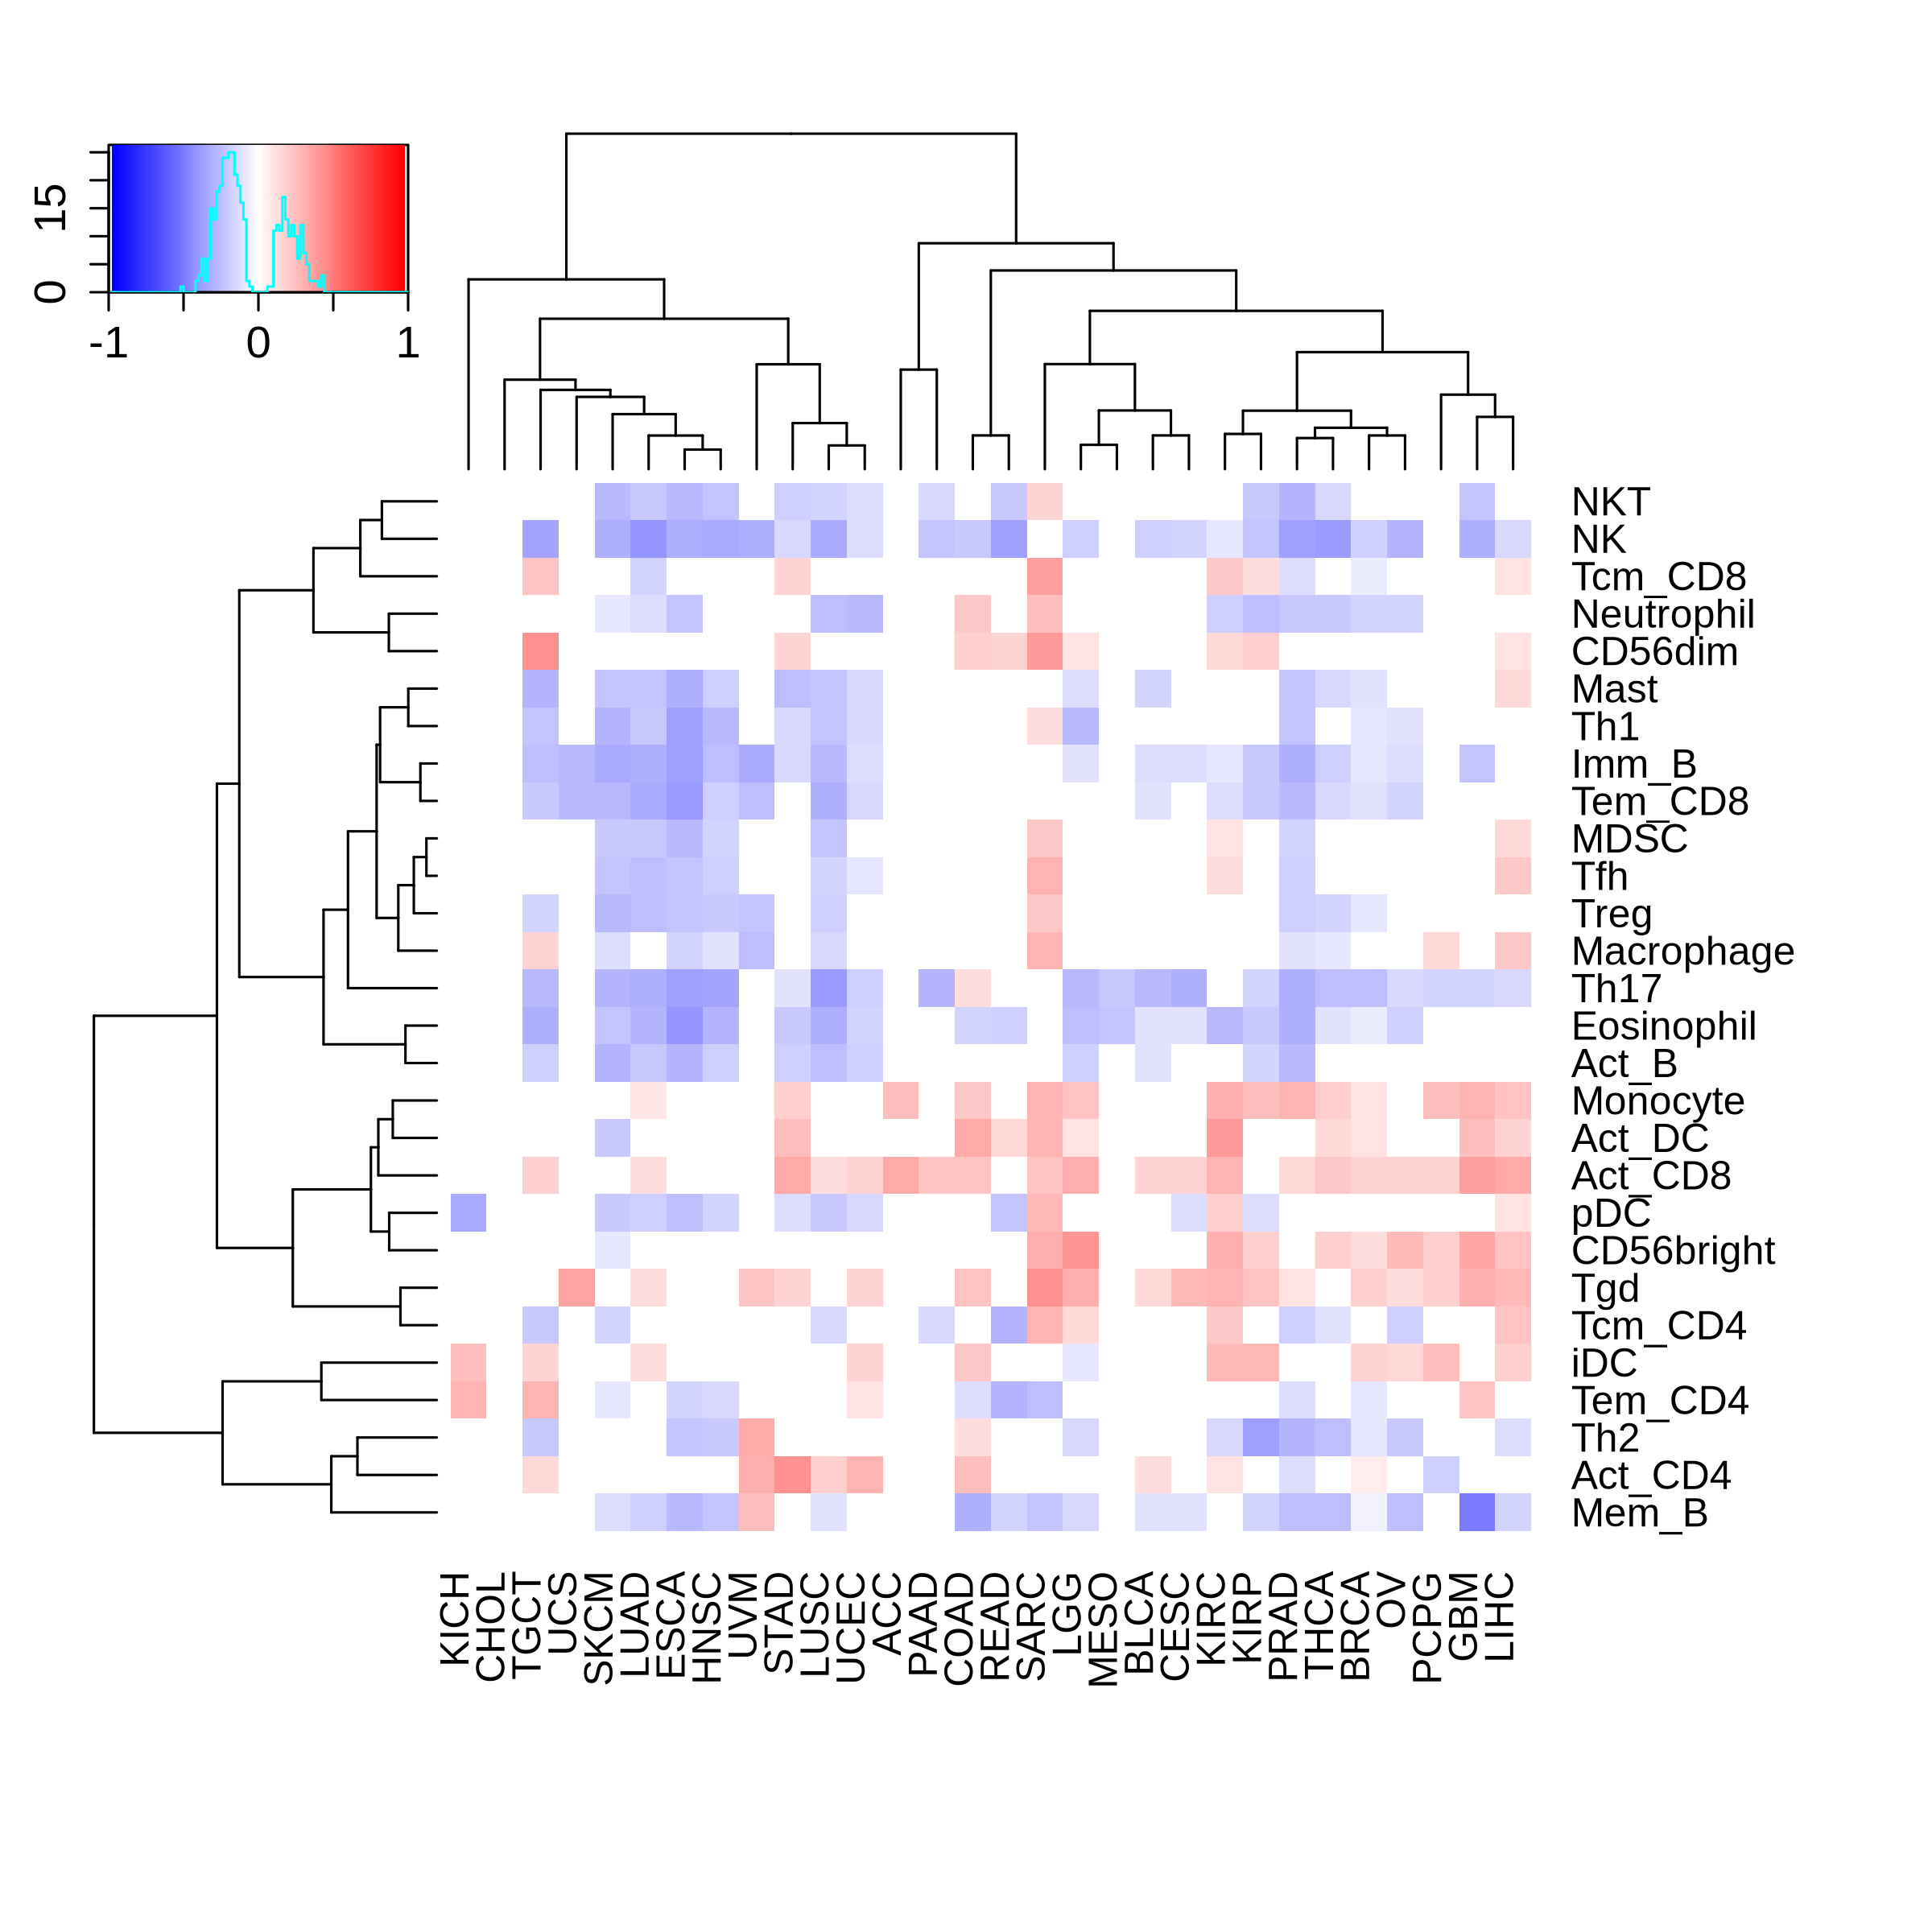 | 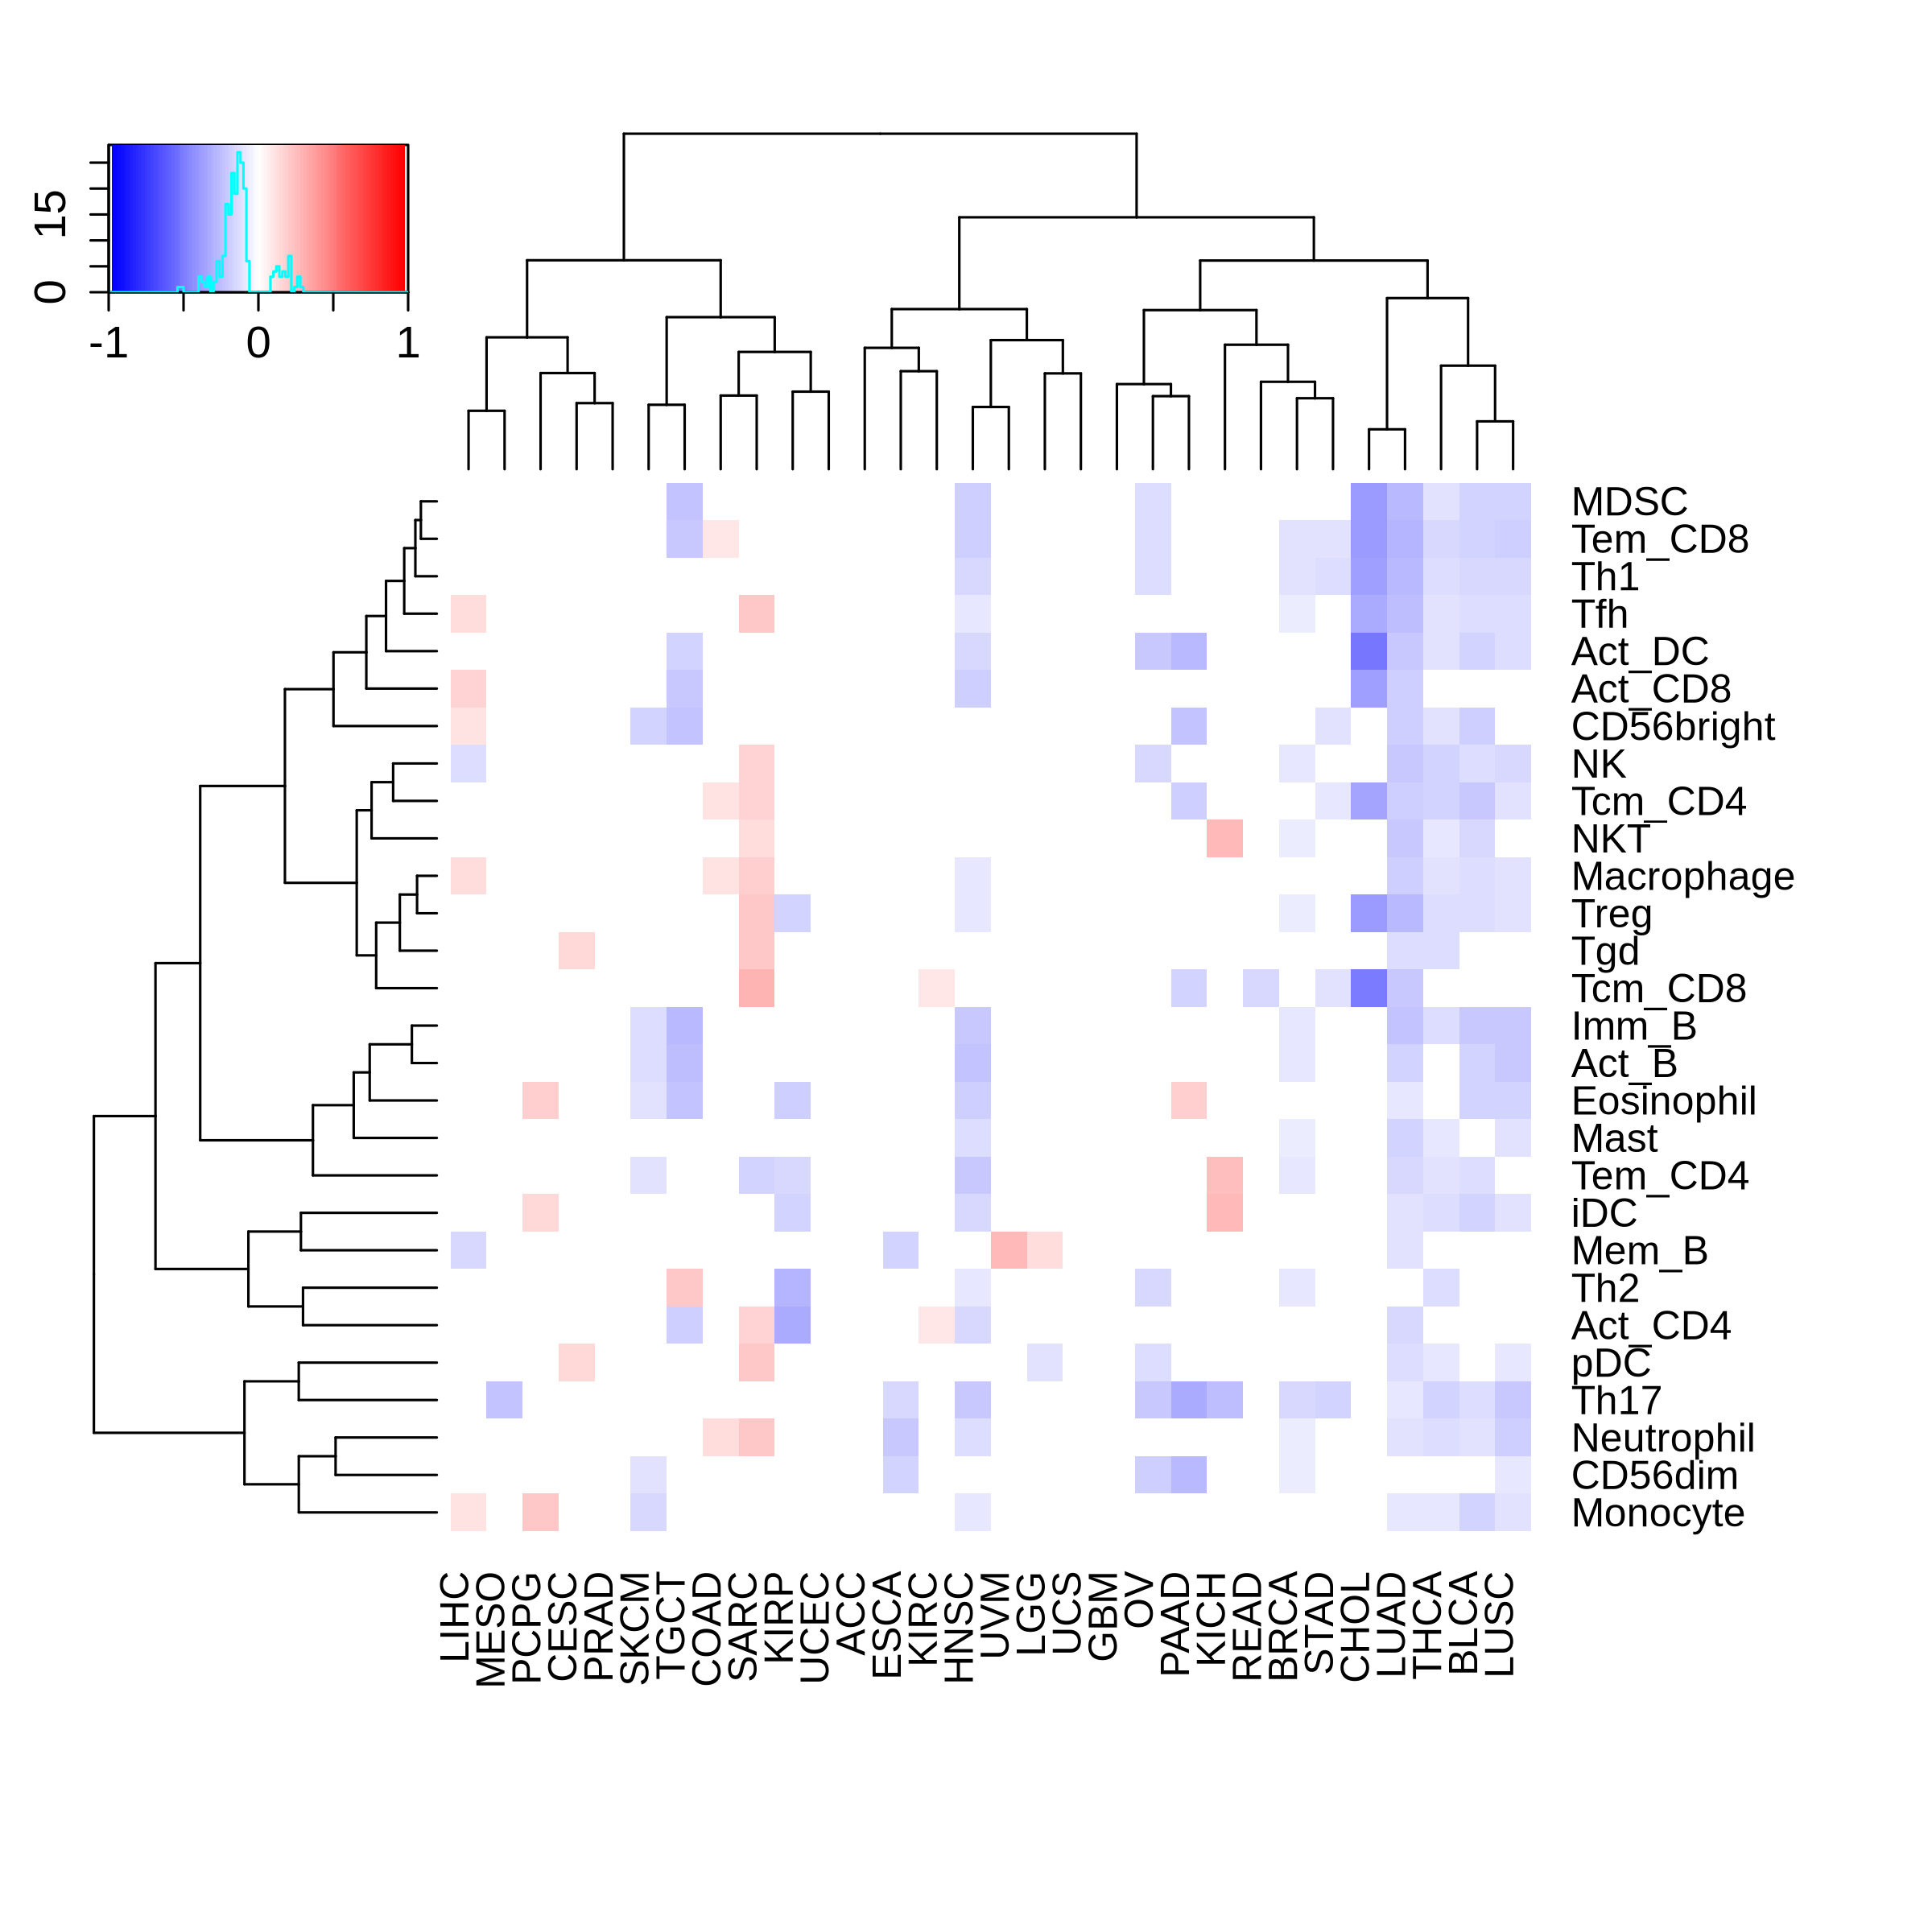 |
| Promoter methylation | Genebody methylation |
 | 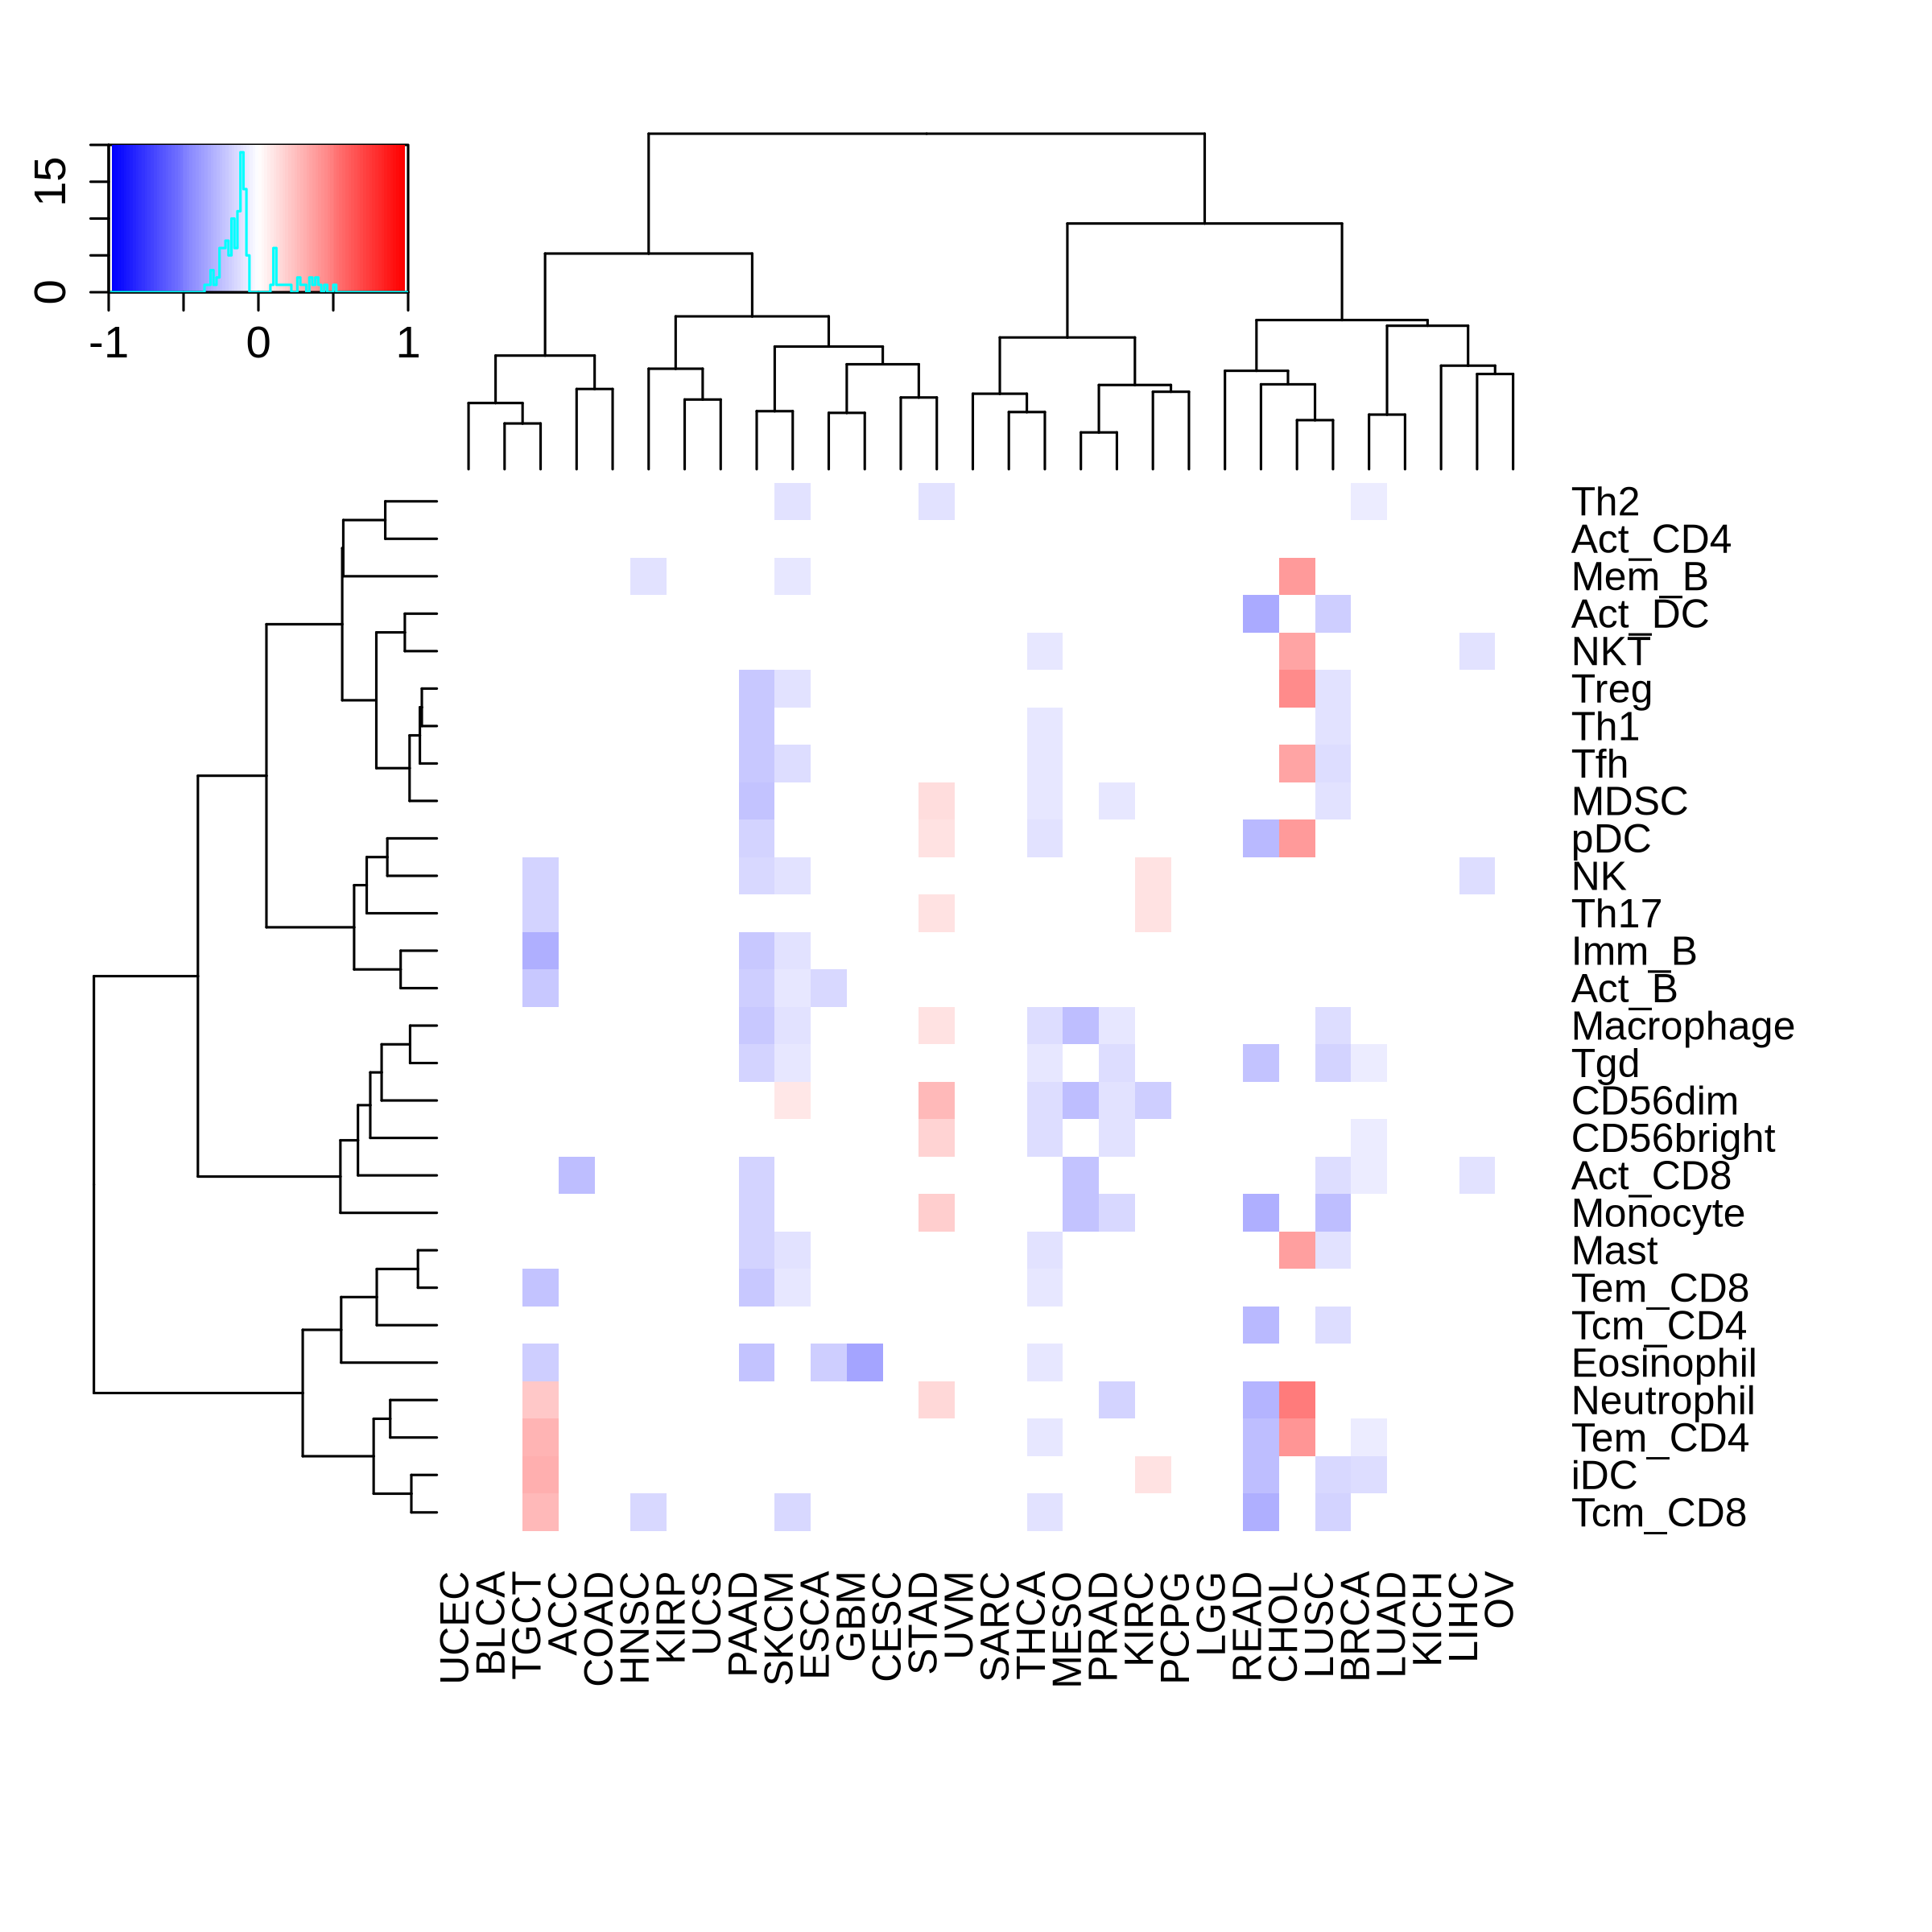 |
Top |
The association between C1QBP expression and immune subtypes/status |
Top |
Drugs targeting C1QBP and diseases related to C1QBP. |
| Drug-gene interaction | Disease-gene association |
No drugs targeting C1QBP. |  |
Top |
Survival analysis based on C1QBP expression |
Top |
| Reference |
| [1] Steele CD, Abbasi A, Islam SMA, et al. Signatures of copy number alterations in human cancer. Nature. 2022 Jun;606(7916):984-991. doi: 10.1038/s41586-022-04738-6. Epub 2022 Jun 15. PMID: 35705804; PMCID: PMC9242861. [2] Beibei Ru, Ching Ngar Wong, Yin Tong, et al. TISIDB: an integrated repository portal for tumor–immune system interactions, Bioinformatics, Volume 35, Issue 20, October 2019, Pages 4200–4202, https://doi.org/10.1093/bioinformatics/btz210. [3] Zhongyang Liu, Jiale Liu, Xinyue Liu, et al. CTR–DB, an omnibus for patient-derived gene expression signatures correlated with cancer drug response, Nucleic Acids Research, Volume 50, Issue D1, 7 January 2022, Pages D1184–D1199, https://doi.org/10.1093/nar/gkab860. [4] Charoentong P, Finotello F, Angelova M, et al. Pan-cancer Immunogenomic Analyses Reveal Genotype-Immunophenotype Relationships and Predictors of Response to Checkpoint Blockade. Cell Rep. 2017 Jan 3;18(1):248–262. doi: 10.1016/j.celrep.2016.12.019. PMID: 28052254. [5] Thorsson V, Gibbs DL, Brown SD, et al. The Immune Landscape of Cancer. Immunity. 2018 Apr 17;48(4):812-830.e14. doi: 10.1016/j.immuni.2018.03.023. Epub 2018 Apr 5. Erratum in: Immunity. 2019 Aug 20;51(2):411-412. doi: 10.1016/j.immuni.2019.08.004. PMID: 29628290; PMCID: PMC5982584. [6] Zapata L, Caravagna G, Williams MJ, et al. Immune selection determines tumor antigenicity and influences response to checkpoint inhibitors. Nat Genet. 2023 Mar;55(3):451-460. doi: 10.1038/s41588-023-01313-1. Epub 2023 Mar 9. PMID: 36894710; PMCID: PMC10011129. [7] Cortes-Ciriano I, Lee S, Park WY, et al. A molecular portrait of microsatellite instability across multiple cancers. Nat Commun. 2017 Jun 6;8:15180. doi: 10.1038/ncomms15180. PMID: 28585546; PMCID: PMC5467167. [8] Cannon M, Stevenson J, Stahl K, et al. DGIdb 5.0: rebuilding the drug-gene interaction database for precision medicine and drug discovery platforms. Nucleic Acids Res. 2024 Jan 5;52(D1):D1227-D1235. doi: 10.1093/nar/gkad1040. PMID: 37953380; PMCID: PMC10767982. [9] Grissa D, Junge A, Oprea TI, Jensen LJ. Diseases 2.0: a weekly updated database of disease-gene associations from text mining and data integration. Database (Oxford). 2022 Mar 28;2022:baac019. doi: 10.1093/database/baac019. PMID: 35348648; PMCID: PMC9216524. |

Copyright 2024-Present -The University of Texas Health Science Center at Houston |