|
|
||||||||
|
||||||||

Gene summary for RB1 |
| Gene Symbol | RB1 | Gene ID | 5925 |
| Gene name | RB transcriptional corepressor 1 |
| Synonyms | OSRC;RB;PPP1R130 |
| Type of gene | protein_coding |
| UniProtAcc | P06400 |
| GO ID | GO term |
| GO:0006357 | regulation of transcription by RNA polymerase II |
| GO:0051726 | regulation of cell cycle |
| GO:0007049 | cell cycle |
| GO:0080090 | regulation of primary metabolic process |
| GO:0006325 | chromatin organization |
| GO:0060255 | regulation of macromolecule metabolic process |
| GO:0051172 | negative regulation of nitrogen compound metabolic process |
| GO:0006355 | regulation of DNA-templated transcription |
| GO:0030154 | cell differentiation |
| GO:0045892 | negative regulation of DNA-templated transcription |
| GO:0030308 | negative regulation of cell growth |
| GO:0031175 | neuron projection development |
| GO:0120163 | negative regulation of cold-induced thermogenesis |
| GO:0000122 | negative regulation of transcription by RNA polymerase II |
| GO:0043433 | negative regulation of DNA-binding transcription factor activity |
| GO:0006338 | chromatin remodeling |
| GO:0006469 | negative regulation of protein kinase activity |
| GO:0050728 | negative regulation of inflammatory response |
| GO:2000134 | negative regulation of G1/S transition of mitotic cell cycle |
| GO:0003180 | aortic valve morphogenesis |
| GO:0031507 | heterochromatin formation |
| GO:0007265 | Ras protein signal transduction |
| GO:0010629 | negative regulation of gene expression |
| GO:2001234 | negative regulation of apoptotic signaling pathway |
| GO:1902948 | negative regulation of tau-protein kinase activity |
| GO:0045445 | myoblast differentiation |
| GO:2000679 | positive regulation of transcription regulatory region DNA binding |
| GO:0000082 | G1/S transition of mitotic cell cycle |
| GO:0001558 | regulation of cell growth |
| GO:0001894 | tissue homeostasis |
| GO:0002062 | chondrocyte differentiation |
| GO:0006366 | transcription by RNA polymerase II |
| GO:0006915 | apoptotic process |
| GO:0007224 | smoothened signaling pathway |
| GO:0007283 | spermatogenesis |
| GO:0007346 | regulation of mitotic cell cycle |
| GO:0008283 | cell population proliferation |
| GO:0008285 | negative regulation of cell population proliferation |
| GO:0014009 | glial cell proliferation |
| GO:0030182 | neuron differentiation |
| GO:0031134 | sister chromatid biorientation |
| GO:0032869 | cellular response to insulin stimulus |
| GO:0034088 | maintenance of mitotic sister chromatid cohesion |
| GO:0034349 | glial cell apoptotic process |
| GO:0035914 | skeletal muscle cell differentiation |
| GO:0042551 | neuron maturation |
| GO:0043353 | enucleate erythrocyte differentiation |
| GO:0043550 | regulation of lipid kinase activity |
| GO:0045651 | positive regulation of macrophage differentiation |
| GO:0045786 | negative regulation of cell cycle |
| GO:0045842 | positive regulation of mitotic metaphase/anaphase transition |
| GO:0045879 | negative regulation of smoothened signaling pathway |
| GO:0045930 | negative regulation of mitotic cell cycle |
| GO:0045944 | positive regulation of transcription by RNA polymerase II |
| GO:0048565 | digestive tract development |
| GO:0048667 | cell morphogenesis involved in neuron differentiation |
| GO:0050673 | epithelial cell proliferation |
| GO:0050680 | negative regulation of epithelial cell proliferation |
| GO:0051146 | striated muscle cell differentiation |
| GO:0051276 | chromosome organization |
| GO:0051301 | cell division |
| GO:0051402 | neuron apoptotic process |
| GO:0060253 | negative regulation of glial cell proliferation |
| GO:0071459 | protein localization to chromosome, centromeric region |
| GO:0071466 | cellular response to xenobiotic stimulus |
| GO:0071901 | negative regulation of protein serine/threonine kinase activity |
| GO:0090230 | regulation of centromere complex assembly |
| GO:0097284 | hepatocyte apoptotic process |
| GO:1903055 | positive regulation of extracellular matrix organization |
| GO:1903944 | negative regulation of hepatocyte apoptotic process |
| GO:1904028 | positive regulation of collagen fibril organization |
| GO:1904761 | negative regulation of myofibroblast differentiation |
| GO:2000045 | regulation of G1/S transition of mitotic cell cycle |
| GO:0008150 | biological_process |
Top |
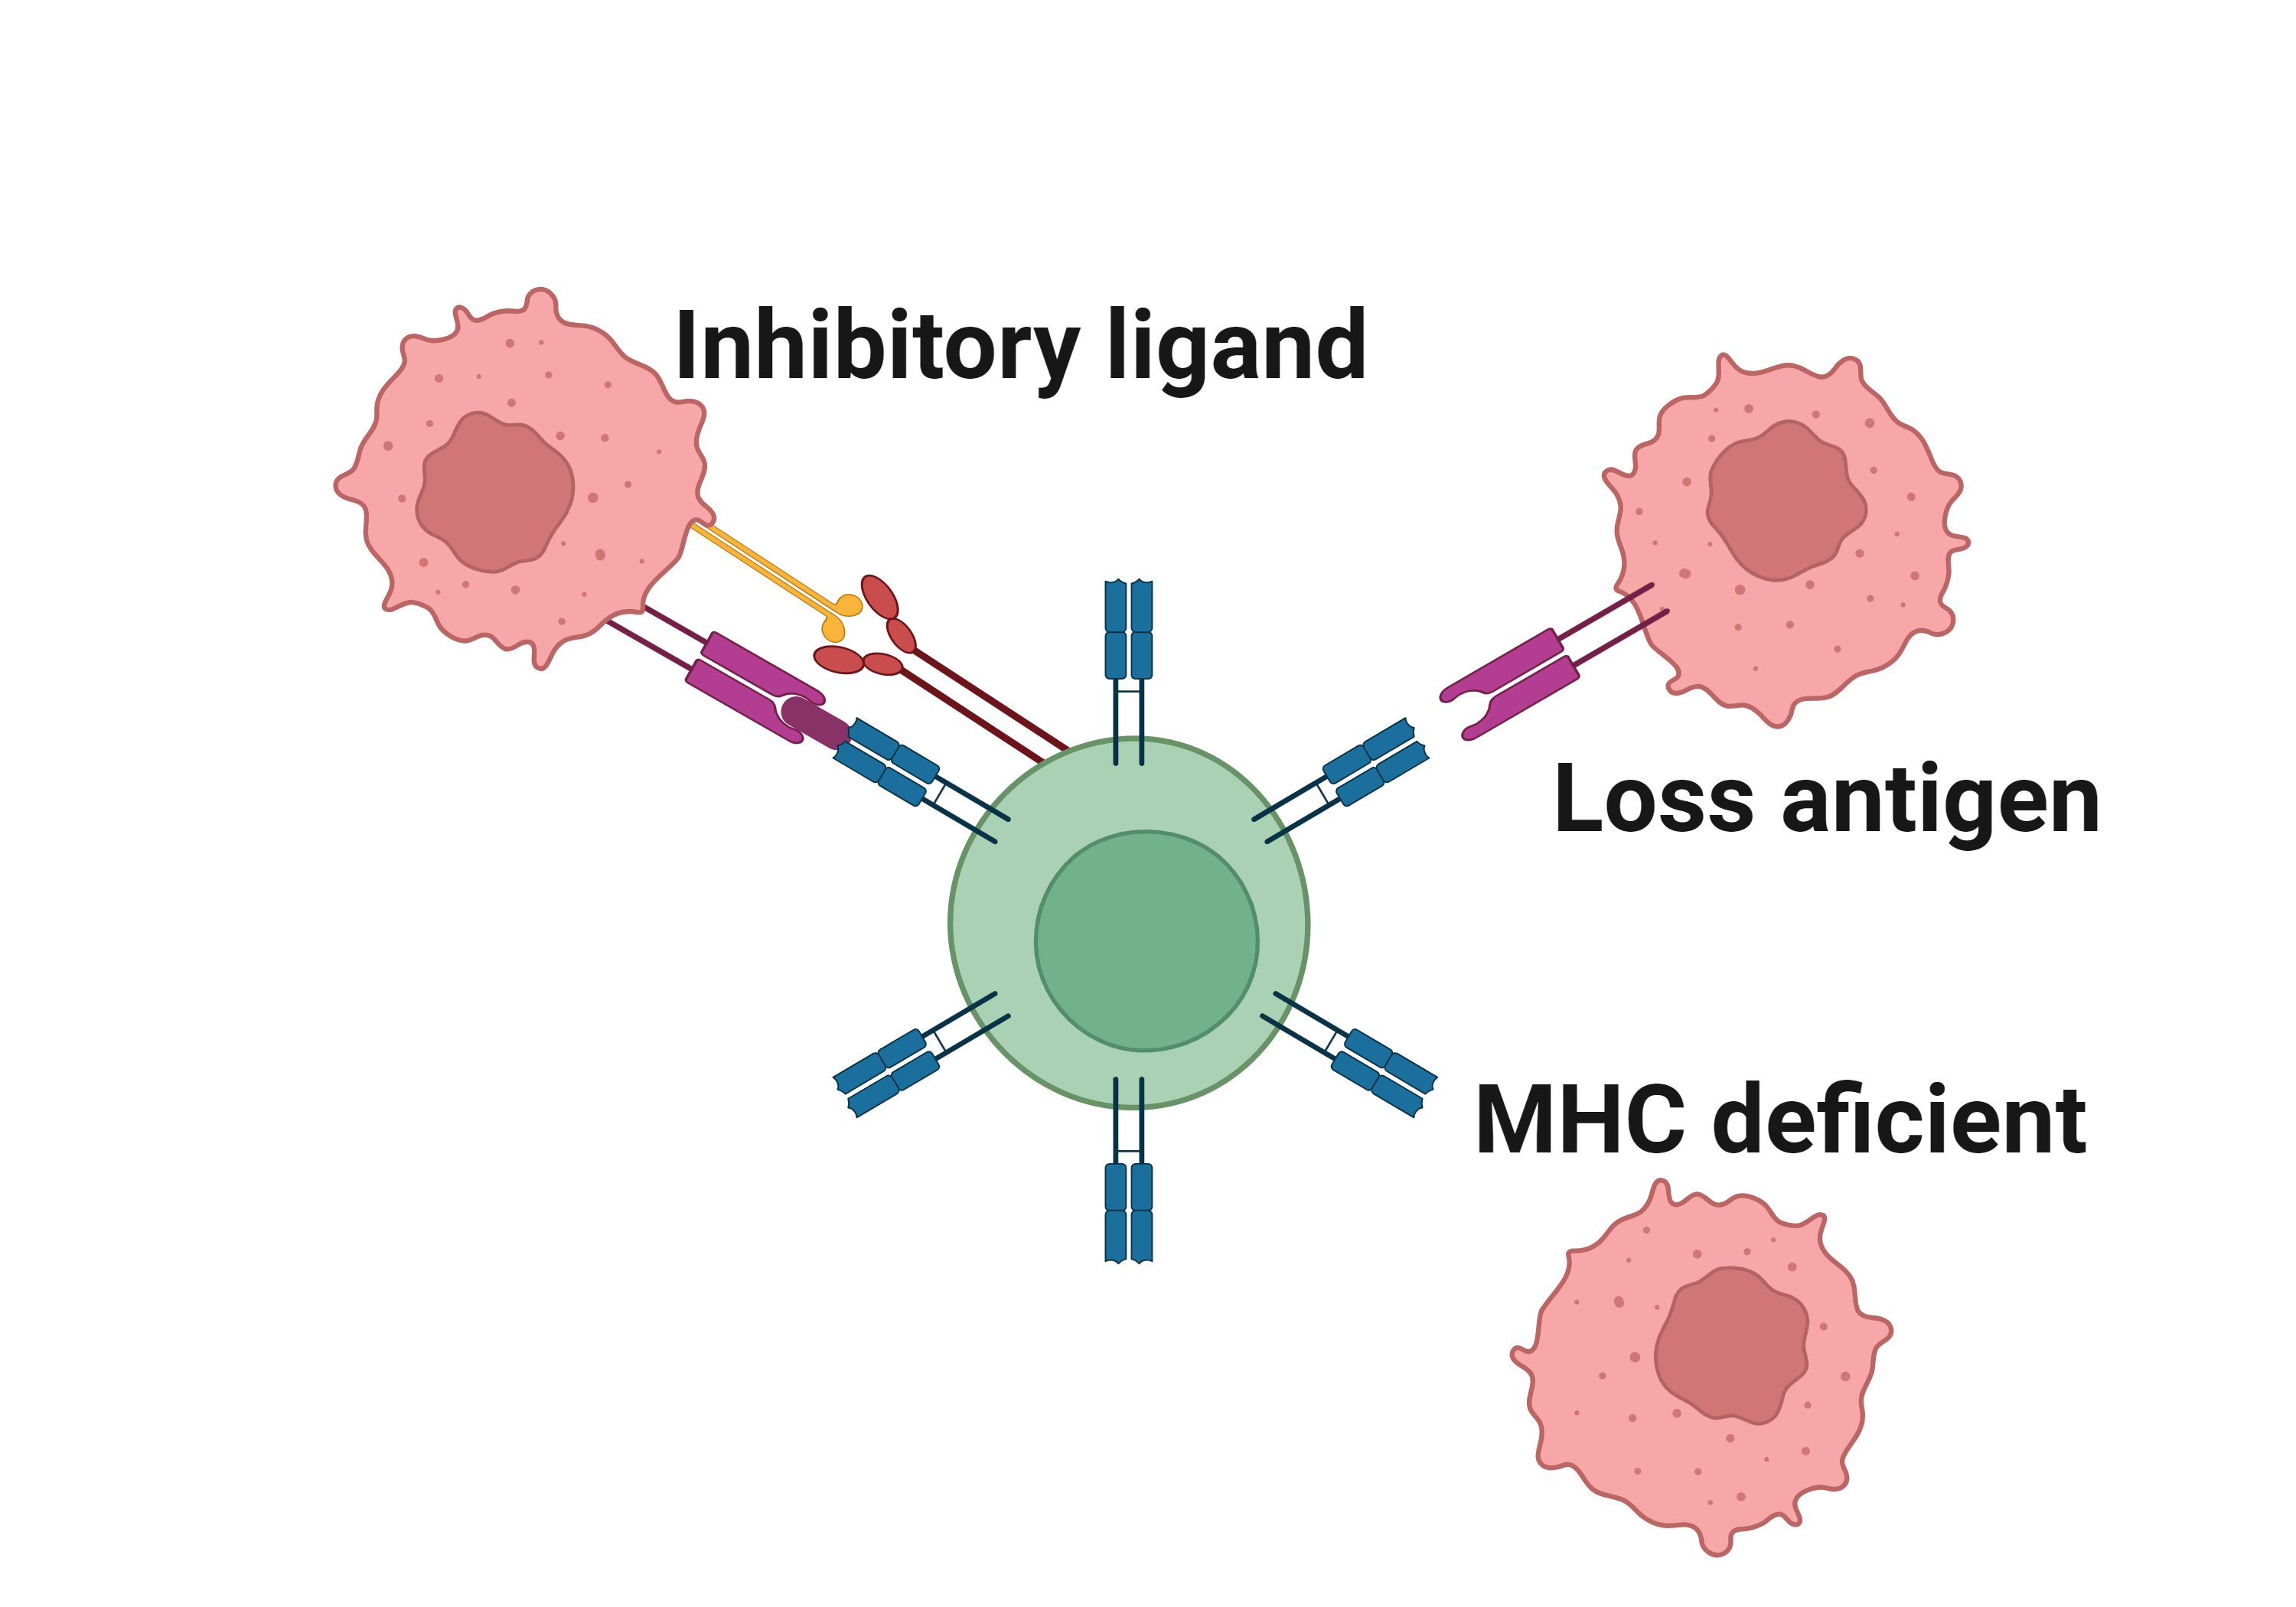
Literatures describing the association of RB1 and immune escape mechanisms |
Top |
Comparison of the RB1 expression level between tumor and normal groups |
Top |
Comparison of the RB1 methylation level between tumor and normal groups |
No significant differences were found in RB1 methylation in promoter region.
No significant differences were found in RB1 methylation in genebody region.
Top |
Summary of the copy number in TCGA tumor samples |
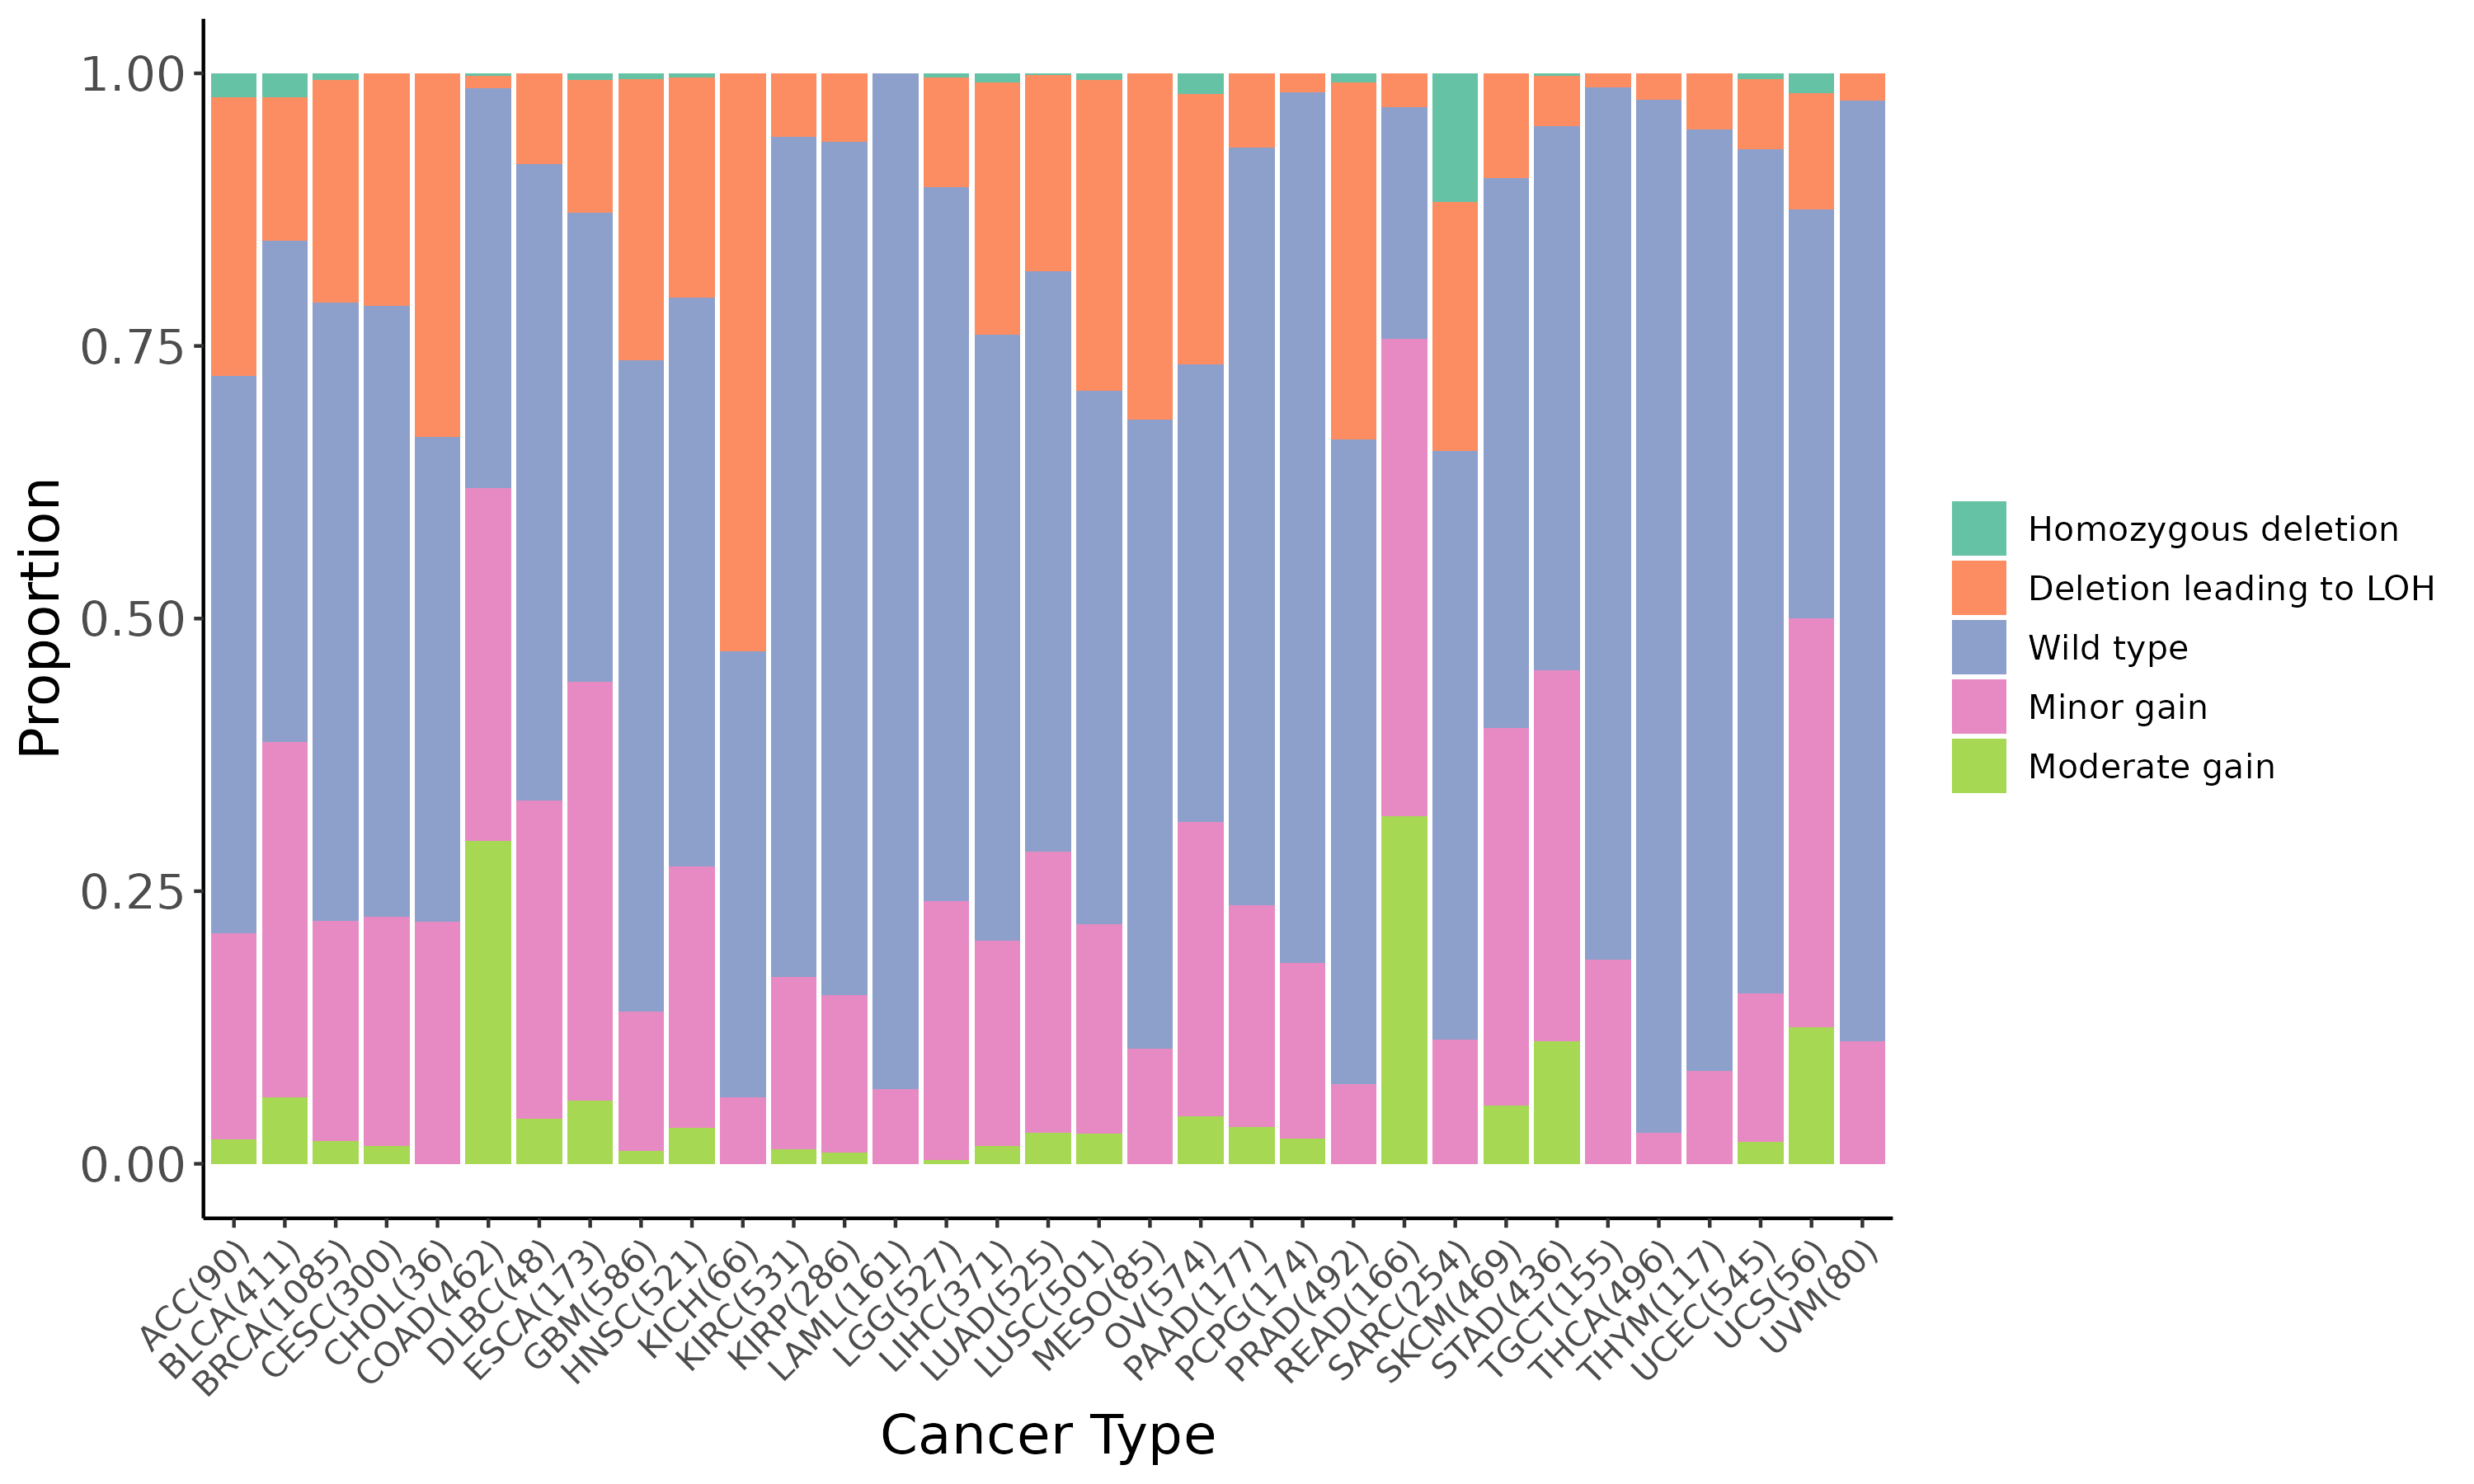 |
Top |
DEGs and the enrichment analysis between the mutated and wild type groups |
| Gene ID | Symbol | Log2 Fold Change | P-value | Adjusted P-value |
|---|---|---|---|---|
| ENSG00000251675 | CTC-458I2.2 | -1.03e+00 | 2.55e-06 | 4.74e-05 |
| ENSG00000257302 | FAHD2P1 | -1.90e+00 | 1.53e-07 | 4.74e-06 |
| ENSG00000223850 | MYCNUT | -2.45e+00 | 2.55e-06 | 4.74e-05 |
| ENSG00000142606 | MMEL1 | -1.01e+00 | 2.56e-06 | 4.76e-05 |
| ENSG00000277440 | RP11-295D4.5 | -1.26e+00 | 3.44e-11 | 4.76e-09 |
| ENSG00000105695 | MAG | 1.54e+00 | 2.59e-06 | 4.79e-05 |
| ENSG00000196534 | OR9K1P | -1.99e+00 | 2.59e-06 | 4.79e-05 |
| ENSG00000200795 | RNU4-1 | -1.56e+00 | 2.59e-06 | 4.79e-05 |
| ENSG00000254266 | PKIA-AS1 | -1.44e+00 | 5.62e-10 | 4.80e-08 |
| ENSG00000165383 | LRRC18 | -1.48e+00 | 2.60e-06 | 4.81e-05 |
| ENSG00000138115 | CYP2C8 | -1.37e+00 | 1.56e-07 | 4.82e-06 |
| ENSG00000144834 | TAGLN3 | 2.24e+00 | 3.53e-11 | 4.84e-09 |
| ENSG00000257906 | RP1-90J4.1 | -1.10e+00 | 3.53e-11 | 4.84e-09 |
| ENSG00000129951 | PLPPR3 | -1.91e+00 | 9.22e-09 | 4.86e-07 |
| ENSG00000287313 | NA | 1.85e+00 | 2.64e-06 | 4.86e-05 |
| ENSG00000269514 | RP11-370I10.12 | -1.48e+00 | 3.56e-11 | 4.88e-09 |
| ENSG00000174827 | PDZK1 | 1.39e+00 | 1.58e-07 | 4.89e-06 |
| ENSG00000286538 | NA | -1.62e+00 | 2.65e-06 | 4.89e-05 |
| ENSG00000260337 | RP11-386M24.6 | -1.74e+00 | 1.59e-07 | 4.90e-06 |
| ENSG00000261730 | RP4-668J24.2 | -1.28e+00 | 2.66e-06 | 4.90e-05 |
| Page: 1 2 ... 142 143 144 145 146 ... 163 164 |
Up-regulated Hallmark pathways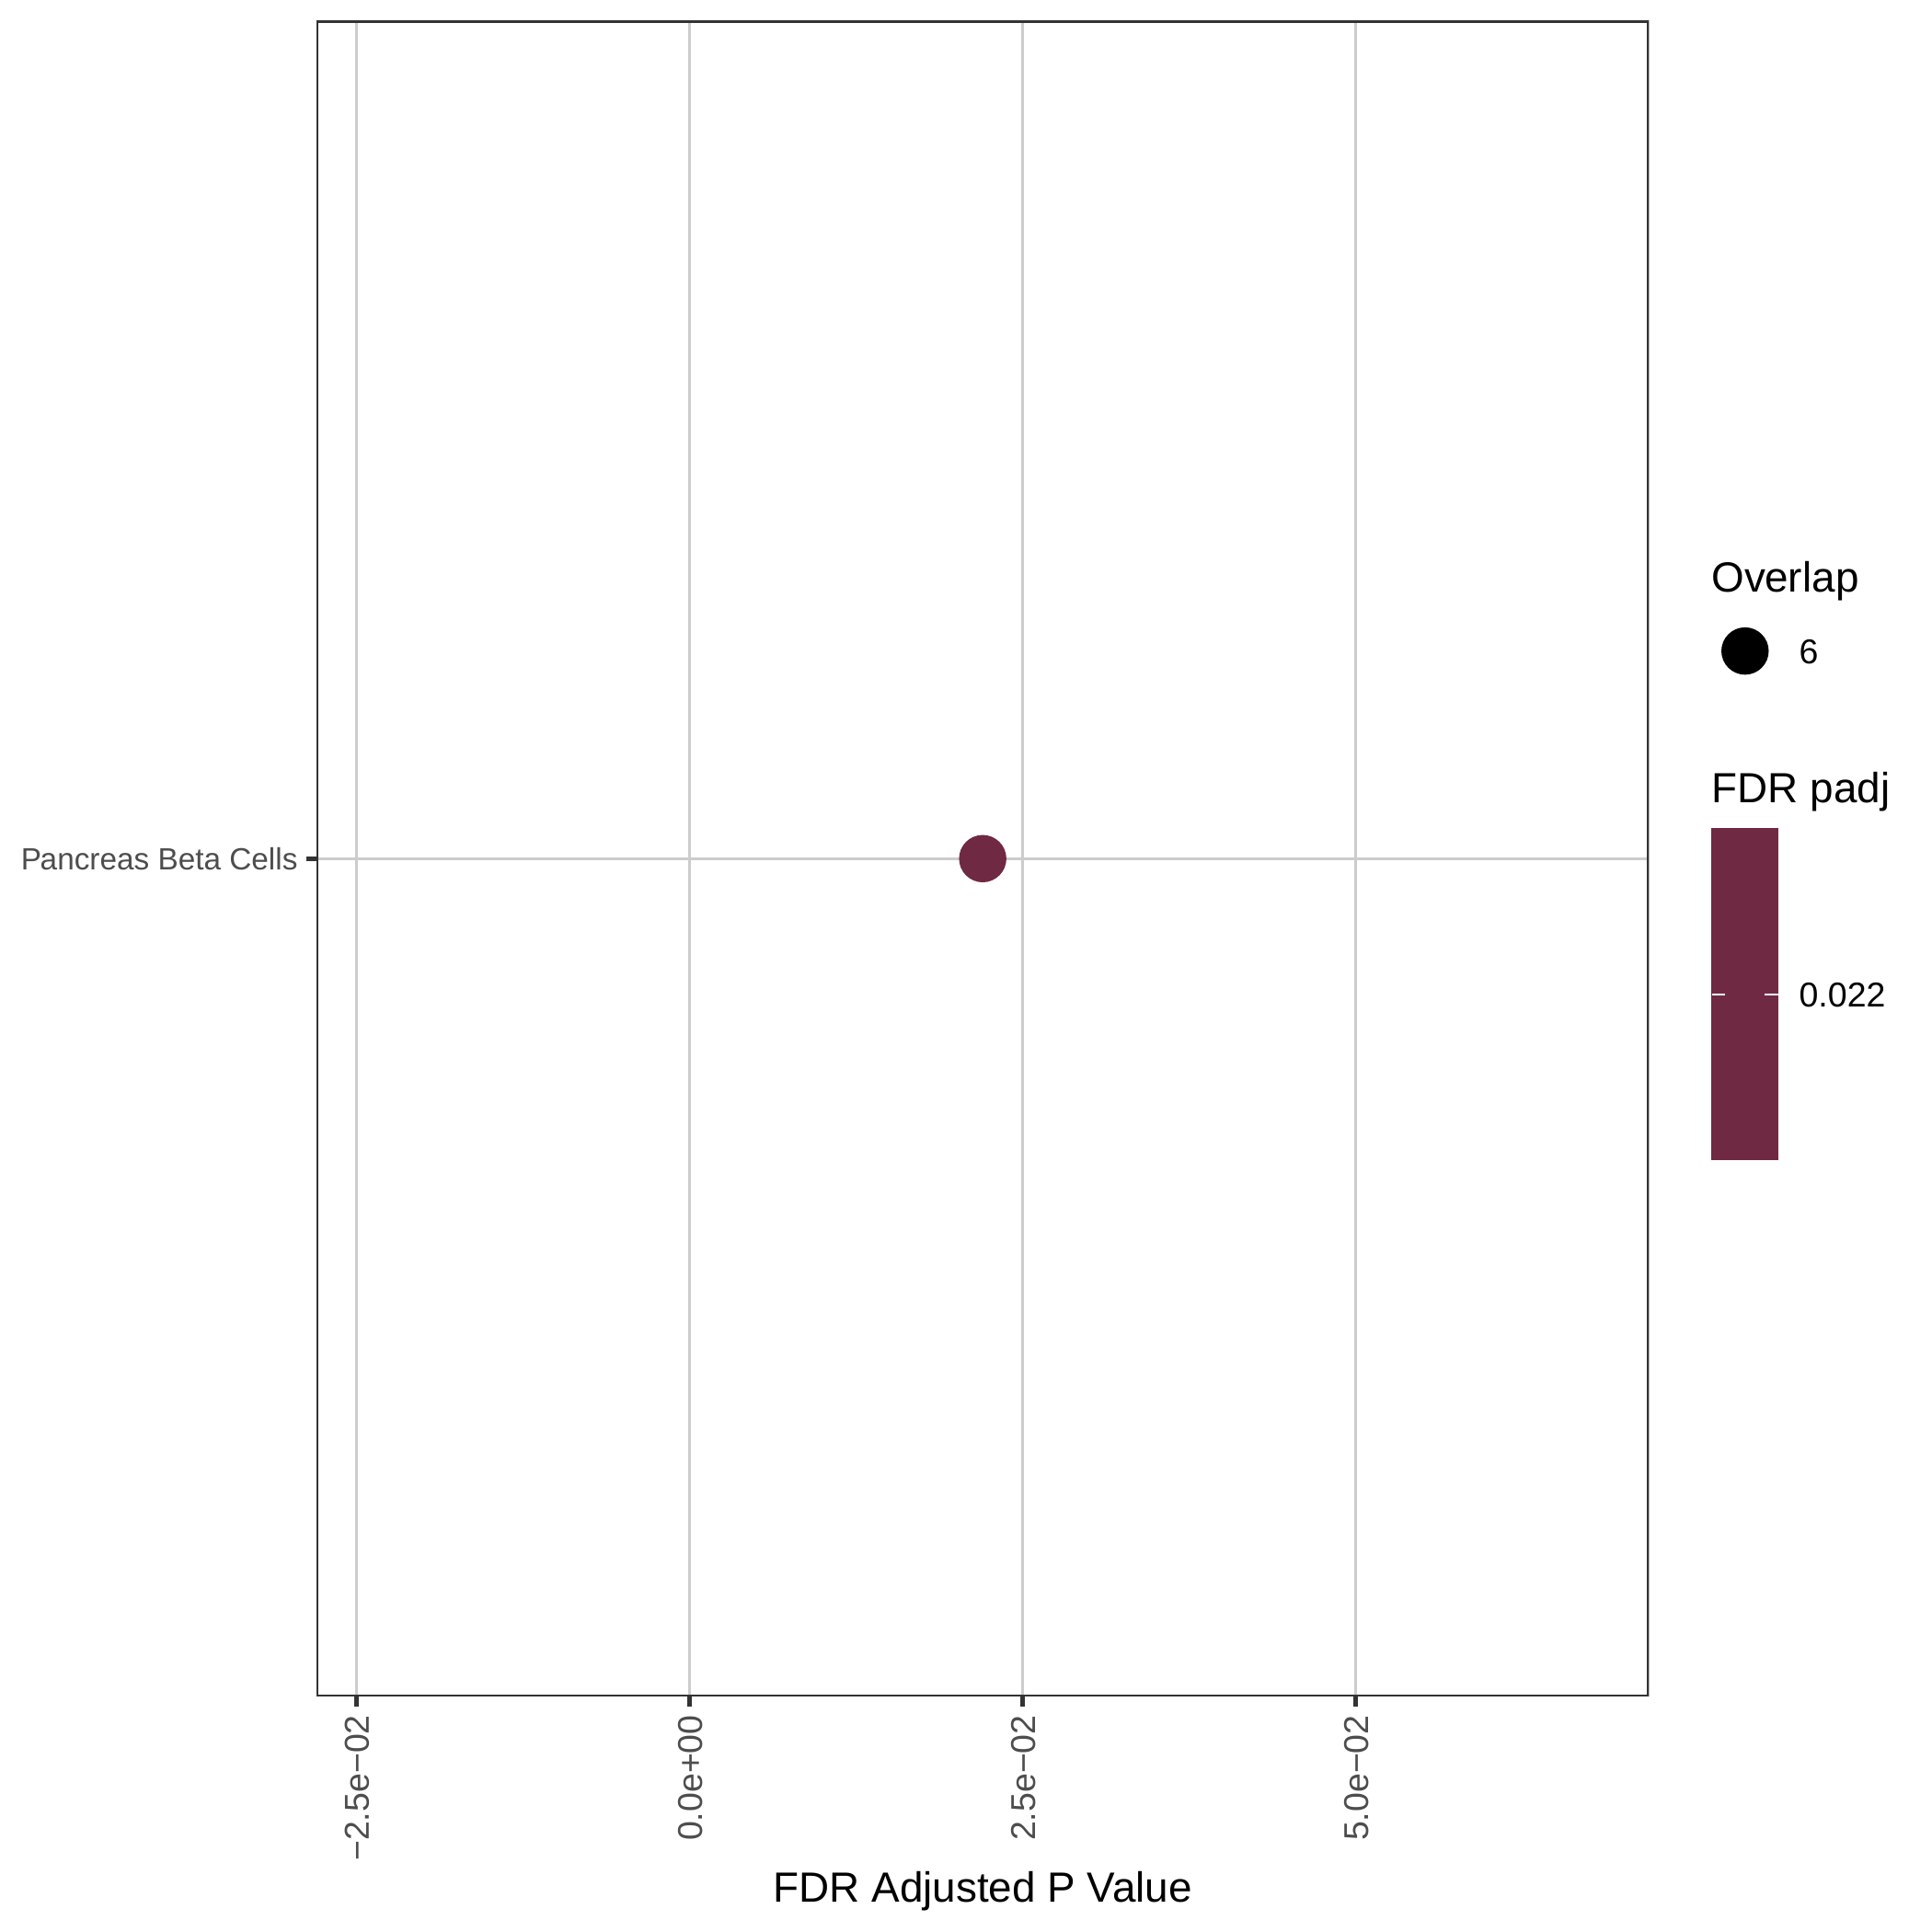 |
Down-regulated KEGG pathways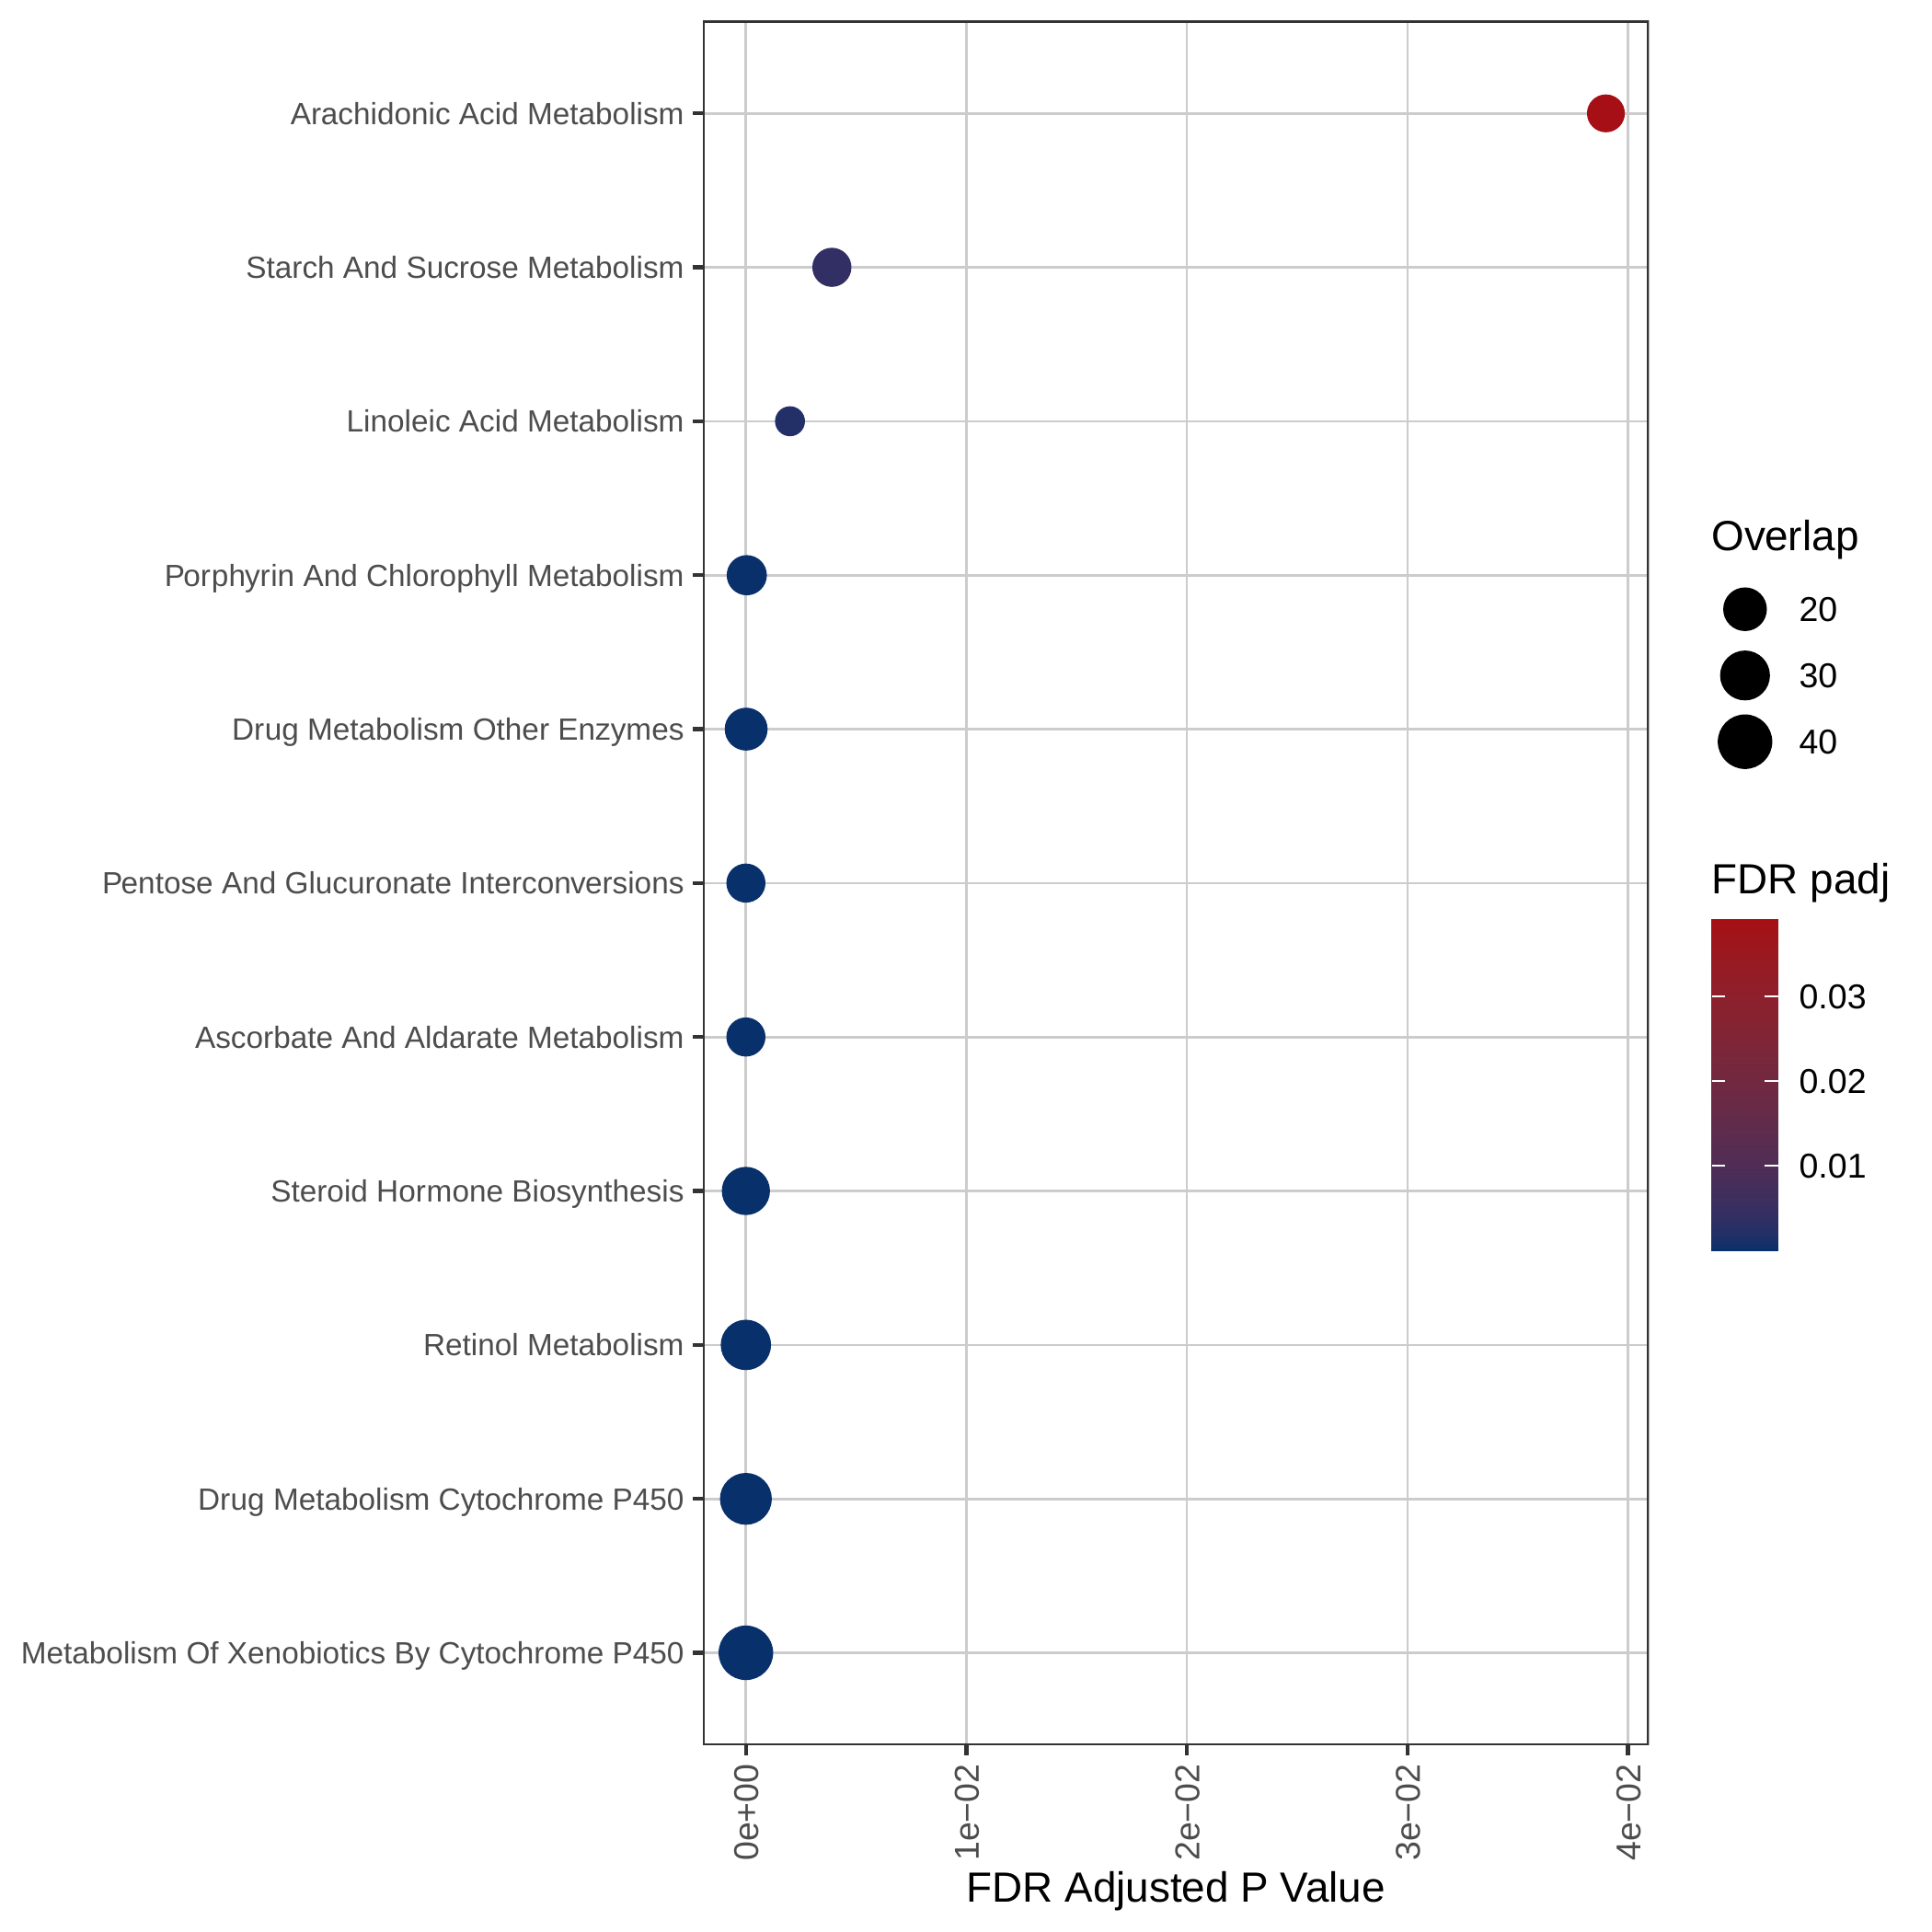 | Down-regulated GOBP pathways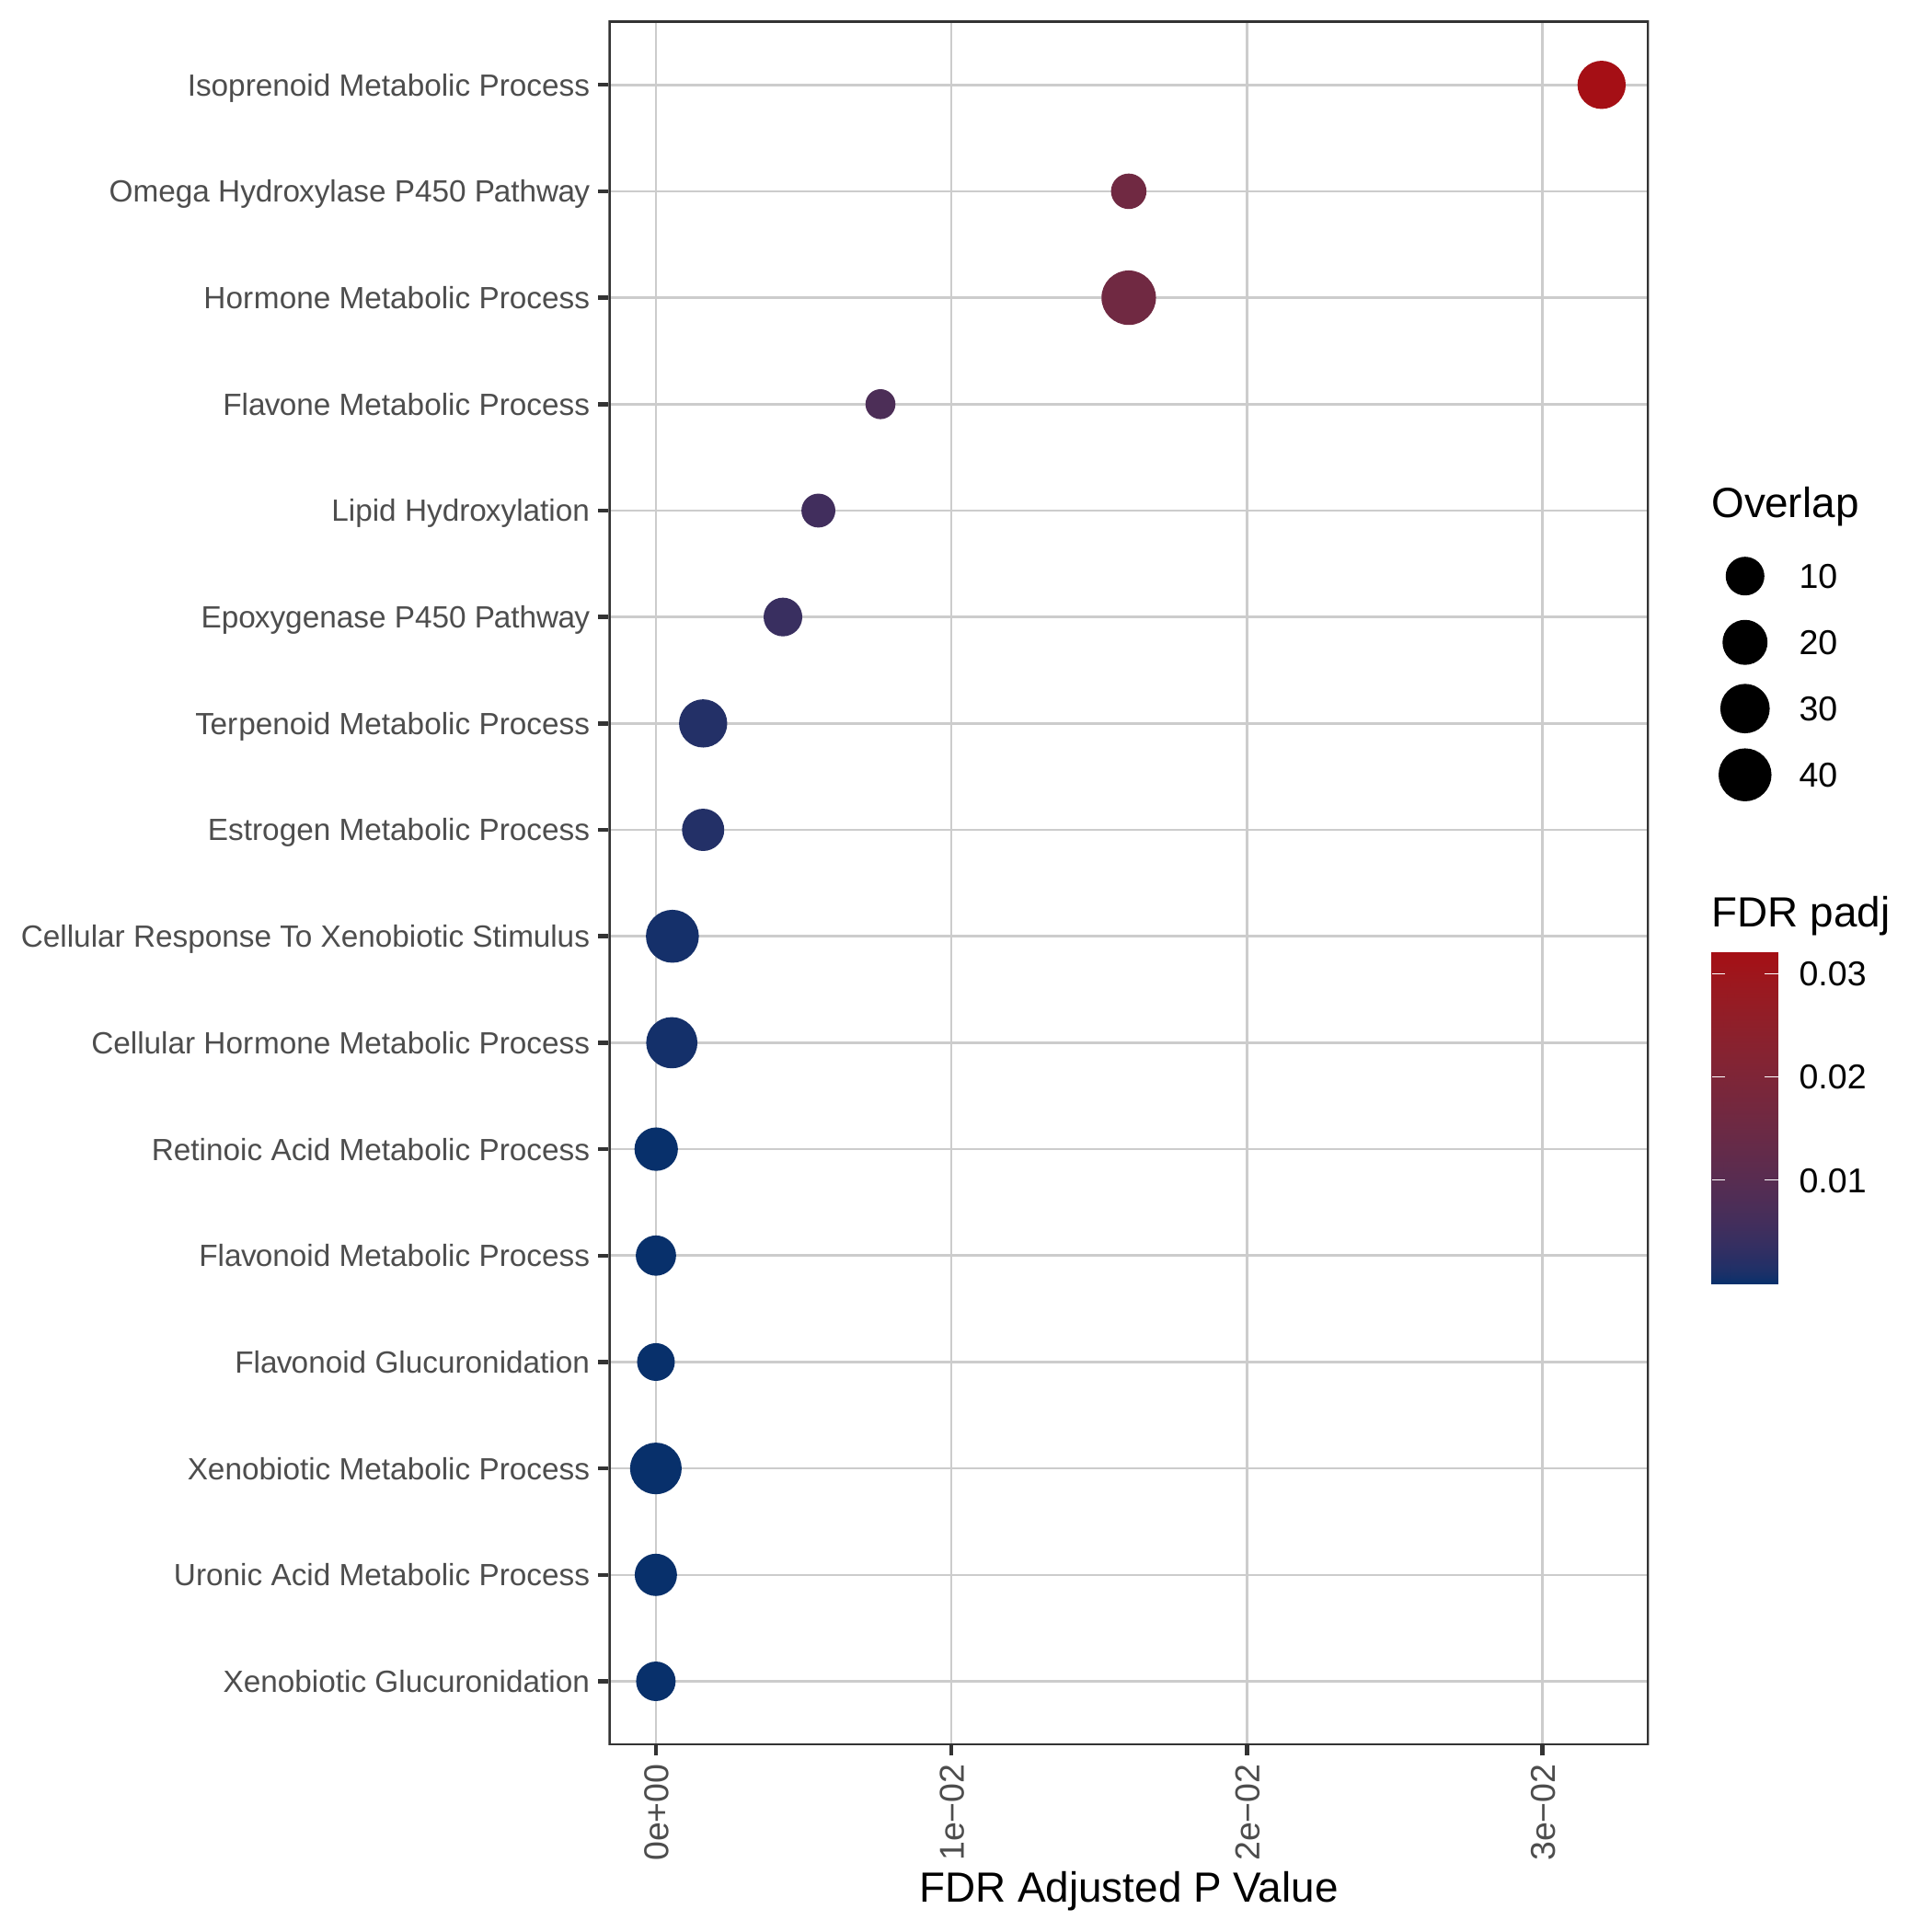 |
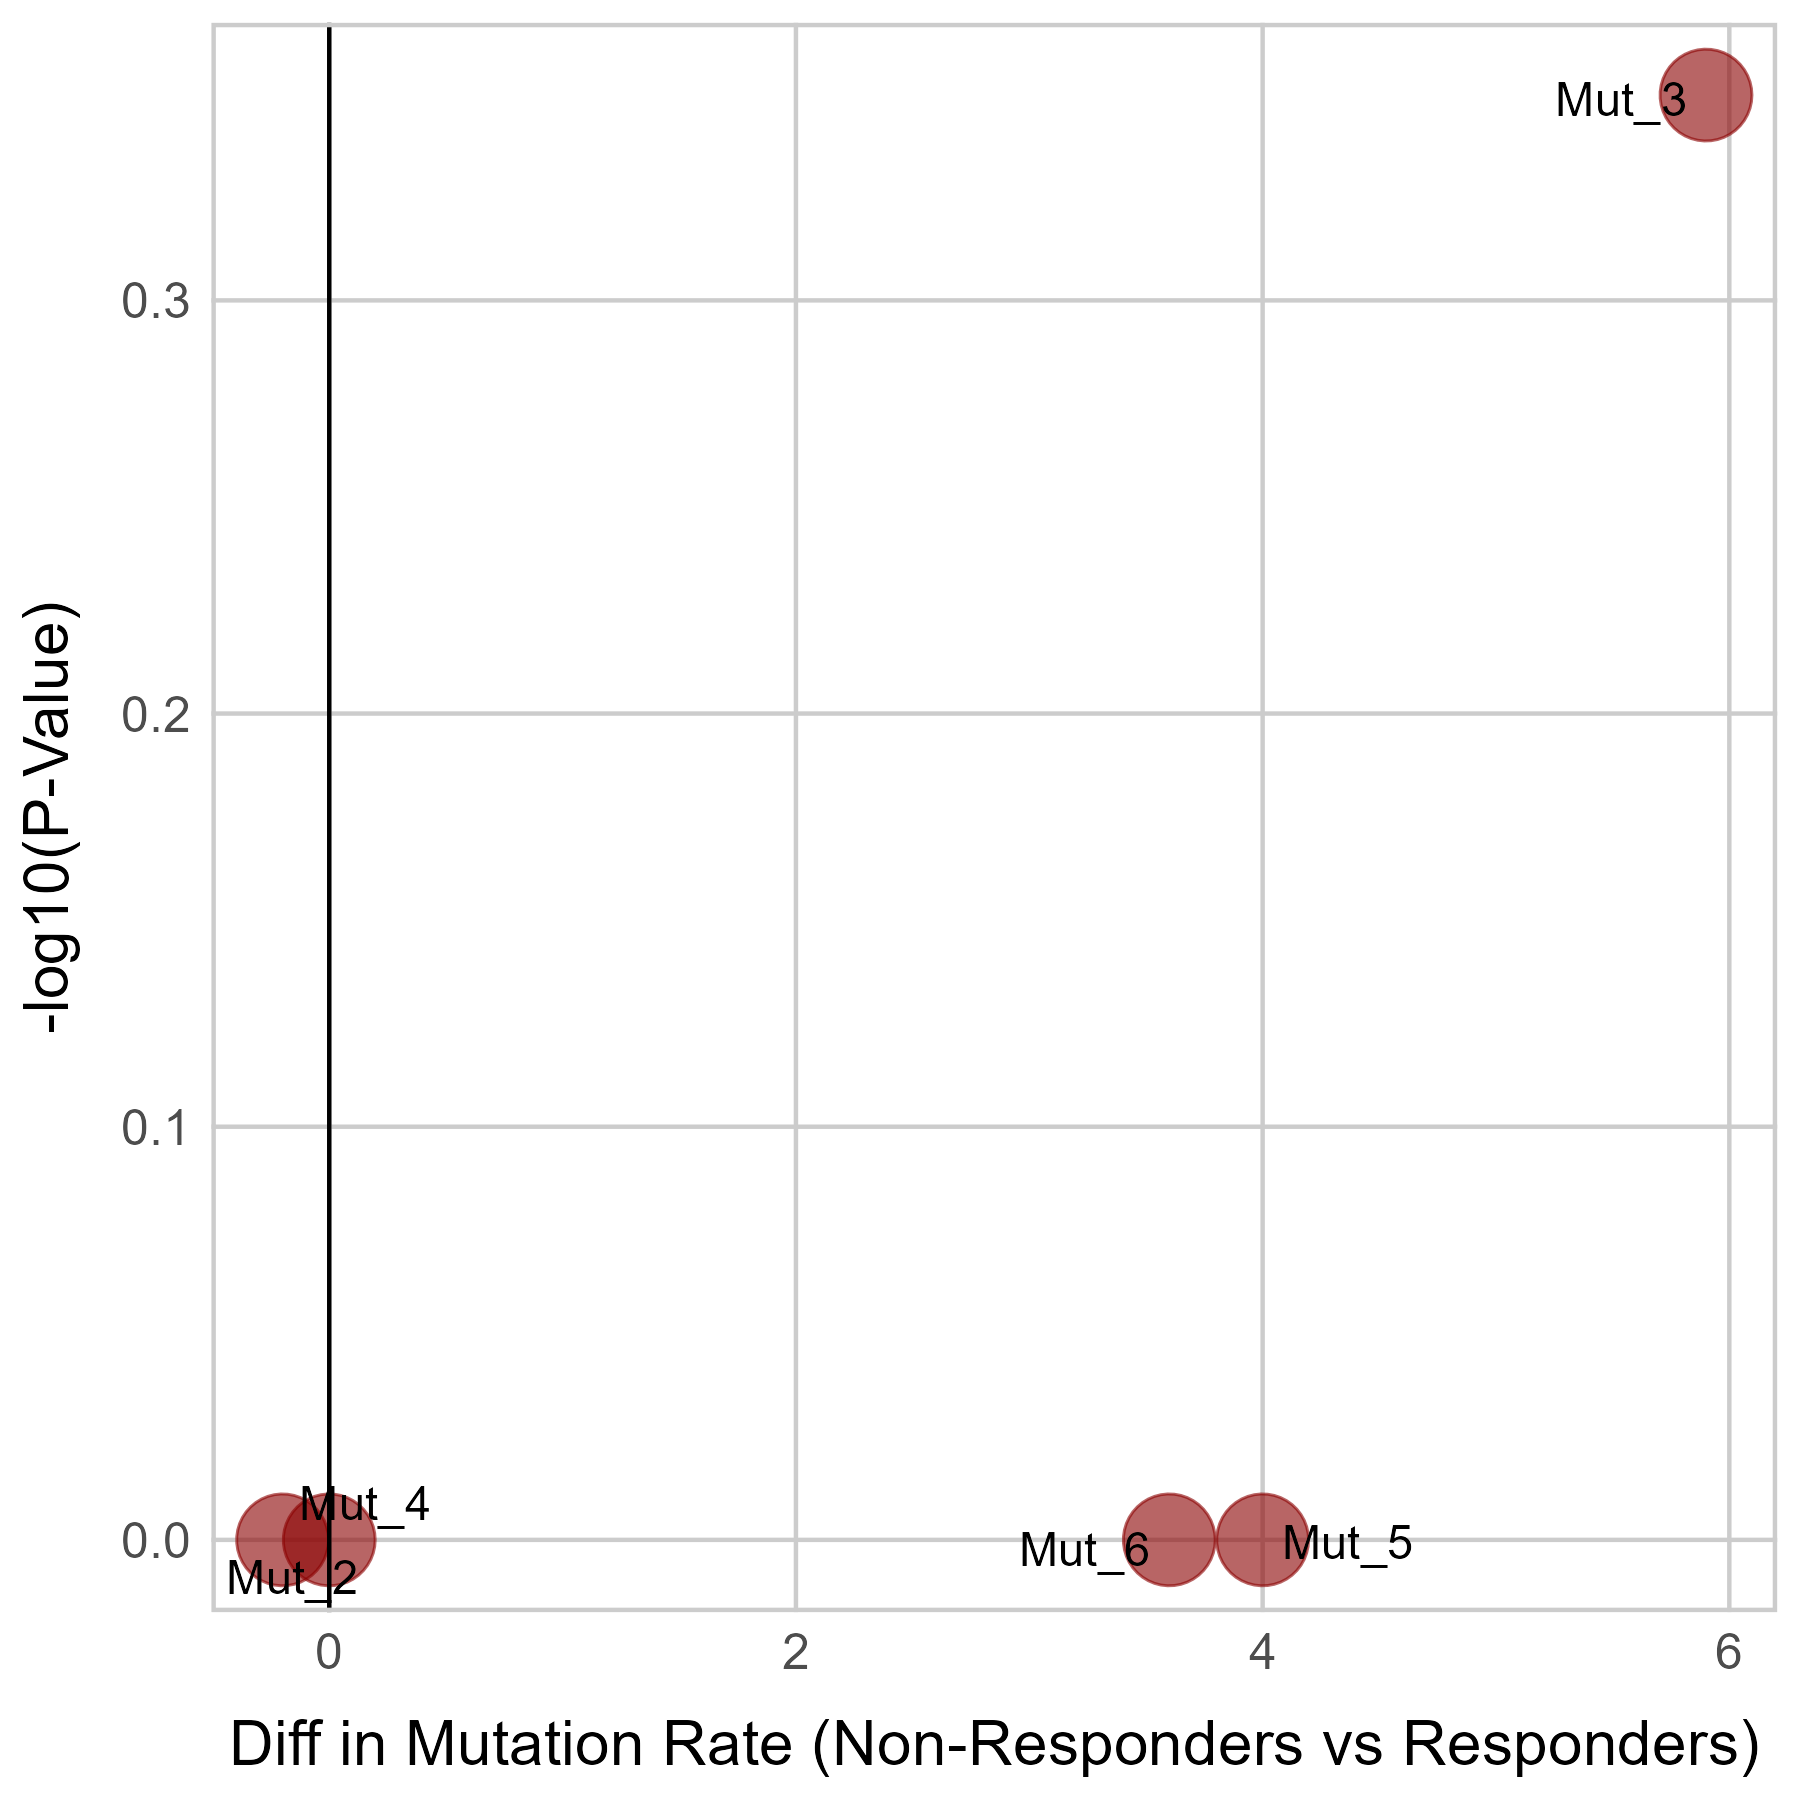
Gene expression and mutation differences between non-responders and responders after immunotherapy |
| Expression | Mutation |
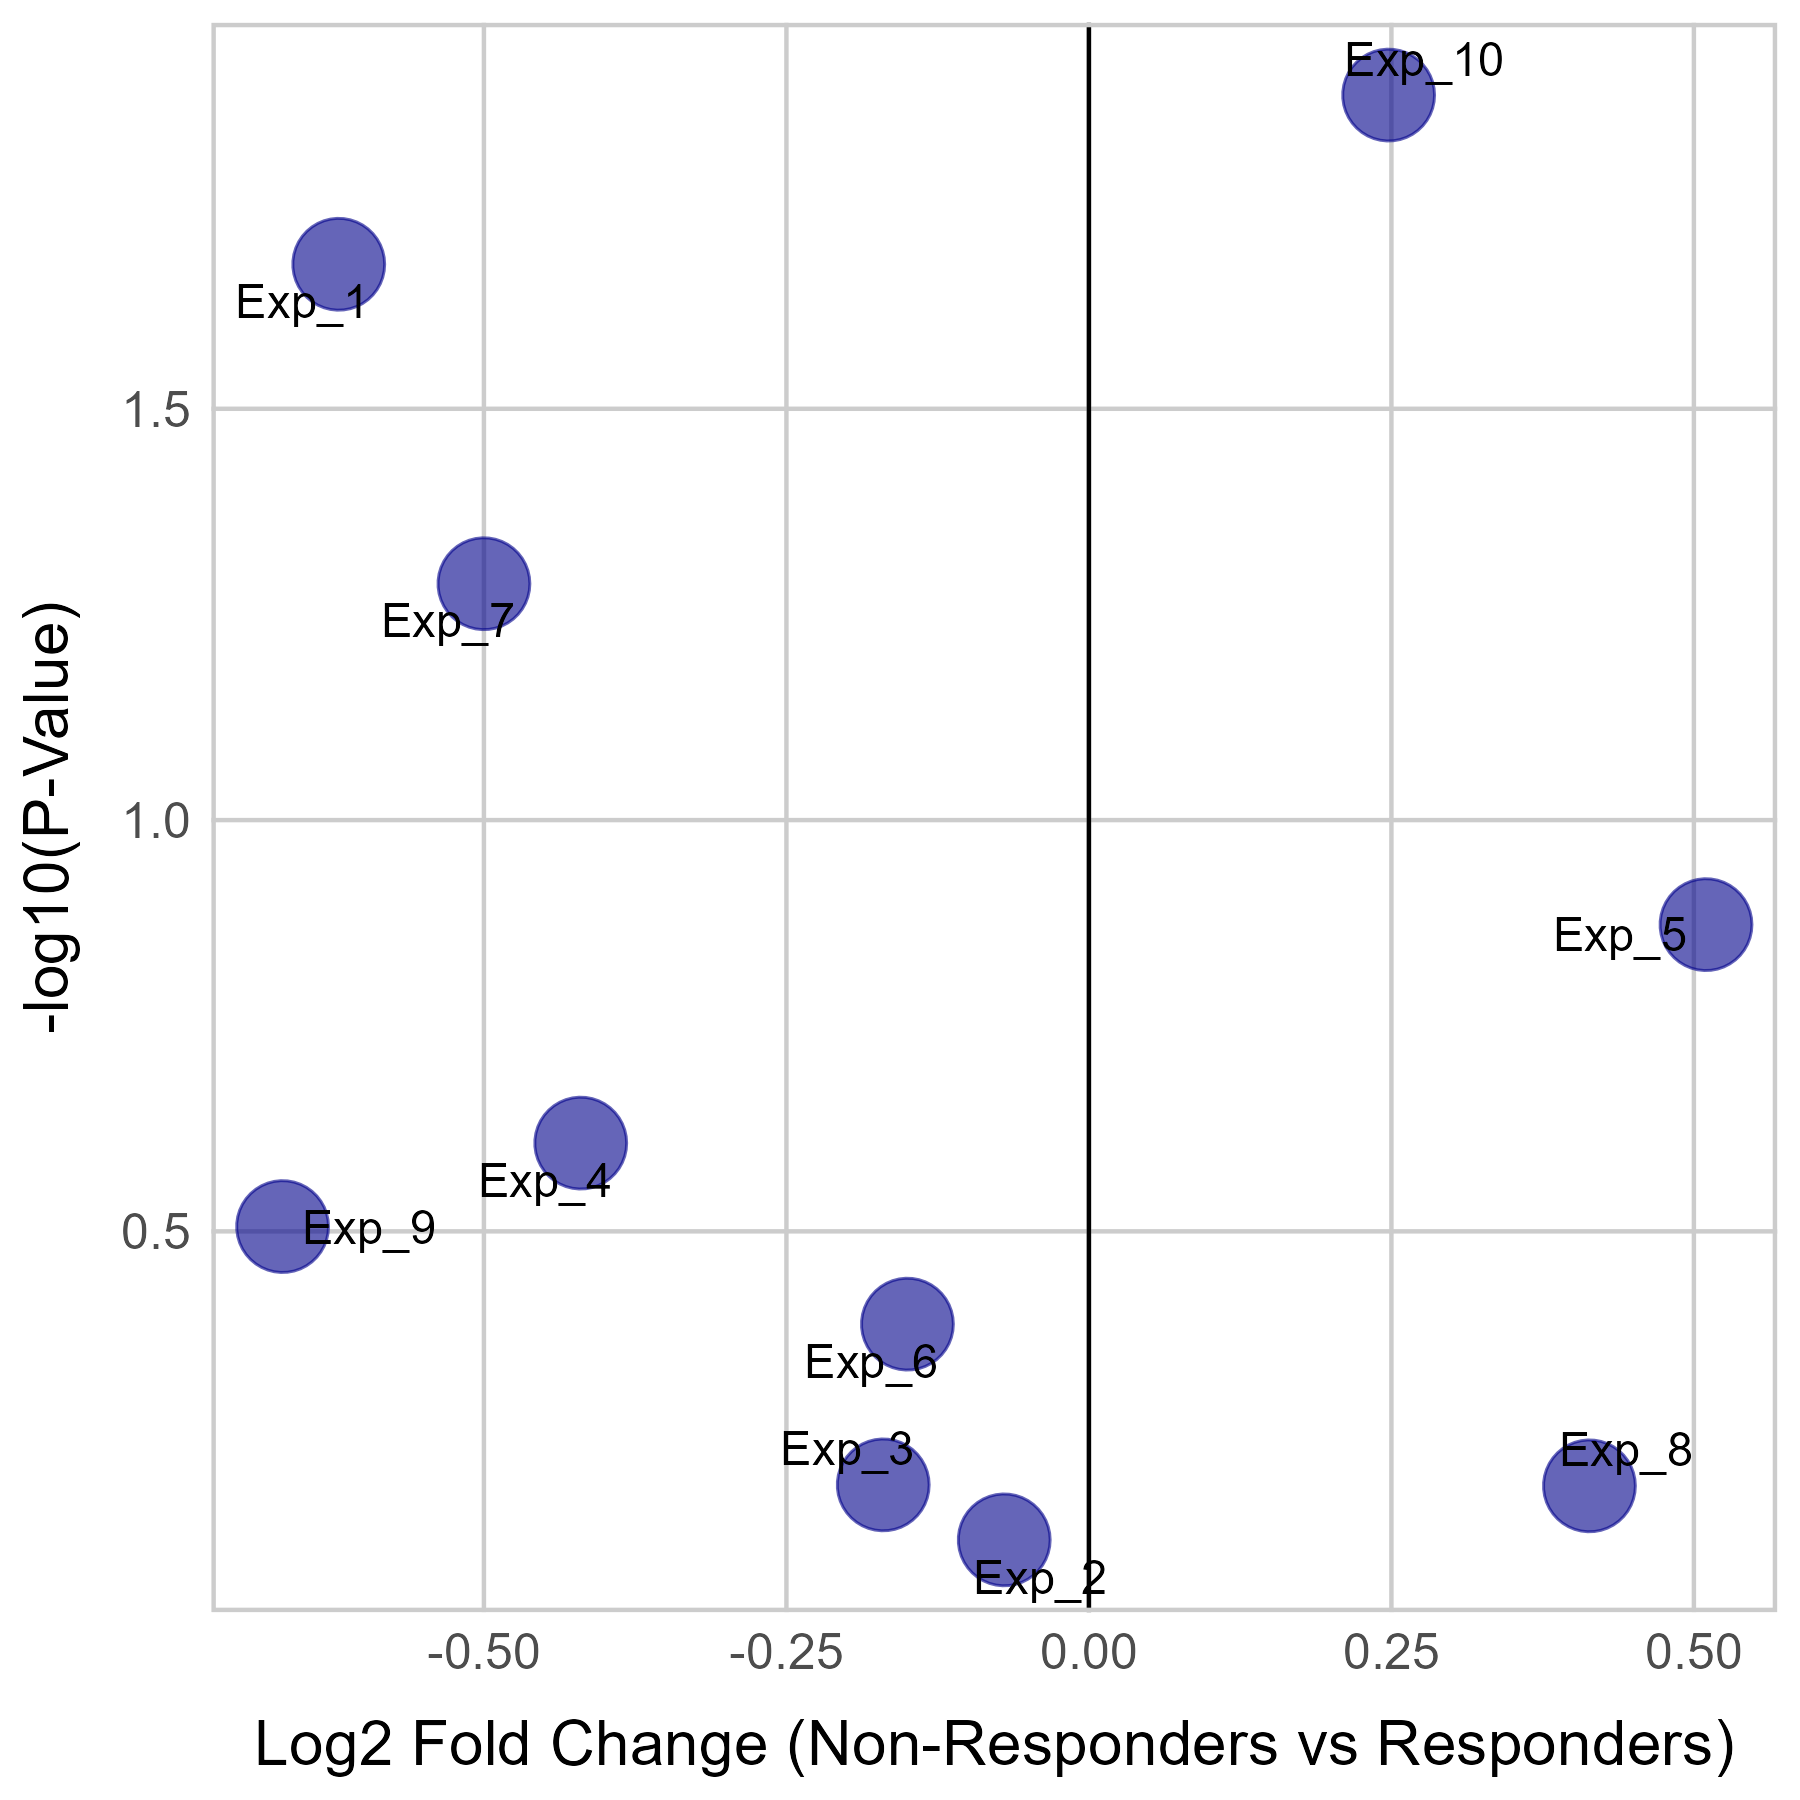 |  |
No significant differences were found in RB1 expression.
No significant differences were found in RB1 mutation.
Top |
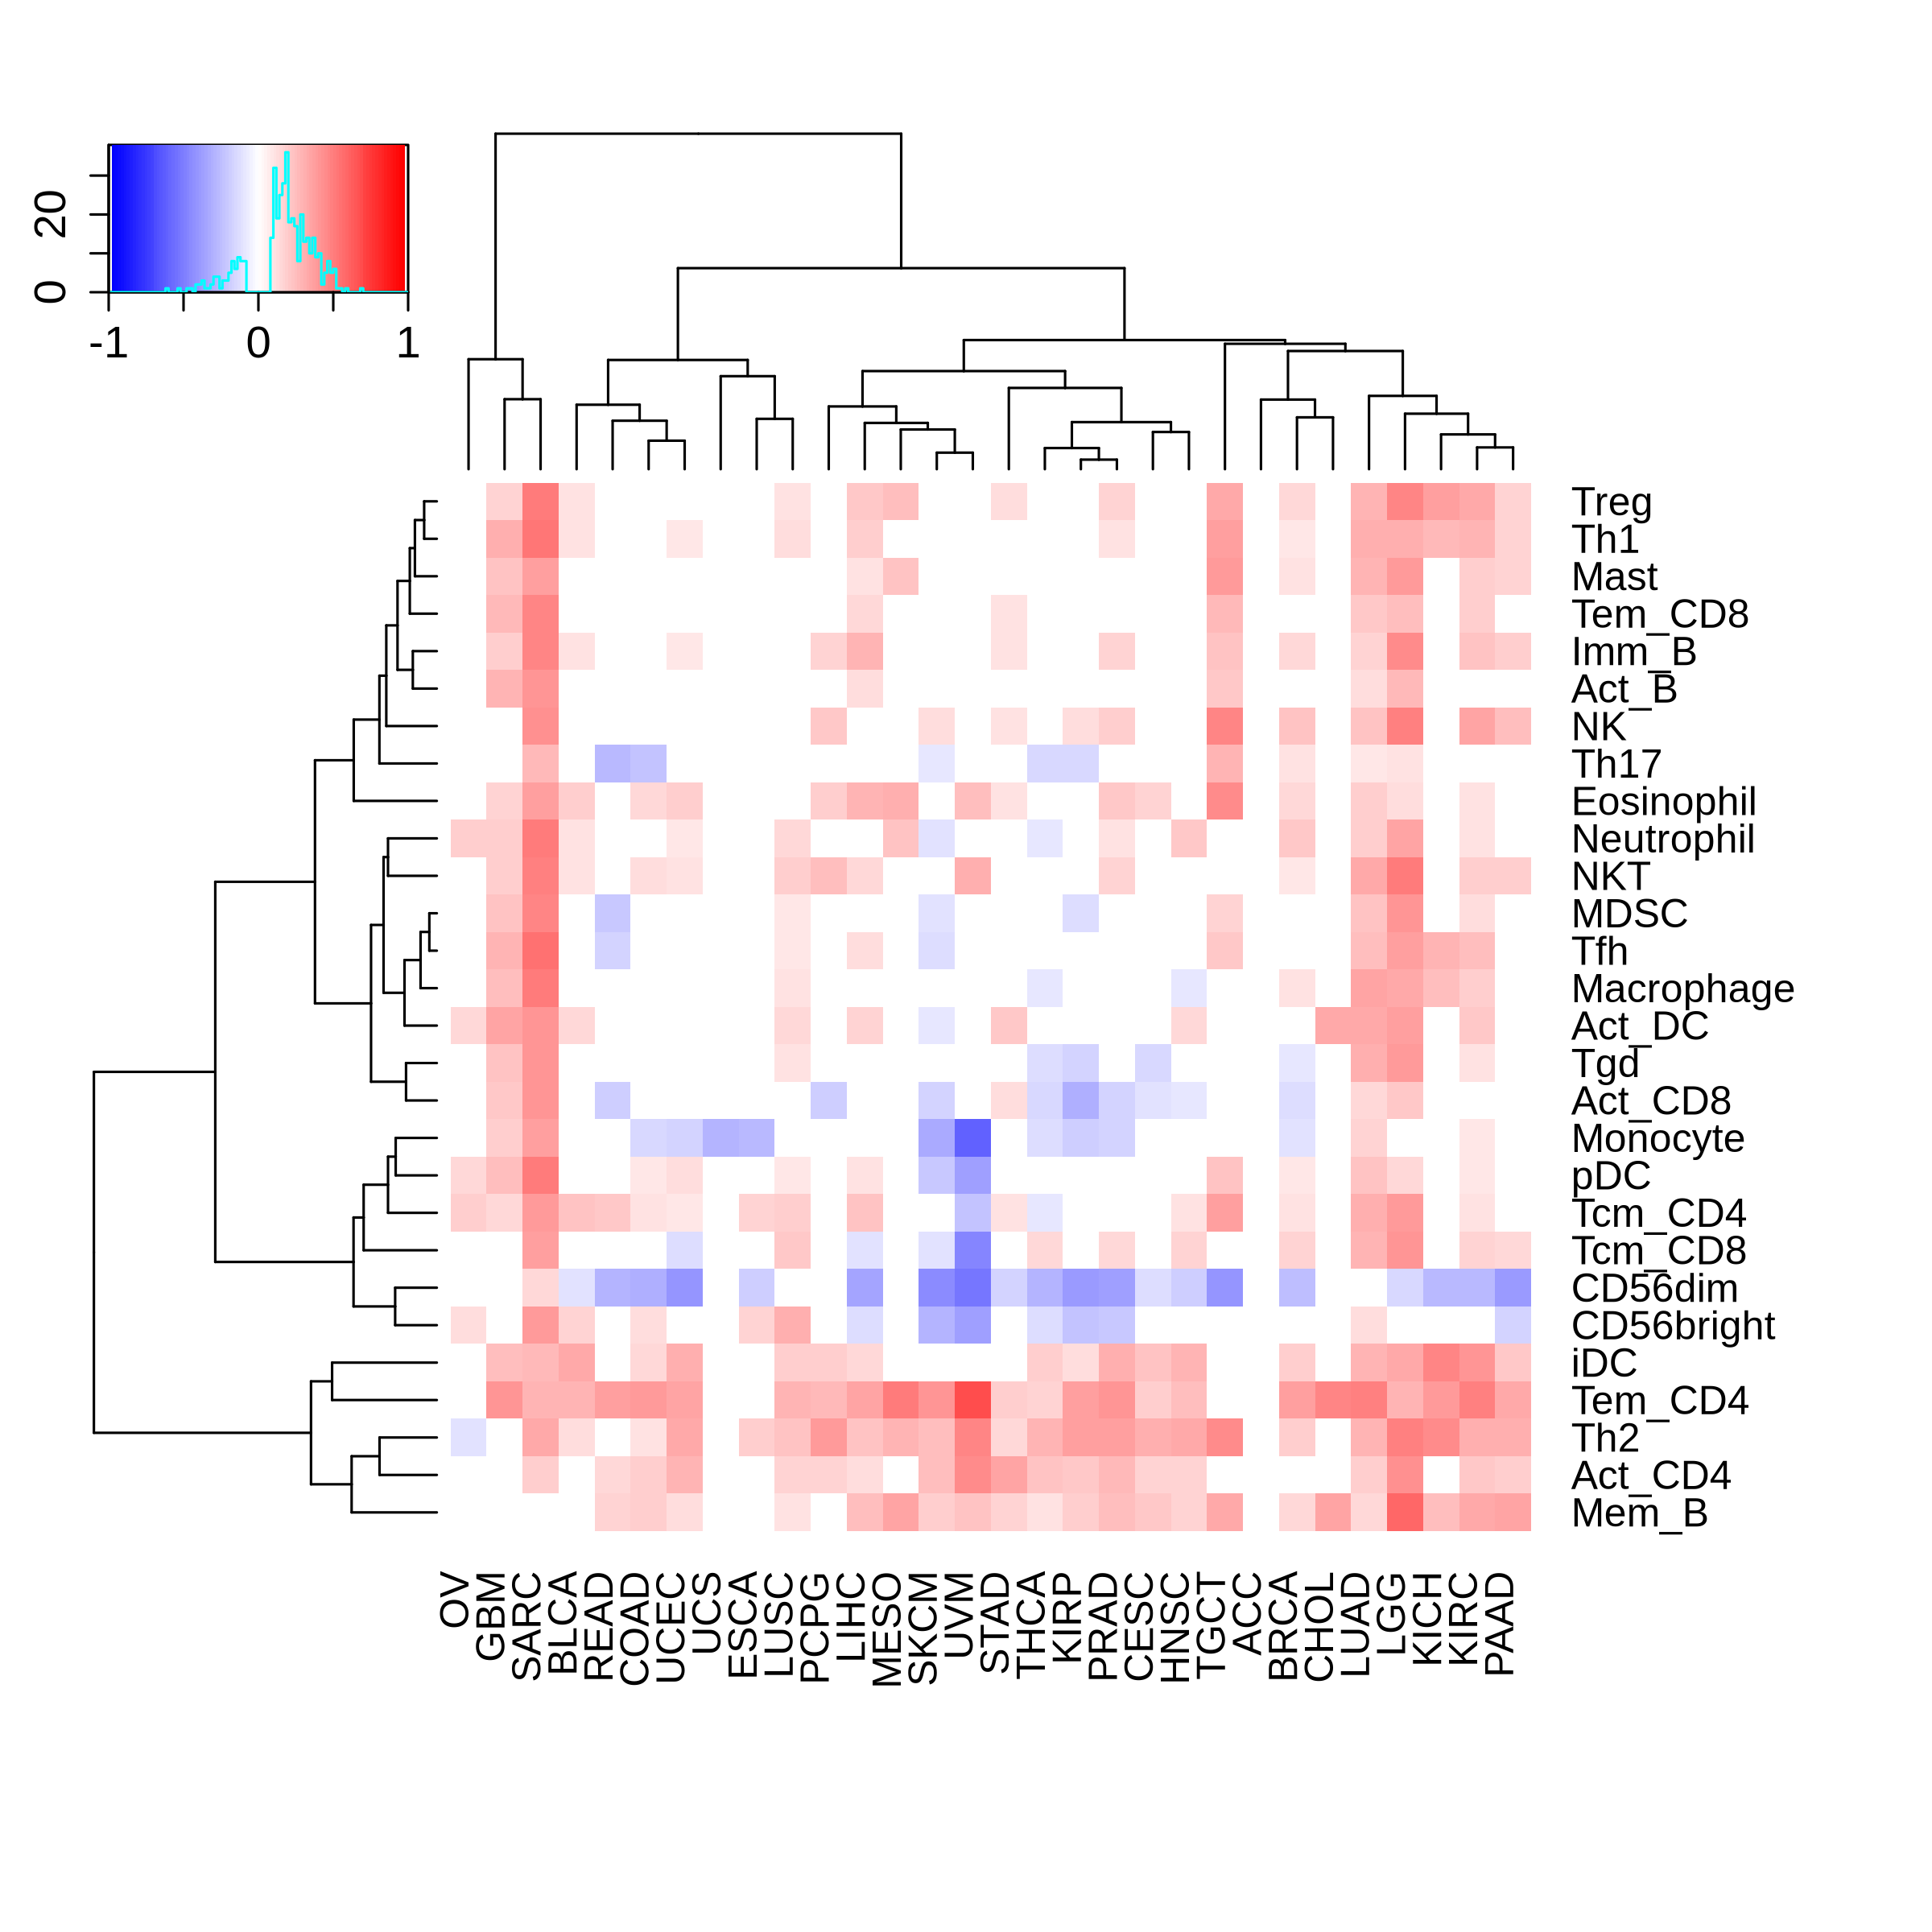
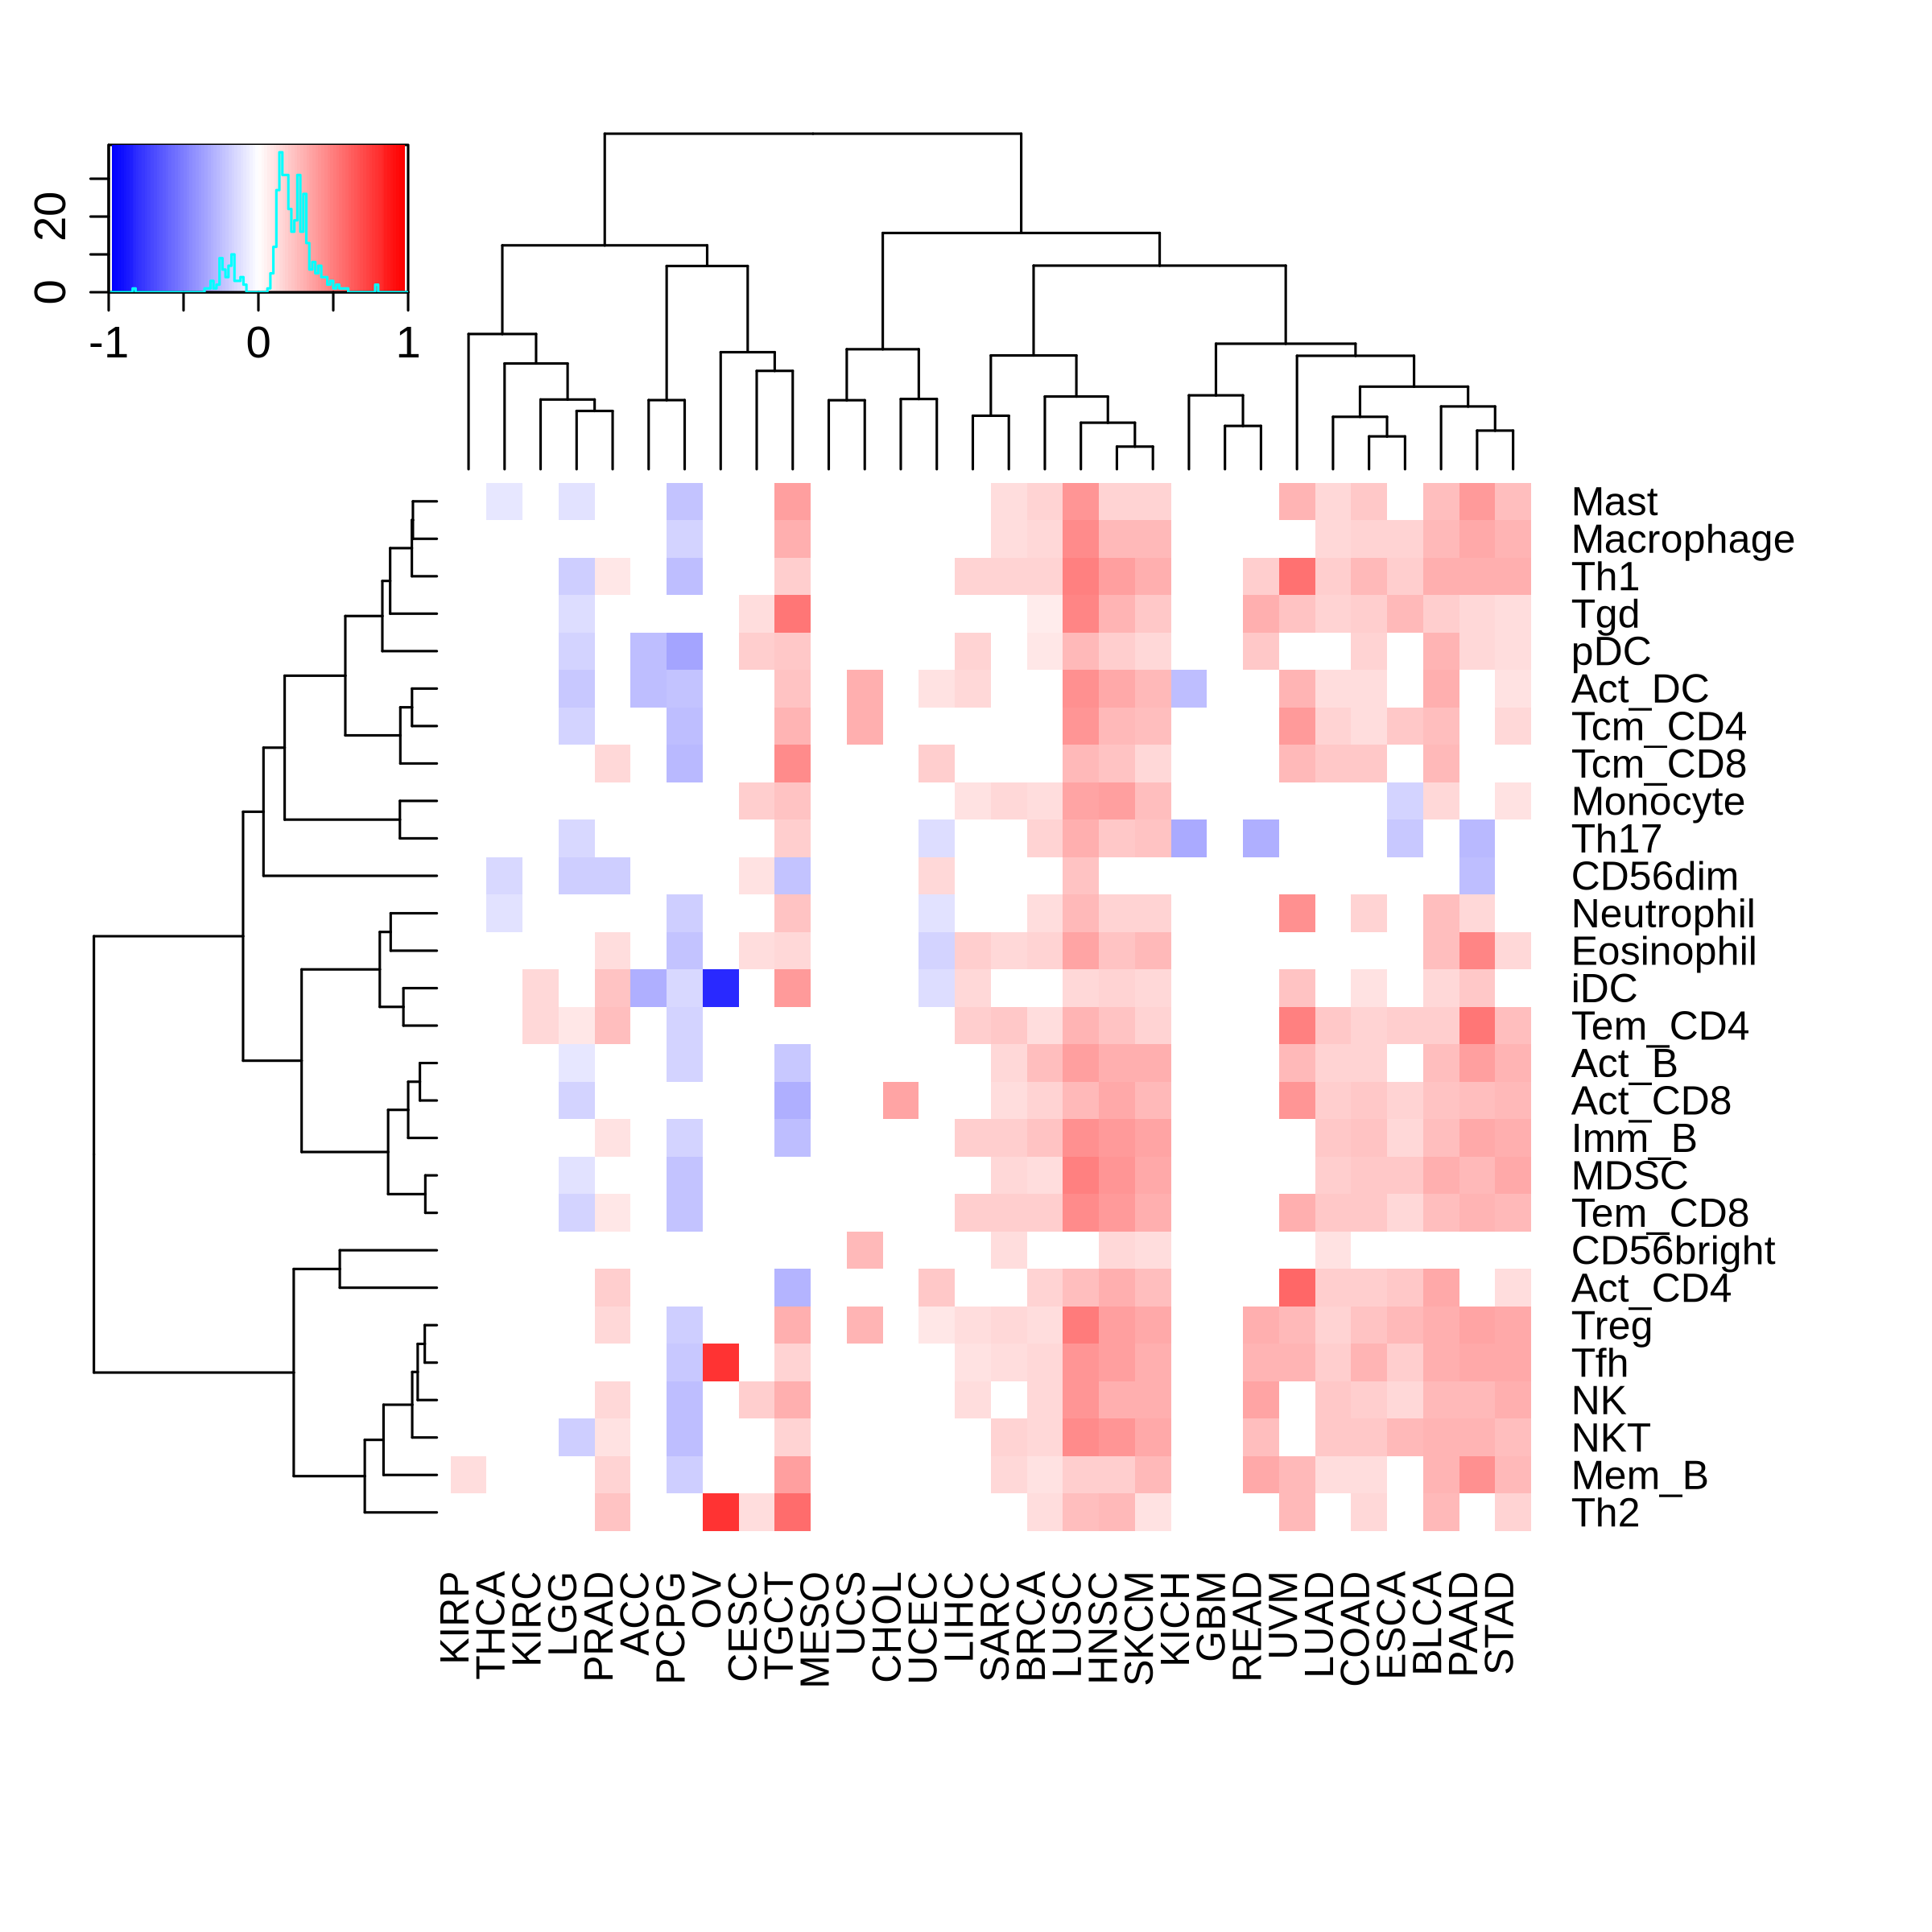
Correlation between the composition of TIL and gene expression, methylation and CNV |
| Expression | Copy number variation |
 | 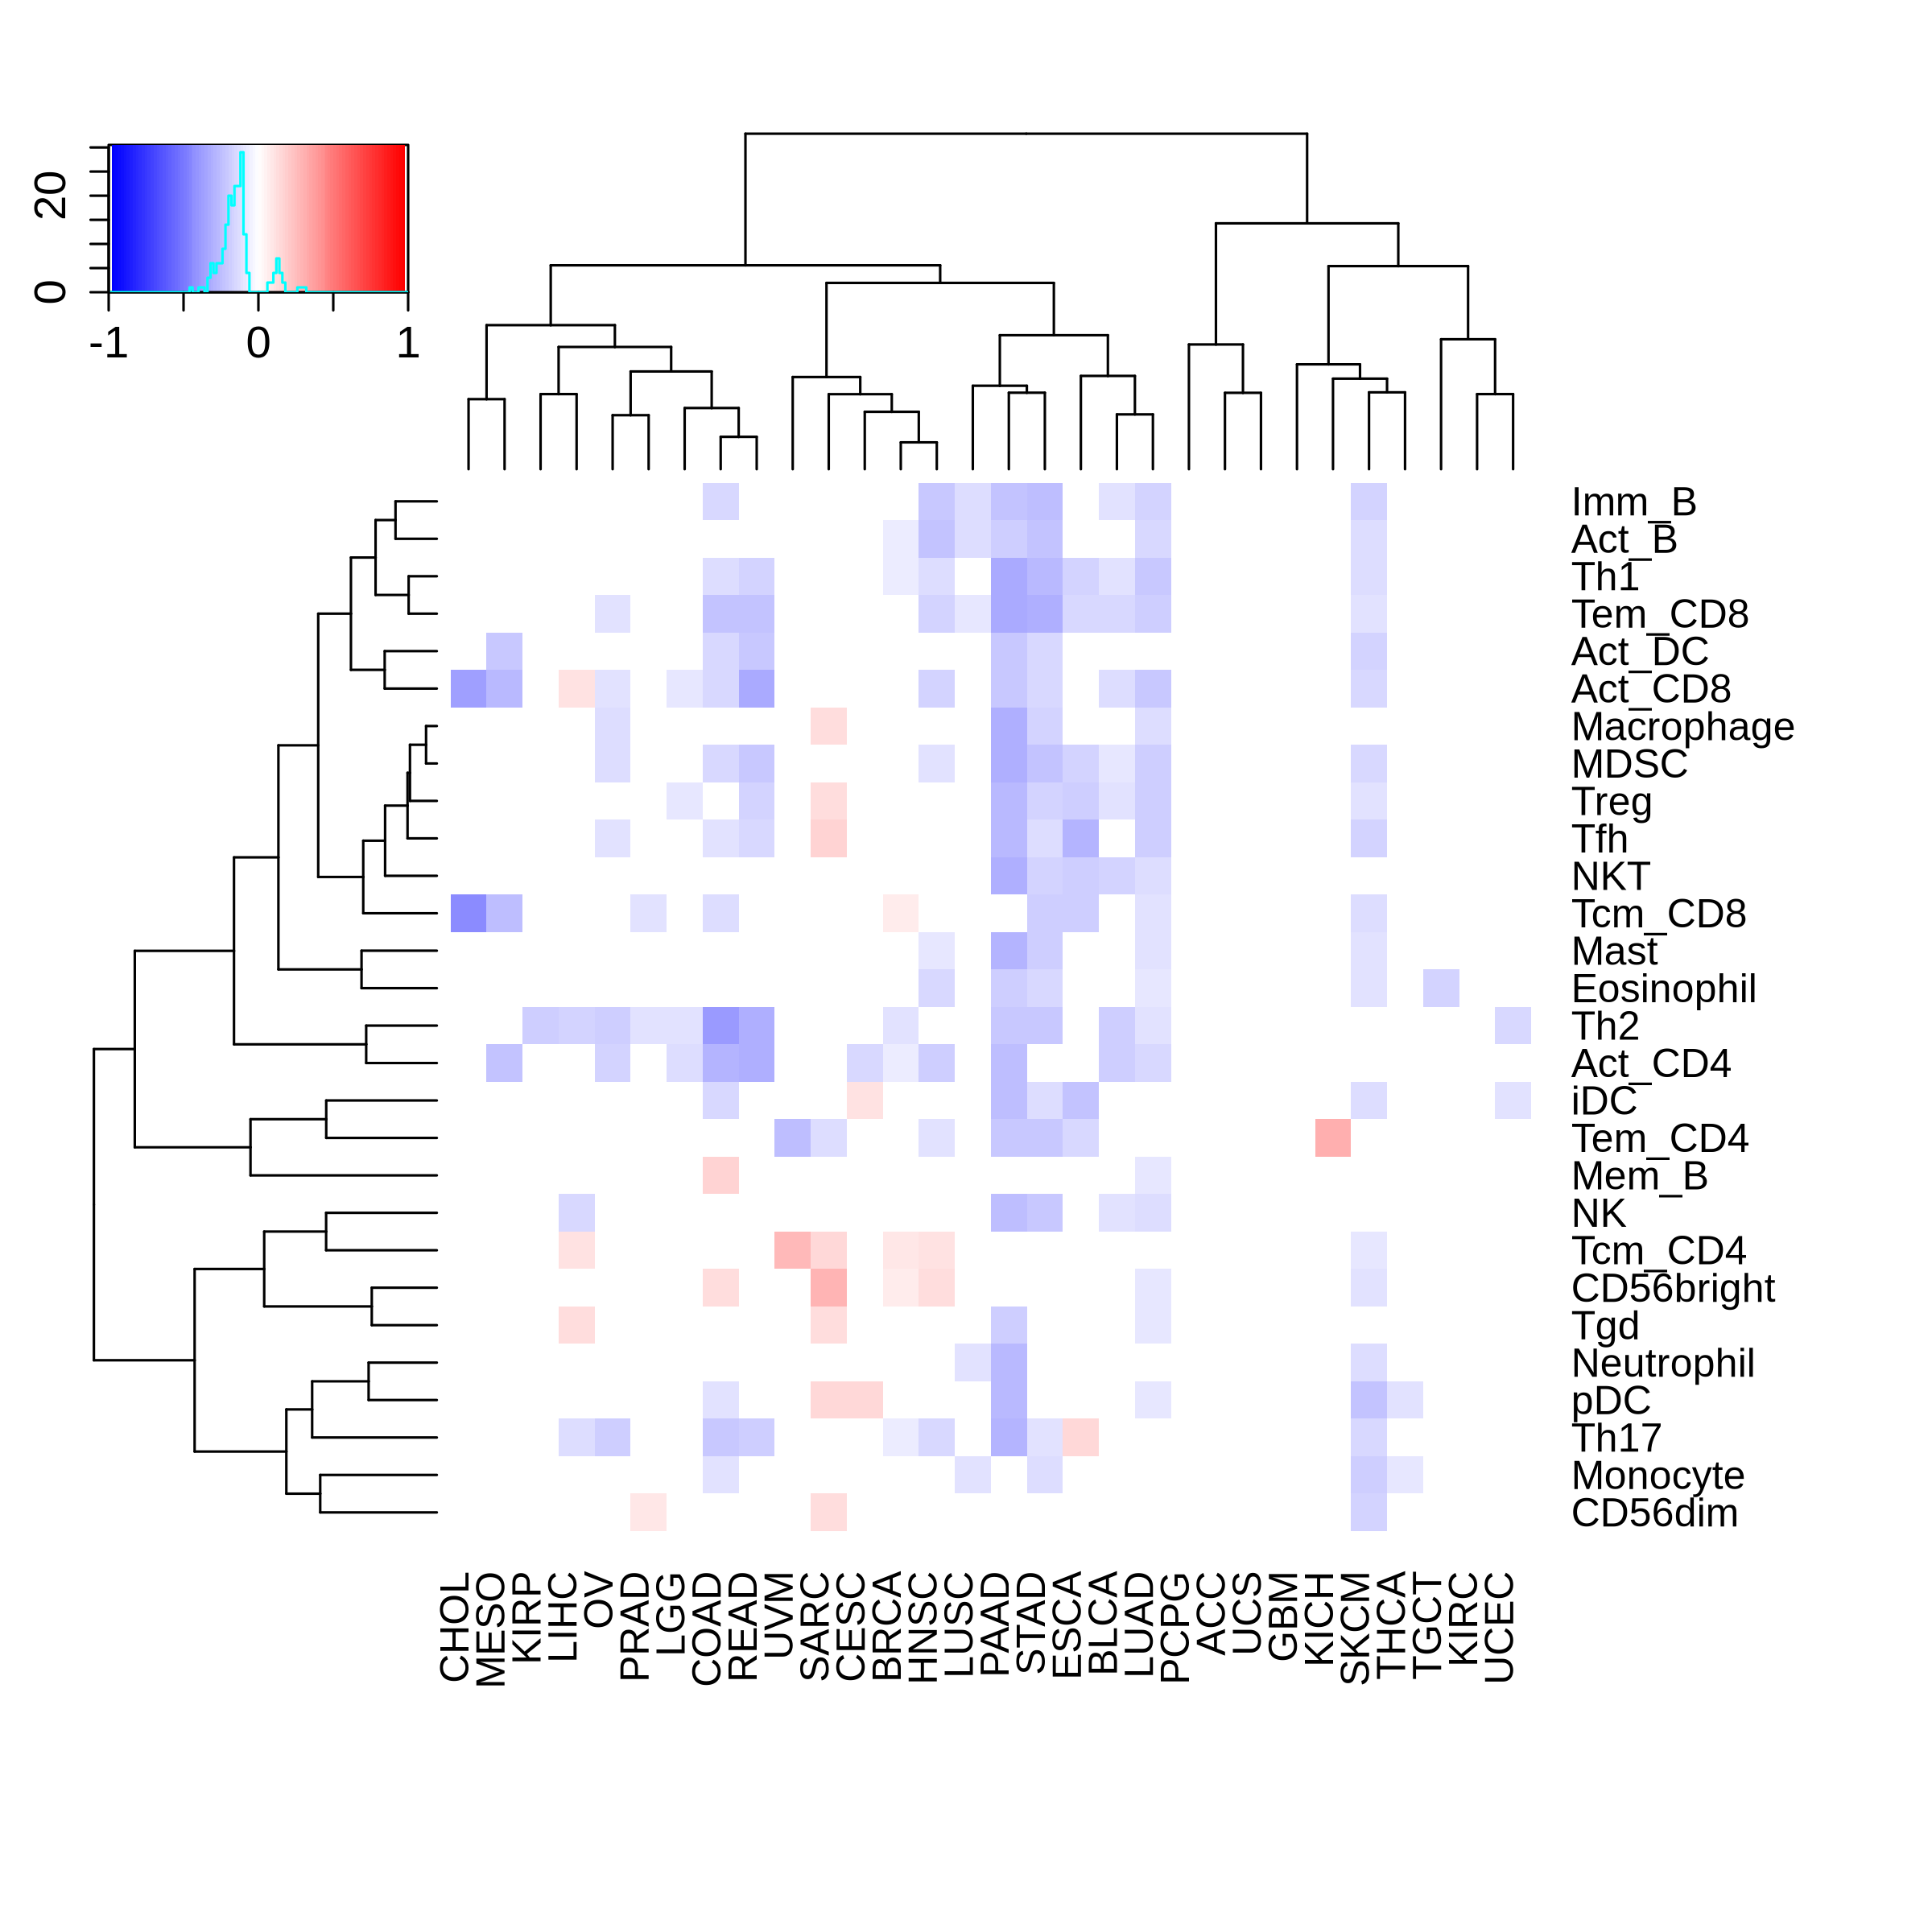 |
| Promoter methylation | Genebody methylation |
 | 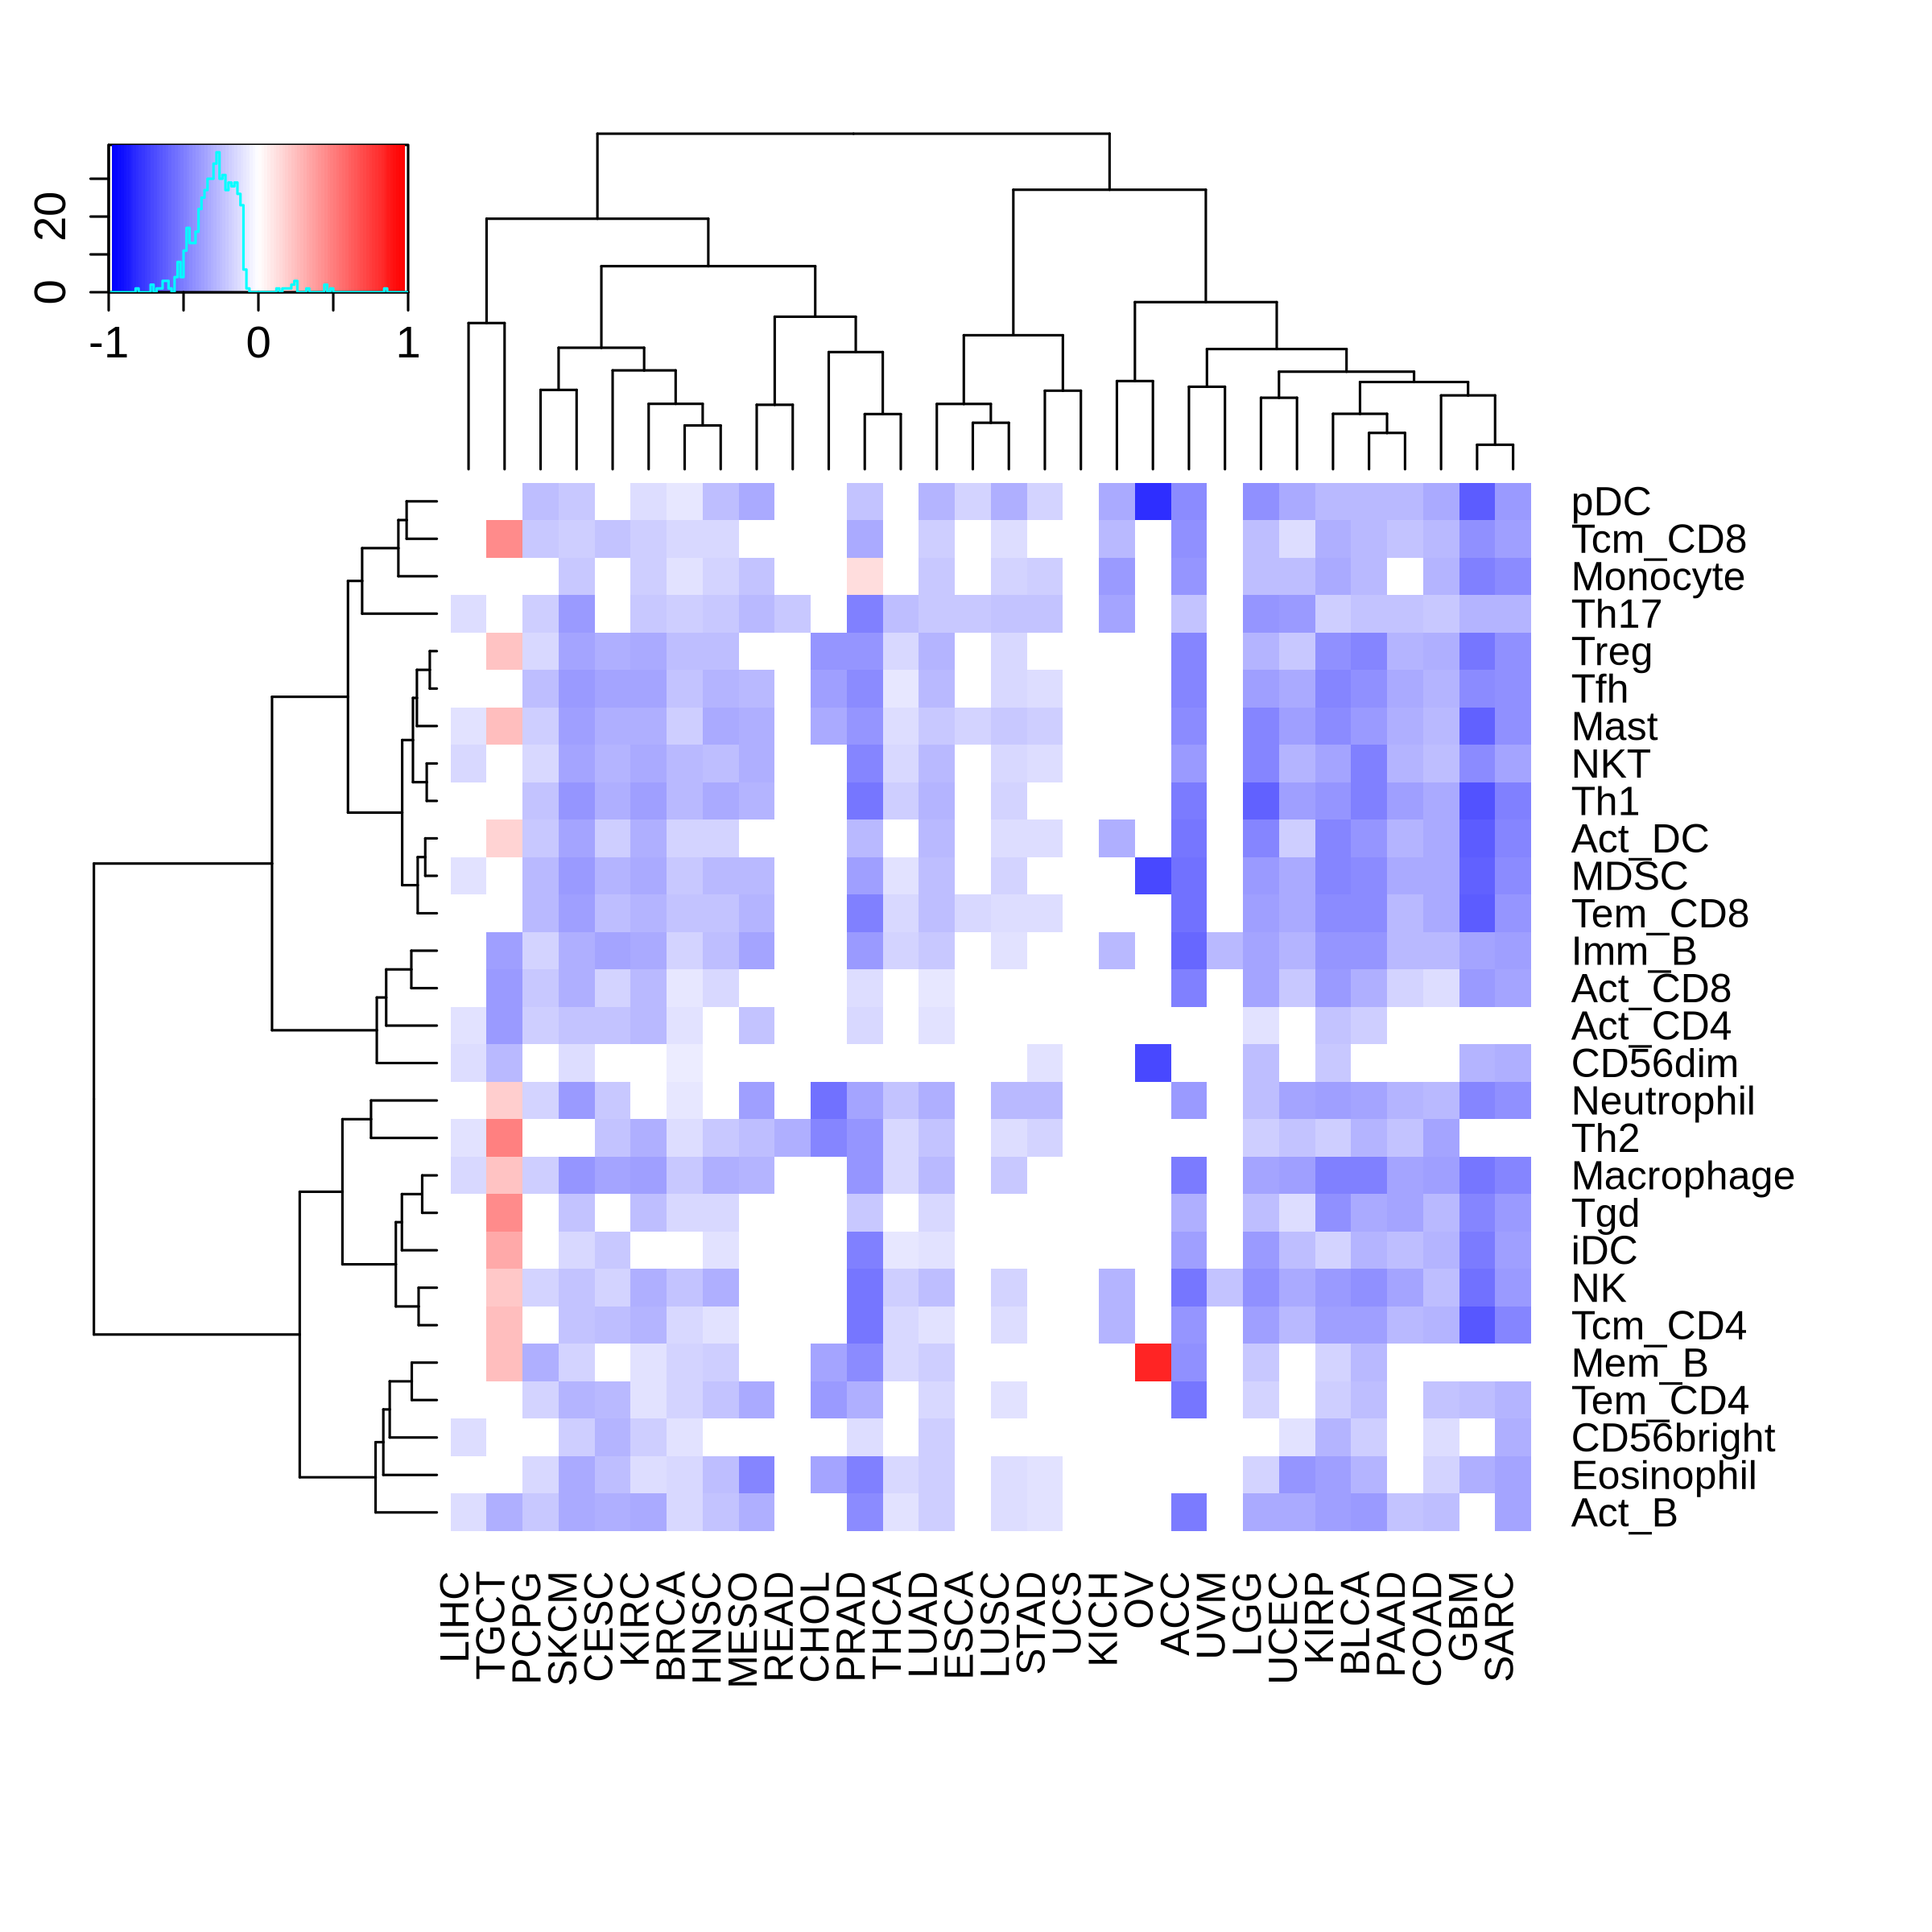 |
Top |
The association between RB1 expression and immune subtypes/status |
Top |
Drugs targeting RB1 and diseases related to RB1. |
| Drug-gene interaction | Disease-gene association |
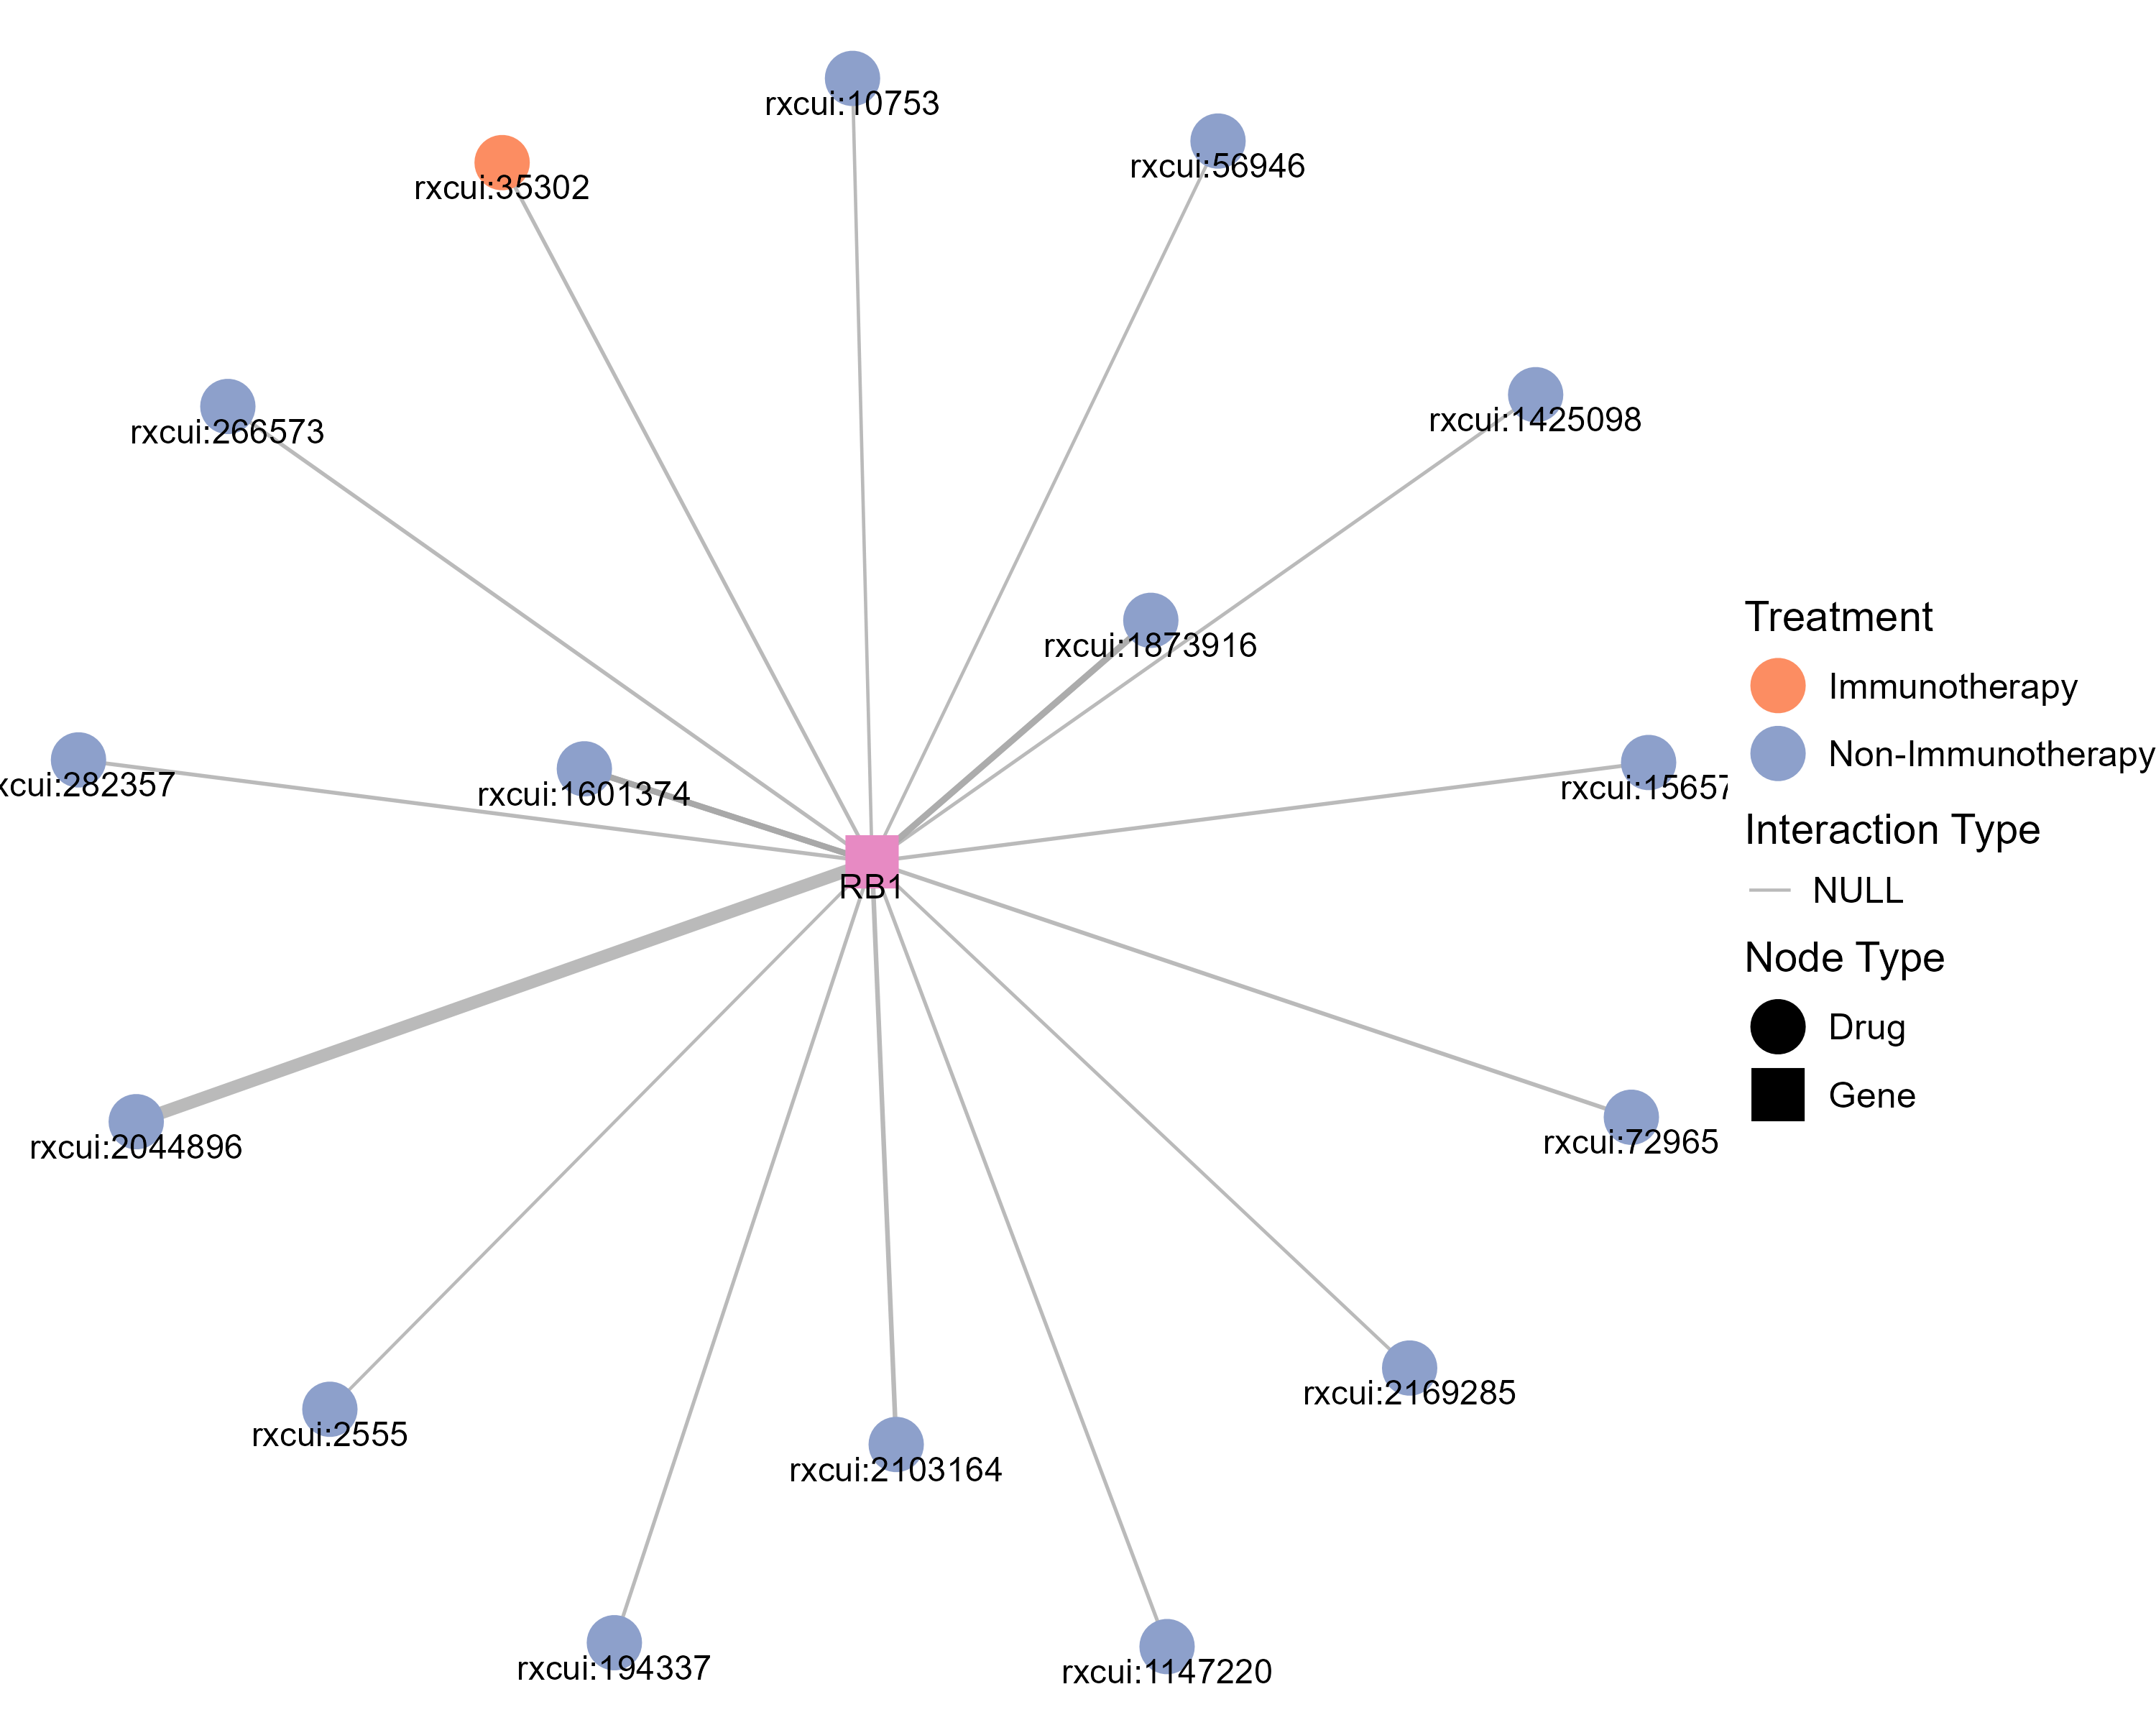 |  |
Top |
Survival analysis based on RB1 expression |
Top |
| Reference |
| [1] Steele CD, Abbasi A, Islam SMA, et al. Signatures of copy number alterations in human cancer. Nature. 2022 Jun;606(7916):984-991. doi: 10.1038/s41586-022-04738-6. Epub 2022 Jun 15. PMID: 35705804; PMCID: PMC9242861. [2] Beibei Ru, Ching Ngar Wong, Yin Tong, et al. TISIDB: an integrated repository portal for tumor–immune system interactions, Bioinformatics, Volume 35, Issue 20, October 2019, Pages 4200–4202, https://doi.org/10.1093/bioinformatics/btz210. [3] Zhongyang Liu, Jiale Liu, Xinyue Liu, et al. CTR–DB, an omnibus for patient-derived gene expression signatures correlated with cancer drug response, Nucleic Acids Research, Volume 50, Issue D1, 7 January 2022, Pages D1184–D1199, https://doi.org/10.1093/nar/gkab860. [4] Charoentong P, Finotello F, Angelova M, et al. Pan-cancer Immunogenomic Analyses Reveal Genotype-Immunophenotype Relationships and Predictors of Response to Checkpoint Blockade. Cell Rep. 2017 Jan 3;18(1):248–262. doi: 10.1016/j.celrep.2016.12.019. PMID: 28052254. [5] Thorsson V, Gibbs DL, Brown SD, et al. The Immune Landscape of Cancer. Immunity. 2018 Apr 17;48(4):812-830.e14. doi: 10.1016/j.immuni.2018.03.023. Epub 2018 Apr 5. Erratum in: Immunity. 2019 Aug 20;51(2):411-412. doi: 10.1016/j.immuni.2019.08.004. PMID: 29628290; PMCID: PMC5982584. [6] Zapata L, Caravagna G, Williams MJ, et al. Immune selection determines tumor antigenicity and influences response to checkpoint inhibitors. Nat Genet. 2023 Mar;55(3):451-460. doi: 10.1038/s41588-023-01313-1. Epub 2023 Mar 9. PMID: 36894710; PMCID: PMC10011129. [7] Cortes-Ciriano I, Lee S, Park WY, et al. A molecular portrait of microsatellite instability across multiple cancers. Nat Commun. 2017 Jun 6;8:15180. doi: 10.1038/ncomms15180. PMID: 28585546; PMCID: PMC5467167. [8] Cannon M, Stevenson J, Stahl K, et al. DGIdb 5.0: rebuilding the drug-gene interaction database for precision medicine and drug discovery platforms. Nucleic Acids Res. 2024 Jan 5;52(D1):D1227-D1235. doi: 10.1093/nar/gkad1040. PMID: 37953380; PMCID: PMC10767982. [9] Grissa D, Junge A, Oprea TI, Jensen LJ. Diseases 2.0: a weekly updated database of disease-gene associations from text mining and data integration. Database (Oxford). 2022 Mar 28;2022:baac019. doi: 10.1093/database/baac019. PMID: 35348648; PMCID: PMC9216524. |

Copyright 2024-Present -The University of Texas Health Science Center at Houston |