|
|
||||||||
|
||||||||

Gene summary for ANGPT2 |
| Gene Symbol | ANGPT2 | Gene ID | 285 |
| Gene name | angiopoietin 2 |
| Synonyms | ANG2 |
| Type of gene | protein_coding |
| UniProtAcc | O15123 |
| GO ID | GO term |
| GO:0030154 | cell differentiation |
| GO:0001525 | angiogenesis |
| GO:0007165 | signal transduction |
| GO:0010467 | gene expression |
| GO:0001666 | response to hypoxia |
| GO:0007281 | germ cell development |
| GO:0009612 | response to mechanical stimulus |
| GO:0009749 | response to glucose |
| GO:0010812 | negative regulation of cell-substrate adhesion |
| GO:0014070 | response to organic cyclic compound |
| GO:0014823 | response to activity |
| GO:0016525 | negative regulation of angiogenesis |
| GO:0031100 | animal organ regeneration |
| GO:0043537 | negative regulation of blood vessel endothelial cell migration |
| GO:0045766 | positive regulation of angiogenesis |
| GO:0048014 | Tie signaling pathway |
| GO:0048514 | blood vessel morphogenesis |
| GO:0050928 | negative regulation of positive chemotaxis |
| GO:0060135 | maternal process involved in female pregnancy |
| GO:0071363 | cellular response to growth factor stimulus |
| GO:0072012 | glomerulus vasculature development |
Top |
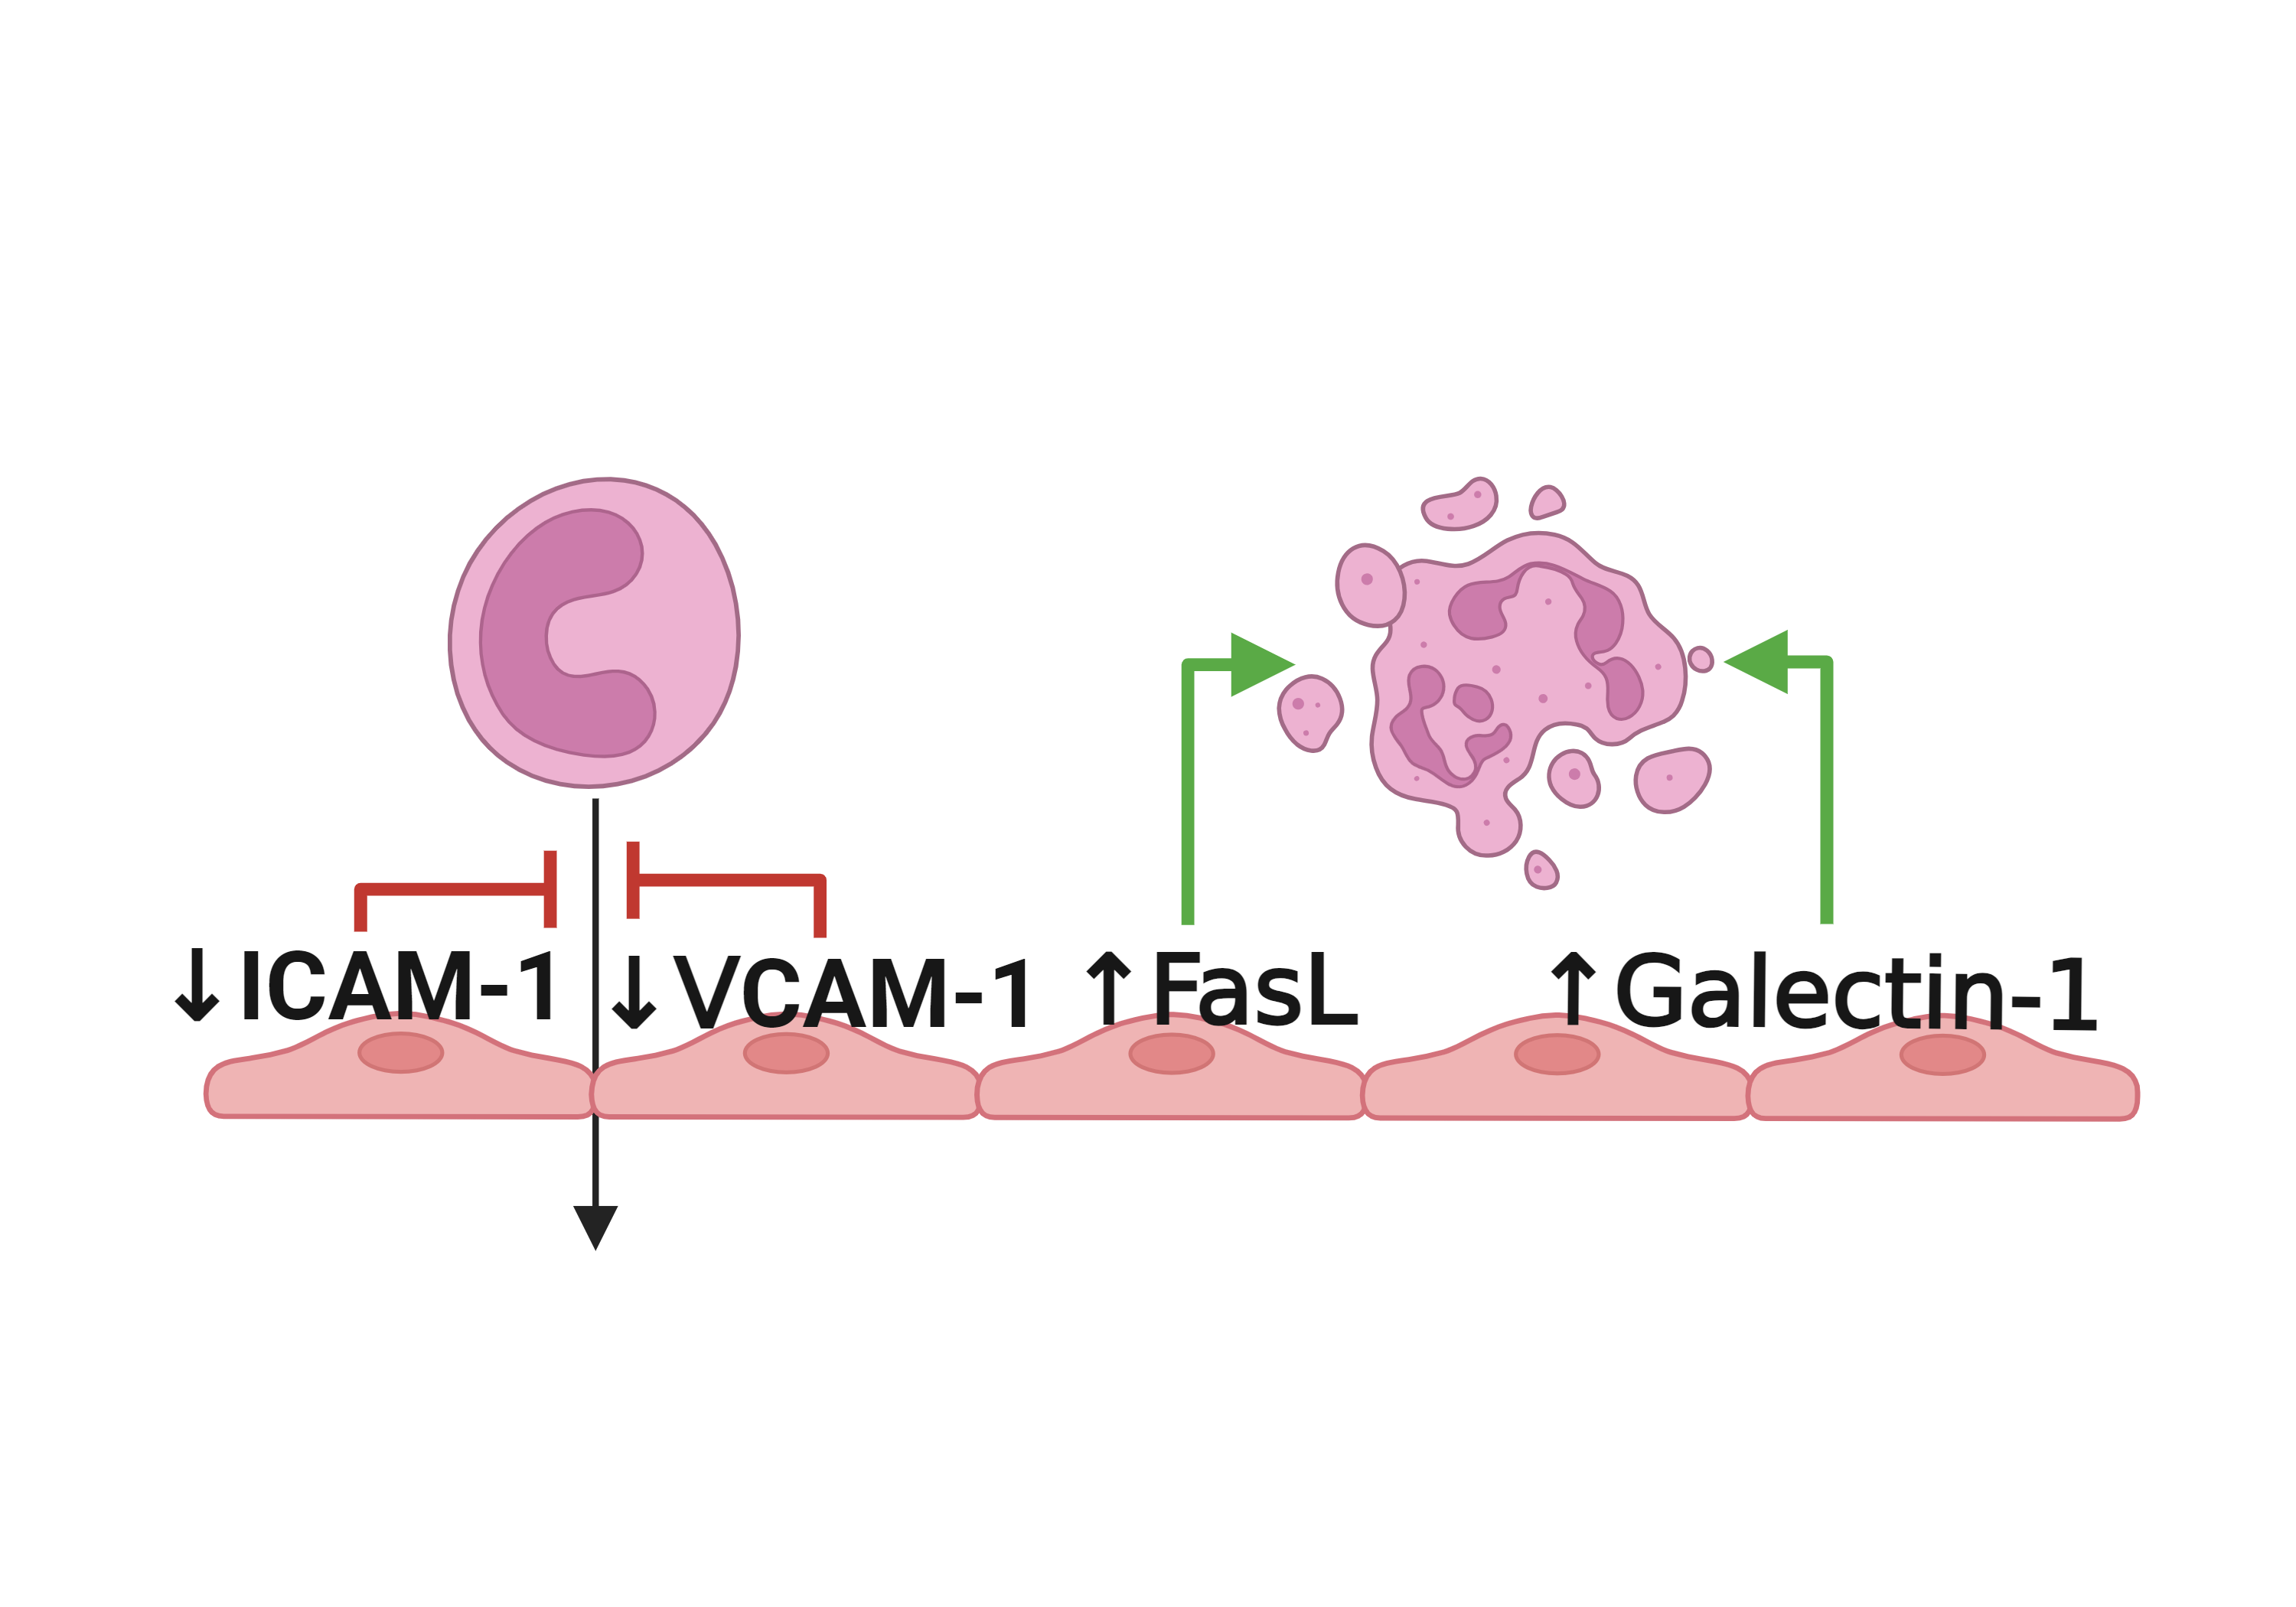
Literatures describing the association of ANGPT2 and immune escape mechanisms |
Top |
Comparison of the ANGPT2 expression level between tumor and normal groups |
Top |
Comparison of the ANGPT2 methylation level between tumor and normal groups |
No significant differences were found in ANGPT2 methylation in promoter region.
Top |
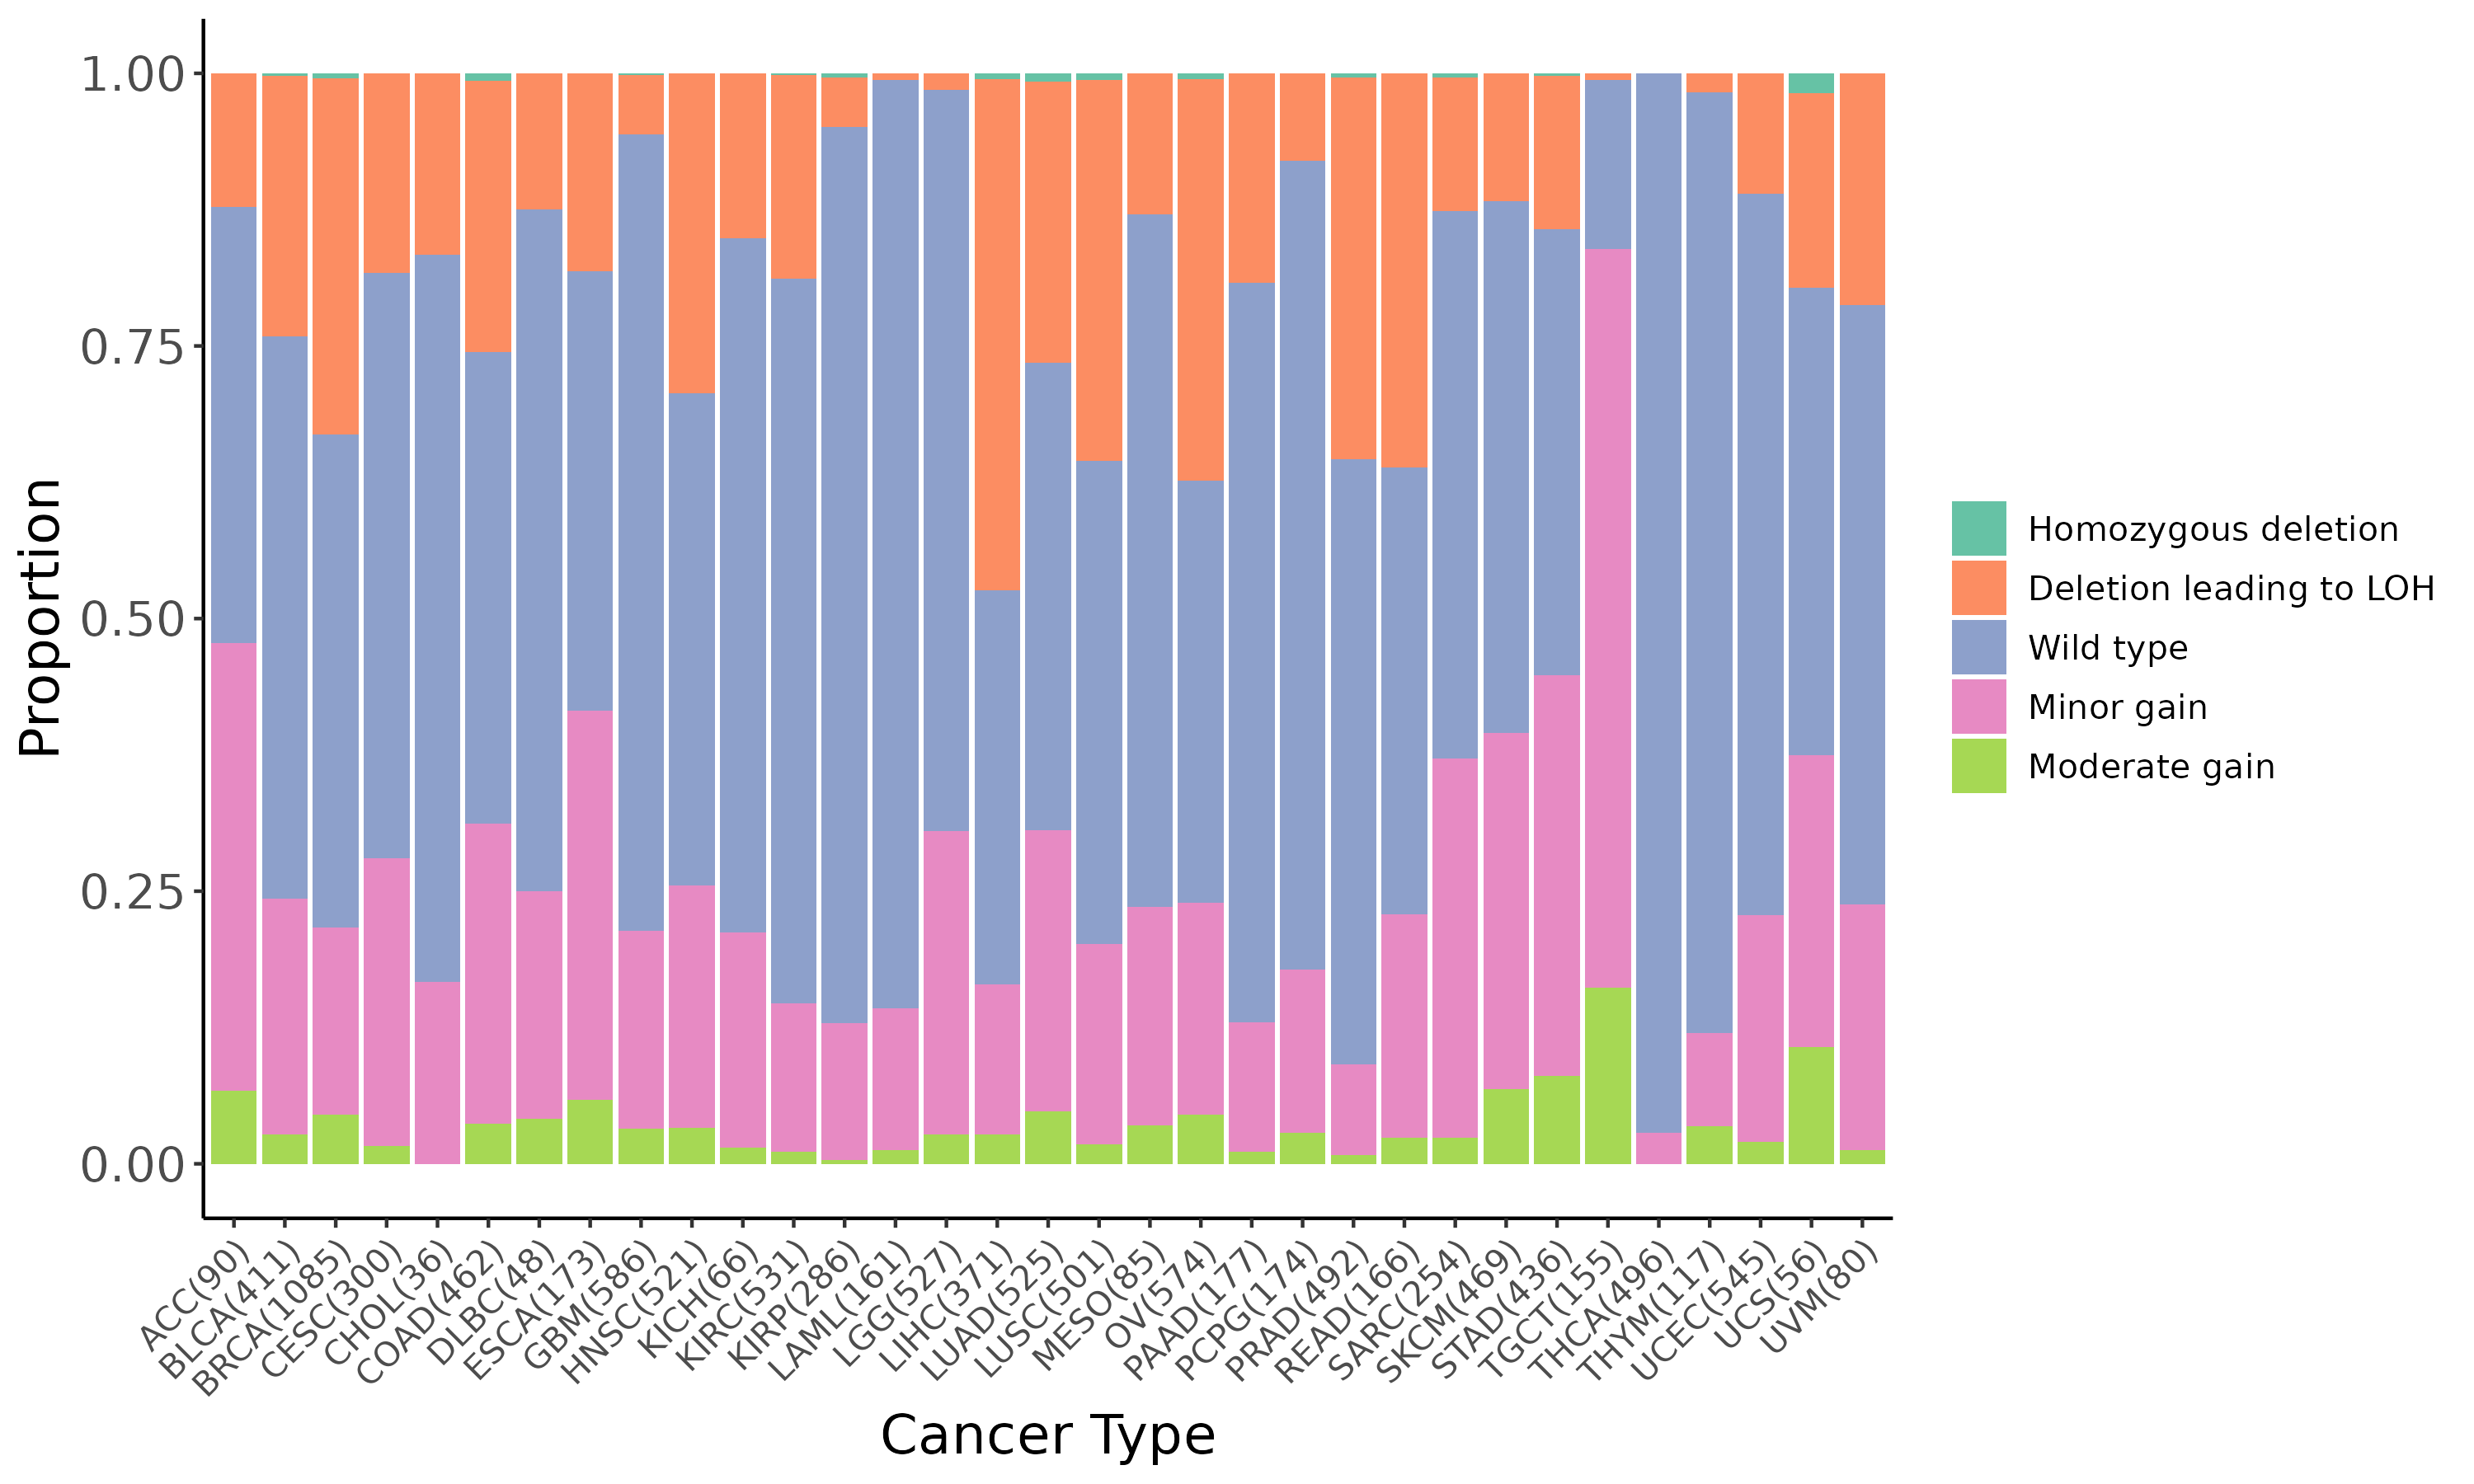
Summary of the copy number in TCGA tumor samples |
 |
Top |
DEGs and the enrichment analysis between the mutated and wild type groups |
| Gene ID | Symbol | Log2 Fold Change | P-value | Adjusted P-value |
|---|---|---|---|---|
| ENSG00000234969 | RP13-33H18.1 | -1.24e+00 | 6.15e-03 | 4.84e-02 |
| ENSG00000186472 | PCLO | -1.10e+00 | 6.17e-03 | 4.85e-02 |
| ENSG00000203588 | IGBP1-AS1 | -1.03e+00 | 6.19e-03 | 4.85e-02 |
| ENSG00000224557 | HLA-DPB2 | 1.41e+00 | 6.19e-03 | 4.85e-02 |
| ENSG00000237672 | KRR1P1 | -1.78e+00 | 6.18e-03 | 4.85e-02 |
| ENSG00000273035 | RP11-449G16.1 | -2.02e+00 | 6.19e-03 | 4.85e-02 |
| ENSG00000284196 | NA | -1.30e+00 | 6.19e-03 | 4.85e-02 |
| ENSG00000196711 | FAM150A | -1.21e+00 | 6.22e-03 | 4.87e-02 |
| ENSG00000174950 | CD164L2 | 1.22e+00 | 6.23e-03 | 4.88e-02 |
| ENSG00000273628 | RP11-756A22.7 | -1.66e+00 | 6.23e-03 | 4.88e-02 |
| ENSG00000186152 | LILRP1 | 1.71e+00 | 6.24e-03 | 4.88e-02 |
| ENSG00000248988 | RP11-815N9.2 | 1.22e+00 | 6.25e-03 | 4.89e-02 |
| ENSG00000272360 | RP11-359I18.5 | -1.59e+00 | 6.25e-03 | 4.89e-02 |
| ENSG00000287351 | NA | -2.69e+00 | 6.25e-03 | 4.89e-02 |
| ENSG00000272674 | PCDHB16 | -1.39e+00 | 6.26e-03 | 4.89e-02 |
| ENSG00000274767 | AC131056.3 | 1.47e+00 | 6.26e-03 | 4.89e-02 |
| ENSG00000271550 | BNIP3P11 | -1.05e+00 | 6.26e-03 | 4.89e-02 |
| ENSG00000137441 | FGFBP2 | 1.26e+00 | 6.27e-03 | 4.89e-02 |
| ENSG00000169194 | IL13 | 1.49e+00 | 6.28e-03 | 4.90e-02 |
| ENSG00000271916 | RP11-884K10.6 | -1.44e+00 | 6.28e-03 | 4.90e-02 |
| Page: 1 2 ... 118 119 120 121 122 ... 134 135 |
Up-regulated KEGG pathways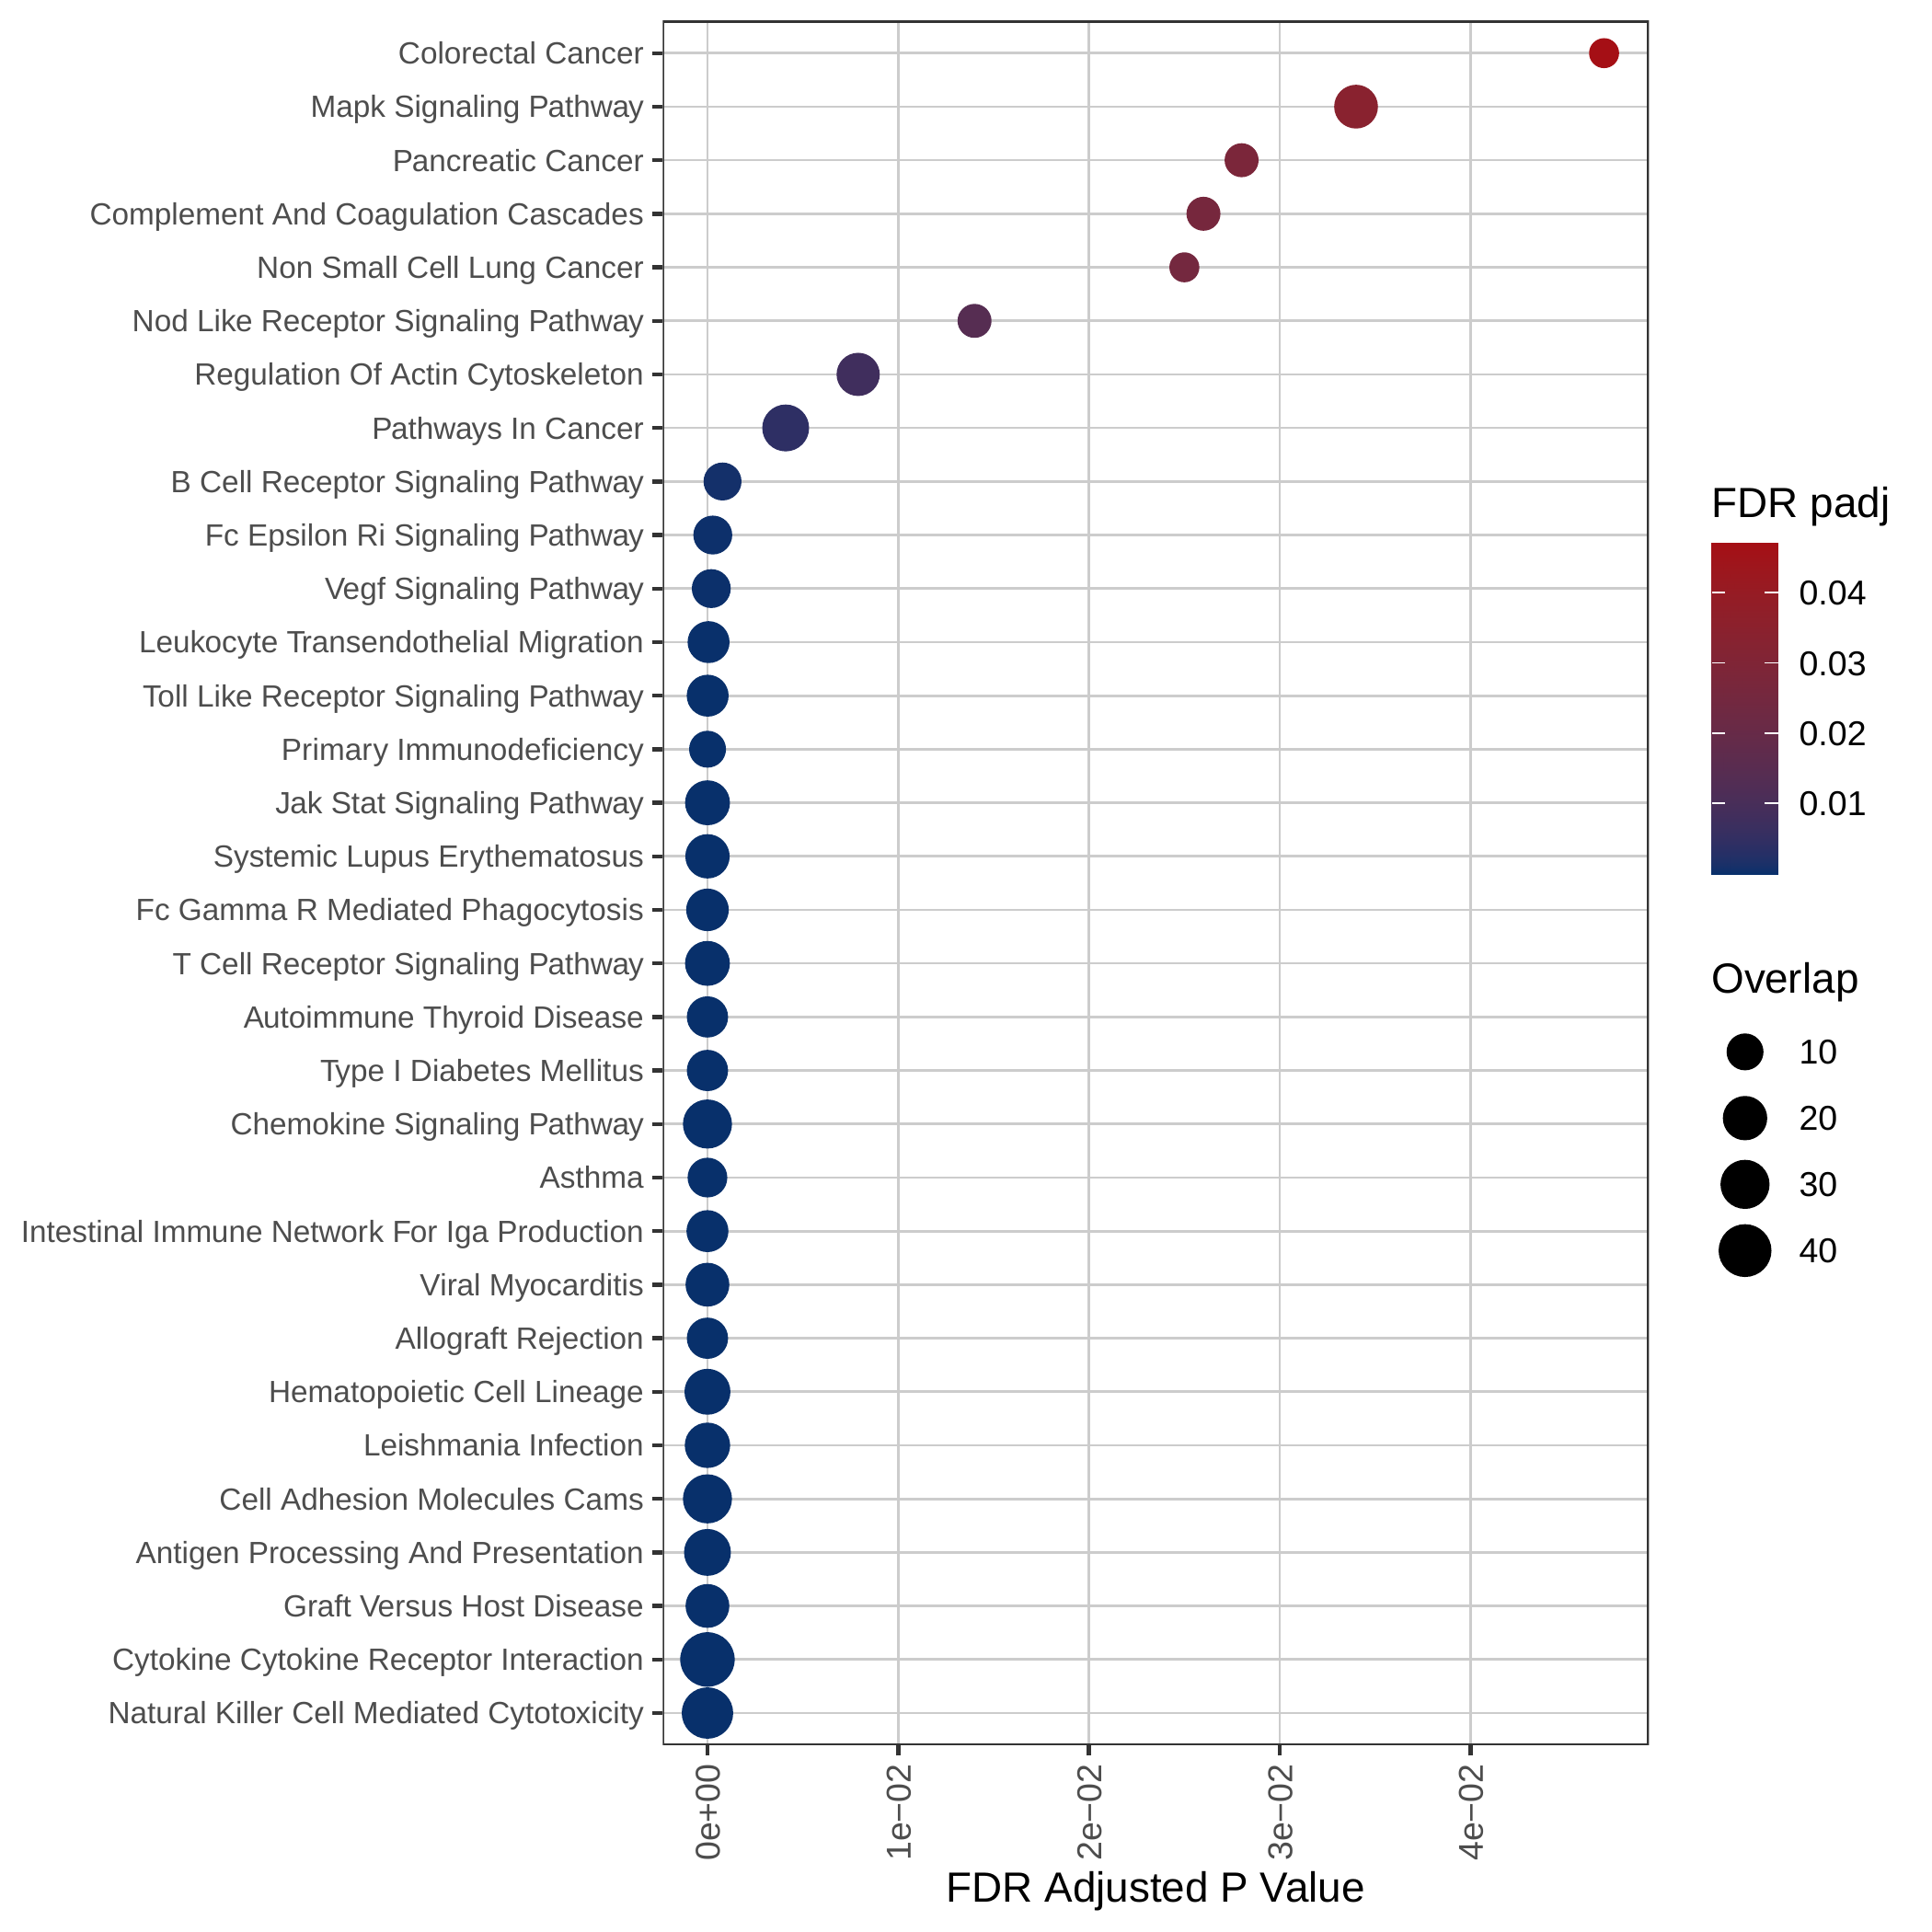 | Up-regulated GOBP pathways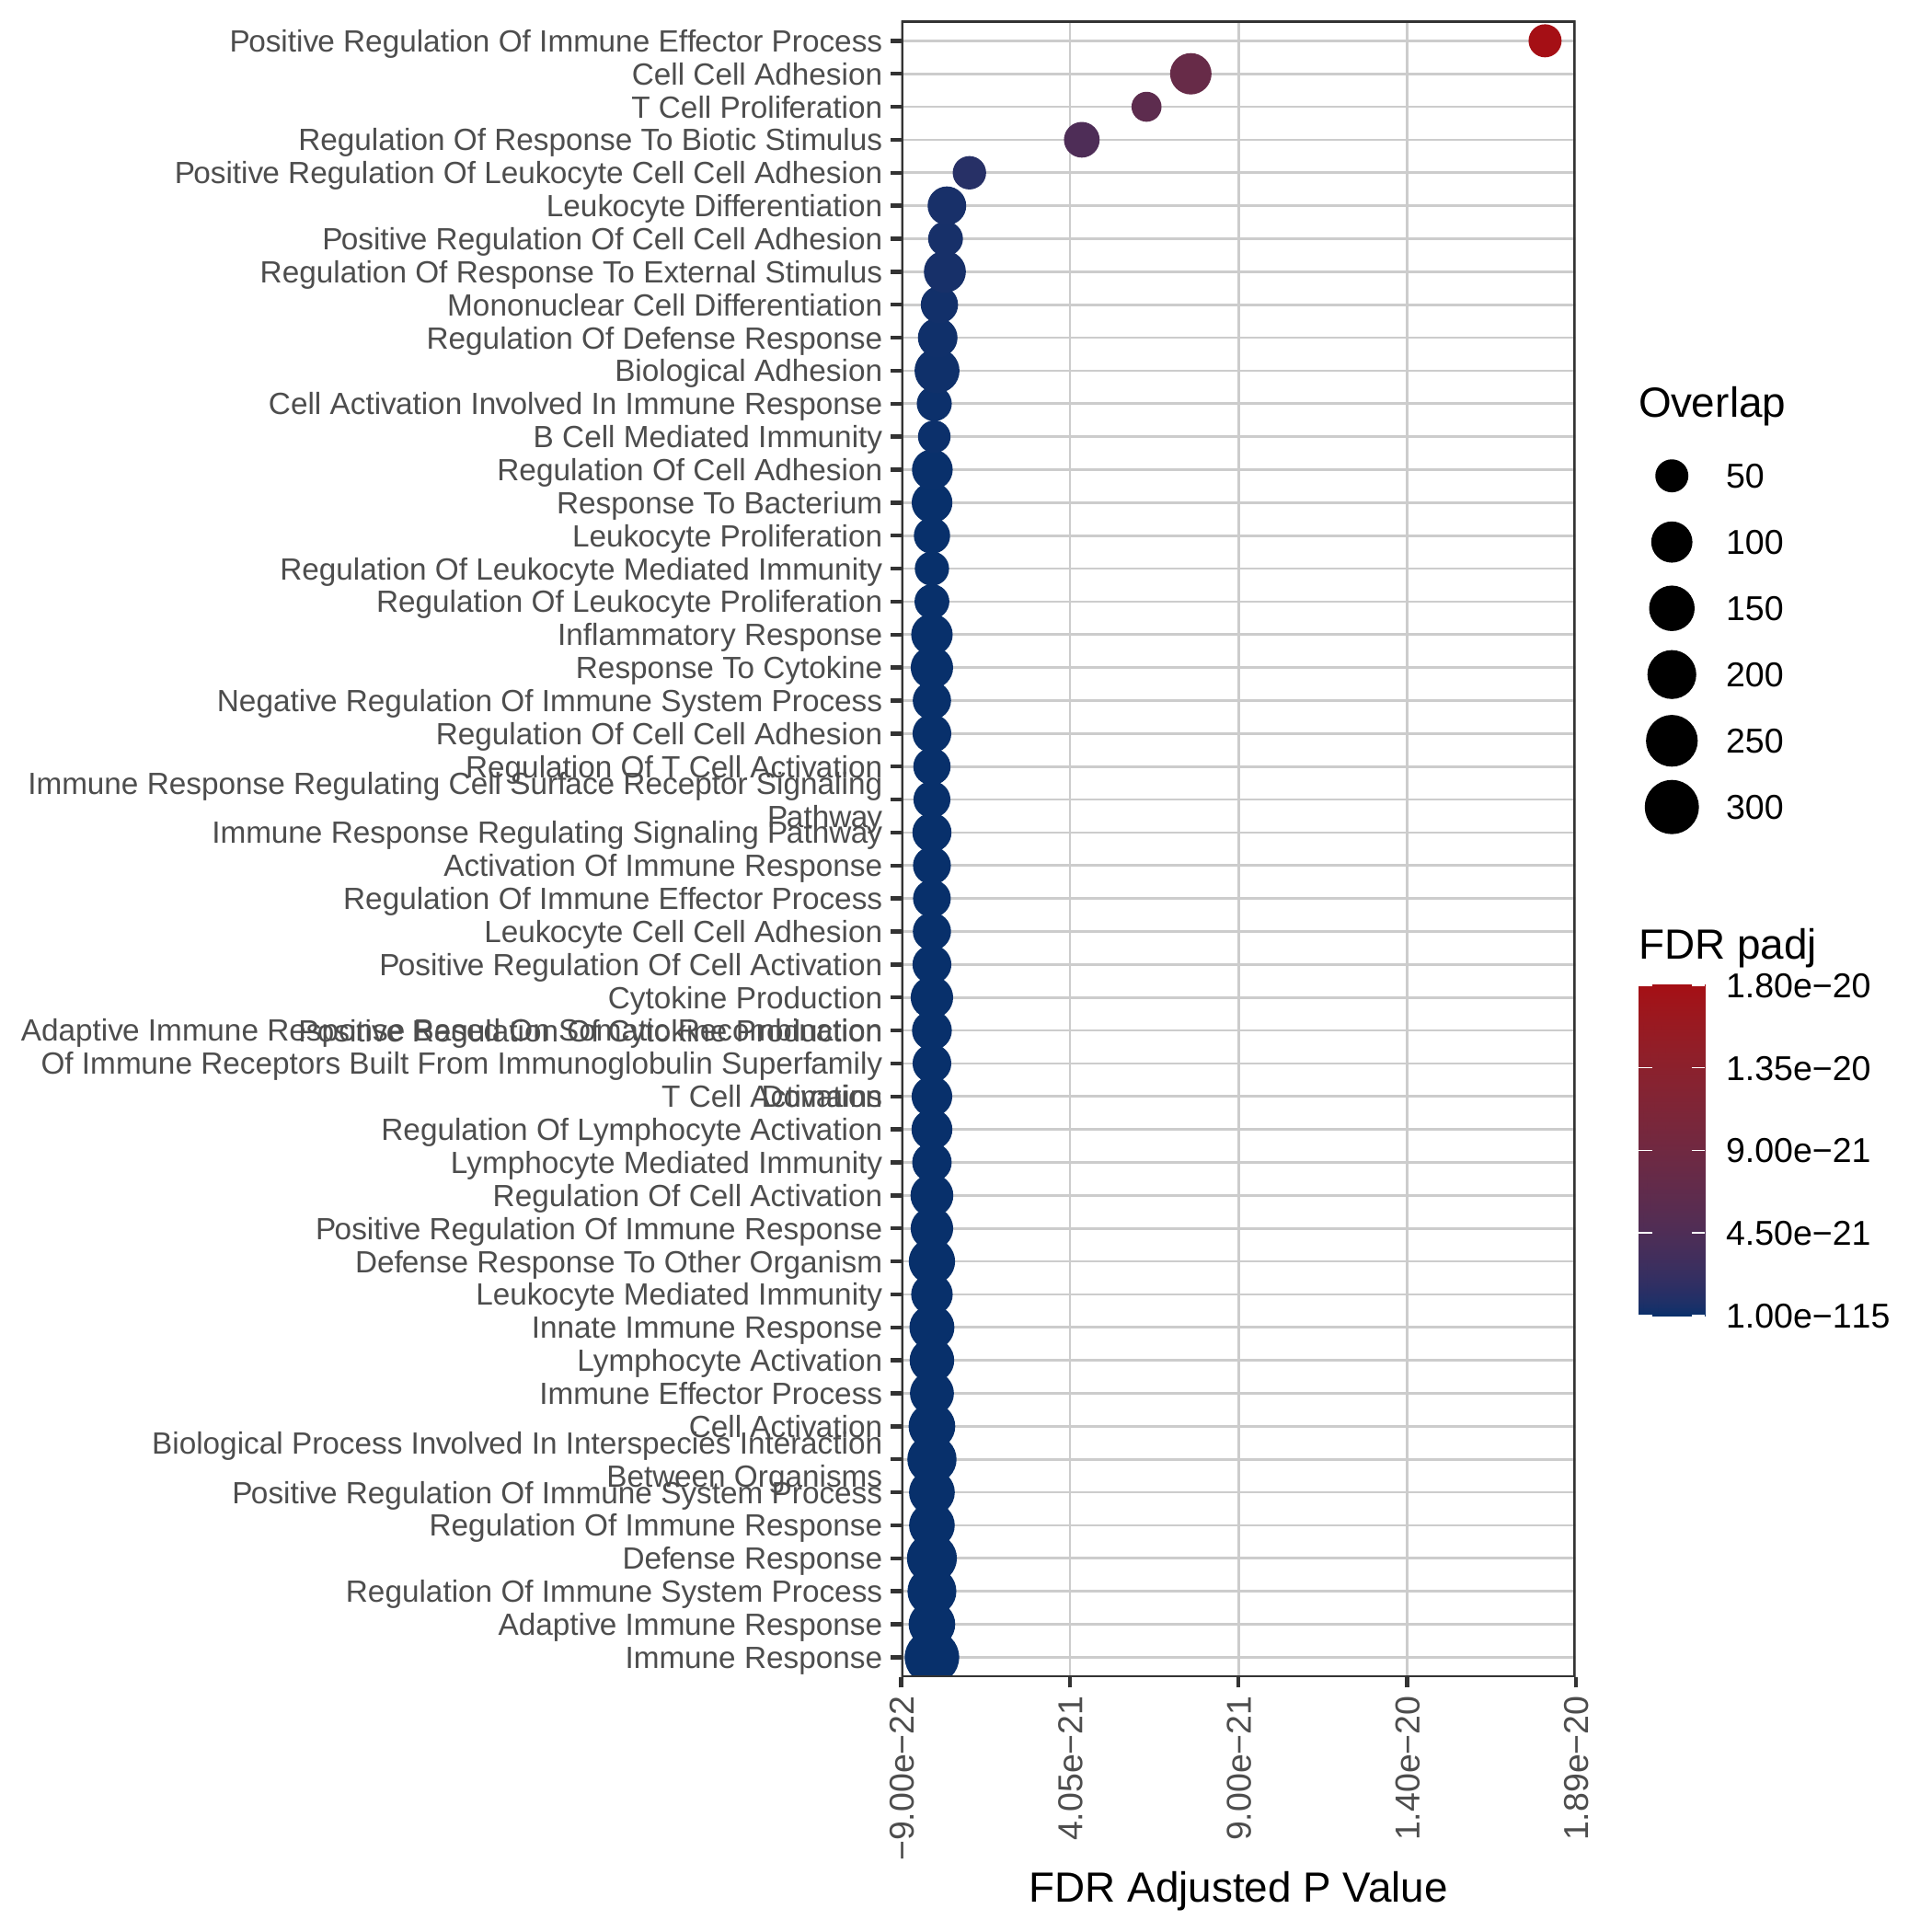 | Up-regulated Hallmark pathways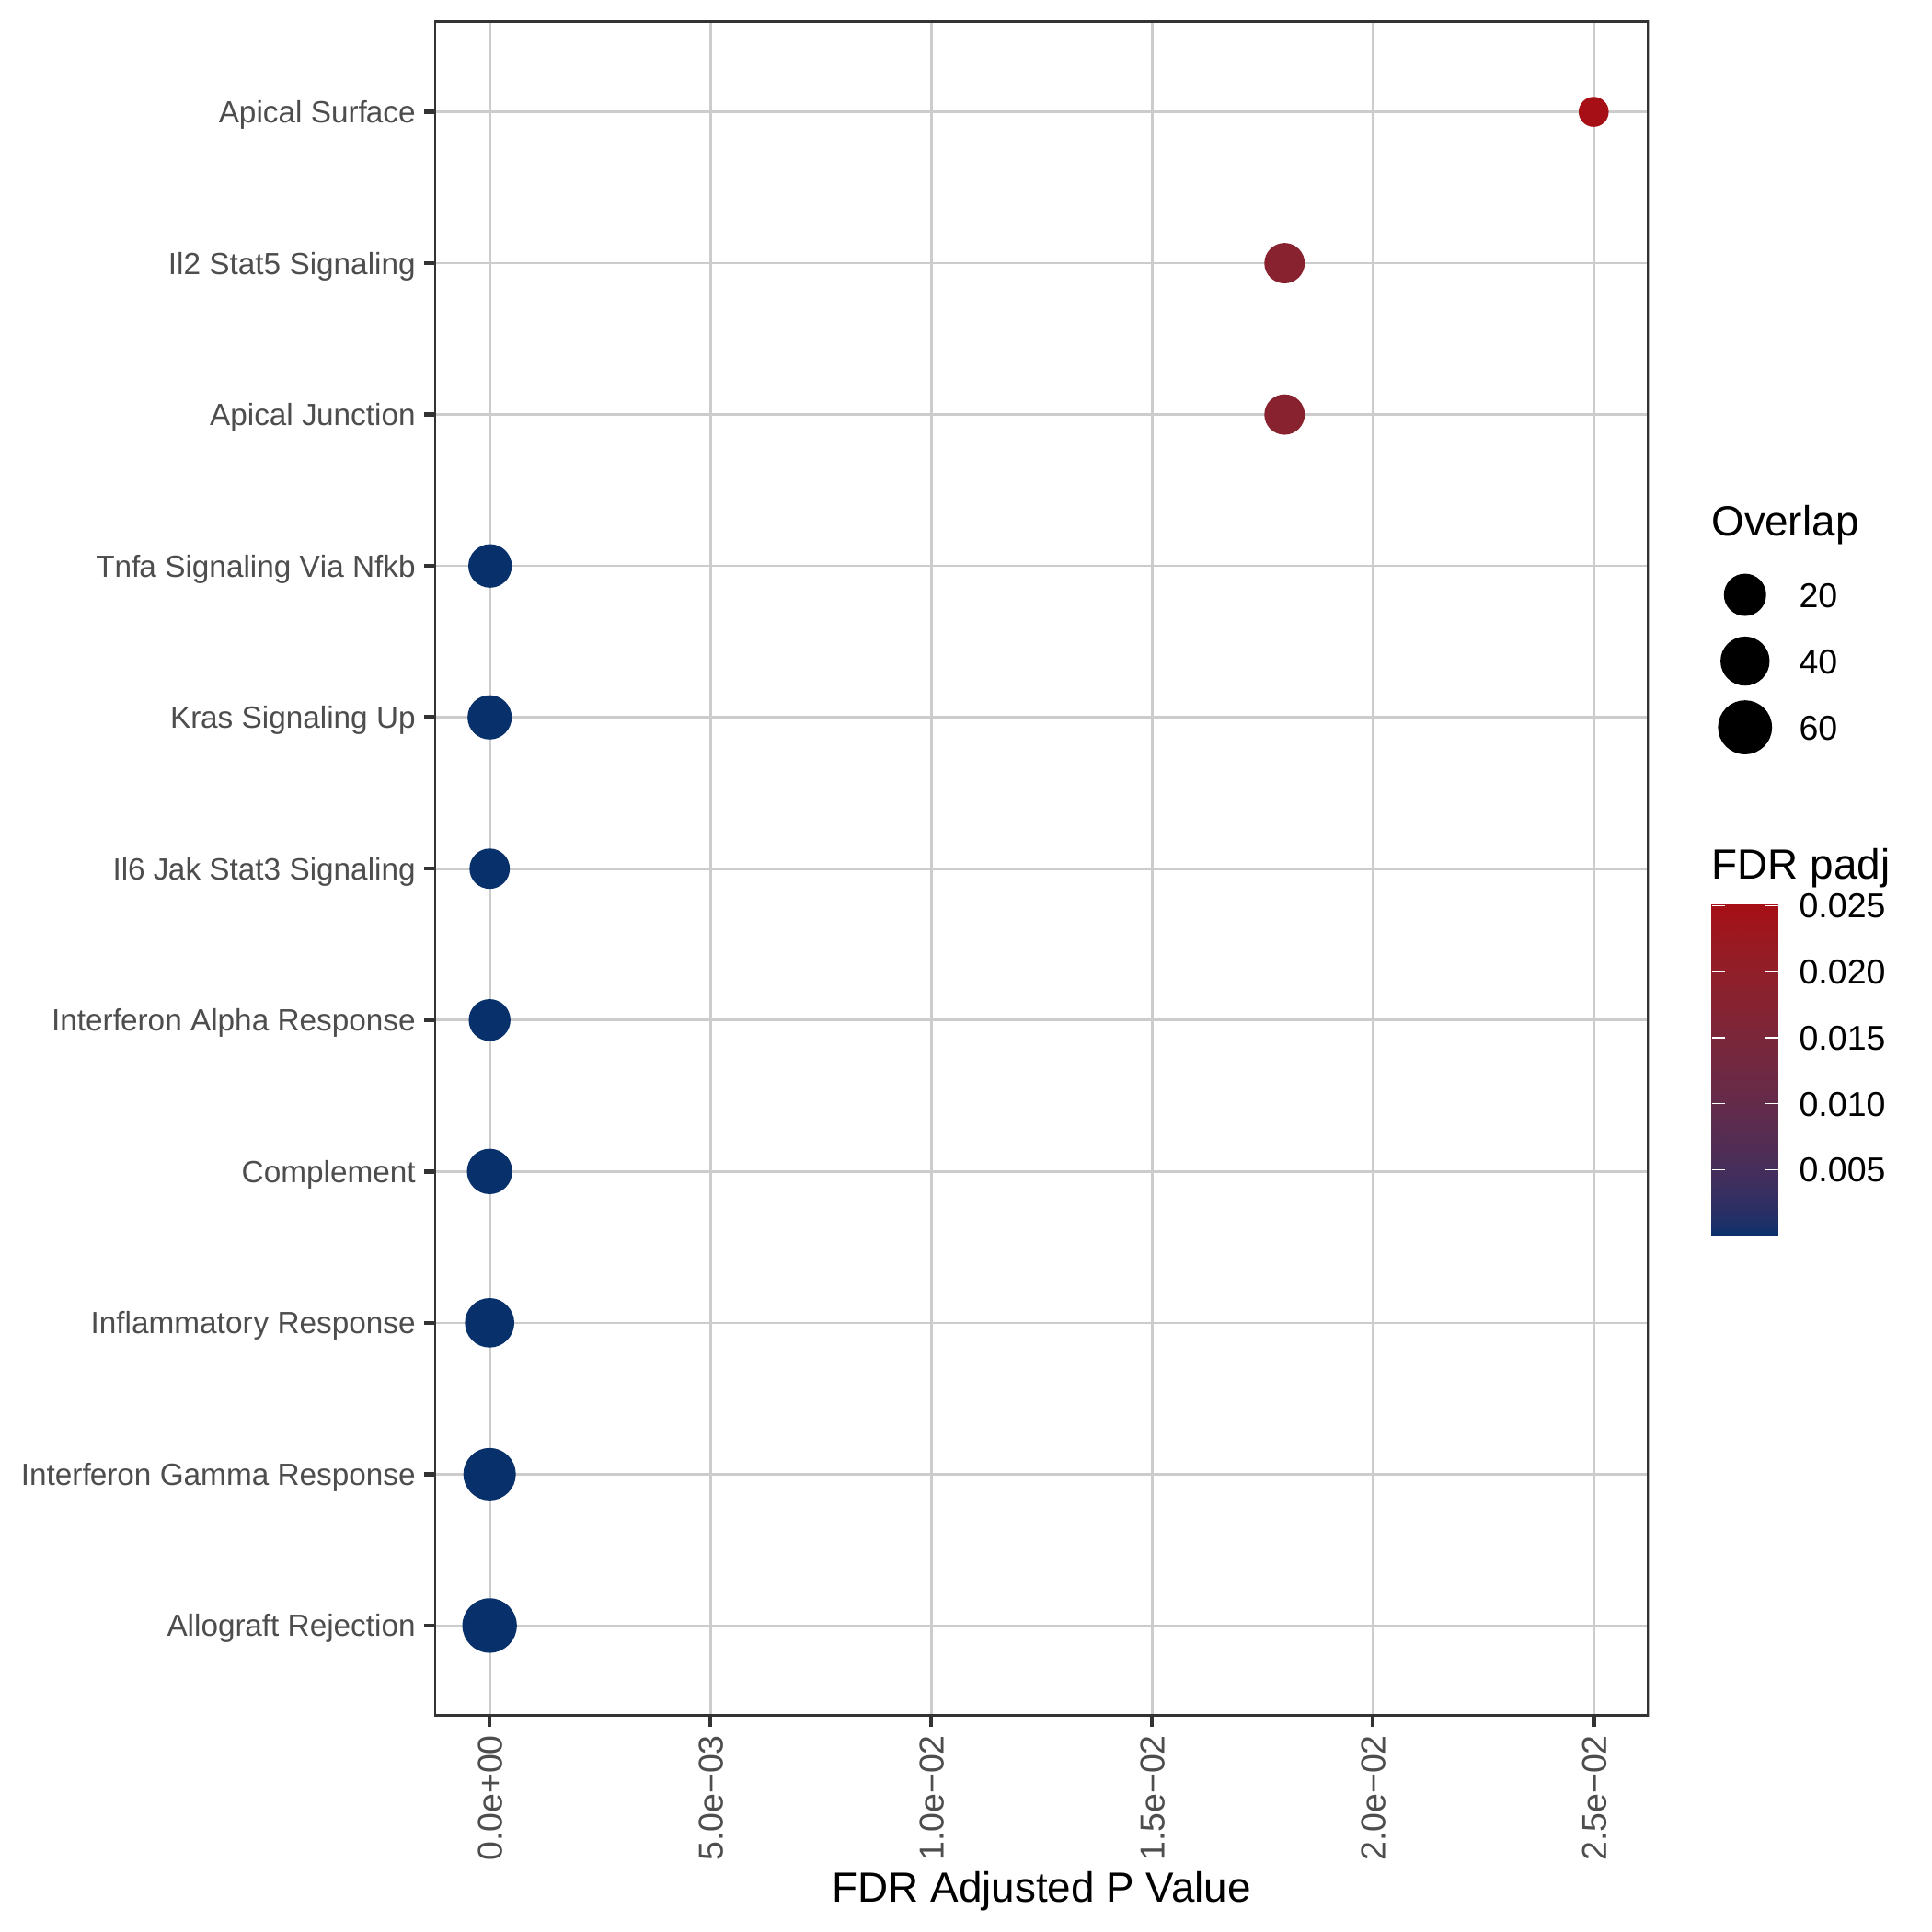 |
Gene expression and mutation differences between non-responders and responders after immunotherapy |
| Expression | Mutation |
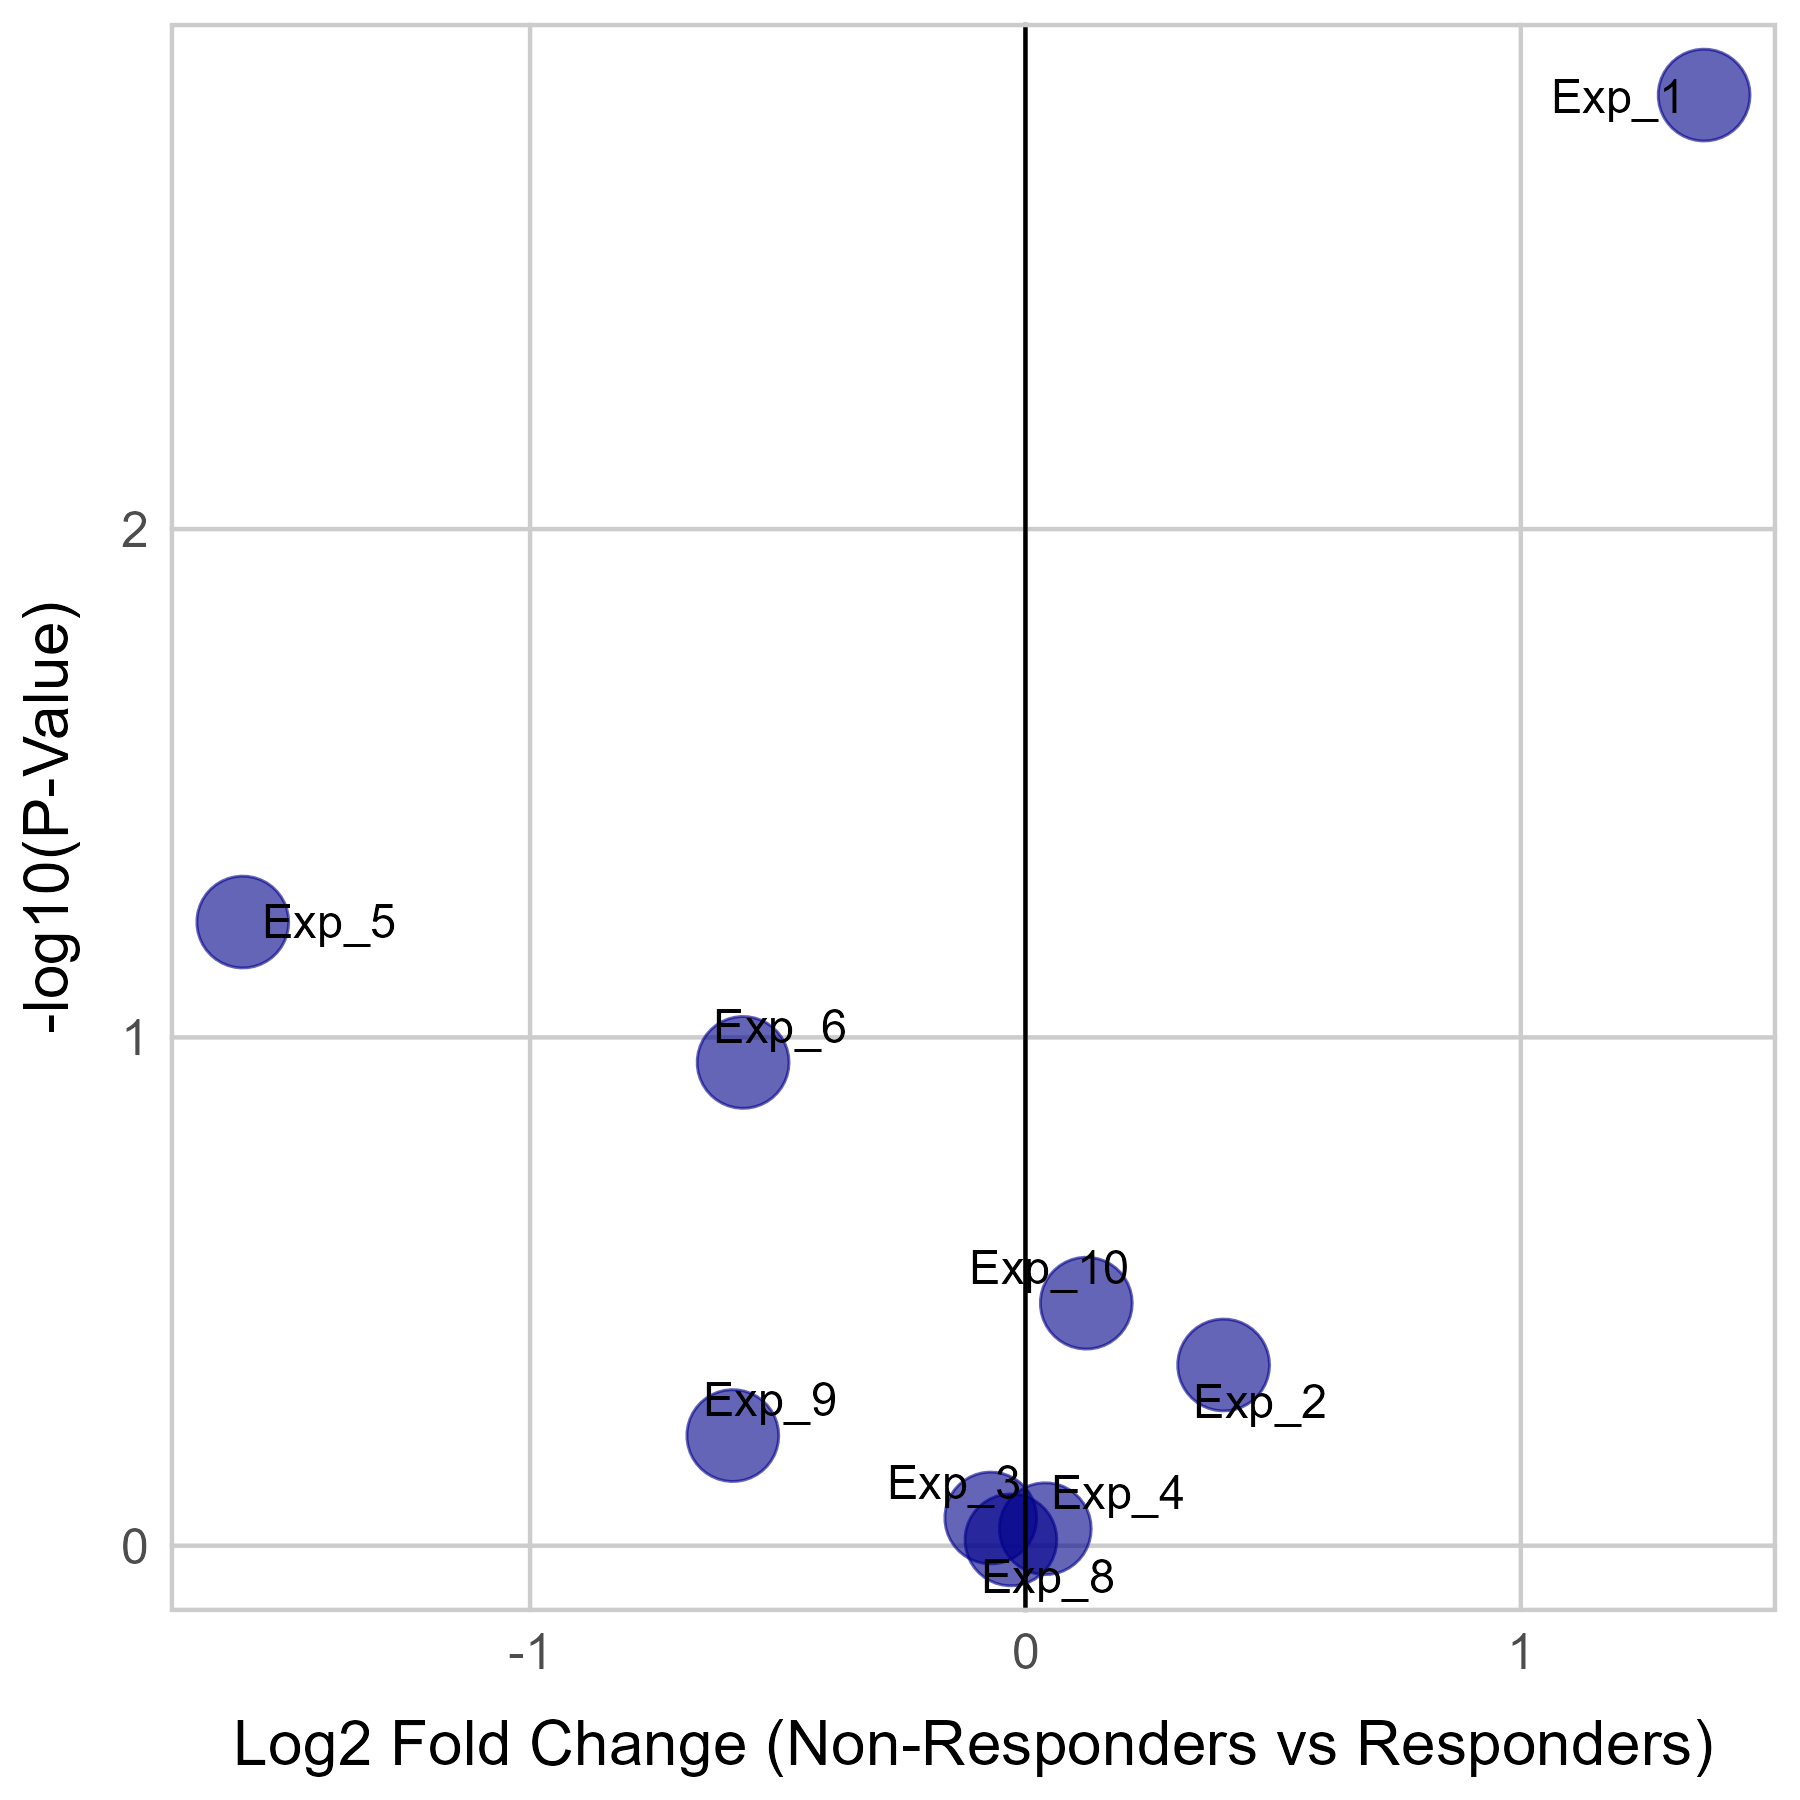 | 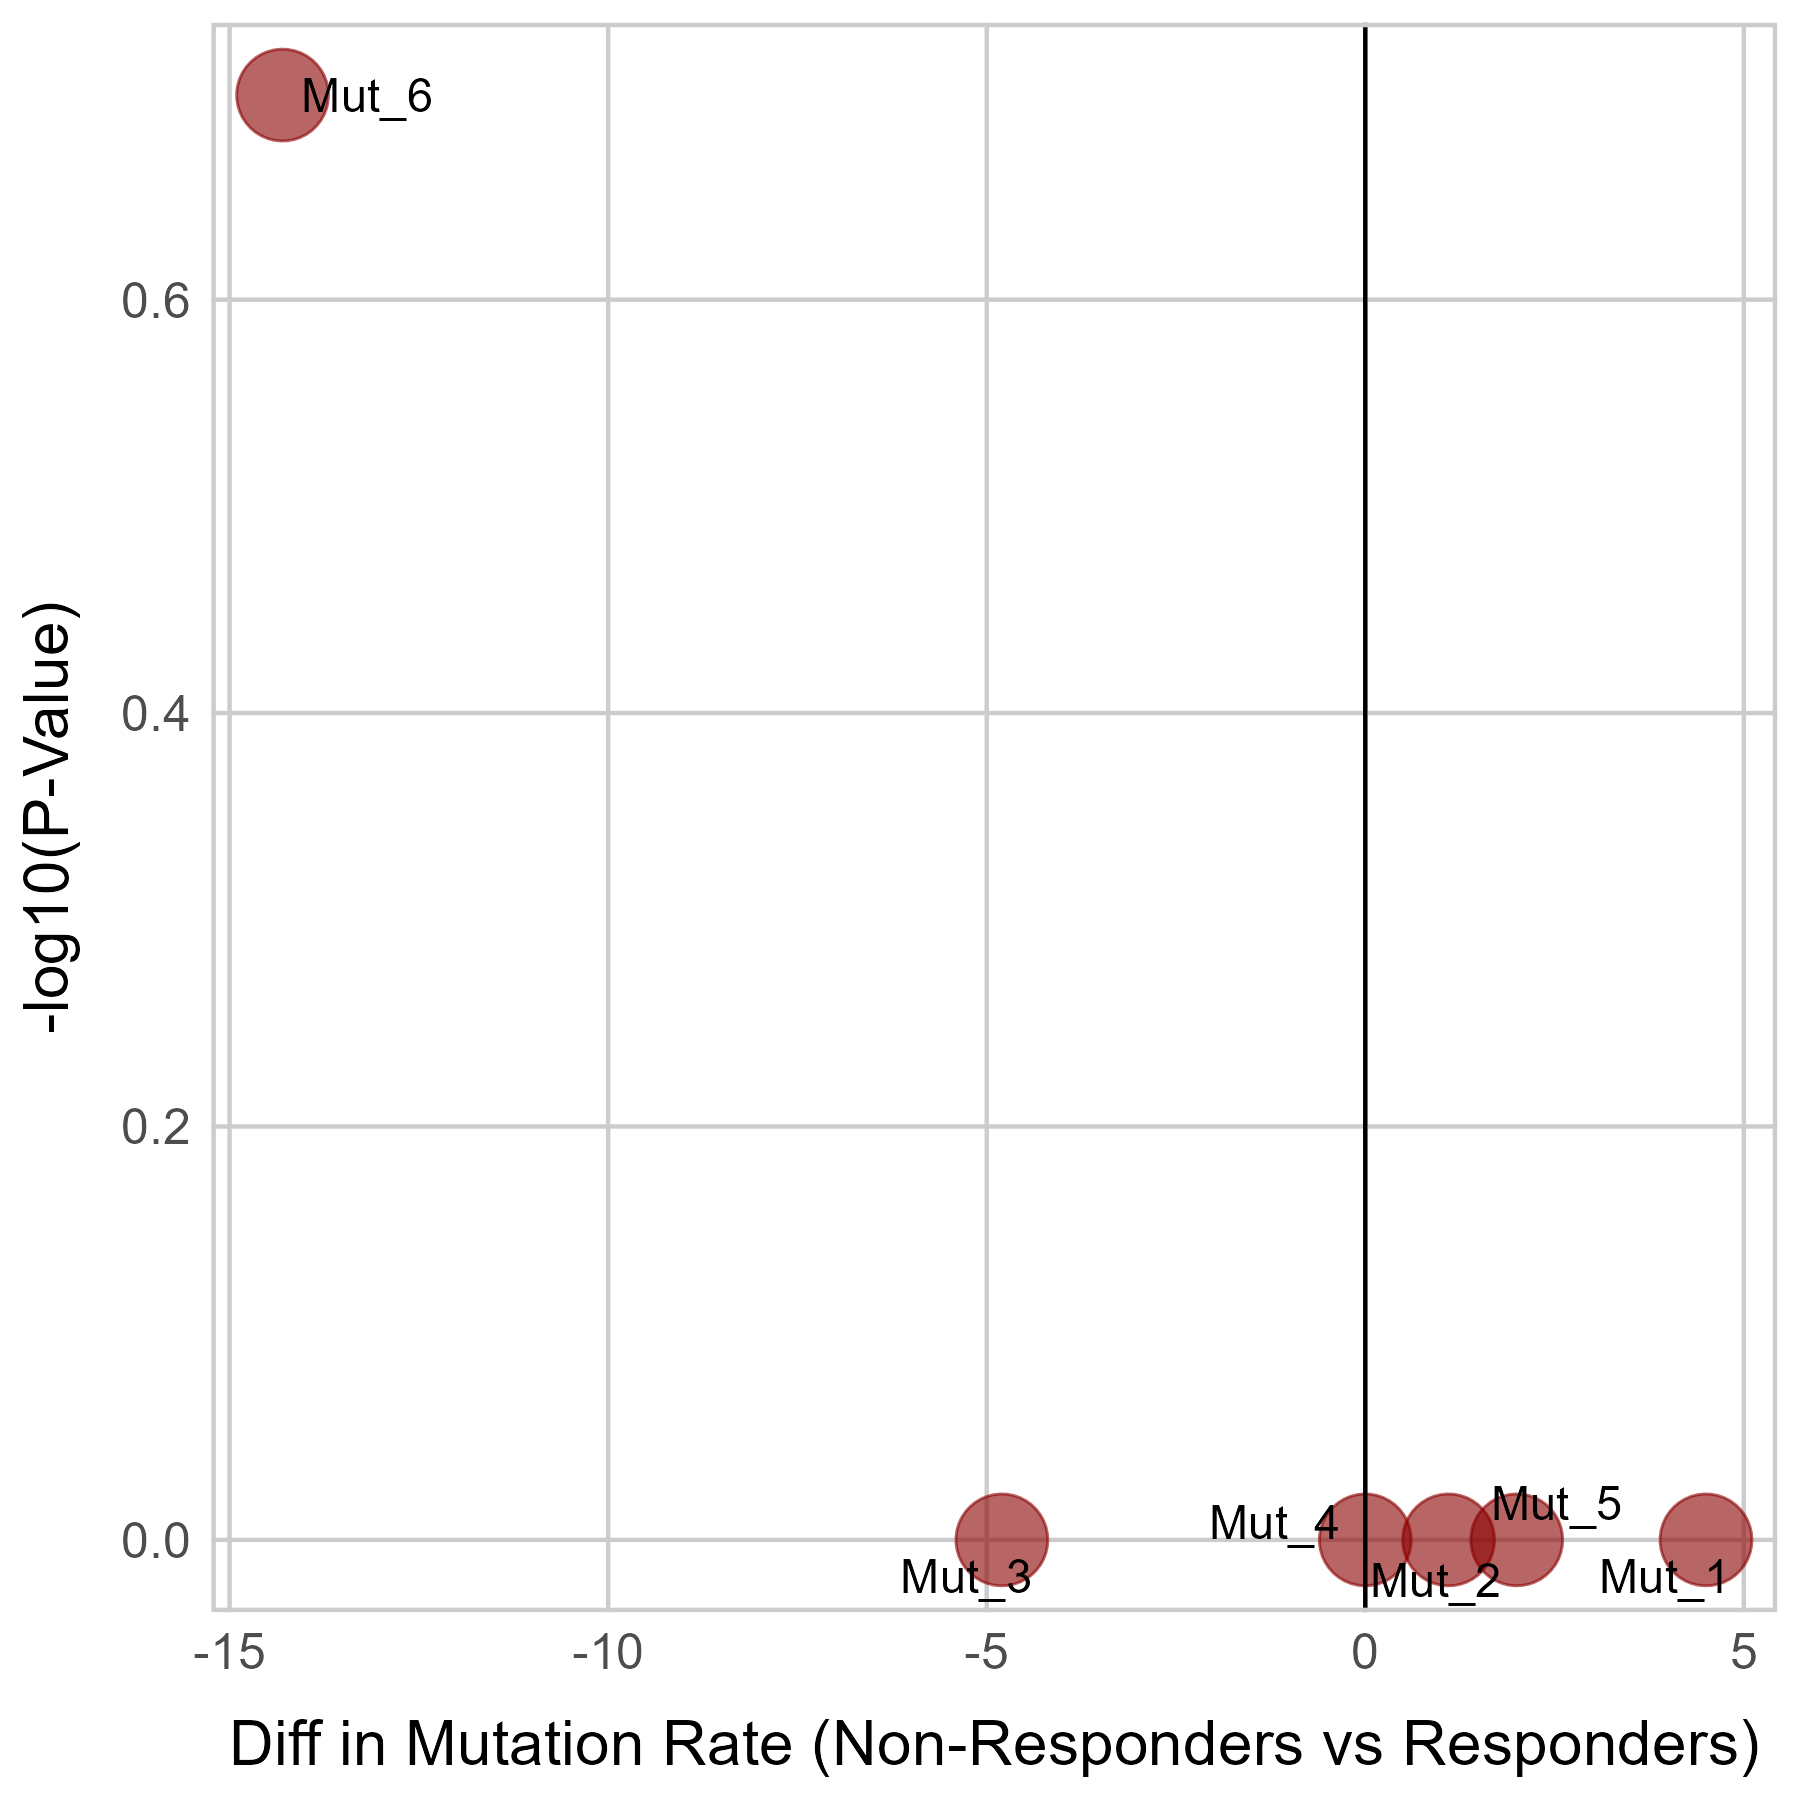 |
No significant differences were found in ANGPT2 mutation.
Top |
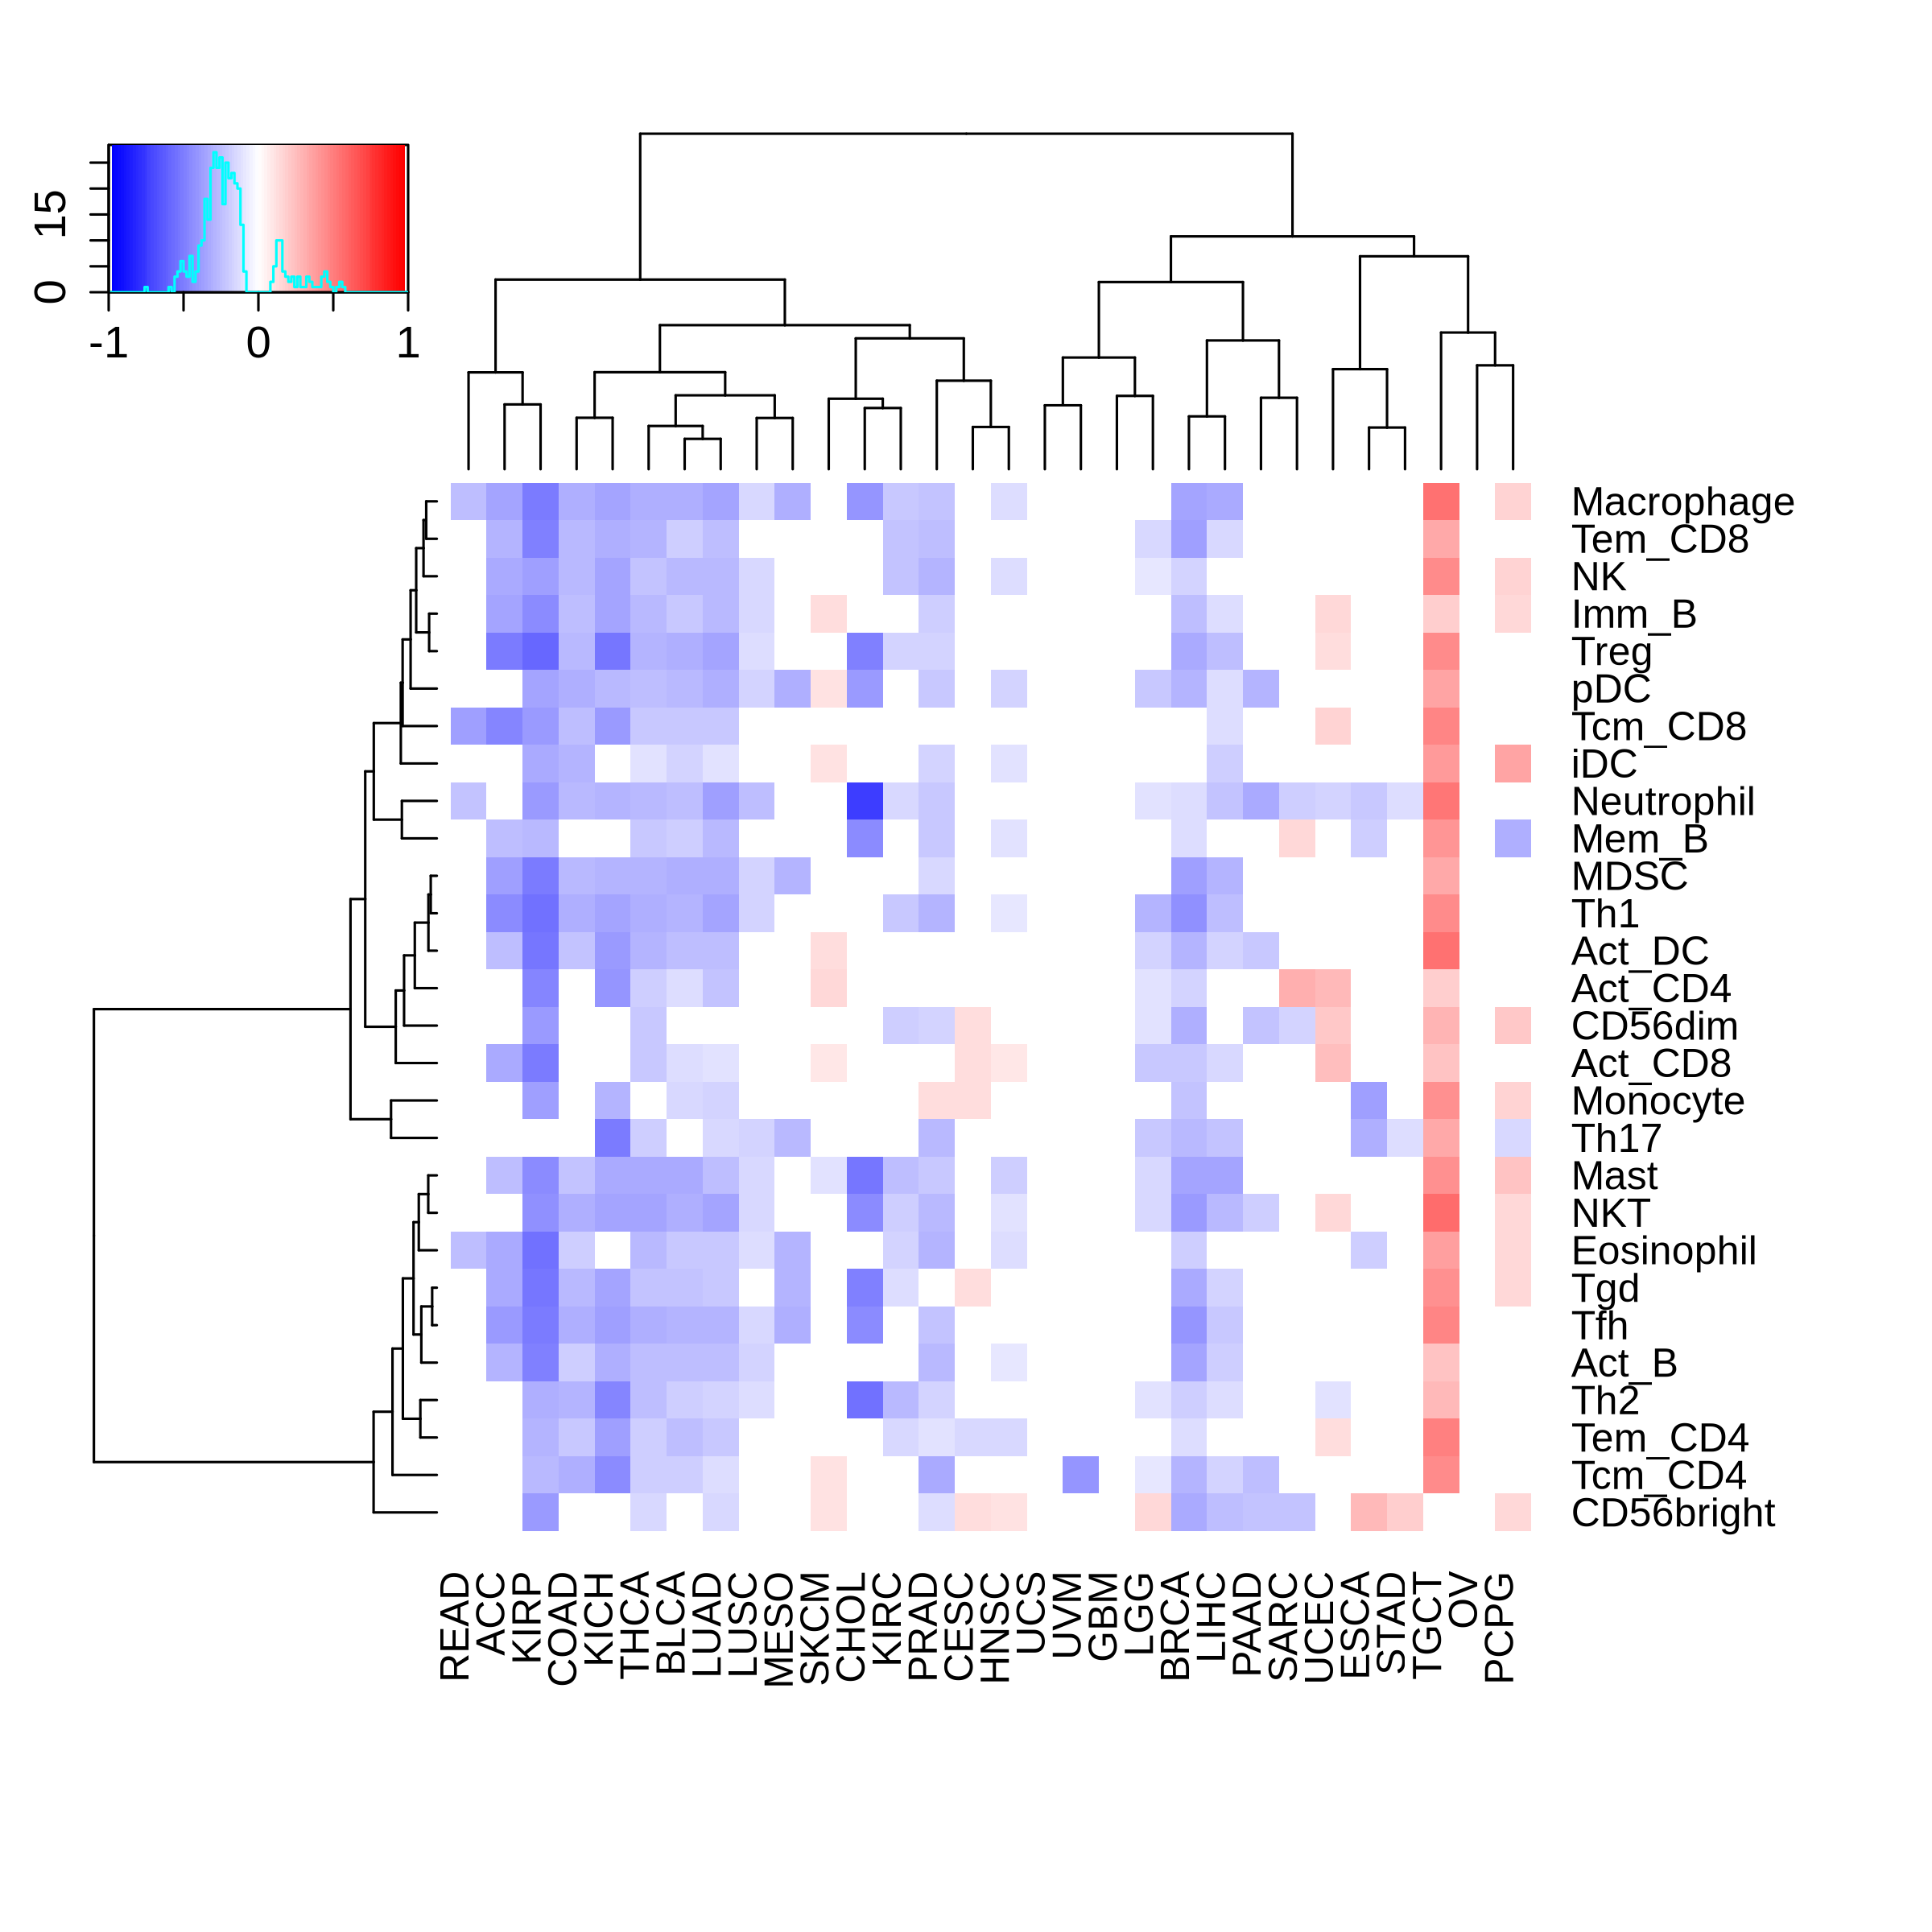
Correlation between the composition of TIL and gene expression, methylation and CNV |
| Expression | Copy number variation |
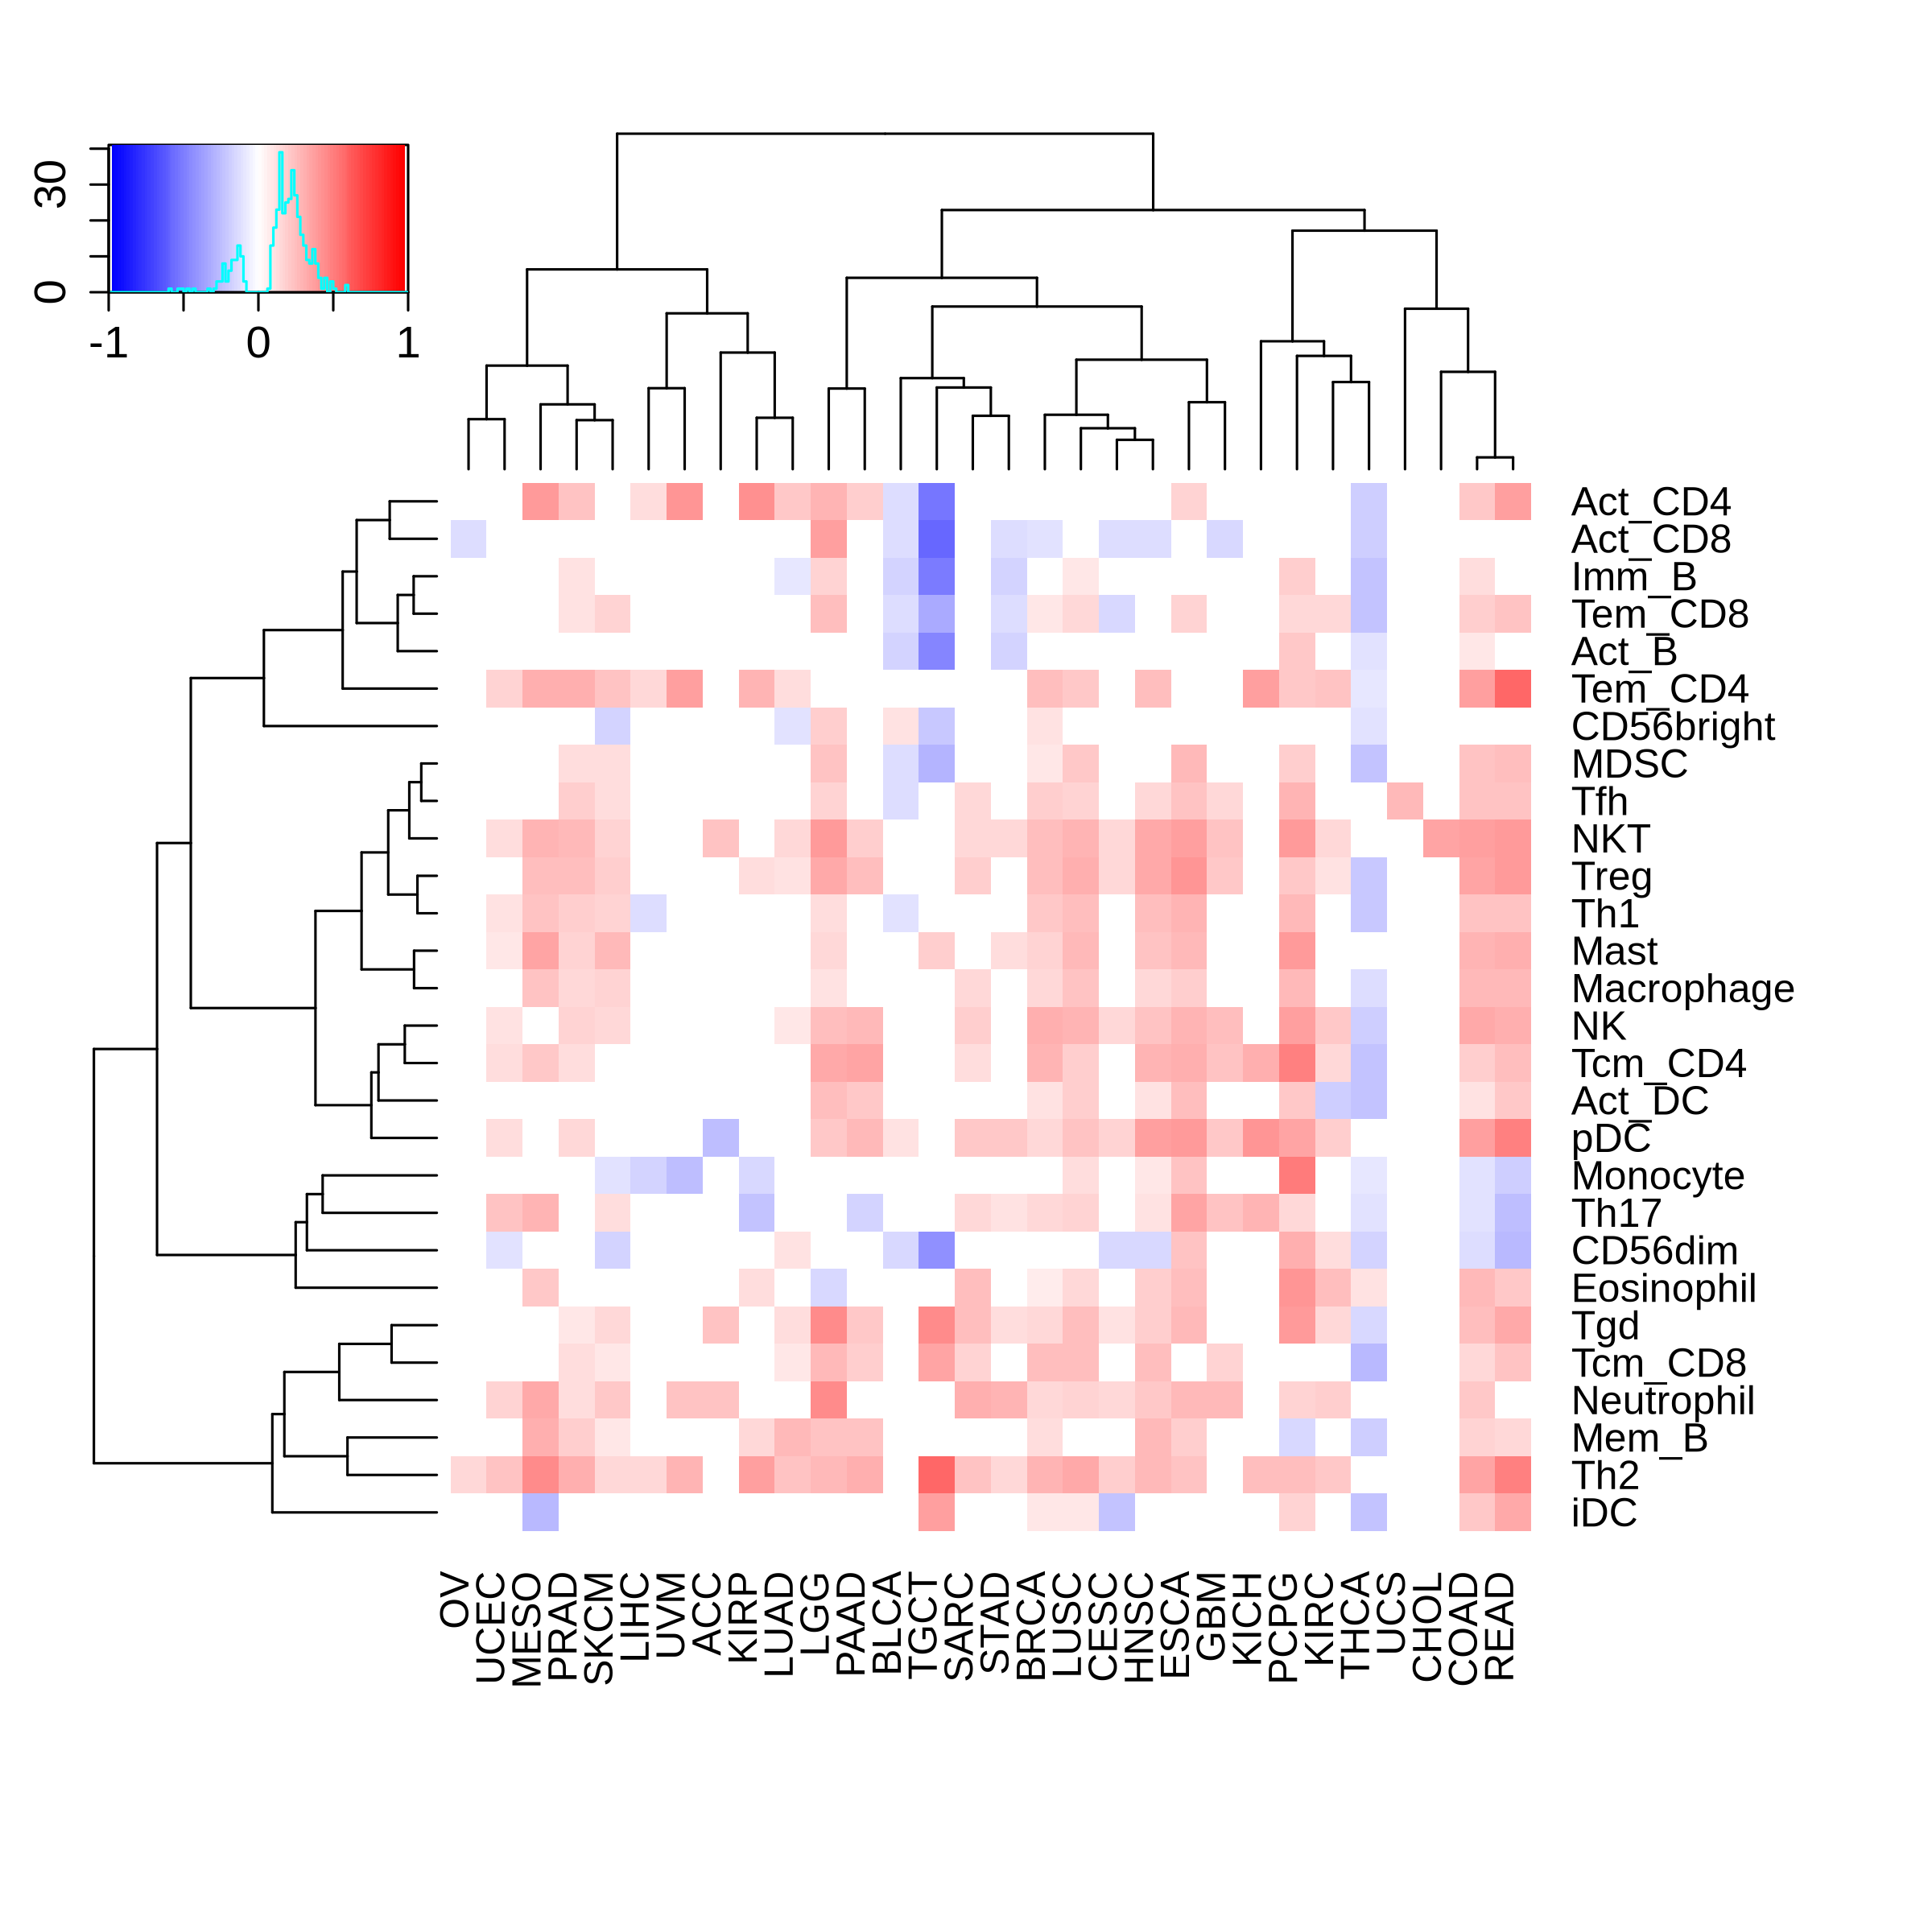 | 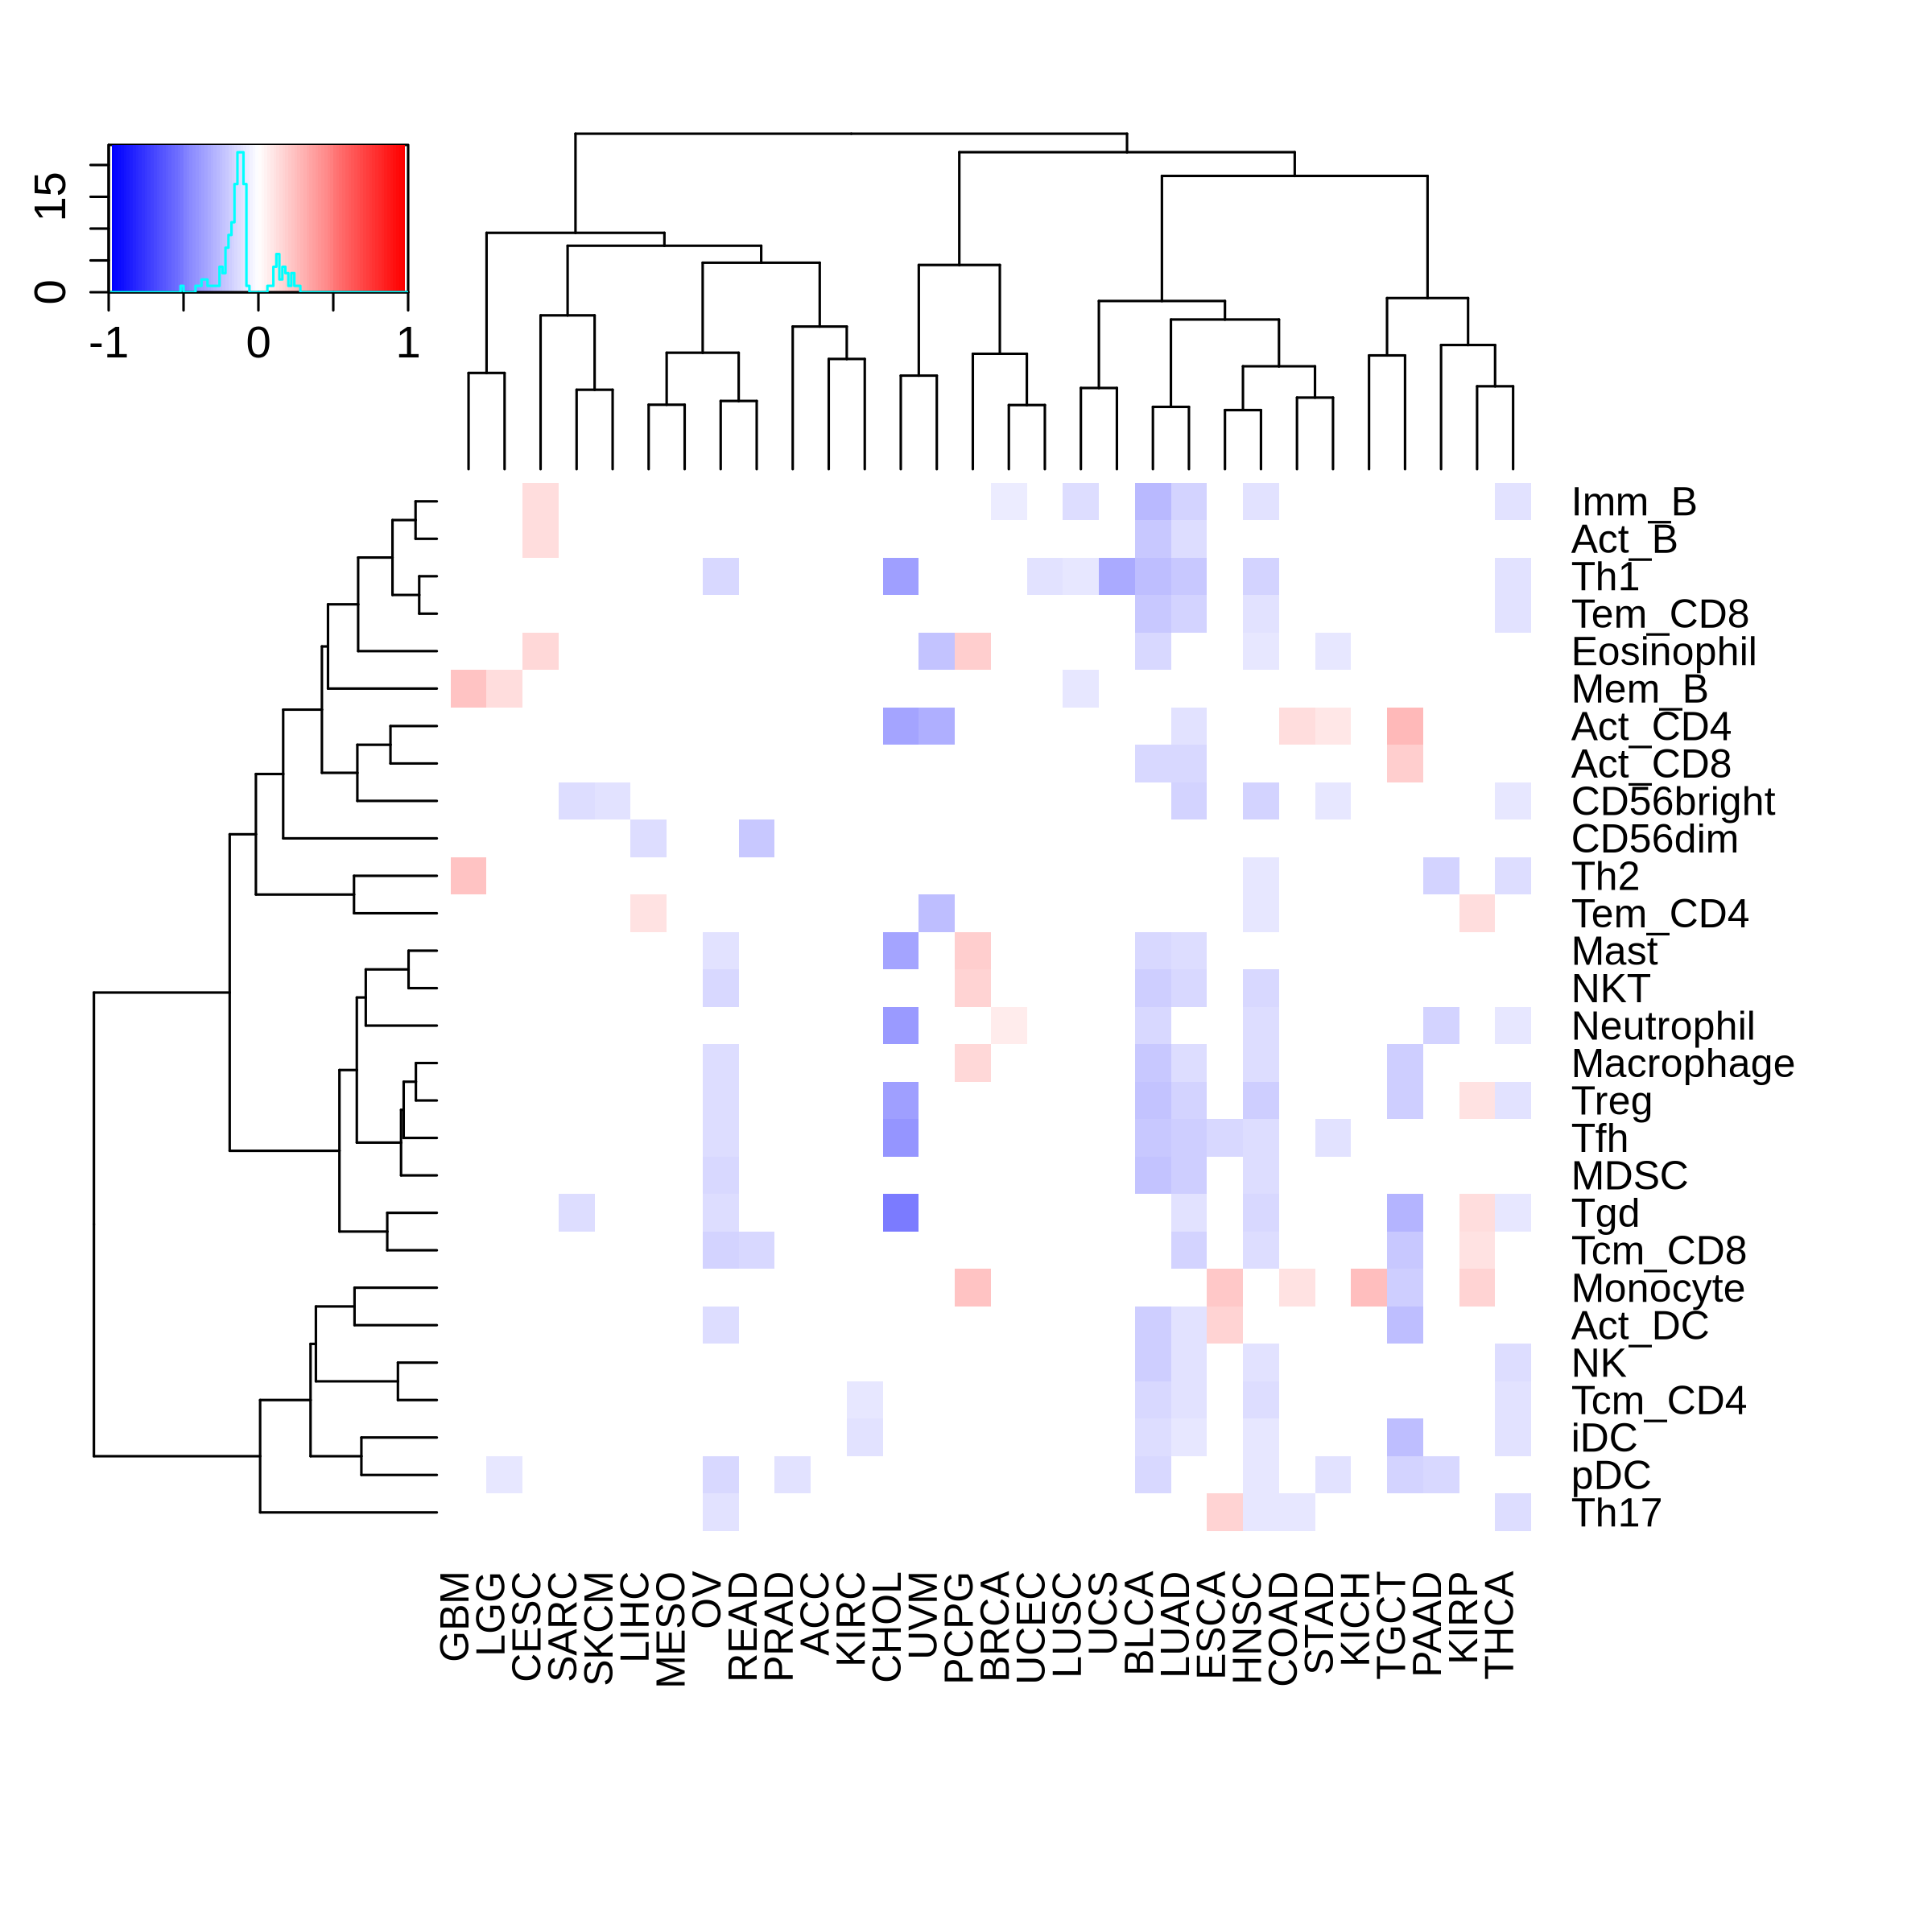 |
| Promoter methylation | Genebody methylation |
 | 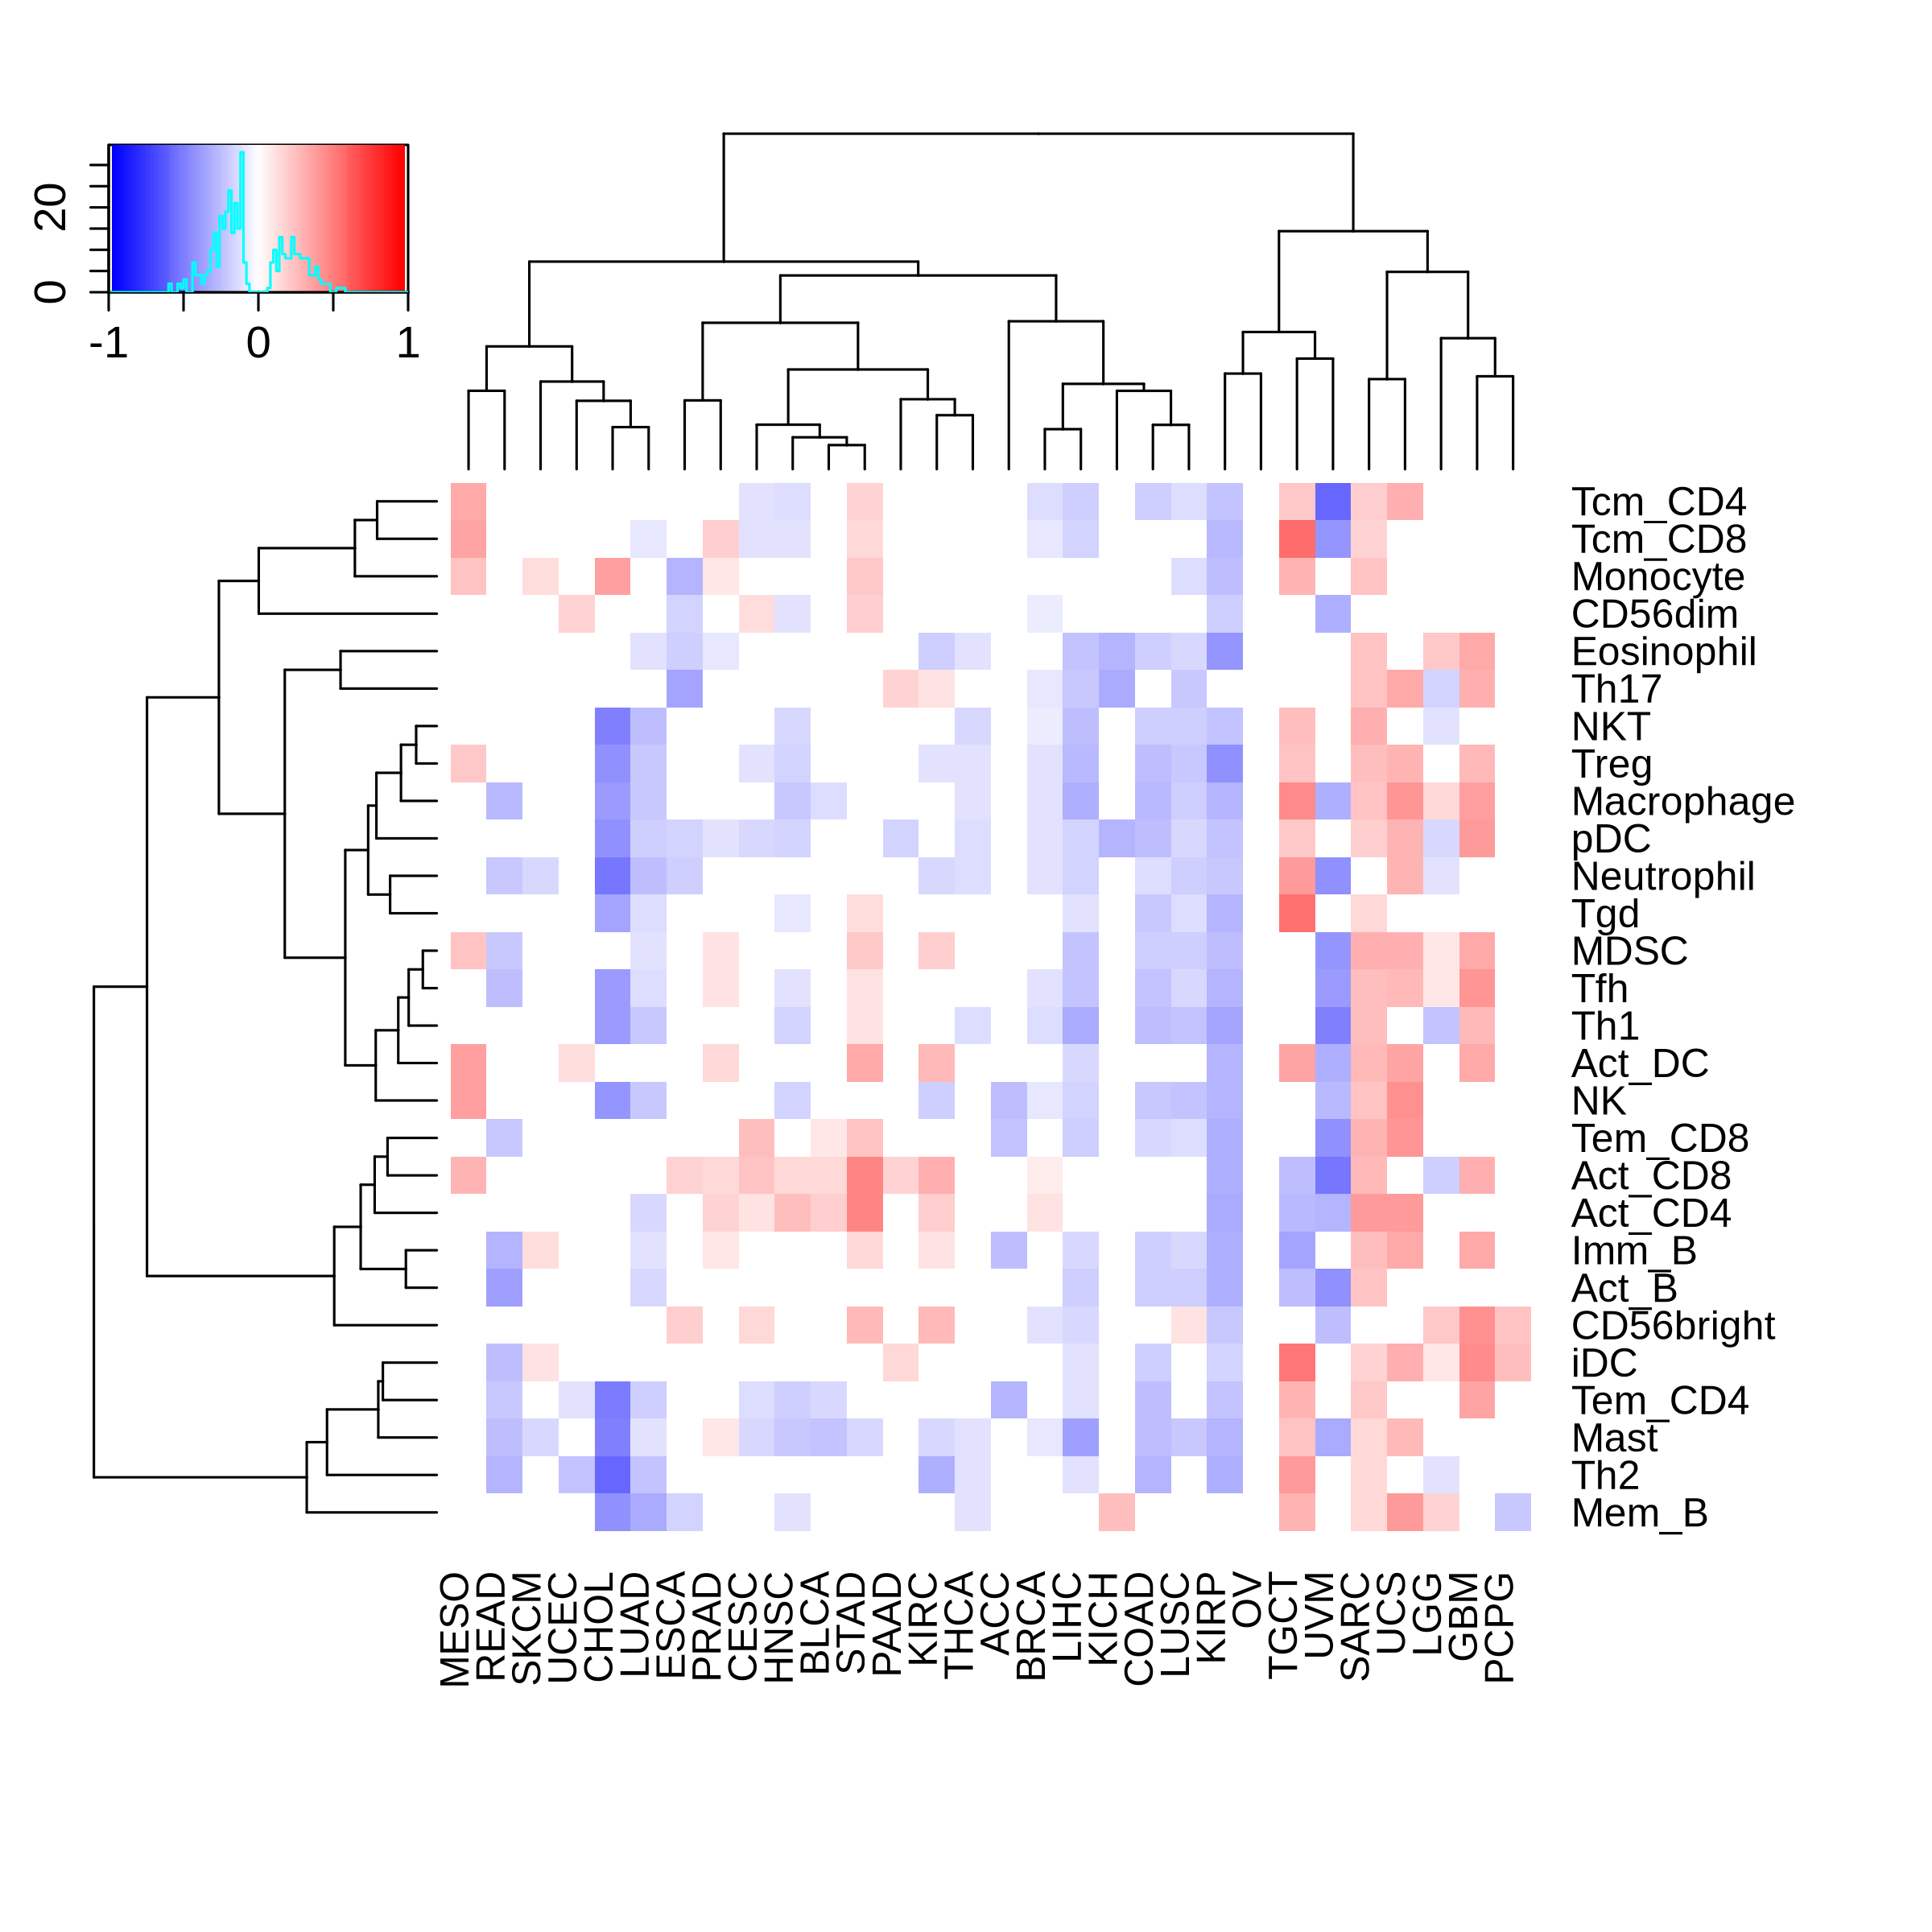 |
Top |
The association between ANGPT2 expression and immune subtypes/status |
Top |
Drugs targeting ANGPT2 and diseases related to ANGPT2. |
| Drug-gene interaction | Disease-gene association |
No drugs targeting ANGPT2. |  |
Top |
Survival analysis based on ANGPT2 expression |
Top |
| Reference |
| [1] Steele CD, Abbasi A, Islam SMA, et al. Signatures of copy number alterations in human cancer. Nature. 2022 Jun;606(7916):984-991. doi: 10.1038/s41586-022-04738-6. Epub 2022 Jun 15. PMID: 35705804; PMCID: PMC9242861. [2] Beibei Ru, Ching Ngar Wong, Yin Tong, et al. TISIDB: an integrated repository portal for tumor–immune system interactions, Bioinformatics, Volume 35, Issue 20, October 2019, Pages 4200–4202, https://doi.org/10.1093/bioinformatics/btz210. [3] Zhongyang Liu, Jiale Liu, Xinyue Liu, et al. CTR–DB, an omnibus for patient-derived gene expression signatures correlated with cancer drug response, Nucleic Acids Research, Volume 50, Issue D1, 7 January 2022, Pages D1184–D1199, https://doi.org/10.1093/nar/gkab860. [4] Charoentong P, Finotello F, Angelova M, et al. Pan-cancer Immunogenomic Analyses Reveal Genotype-Immunophenotype Relationships and Predictors of Response to Checkpoint Blockade. Cell Rep. 2017 Jan 3;18(1):248–262. doi: 10.1016/j.celrep.2016.12.019. PMID: 28052254. [5] Thorsson V, Gibbs DL, Brown SD, et al. The Immune Landscape of Cancer. Immunity. 2018 Apr 17;48(4):812-830.e14. doi: 10.1016/j.immuni.2018.03.023. Epub 2018 Apr 5. Erratum in: Immunity. 2019 Aug 20;51(2):411-412. doi: 10.1016/j.immuni.2019.08.004. PMID: 29628290; PMCID: PMC5982584. [6] Zapata L, Caravagna G, Williams MJ, et al. Immune selection determines tumor antigenicity and influences response to checkpoint inhibitors. Nat Genet. 2023 Mar;55(3):451-460. doi: 10.1038/s41588-023-01313-1. Epub 2023 Mar 9. PMID: 36894710; PMCID: PMC10011129. [7] Cortes-Ciriano I, Lee S, Park WY, et al. A molecular portrait of microsatellite instability across multiple cancers. Nat Commun. 2017 Jun 6;8:15180. doi: 10.1038/ncomms15180. PMID: 28585546; PMCID: PMC5467167. [8] Cannon M, Stevenson J, Stahl K, et al. DGIdb 5.0: rebuilding the drug-gene interaction database for precision medicine and drug discovery platforms. Nucleic Acids Res. 2024 Jan 5;52(D1):D1227-D1235. doi: 10.1093/nar/gkad1040. PMID: 37953380; PMCID: PMC10767982. [9] Grissa D, Junge A, Oprea TI, Jensen LJ. Diseases 2.0: a weekly updated database of disease-gene associations from text mining and data integration. Database (Oxford). 2022 Mar 28;2022:baac019. doi: 10.1093/database/baac019. PMID: 35348648; PMCID: PMC9216524. |

Copyright 2024-Present -The University of Texas Health Science Center at Houston |